
Abstract
Exact age determination of deep venous thrombosis (DVT) is important for an appropriate treatment. The purpose of this present study is to assess the age of acute DVT with the area of venous thrombi in elasticity imaging during the thrombosis procession. The thrombus area is obtained from a specially designed program. It was applied to clot specimens induced in human great saphenous (n = 15) at selected time points following the initiation of thrombosis. The relative mean proportion of blood clots was 50.01% ± 12.44% at day 1; 69.94% ± 8.19% at day 3; 81.93% ± 6.15% at day 6; and 92.37% ± 4.06% at day 9. The results indicated that the thrombus area increased significantly over time, while the normalized strain values inside the thrombus changed only a little. The pathological analyses also showed the same results. Therefore, we conclude that the area of venous thrombi in elasticity imaging may be a novel function for acute DVT staging.
Introduction
Deep venous thrombosis (DVT) and its associated complication, namely pulmonary embolism (PE), are major medical problems. Approximately 600 000 patients develop PEs, leading up to 60 000 deaths in the United States. 1 Hence, it is imperative to treat DVT once it has been diagnosed. Because mature thrombus is highly stable and much less likely to embolize to the lungs, the appropriate treatment for DVT depends on the maturity of the thrombus. The standard maturity criterion is that a thrombus age with older thrombi is being considered more mature. Since the thrombus age is closely related to thrombi hardening, 2,3 ultrasound elasticity imaging (elastography) has the potential of age determination of the DVT. 4,5 It has been reported that ultrasound elasticity imaging could accurately distinguish acute from chronic DVT. 6,7
However, recent investigations reported that it is insufficient to only distinguish acute from chronic DVT. The development of acute DVT can also be subdivided into 3 phases. 8 From day 1 to days 3 to 5 (the first phase), the blood clot is still loose. Patients are treated with heparin followed by oral anticoagulants. From days 3 to 5 to day 14 (the second phase), the thrombus becomes more solid and closely attached to the vessel wall. From day 14 (the third phase), the thrombus is fully organized and there is no more risk of PE. Patients are treated with oral anticoagulation alone because they do not need the stronger anticoagulant and anti-inflammatory effects of heparin. 9 To our limited knowledge, the research about ultrasound elasticity imaging determining the age of acute DVT are very few. Siebers et al 10 reported that it is difficult to exactly determine the age of acute DVT using elasticity imaging exclusively. The normalized strain values from thrombosed vessel segments led to variations in their “in vitro” investigation.
We guess one of the reasons why the elastography has difficulty in determining the exact age of acute DVT is that the calculation methods of the normalized strain value are simple and limited. Generally, the normalized strain value, which is always considered as a function of thrombus age, can be obtained by 2 methods. Generally, the normalized strain value can be obtained by 2 methods. One is calculated from the center line of strain images. The other is averaged from the region of interest (ROI) in strain images. Both the methods inevitably include meaningless parts such as circumferential vessel walls or surrounding tissue.
In the present work, we developed a program used in elastography, which is called area measurement of equal hardness region (AMEHR). This program was designed on the basis of digital imaging processing to calculate the area of equal hardness tissue such as thrombus in strain images. Therefore, the purpose of the present study is to assess the age of acute DVT with the area of venous thrombi in elasticity imaging during the process of thrombosis.
Materials and Methods
Imaging Methods
Elasticity imaging
The elasticity imaging used in the present study is a semiquantitative method to measure the stiffness of biological tissue based on the SIEMENS eSie Touch technology in ROI. All DVT specimens were tested by one of the authors (L.W.). Generally, different stiffness levels in ROI were represented with different colors in elasticity imaging. The red color represents small deformation with a high stiffness level, whereas the purple color represents large deformation with low stiffness. Regions between the high and low stiffness tissues were represented with a color spectrum from yellow, green to blue. 11
The AMEHR Program
The quantitative AMEHR program was developed in our laboratory. It is designed on the basis of color edge detection and region segmentation in red, green, and blue (RGB) vector space. In order to measure regions with different stiffness levels, it is necessary to calculate the gradient in RGB vector space. The stiffness of different tissues was displayed as different colors in elastography. The blood clot distribution in the vessel lumen was displayed with a red color. The calculation of clot area, edge contour, and clot segmentation were dependent on the edge detection of a given color.
In color gradient analyses for RGB images, Di Zenzo has established a method for gradient-based edge detection.
12
The gradient image F
θ (x,y), which is the vector function extension of gradient, was the key of color edge detection.
13
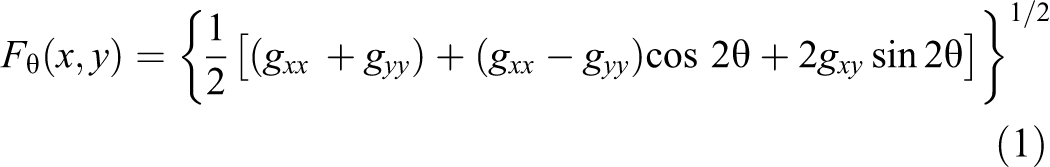
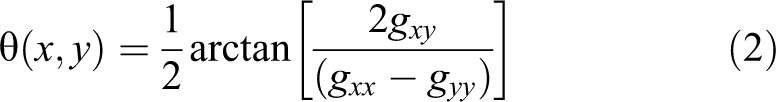
where θ(x,y) provides the direction of the maximum rate of change in RGB image, and gxx
, gyy
, and gxy
represent the dot product of vectors

where vector
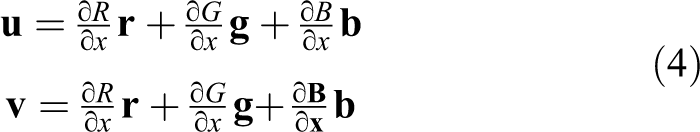
where vectors
For quantitative analyses, it was necessary to measure the thrombus area and its percentage in the vessel lumen. The AMEHR program allowed us to identify regions with equal stiffness (see Figure 1). It provided quantitative data by calculating the pixel spacing and proportion in a segmented thrombus strain image. Then the data of blood clot region inside the lumen of venous specimens were collected and computed on days 1, 3, 6, and 9.
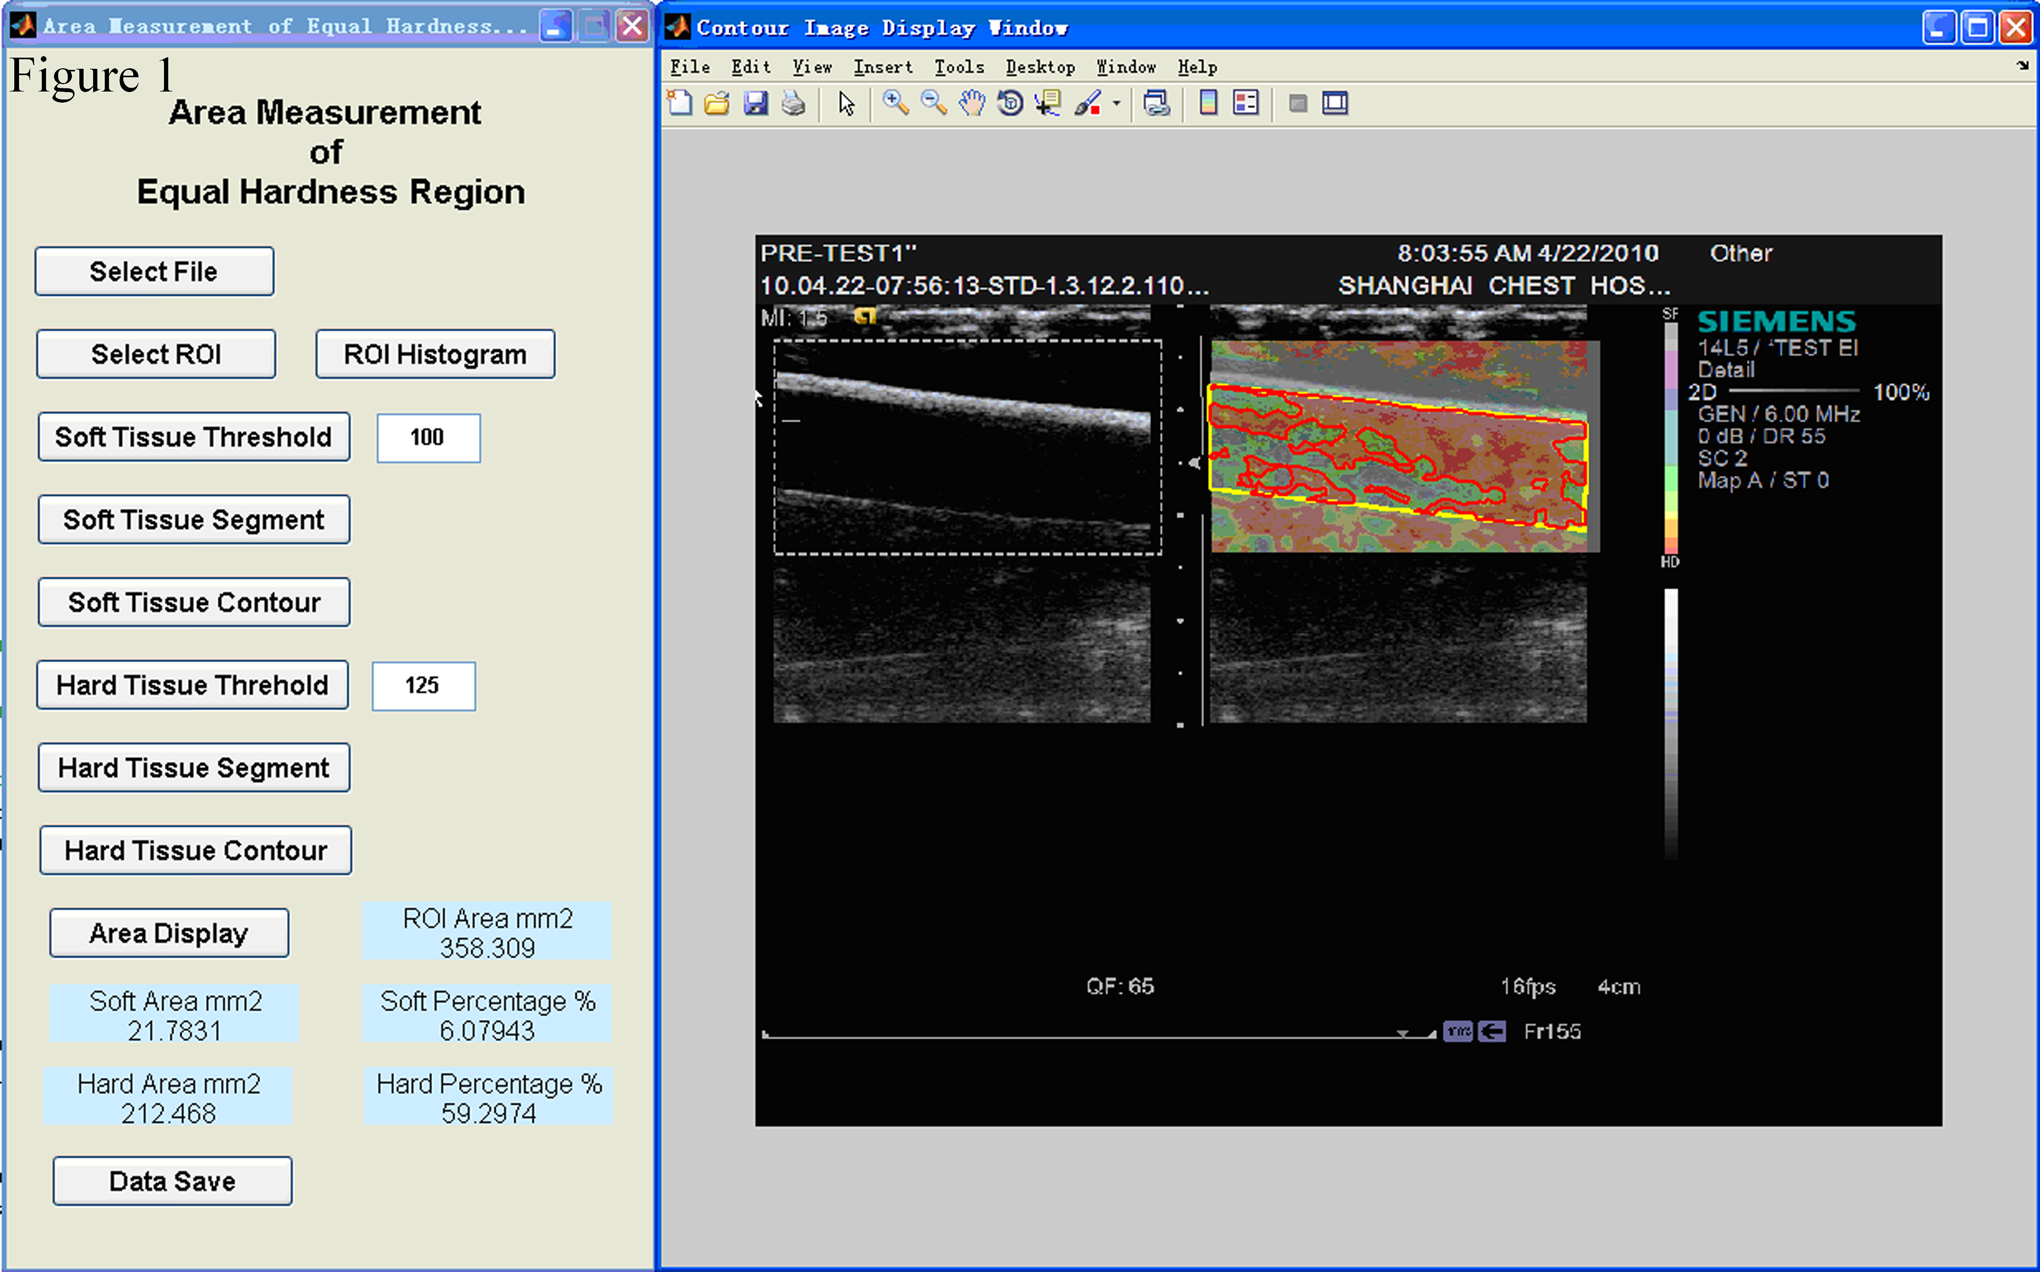
The operation panel of area measurement of hardness region (AMEHR) program. This program could contour the blood vessel in strain image with yellow line and the blood thrombus with red line. It could provide an explicit percentage of thrombus in the lumen.
Thrombosis Experiment in Great Saphenous Vein
Fifteen vein specimens were removed and collected from patients with phlebeurysma. Before the experiment, written consents were obtained from all the patients. This study was performed with approval from the ethical committee of Shanghai East Hospital. Venous specimens of about 40 mm in length were removed immediately postsurgery. A healthy human blood sample about 30 mL was injected into the lumen of each venous specimen. They were then quickly ligated at both ends of the vessel and placed into a sterile case (17 cm × 12 cm × 4 cm). The venous specimens were stored at 4°C for 1 day, 3 days, 6 days, or 9 days after surgery.
A SIEMENS ACUSON S2000 ultrasound system (Siemens, Erlangen, Bayern, Germany) equipped with a 4C1 probe (Frequency: 4.5 MHz) capable of eSie Touch elasticity imaging was used for ultrasonography. B-mode and static elastography were performed in segments of the tested vessels containing thrombi at days 1, 3, 6, and 9 after the formation of blood clot. Strain images were captured on the longitudinal plane of blood vessel. The quality factor (QF), which can assure the accuracy and repeatability of elastography, was kept at 80. Experimental tests were performed on the longitudinal plane with the aid of the AMEHR program.
Pathological Analysis
The thrombosed vessel was fixed in 10% formaldehyde in phosphate-buffered saline, embedded with optimum cutting compound, and cut into cryosections. Thrombus formation was observed on day 1 with progressive enlargement from days 1 to 9 by optical microscopy so as to provide the evidence of the results of AMEHR program.
Statistical Analysis
Experimental data were analyzed using the statistical software SPSS 17.0 for Windows (SPSS Inc, Chicago, Illinois). A statistical comparison of all percentage data were performed by 1-way analysis of variance (ANOVA). Statistical significance was considered at P < .05.
Results
The AMEHR program in ultrasonic elastography was successfully used to display venous strain images and different color regions. Fifteen pieces of great saphenous veins were analyzed in this study. Initially, blood clots were small and loosely adherent to the vessel wall at days 1 to 3.They became larger and more adherent to the wall by day 6. At day 9, the clot became more solid in association with contracted venous specimens at day 9. Therefore, this model reproduced the clinical stages of acute DVT. The corresponding strain images and pathological analyses were presented in Figures 2 to 4.
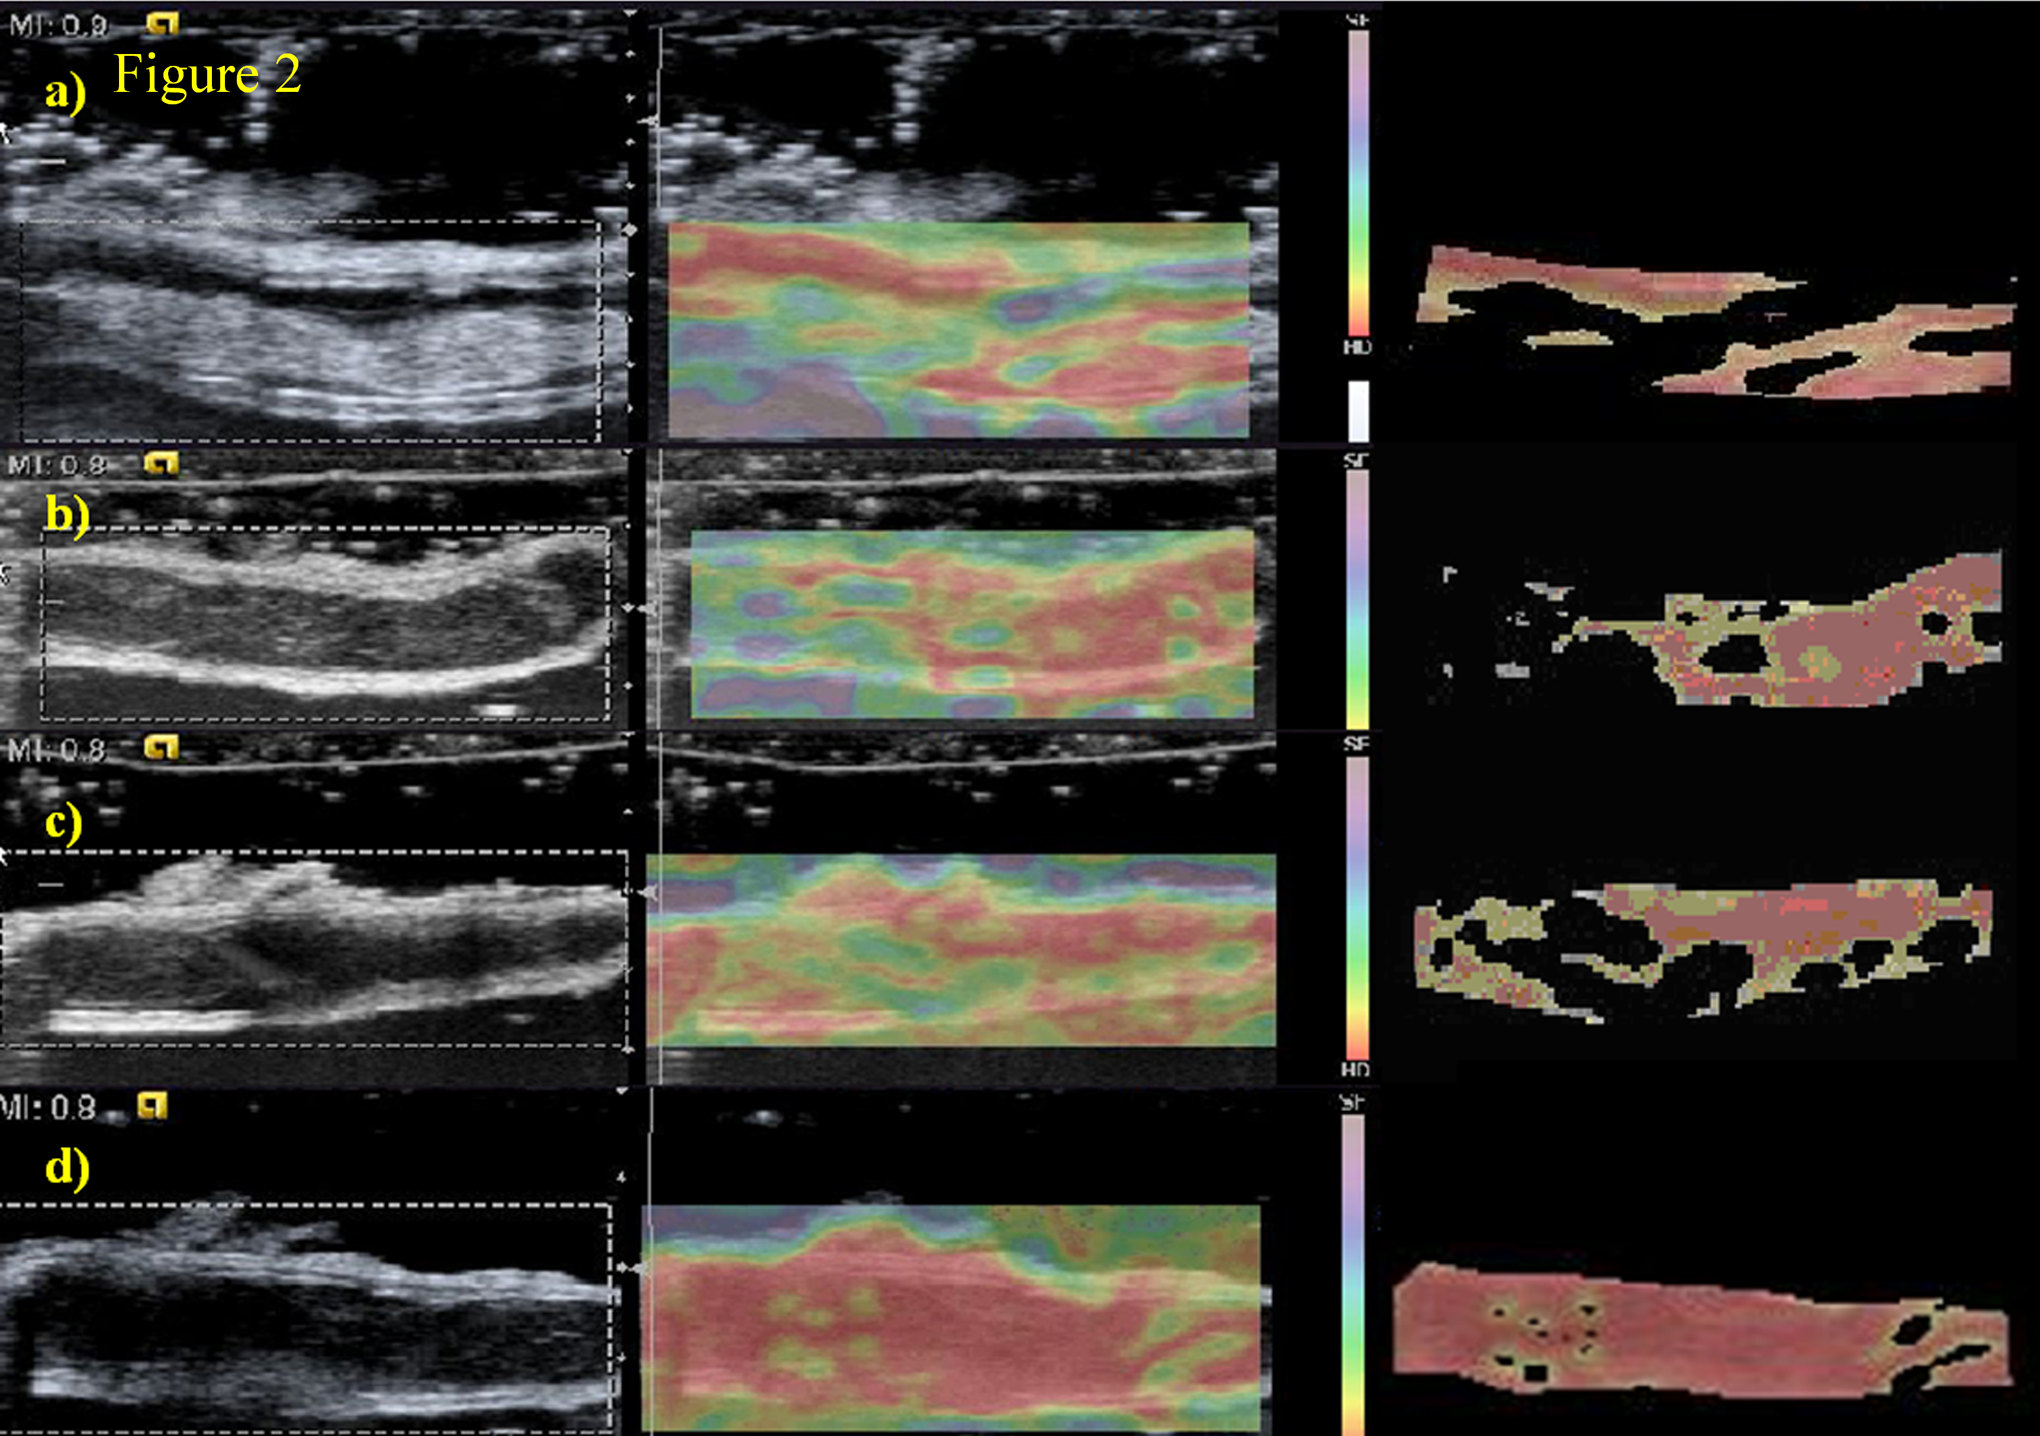
Blood clot hardness region distribution in strain image of model no. 4. B-mode (left), elastography (middle), and segmented blood clot image (right). Thrombosis process on days 1, 3, 6, and 9 was displayed as A, B, C, and D. It indicated that the area of thrombus increased with time significantly while the strain values inside the thrombus changed little.
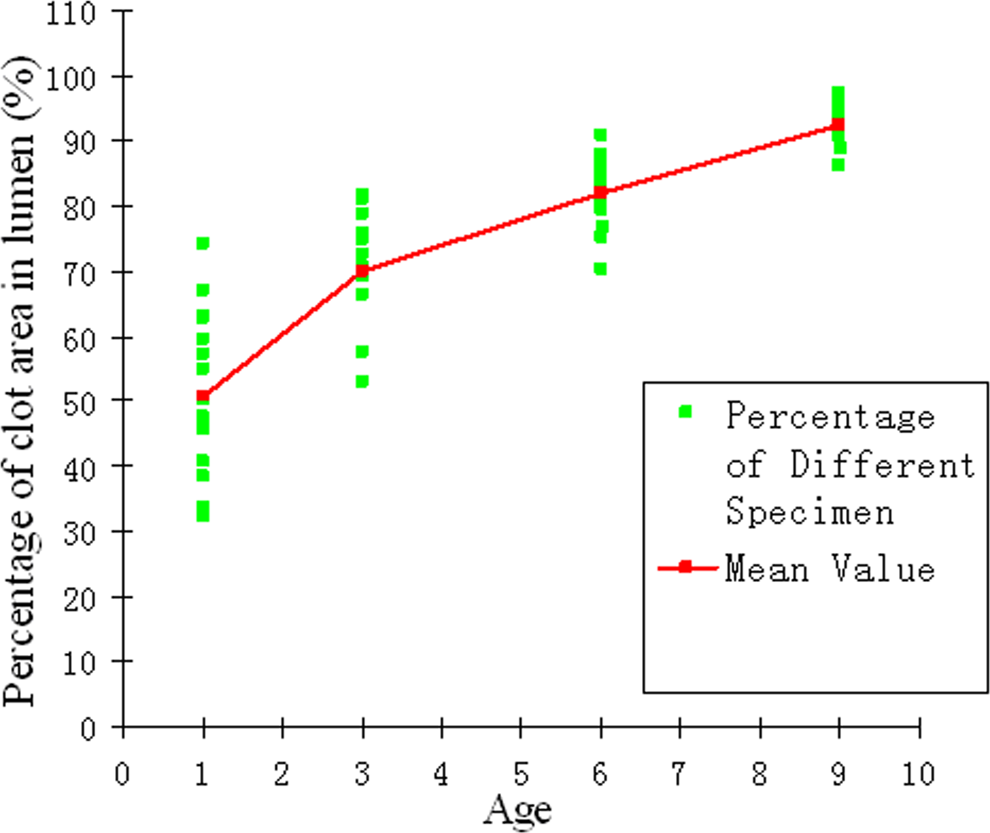
Percentage of clot area in the vessel lumen and their mean value at days 1, 3, 6, and 9 of thrombi. It indicated the thrombus expanded very quickly between days 1 and 6. The rising slope of the curve showed the highest increase between days 1 and 3.
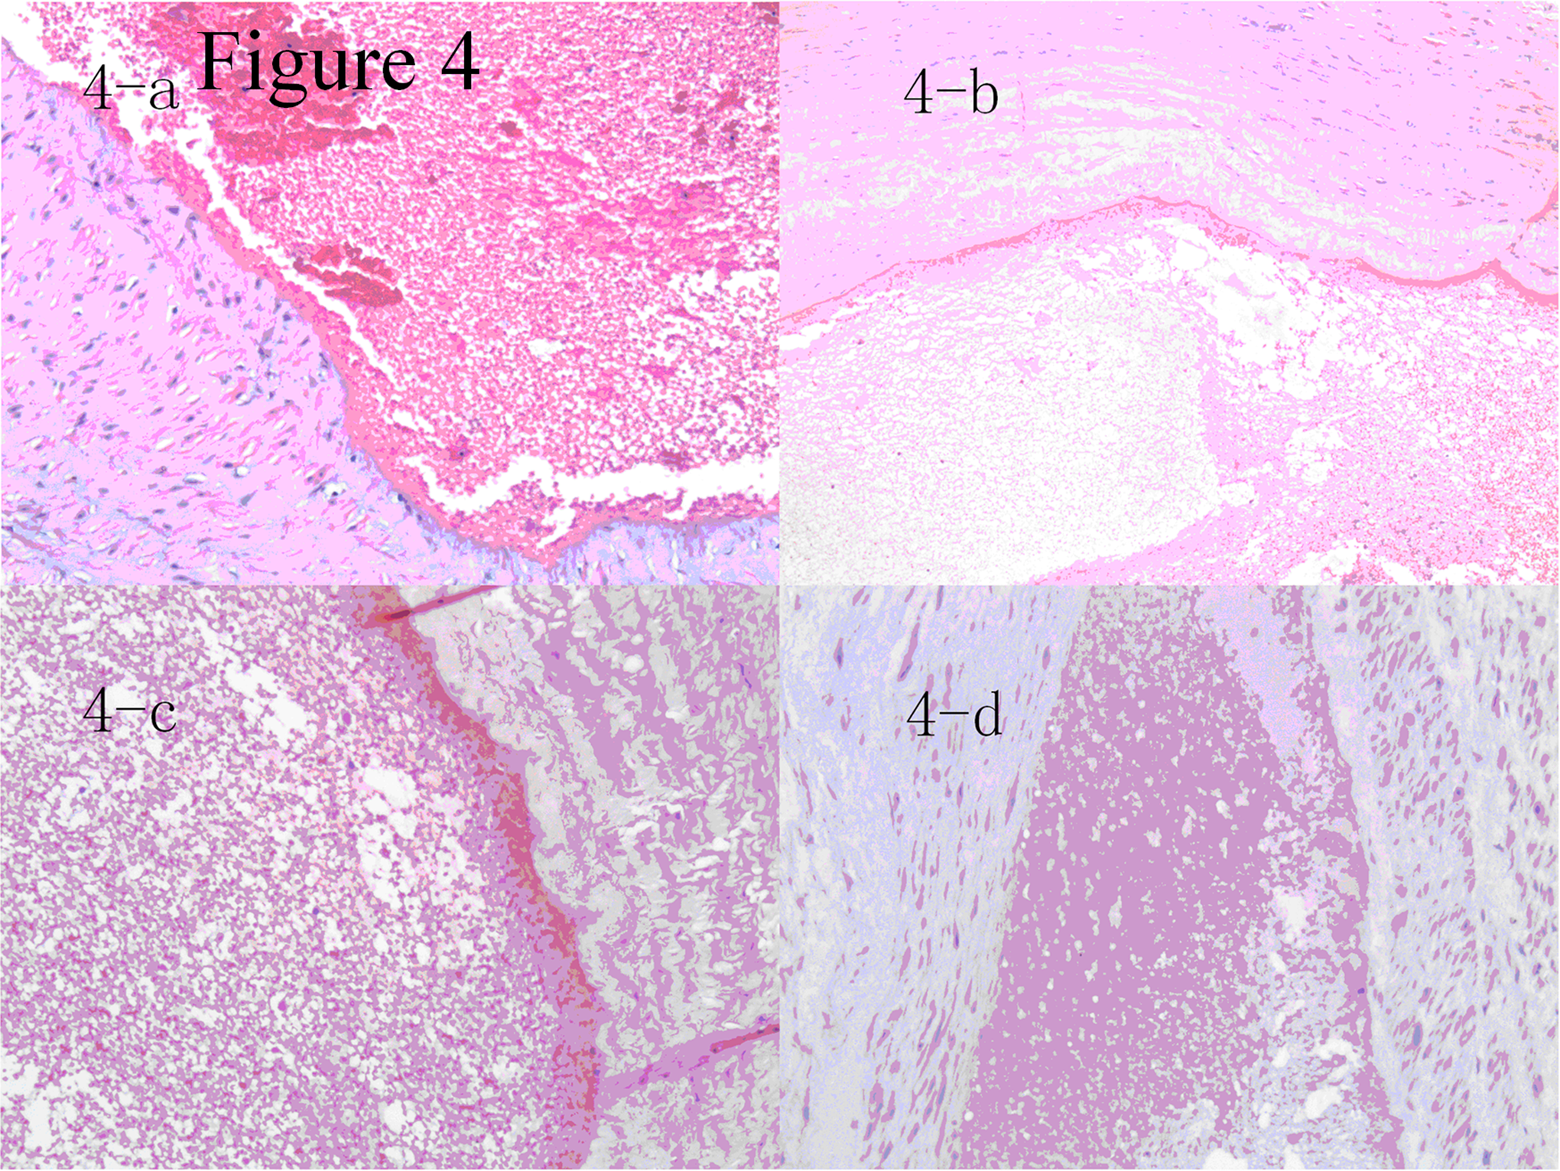
Human great saphenous veins pathological results on days 1, 3, 6, and 9 of thrombosis process were shown in panel A, B, C, and D. Thrombus demonstrated advanced signs of organization with medial hyperplasia, fibrous thickening of the intima, and abundant collagen filaments. The distance between thrombus and vessel wall was nearly conglutinate to each other at day 6, which indicated the thrombus grew rapidly between days 1 and 6.
Figure 2 showed the blood clot hardness region distribution in strain images of model no. 4 during the process of thrombosis on days 1, 3, 6, and 9. With increasing age, the distribution of blood clots (red part) in strain images also increased. As compared between Figure 2A and D, the strain values in blood clots were similar, indicating that the strain values of thrombi had little change at different stages. Nevertheless, the proportion of the blood clot region in the vessel increased significantly as compared to Figure 2A, B, C, and D.
The mean and standard deviation of blood clot percentages among the 15 specimens were 50.01% ± 12.44% at day 1; 69.94% ± 8.19% at day 3; 81.93% ± 6.15% at day 6; and 92.37% ± 4.06% at day 9 (Table 1). The increasing trend and the percentages of blood clot area of 15 specimens were shown in Figure 3. A 1-way ANOVA revealed a significant effect of the percentage of blood clots area at different stages (P < .05). The increasing rates of mean values from the 15 specimens were 19.94% during days 1 to 3, 11.99% during days 3 to 6, and 10.43% during days 6 to 9, which indicated a faster rate of blood clot organization during days 1 to 3 than other days. After day 3, though the percentages of clot area increased continuously, the rate slowed down.
The Percentage of Blood Clot in Blood Vessel Among 15 Specimens, Unit %
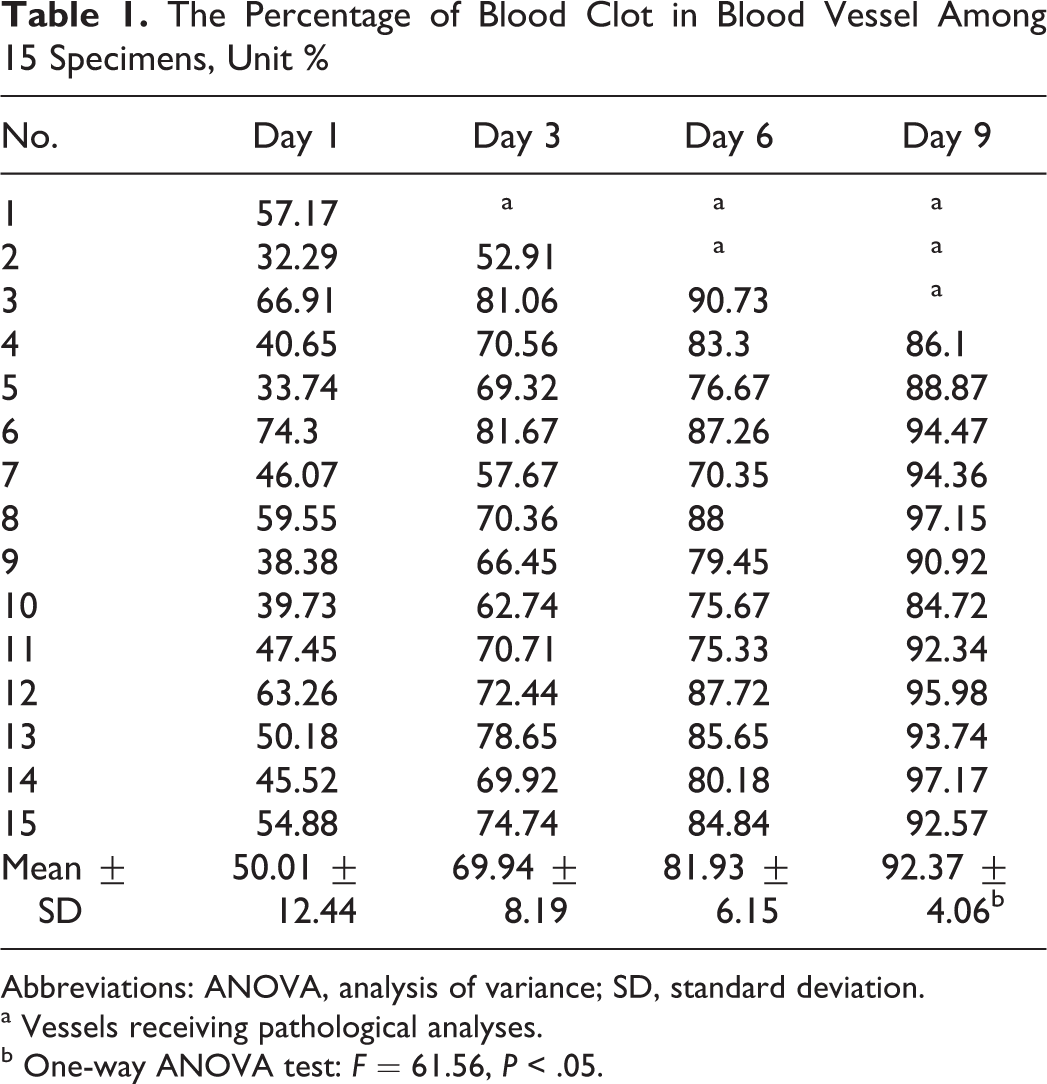
Abbreviations: ANOVA, analysis of variance; SD, standard deviation.
a Vessels receiving pathological analyses.
b One-way ANOVA test: F = 61.56, P < .05.
Pathological images also provided the same results, which were shown in Figure 4. On the first day of the pathological process, the histological section demonstrated the presence of fluidic blood without apparent solid clots. Figure 4A shows large gap and red blood cells in the lumen of a venous specimen. Figure 4B, C, and D shows the pathological alterations at days 3, 6, and 9. The protein components in blood clots were gradually increased while the red blood cells degraded. After day 3, the distance between thrombus and vessel wall began to conglutinate each other. This is due to a combination of factors which include organization of the thrombus and the transformation of the clot from one composed mainly of platelets to one with fibrin as the dominant component. On day 6, the thrombus was nearly organized and connected close to the venous wall. On day 9, the thrombus was fully organized and closely attached to the venous wall.
Discussion
Blood clots leading to venous thrombosis undergo an organization process that results in a hardening process with increasing age. 13,14 It is well known that only when the blood clot is loose, it may easily detach from the vein and cause PE. 15,16 Interestingly, an efficient treatment such as medication with anticoagulants or surgical thrombectomy to DVT is more efficient during this period. 17,18 With the remodeling process of the thrombus, it becomes more and more stiff and gradually attaches to the venous wall. So the risk of PE is reduced. 19 Due to the lack of accurate age determination method of DVT, about 30% of DVTs are wrongly staged by using common diagnostic modalities and therefore this leads to idle therapeutic efforts. 20
As thrombus undergoes a stiffening process, the elasticity of the thrombus may serve as a predictor for the staging of thrombosis. 21 Ultrasonic elastography is a noninvasive technique to measure tissue hardness and is a potential technique to determine the age of DVT. 22 However, normalized strain values obtained from the strain image is not an adequate function to determine the age of the acute DVT. The main cause is that the normalized strain values may include some unnecessary information outside the blood clots. Siebers et al 10 reported that the normalized strain values showed no significant increase from days 1 to 6 during the thrombosis procession. Moreover, after the blood becomes a blood clot, its stiffness changes slightly during the thrombosis process. It is the volume of blood clots, which keeps expanding over time. Hence, normalized strain values might be inaccurate in determining the exact early stage of DVT.
We believe that the area of thrombi in strain images might be the key for determining the exact early stage of DVT. The reason is that the area is obtained from segmented thrombi in the strain image where most of the unnecessary parts (leading errors) are excluded. Moreover, the normalized strain values in shaped thrombus changed slightly. It is the size of thrombus that keeps growing during the thrombosis process. In our study, the area of blood clots in strain images among the 15 specimens was analyzed in defined stages of thrombosis. Our study showed that the AMEHR program could accurately display and calculate the area of blood clots in strain images. The present study suggests that the percentage of the blood clot in the vein increased significantly. Nevertheless, the normalized strain values in shaped blood clots, which were shown in Figure 2A and D, were not significantly changed. It might be due to the presence of the fibrin component, which is stable during the thrombosis. The area of thrombus in strain images calculated by AMEHR was more accurate because the tissues around the blood clots, which decrease the mean strain value, were excluded. Figure 3 showed that the percentage of the blood clot area in the vein increased rapidly during days 1 to 3. Compared to the results of Siebers et al, our results demonstrated a significant increase in the rate of thrombus growth at day 3. Pathological results showed that the margin of the blood clots and venous was reduced at day 6, while the mean percentage of the blood clot area was 69.94% ± 8.19%. It suggested that it might be necessary to conduct the surgical thrombectomy or thrombolysis for patients with DVT prior to day 6. In the present investigation, the length of venous specimens was less than 40 mm. Therefore, SIEMENS S2000 ultrasound with 4C1 probe (probe width: 40 mm) could display the entire vessel. Thus, the stiffness measurement errors could be eliminated because of the uneven distribution of intraluminal thrombi.
Limitation
In this investigation, the experimental model of thrombosis has several limitations. First, the amount of thrombosed vessels was less (n = 15). We cannot provide the exact thrombus area in strain images to determinate the age of acute DVT. Second, the age of the thrombosed vessels was limited in the period of days 1 to 9. The changes in the stiffness of the thrombus during days 10 to 14 were not investigated in this study. Third, the artificial thrombus of the great saphenous vein was formed by injection of human blood clots into the vessel of the vein in vitro. The in vitro mechanism of blood formation was different from that of the in vivo. The present study was conducted in a laboratory environment. The sampling lumens are placed on a homogeneous material and are surrounded by coupling agent. It is different from clinical application.
However, as a prospective trial, the purpose of this present study is to demonstrate the use of the thrombus area in the strain images as a new method for acute DVT staging. The above mentioned limitations had very minimal impact on the results of this study.
Conclusion
The goal of this study is to provide a more accurate and reliable method to assess the age of early DVT by elastography with the aid of the AMEHR program. Elasticity imaging with the AMEHR program showed that it was possible to detect blood clots and calculate the area of blood clots in strain images. This novel imaging technique not only improved the reproducibility but also provided quantitative data. It is, therefore, anticipated that the method developed in this study might be a useful tool for enhanced DVT staging.
Footnotes
Declaration of Conflicting Interests
The author(s) declared no potential conflicts of interest with respect to the research, authorship, and/or publication of this article.
Funding
The author(s) disclosed receipt of the following financial support for the research, authorship, and/or publication of this article: fund of scientific and technological development in Pudong New District of Shanghai, China (No. PKJ2010-Y16) and the fund for cardiovascular diseases in Pudong New District of Shanghai, China (No. PWZxkq2010-01).