
Abstract
Introduction:
Mean platelet volume (MPV) is an independent cardiovascular disease predictor, and characteristics of MPV in patients with diabetic nephropathy (DN) are not well known.
Aim:
To determine the MPV levels in patients at different stages of DN.
Patients and Methods:
The MPV levels were investigated in healthy participants (group 1, n = 157), patients with type 2 diabetes mellitus without complication (group 2, n = 160), diabetic patients with clinical proteinuria (group 3, n = 144), and in patients with chronic kidney disease due to DN (group 4, n = 160).
Findings:
The MPV level was higher in all diabetic patients than that in normal participants (P < .05). The MPV values had a positive correlation with the serum creatinine and proteinuria, and a negative correlation with the glomerular filtration rate ([GFR] P < .001 for all, r values; .72, and .82, and −.92, respectively).
Conclusion:
The MPV values were higher in diabetic groups than that in normal participants. Both GFR and proteinuria were the most powerful determinants of MPV.
Keywords
Introduction
Mean platelet volume (MPV) which can be easily evaluated by the hematological analyzers is a convenient marker of platelet functions and activation. Larger platelets are metabolically and enzymatically more active and release more thromboxan-A2, β-thromboglobulin, and adhesion molecules. 1,2 While the other markers of platelet activity require special hemostatic laboratories—because of the stringent requirement for nearly perfect phlebotomy, blood-processing procedures, platelet isolation, and specialized equipment—MPV is simple and inexpensive to obtain, easy to interpret, and routinely measured by automated cell counters. It has been shown that MPV is genetically inherited, and the locus on chromosome 7q22.3 region has been demonstrated to code MPV. 3
A recent meta-analysis study suggested that MPV is a practical and predictive biomarker of cardiovascular disease (CVD) in nonrenal patients. 4 On the other hand, some recent studies have demonstrated that the severity of coronary artery disease, atherosclerotic vascular changes, and thrombocyte aggregation have no relation with MPV. 5 Moreover, subjects whether showing progression or not, evaluated by angiography have similar MPV values which is very remarkable. 6 Some studies suggest that there is a relation between stroke risk and MPV levels, but the subtype and severity of stroke, the extent of the infarct, and functional recovery have no association with it. 7 Therefore, for MPV, the last word has not been said, at least particularly for some group of patients.
Proteinuria can cause some changes in the levels of many biomarkers circulating in the blood, resulting in alterations in the physiologic efficiency and diagnostic and clinical usefulness of such substances. 8 –10 A few studies have evaluated MPV values in hemodialysis (HD) patients as well as in nondiabetic patients with glomerular pathologyin. 11,12 On the other hand, MPV and related factors have hardly been investigated in patients with diabetic nephropathy (DN) or in patients with chronic kidney disease (CKD) stages 1 to 4.
In our study, we aimed to investigate the MPV levels in patients with type 2 diabetes mellitus (DM), in patients with different stages of DN, and in healthy volunteers. We also aimed to define related factors of MPV levels.
Patients and Methods
Four groups were recruited to this cross-sectional study. Informed consent was obtained from all participants.
Definitions
Diabetes mellitus was defined as fasting blood sugar >7.0 mmol/L (126 mg/dL) or taking antidiabetic medications. 13 Hypertension was defined as mean systolic BP >140 mm Hg or mean diastolic BP >90 mm Hg measured 20 minutes apart, on 2 separate occasions or taking antihypertensive medications. 14
Normal albumin–creatinine ratio in spot urine was defined as <20 mg/g for men and <30 mg/g for women. 15 Microalbuminuria is a condition when the spot urine albumin–creatinine ratio is 20 to 200 mg/g in men and 30 to 300 mg/g in women. 15 Levels of spot urine albumin–creatinine ratio >300 mg/g (>200 mg/g for men and >300 mg/g for women) correspond roughly to various definitions of macroalbuminuria or clinical proteinuria. Chronic kidney disease was defined as kidney damage or glomerular filtration rate (GFR) <60 mL/min per 1.73 m2, for 3 months or more, irrespective of the cause. 15
Study Groups
Group 1 consisted healthy control participants. Participants with hypertension, CKD, CVDs, neoplastic disease, hematologic diseases and disorders, endocrine diseases and disorders, acute or chronic active inflammatory diseases and disorders, and patients taking antiaggregant or anticoagulant medications were excluded.
Group 2 consisted type 2 diabetic patients who did not have any chronic microvascular and macrovascular complications of DM. The patients in both the groups did not have CKD, microalbuminuria, and macroalbuminuria. All of group 2 patients were assessed for diabetic retinopathy, nephropathy, and CVD within the last 1 year.
Group 3 consisted patients with type 2 DM which had normal GFR values (>90 mL/min) and having either clinical proteinuria or macroalbuminuria within the last year (at 2 different times). Patients having microscopic hematuria or erythrocyte cylinders and patients with other glomerular diseases were excluded.
Group 4 was composed of patients with stages II to IV CKD due to DN. The GFR values were <60 mL/min for all patients. Either clinical proteinuria or macroalbuminuria was present in all group 4 patients. Patients who need renal replacement therapy were excluded.
The participants were determined as smokers or not, independent of the amount of the smoking in all groups. Patients that quitted smoking for 3 months or more were described as nonsmokers. The passive smoking fact was ignored as it is forbidden to smoke in all closed areas in Turkey.
Patients with thrombotic, hematological, or symptomatic CVD including coronary artery disease, cerebral vascular disease, peripheral artery disease, aortic aneurism, and heart failure were excluded. Patients taking anticoagulant, antiaggregant, or erythropoietin treatment, and patients with acute or chronic active inflammatory diseases and disorders were also excluded.
Demographical Data
Measurements of waist circumstance, systolic and diastolic blood pressures (SBP and DBP) along with body mass index (BMI) were obtained in all participants. Body mass index was calculated as weight in kilograms divided by height in meters squared. Waist circumstance was recorded in centimeters taking the umbilicus as the alignment point. Arterial blood pressure was measured in mm Hg with the oscillometric system with the patient in a seated position, and the mean of 2 consecutive readings taken within 5 minutes was calculated (OMRON M6 Comfort, Kyoto, Japan). Duration of DM and age of the participants were mentioned as months and years, respectively.
Laboratory Tests
Complete blood count was evaluated after an 8-hour overnight fasting period from the antecubital vein with an application of bandage to forearm for at most 30 seconds. Samples were drawn with a 20 gauge “vacutainer” needle into dry and EDTA containing tubes with amounts of 5 and 3 cm3, respectively. Hemoglobin level, thrombocyte count, and MPV values were assessed with Sysmex XI2000 device (Sysmex Corporation of America, Long Grove, Illinois) within 10 minutes after the blood samples were drawn. The MPV, platelet count, and hemoglobin levels were evaluated with the optic scatter, optic scatter & impedans, and fotometric methods, respectively.
Serum creatinine, fasting blood glucose, albumin, total cholesterol (TC), high-density lipoprotein cholesterol (HDL-C), triglyceride (TG), aspartate aminotransferase, alanine aminotransferase, and glycosylated hemoglobin (HbA1c) levels were evaluated (Olympus AU 640, Japan). Low-density lipoprotein cholesterol (LDL-C) level was assessed with Freidwald formula which can be formulated as LDL = TC − (HDL) − (TG/5). 16 Glomerular filtration rate was evaluated with Modification of Diet in Renal Disease (MDRD) formula which can be shown as MDRD: GFR = 170 × (serum creatinine [Scr])−0.999 × (age)−0.176 × (0.762 if the participant is women) × (1.180 if the patient is black) × (blood urea nitrogen [BUN])−0.170).
Twenty-four-hour urine protein (mg/d) and 24-hour microalbuminuria (mg/d) levels were also assessed with Olympus AU 640 device by the immunoturbidimetric methods. Creatinine measurement in the spot urine samples was done with the Jaffe colorimetric method using commercial kits of Abbott Architect C 8000 autoanalyzer (Abbott Laboratories).
Parathyroid hormone (PTH) level was evaluated by electrochemiluminescence method with Siemens Immulite 2000XI (USA) device. Hbs-Ag, anti HCV antibody, and anti-HIV antibody as well as antinuclear antibody, anti-dsDNA antibody, peripheral and cytoplasmic antineutrophil cytoplasmic antibodies (ANCA) in patients with proteinuria were assessed with indirect immunfluorescence method (Architect i 2000 SR, Abbott).
Imaging Methods
Chest x-ray and standard electrocardiography (ECG) assessing 12 derivations with a speed of 25 mm/s (Cardiofax ECG-932 OK, Nihon Kohden, Japan) were performed in all participants. Renal Doppler ultrasonography (Aplio, Toshiba Tokyo, Japan) and transthoracic echocardiography (Philips IE33, Netherlands) were performed in groups 3 and 4 patients.
Statistical Method
SPSS for Windows 11.5 and Statistica 6.0 programs were used for statistical analysis. To test the convenience of normal distribution for permanent data, Shapiro-Wilk test was applied. According to the results gathered from this test, parametric methods were used if it was necessary. The mean comparisons of binary groups were done with Student t test. For the mean comparisons of the groups, where more than 2 groups involved, 1-way analysis of variance (ANOVA) was applied. The multiple comparisons, on the other hand, were done with Tukey Honestly Significant Difference (HSD) test. For the assessment of the effects of interactions of 2 different variables on the mean values, factorial ANOVA test was applied. Linear association between 2 variables was evaluated with Pearson correlation test. Linear regression was analyzed to identify the independent determinant of MPV. Type I error level was determined to be 0.05 in all of the comparisons.
Results
A total of 621 patients composed of 4 different groups were recruited to the study. Mean ages and genders were shown in Table 1.
Demographic and Laboratory Measurements in Groups.
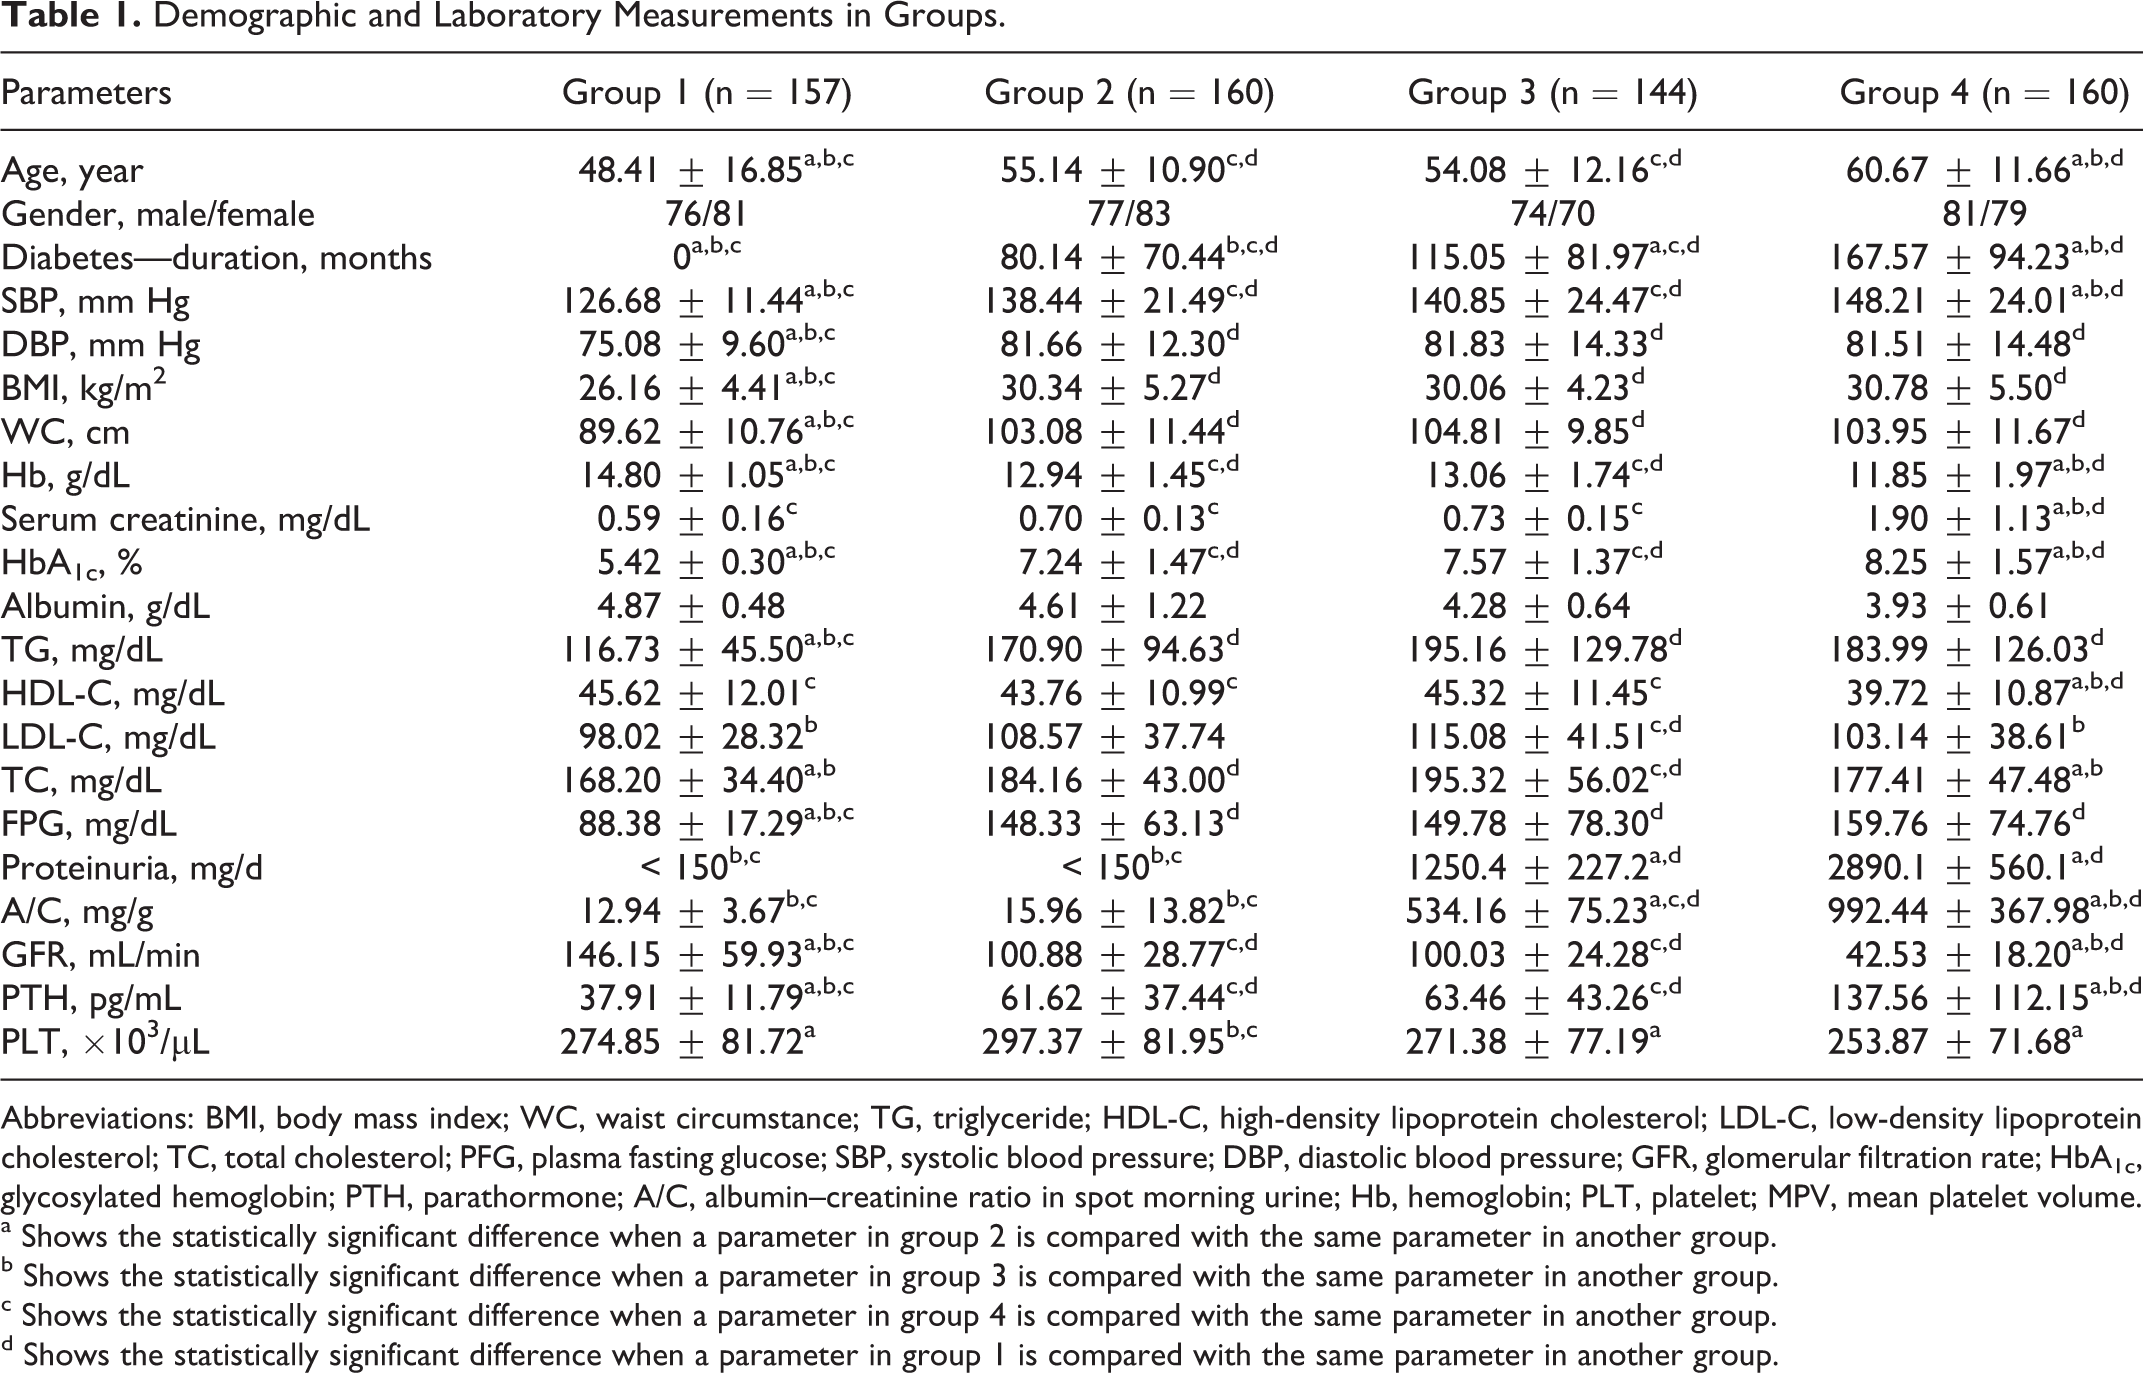
Abbreviations: BMI, body mass index; WC, waist circumstance; TG, triglyceride; HDL-C, high-density lipoprotein cholesterol; LDL-C, low-density lipoprotein cholesterol; TC, total cholesterol; PFG, plasma fasting glucose; SBP, systolic blood pressure; DBP, diastolic blood pressure; GFR, glomerular filtration rate; HbA1c, glycosylated hemoglobin; PTH, parathormone; A/C, albumin–creatinine ratio in spot morning urine; Hb, hemoglobin; PLT, platelet; MPV, mean platelet volume.
a Shows the statistically significant difference when a parameter in group 2 is compared with the same parameter in another group.
b Shows the statistically significant difference when a parameter in group 3 is compared with the same parameter in another group.
c Shows the statistically significant difference when a parameter in group 4 is compared with the same parameter in another group.
d Shows the statistically significant difference when a parameter in group 1 is compared with the same parameter in another group.
In group 2 patients, 45% (n = 72) were hypertensive and all of them were receiving rennin–angiotensin system (RAS) blockade treatment either with angiotensin-converting enzyme (ACE) inhibitors or with angiotensin receptor blockers (ARBs). The target level for blood pressure was succeeded in 80.5% of the patients.
In group 3 patients, 79.1% (n = 114) were hypertensive; all of them receiving RAS blockade treatment either with ACE inhibitors or with ARBs. However, the percentage of the patients that achieved the target blood pressure level was only 63.1% (n = 72).
In group 4 patients, 88.7% (n = 142) were hypertensive, 20.4% (n = 29) of which were receiving RAS blockade treatment either with ACE inhibitors or with ARBs similar to the previous group. Only 38.7% (n = 55) achieved the target blood pressure.
The demographic and laboratory parameters of groups are shown in a comparative way in Table 1. Mean MPV values of the groups and their comparisons are shown in Figure 1. The mean MPV values of groups 2, 3, and 4 participants receiving or not receiving antihypertensive treatment are shown in Table 2.
The Comparative Mean MPV Values of Group 2, 3 and 4 Participants Taking or Not Taking Antihypertensive Treatment.
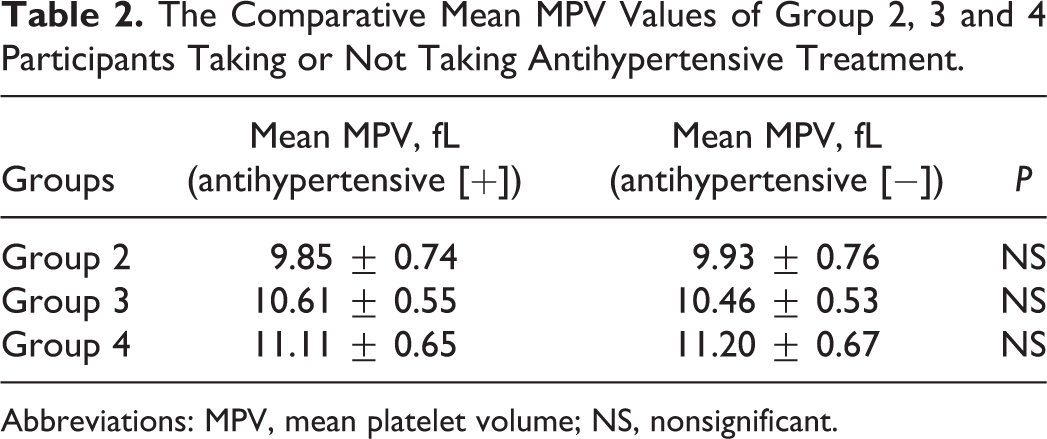
Abbreviations: MPV, mean platelet volume; NS, nonsignificant.
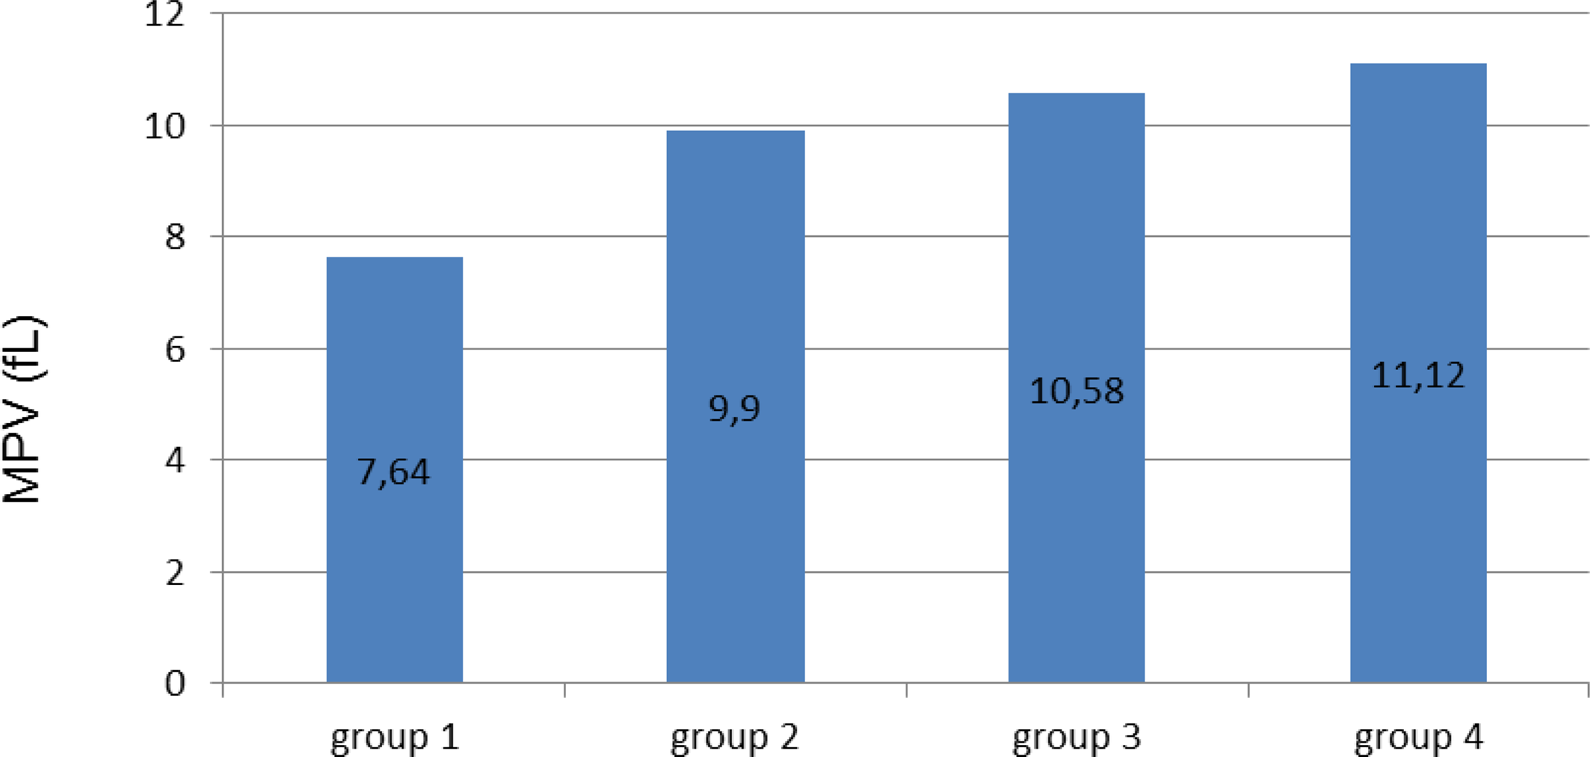
The comparative mean platelet volume (MPV) levels in groups (P < .05 for all comparisons).
The age, BMI, waist circumstance, TG level, fasting plasma glucose level, SBP, DBP, GFR, HbA1c level, PTH, Hb, and MPV values of group 1 were found to be significantly different as compared to the other 3 groups (P < .01). The TC values in group 1 participants were significantly different from the values of groups 2 and 3. While LDL values of group 1 were different only from group 3, HDL, serum creatinine levels were significantly different as compared to group 4 (P < .05).
In group 1, the mean MPV values of smokers (n = 46) were 7.66 fL and nonsmokers (n = 111) were 7.63 fL. In group 2, the mean MPV values of smokers were 9.93 fL and nonsmokers (n = 113) were 9.89 fL; in group 3 smokers (n = 43) were 10.5 fL and nonsmokers (n = 101) were 10,61 fL; and in group 4 smokers (n = 40) were 11.08 fL, nonsmokers (n = 120) were 11.13 fL). Interestingly, the mean MPV values were not different between smokers and nonsmokers in all groups (P > .05).
Gender difference did not seem to be associated with MPV values in all groups (P > .05). For all groups while the MPV values had positive correlation with the blood pressure levels, serum creatinine, HbA1c, BMI, proteinuria, PLT, TG, LDL, TC, fasting blood glucose, and duration of the DM, GFR, and HDL had a negative correlation (for all parameters, P value < .001, r values: .95, .72, .56, .86, .82, .76, .88, .84, .88, .86, .92, and −.92, −.88, respectively). However, there was no correlation of MPV values with treatments of antihypertensives, age, smoking, and PTH levels.
Discussion
The levels, diagnostic, and prognostic values of cardiovascular biomarkers differ in patients with proteinuria and renal failure as compared to the general population. Our study is the first study ever in which MPV values were investigated in patients with different stages of DN. Our study has revealed that the MPV values are higher in all diabetic patients when compared with healthy people. More importantly, as DN stage proceeded, the MPV values also increased accordingly. Furthermore, blood pressure levels, serum creatinine, HbA1c, BMI, proteinuria, PLT, TG, LDL, TC, fasting blood glucose and duration of the DM, GFR, and HDL were found to be the most powerful determinants of MPV in patients with DM and DN.
In Turkey, the mean MPV values of normal participants of age range 18 to 92 are 8.9 ± 1.4; 95% of which have an MPV value between 7.2 and 11.7 fL. 17 It has been demonstrated that the MPV levels increase in patients with gestational DM, type 2 DM without chronic complications, and patients with impaired glycemic control. 17 –20 However, there are also reports stating that this issue has no association with the microvascular complications of DM. 21 Another study which increases this discordance has revealed that the MPV values are not associated with the glycemic index in diabetic patients with myelodysplastic syndrome. 22
The MPV is an entity that has been very rarely investigated in patients with renal disease. In one study in which participants with nondiabetic glomerular disease were assessed, spontaneous thrombocyte aggregation and MPV values were found to be increased. Moreover in these patients, the thrombocyte markers predicted the progression of the disease. 23 In a recent study, urine albumin–creatinine ratio had mild positive correlation with MPV values in microalbuminuric primary hypertensive patients. 24
Very few studies of HD participants have shown that MPV is associated with CVD. 12 However, factors such as type of HD membrane, erythropoietin treatment, changes in the levels of serum sodium and potassium, the ultrafiltration amount during HD which interact with MPV, and changes in the power of MPV as a biomarker in these patients. The MPV levels and the associated factors are not well known in patients with diabetes and proteinuria as well as in patients with CRF stages 1 to 4. We have found that MPV values increase as the level of nephropathy increases.
In general population, increase in blood glucose level, hypertension history, increase in thrombocyte and hemoglobin levels, increase in subcutaneous lipid tissue, changes in ischemic ECG, high homeostatic model assessment and BMI, and smoking can be counted as conditions and/or disorders
Antihypertensive medications did not seem to be associated with MPV values in our study population. It has been reported that there is a different relation between antihypertensive medications and MPV levels. Studies have shown that while doxazosin treatment decreases the MPV values, amlodipine has no effect on it. 29 On the other hand, selective or nonselective β-blockers do not have any effect on MPV levels in the acute period. 30 While angiotensin II increases the MPV values, different kinds of ACE inhibitors and ARBs have different effects. For example, losartan decreases the MPV values, however candesartan cilexetil and perindopril treatment cause no changes in the values. 31 –33 Treatment with antihypertensive drugs was not found to be associated with MPV values in any of our study groups.
In conclusion, MPV—a valuable marker—is a cheap and easy method to be studied. The increase in the MPV levels parallel to the DN is an important finding. According to our study, the most powerful determinants are blood pressure levels, serum creatinine, HbA1c, BMI, proteinuria, PLT, TG, LDL, TC, fasting blood glucose and duration of the DM, GFR, and HDL. These findings will be more precise as longitudinal studies about MPV consisting of wider and more homogenous samples will be performed.
Footnotes
Declaration of Conflicting Interests
The authors declared no potential conflicts of interest with respect to the research, authorship, and/or publication of this article.
Funding
The authors received no financial support for the research, authorship, and/or publication of this article.