
Abstract
The aim of the present research was to assess the differences in blood platelet and plasma proteome profiles of patients with uremia in comparison with healthy participants. It was found that 23 peptides in the platelet proteome profiles of hemodialyzed patients and only 6 peptides in nondialyzed patients were upregulated. On the other hand, 18 peptides with reduced expression in nondialyzed patients and only 1 peptide in hemodialyzed patients were found. For serum, only 6 upregulated peptides in patients undergoing hemodialysis and 15 peptides in nondialyzed patients were found, most of these were about 10 kDa. A decrease in serum peptide expression was not observed. In conclusion, it should be noted that the process of hemodialysis modifies the platelet proteome to a greater extent than uremia alone, however the sera of nondialyzed patients have much larger amounts of low-molecular-weight peptides than those of hemodialyzed patients.
Introduction
Despite the significant progress in the treatment of patients with renal failure, there is still a high risk of bleeding during surgery and other invasive procedures, although paradoxically thrombotic episodes are a common cause of death. Bleeding in uremia originates from structural and biochemical abnormalities of uremic platelets 1 –3 as well as the effect of toxins present in uremic plasma on blood platelets. 4,5 On the other hand, circulating platelet-derived microparticles with procoagulant activity 6 and endothelial dysfunction 7 seem to be responsible for thrombosis.
Hemodialysis, combined with recombinant human erythropoietin (EPO) administration, is a common treatment during end-stage renal disease (ESRD) and during the waiting period for a kidney transplant. 8 Although hemodialysis normalizes some biochemical parameters of blood and prolongs the patient’s life, blood platelets remain less reactive in the period between dialyses 9 and the risk of bleeding or thrombosis is still relatively high. Recently, the preliminary results of blood platelet proteome analysis in patients with uremia, both treated pharmacologically and with hemodialysis, have been published. 10 It has been reported that the blood platelet proteome of hemodialyzed patients with uremia exhibits significant differences in comparison with the blood platelet proteome of healthy participants. This article emphasized the fact that contact with artificial surfaces can trigger an apoptosis-like process in the blood platelets of hemodialyzed patients. Moreover, signs of apoptosis, that is, activation of caspases and increased expression of phosphatidylserine (PS) in the outer surface of blood platelets of hemodialyzed patients have been reported. 11 The latest research carried out by the authors, has confirmed significantly elevated levels of PS expression, particularly with regard to the necrotic platelets. 12
The aim of the present research was to accurately assess the differences in proteome profiles of blood platelets and plasma from hemodialyzed patients with uremia, in comparison with the platelets and plasma of conservatively treated patients and control healthy donors.
Materials and Methods
The study was performed using blood platelets and plasma of the same donors as reported previously. 12 Twelve stable patients with ESRD were included in the study (7 men and 5 women; aged 58 ± 16 years, range 22-82 years) and treated with hemodialysis for 4.17 ± 0.24 hours (range 4-4.5 h) 3 times a week (mean time of dialysis 33 months, range 3-82 months). Adequacy of hemodialysis, measured by Kt/v ratio in all patients, was 1.225 ± 0.060 (range 1.2-1.4). All patients were treated by low-flux dialysis with single use polysulfone dialyzer membrane–effective surface area 1.5 to 2.1 m2. All hemodialyzed patients were treated with EPO. The etiology of ESRD in this group of patients was as follows: hypertensive nephropathy (n = 1), chronic glomerulonephritis (n = 5), and unknown etiology (n = 6). Thirteen stable chronic kidney disease (CKD) stage 4 nondialyzed patients were also included in the study (5 men and 8 women; aged 64 ± 8 years, range 53-79 years). No EPO was used in this group. The etiology of CKD in conservatively treated patients was hypertensive nephropathy (n = 4), chronic glomerulonephritis (n = 4), polycystic kidney disease (n=1), and unknown etiology (n = 4). The nondialyzed patients were included in the study in 4 stages of CKD (estimated glomerular filtration rate [eGFR] 15-29 mL/min per 1.73 m2; mean eGFR 23.4, range 15.1-28.8 mL/min per 1.73 m2). Diabetic patients were excluded, as this condition can alter platelet intracellular mechanisms. Other exclusion criteria included acute infection or blood transfusion in the past 3 months; unstable clinical conditions including vascular and cardiac instability, a positive history of first use syndrome, unstabilized EPO dosage, a history of stroke, myocardial infarction, thromboembolic complications, and malignancy. None of the patients was known to have a preexisting hemostatic disorder unrelated to uremia, and all had been free of medications known to affect platelet function for at least 3 weeks prior to the study. Twelve healthy individuals with normal platelet count (serum creatinine < 1.5 mg/dL), and mean age of 48 ± 14 years (rage 22-66 years, 7 woman and 5 men) were included as control participants.
The study was approved by the local Bioethical Committee (RNN/160/03/KE, 23 August 2003), and informed consent was obtained from all patients and controls.
Blood was obtained from hemodialyzed uremic patients immediately before hemodialysis. At the same time, blood samples from nondialyzed uremic patients and control healthy donors were also collected. Blood was anticoagulated with sodium citrate and was divided into 2 portions. Two hundred microliters were used for immediate exposure to fluorescent agents for flow cytofluorymetry study, 12 while the rest of blood, approximately 10 mL, was used for platelet isolation from plasma and 1 mL for preparation of platelet poor plasma. Platelet poor plasma was prepared by centrifugation of the whole citrated blood for 20 minutes at 1000g, and the resulting supernatant was frozen and stored at −80°C for further analysis. Blood platelets were isolated from plasma by differential centrifugation (200g, 10 minutes, room temperature) followed by gel filtration on bovine serum albumin–sepharose 2B. 13 Fractions containing blood platelets were then combined and spun down again (20 minutes at 8000g). The pellet was resuspended in 2 mL of lysis buffer (30 mmol/L Tris, 7 mol/L urea, 2 mol/L thiourea, 4% 3-[(3-cholamidopropyl)-dimethylammonio]-1-propane sulfonate, ditiotreitol 1%, pH 8.5 [HCl]) and incubated for 20 minutes in ice bath with 5 repeated exposures to ultrasounds (1 minute). Thus, the obtained samples of lysed platelets were stored at −80°C for further analysis.
The frozen samples containing blood platelet proteins were used for 2D fluorescence difference gel electrophoresis (2D DIGE) analysis. Briefly, thawed samples were again exposed to ultrasounds and centrifuged (12 000g, 10 minutes at 10°C). Protein concentration of the supernatant was estimated using 2-D Quant kit (GE Healthcare Lifescience, branch in Warsaw, Poland). The next step included sample cleaning up by precipitation with 2-D Clean-Up Kit (GE Healthcare), followed by reestimation of protein concentration.
The frozen blood plasma samples were thawed in a refrigerator and were centrifuged (12 000g, 10 minutes at 10°C). Sera were obtained by clotting with thrombin (2.5 u/mL) within 30 minutes at 4°C, with subsequent centrifugation (12 000g, 10 minutes at 10°C). The sera obtained were subjected to the procedure of albumin and immunoglobulin elimination using Albumin & IgG Depletion SpinTrap kit (GE Healthcare). The effectiveness of this method was checked by sodium dodecyl sulfate–polyacrylamide gel electrophoresis (SDS-PAGE) method in 12.5% gel. The resulting plasma protein samples were further subjected to the cleaning procedure described above for preparations containing platelet proteins.
The samples of purified proteins were prestained with fluorescent probes: Cy2 (nondialyzed patients), Cy3 (hemodialyzed patients), and Cy5 (control). This procedure was performed according to the manufacturer protocol attached to the CyDye DIGE fluors (minimal dyes) for Ettan DIGE set (GE Healthcare). First dimension separation, according to isoelectric point (pI), was performed in IPGphor Isoelectric Focusing System (GE Healthcare) using immobilized gradient pH 4 to 7 IPG strips (GE Healthcare). After the isoelectrofocusing procedure, the strips were equilibrated twice in Tris-HCl buffer (pH 8.8) containing urea (6 mol/L), glycerol (87%), SDS (2%), bromophenol blue (0.002%), and ditiotreitol (1%) or iodoacetamide (1%), respectively, in the first or second equilibration. The second direction separation was run in 12.5% ExcelGels SDS homogenous gel (24 × 11 cm). Immediately after separation, gels were scanned with Ettan DIGE Imager (GE Healthcare) and analyzed using ImageMaster 2D DIGE Platinum 7.0 software (GE Healthcare). The statistical module of this software was used to select spots with statistically significant changes in expression (P < .05, analysis of variance [ANOVA] test).
Within each of the tested groups, representative samples were also prepared. For this purpose, the same amount of previously unlabeled protein was obtained from each sample and pooled into 1 representative sample. Then the representative samples were fluorescently labeled and processed as described above.
Results
The electrophoretic separations of purified protein extracts of platelets and serum that were achieved revealed the existence of significant differences between the tested groups. Using the spots codetection method available in ImageMaster 2D DIGE Platinum 7.0 software, the expression of individual peptides in each gel and their volume ratio expressed in relation to the spots of respective gels of control participants was analyzed.
Separation results obtained for representative samples of the tested groups, along with the marked detected spots, are shown in Figures 1 (for platelets) and 2 (for sera). For a pI range of 4 to 7, 169 platelet and 257 sera peptides were found. Complete expression profiles of these peptides are presented in Figures 3 and 4 for platelet and sera peptides, respectively.
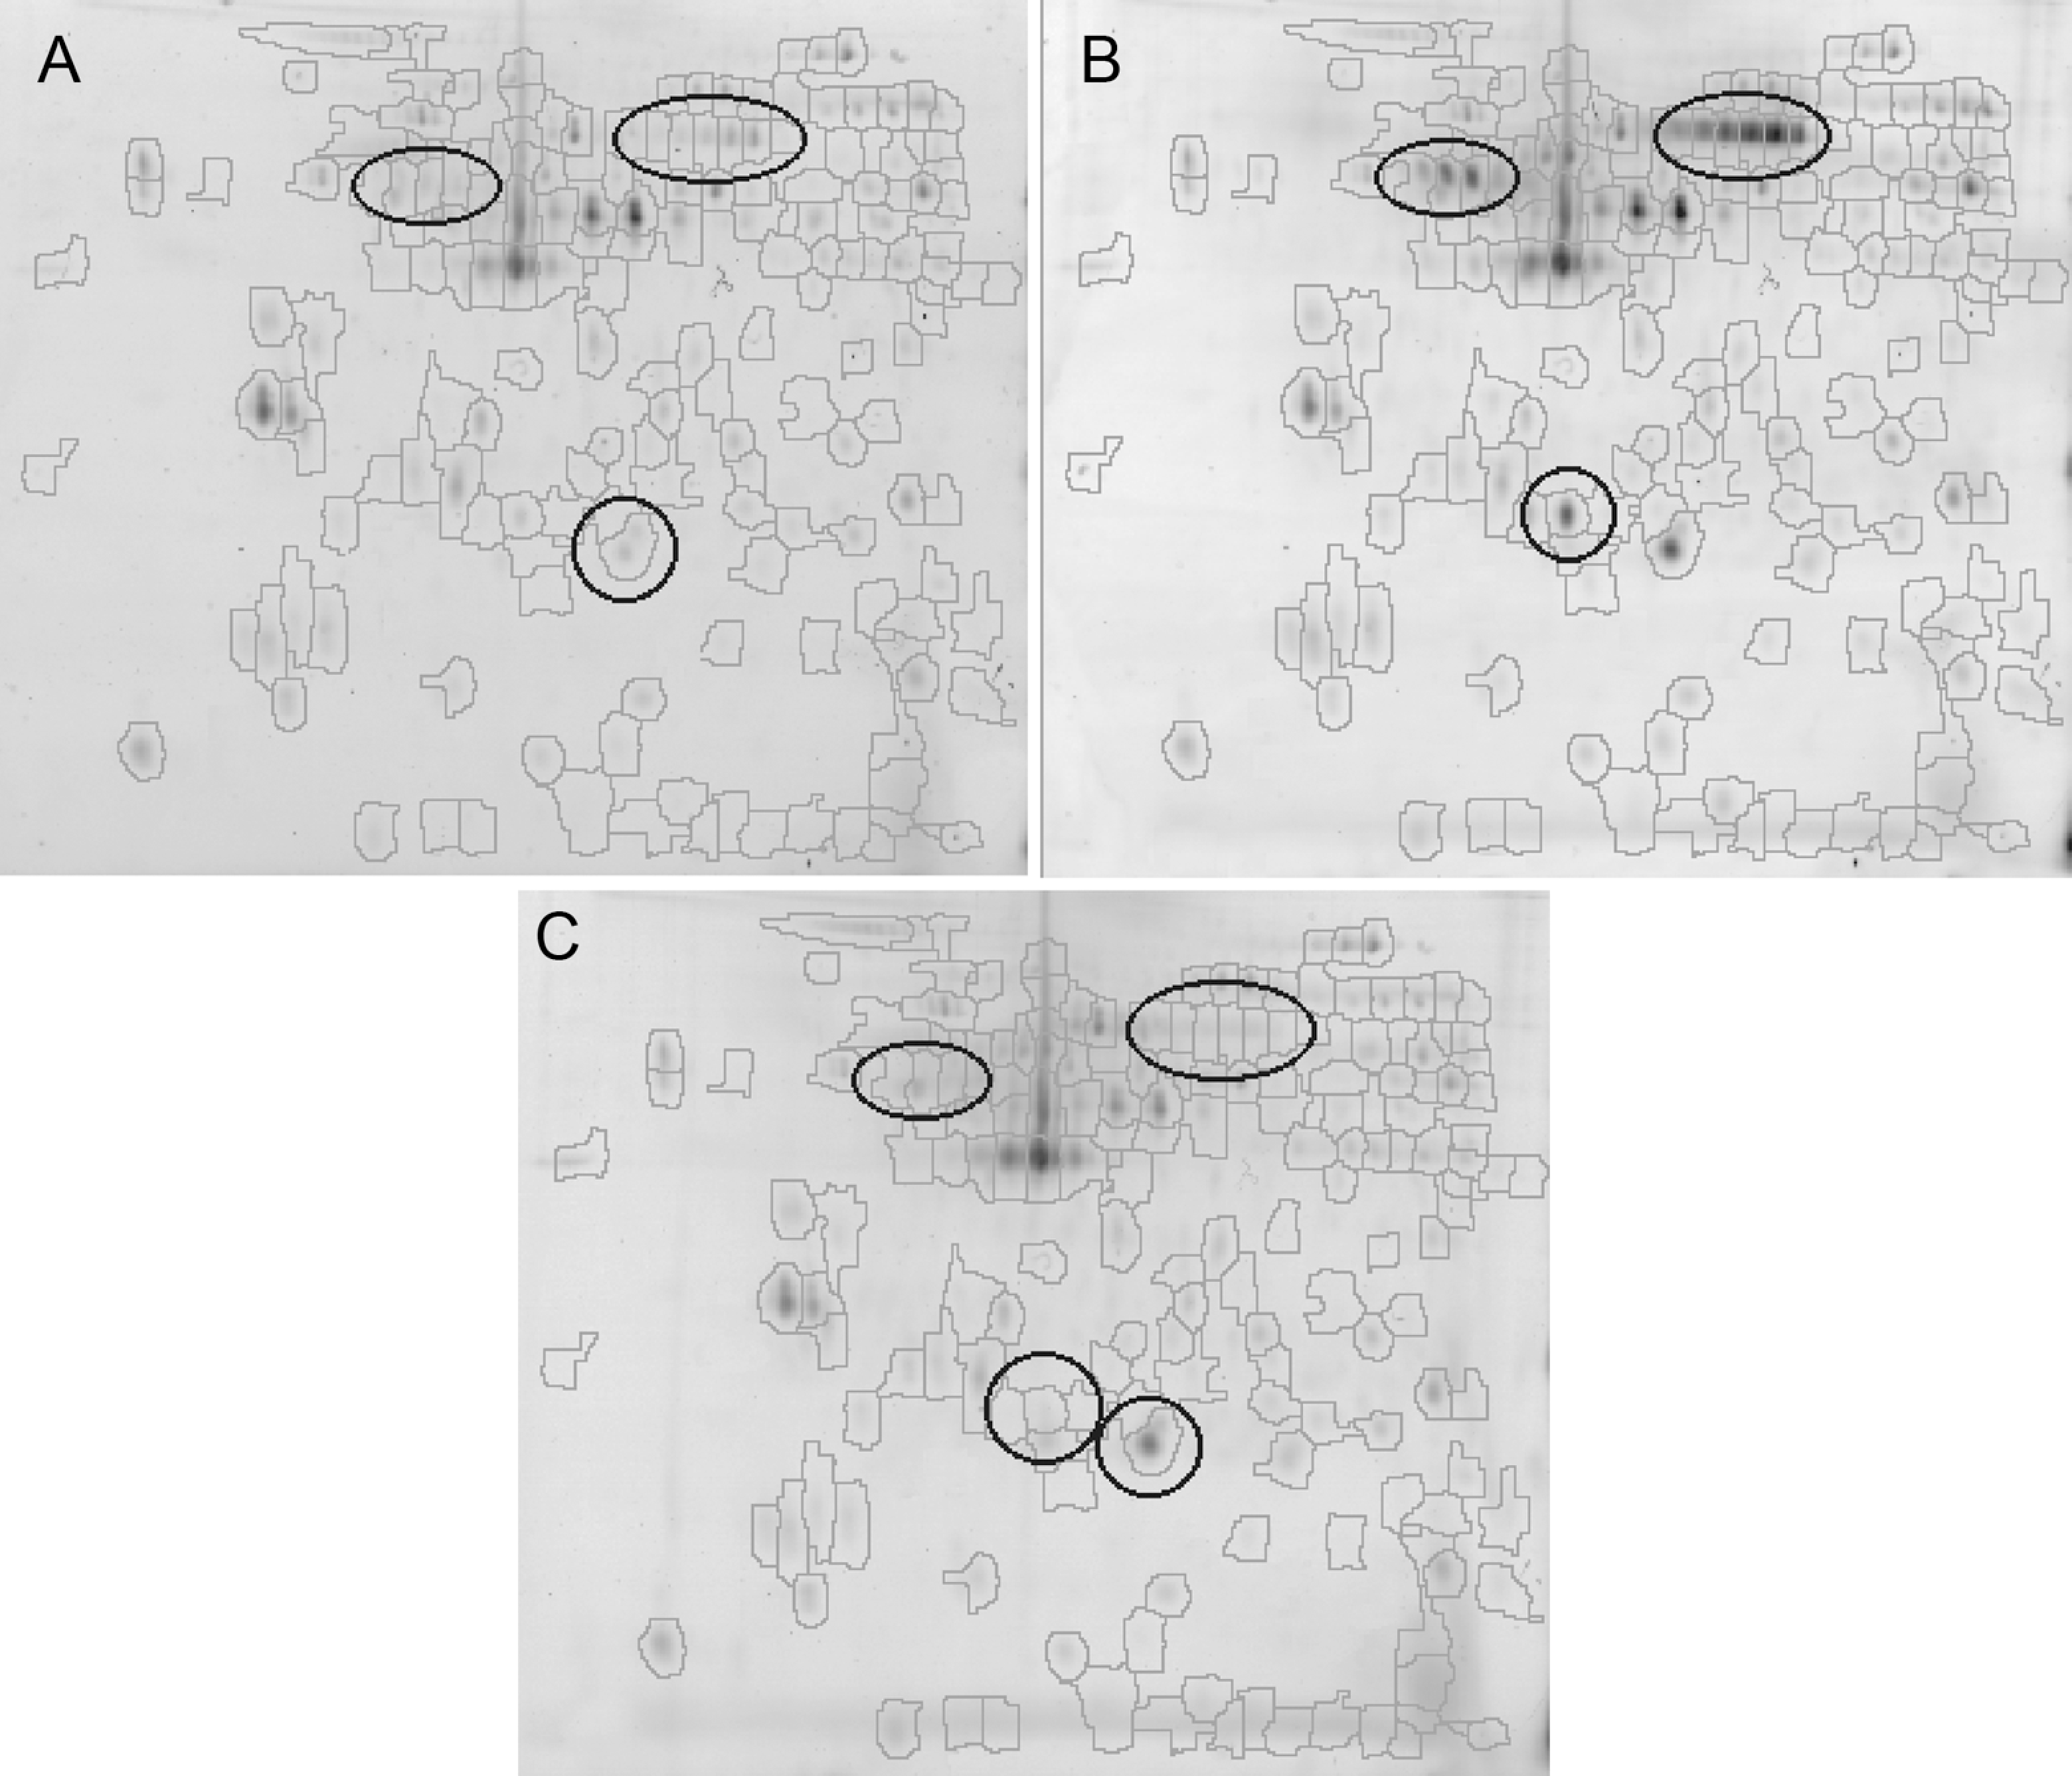
Results of 2D separation of platelet proteome corresponding to samples representative for nondialyzed (A), hemodialyzed (B), and healthy participants (C). Only peptides with isoelectric point (pI) between 4 and 7 are present in the figure. Codetected spots are outlined on each gel. In total, 169 spots were codetected. Regions of highest changes in peptide expression are also marked.
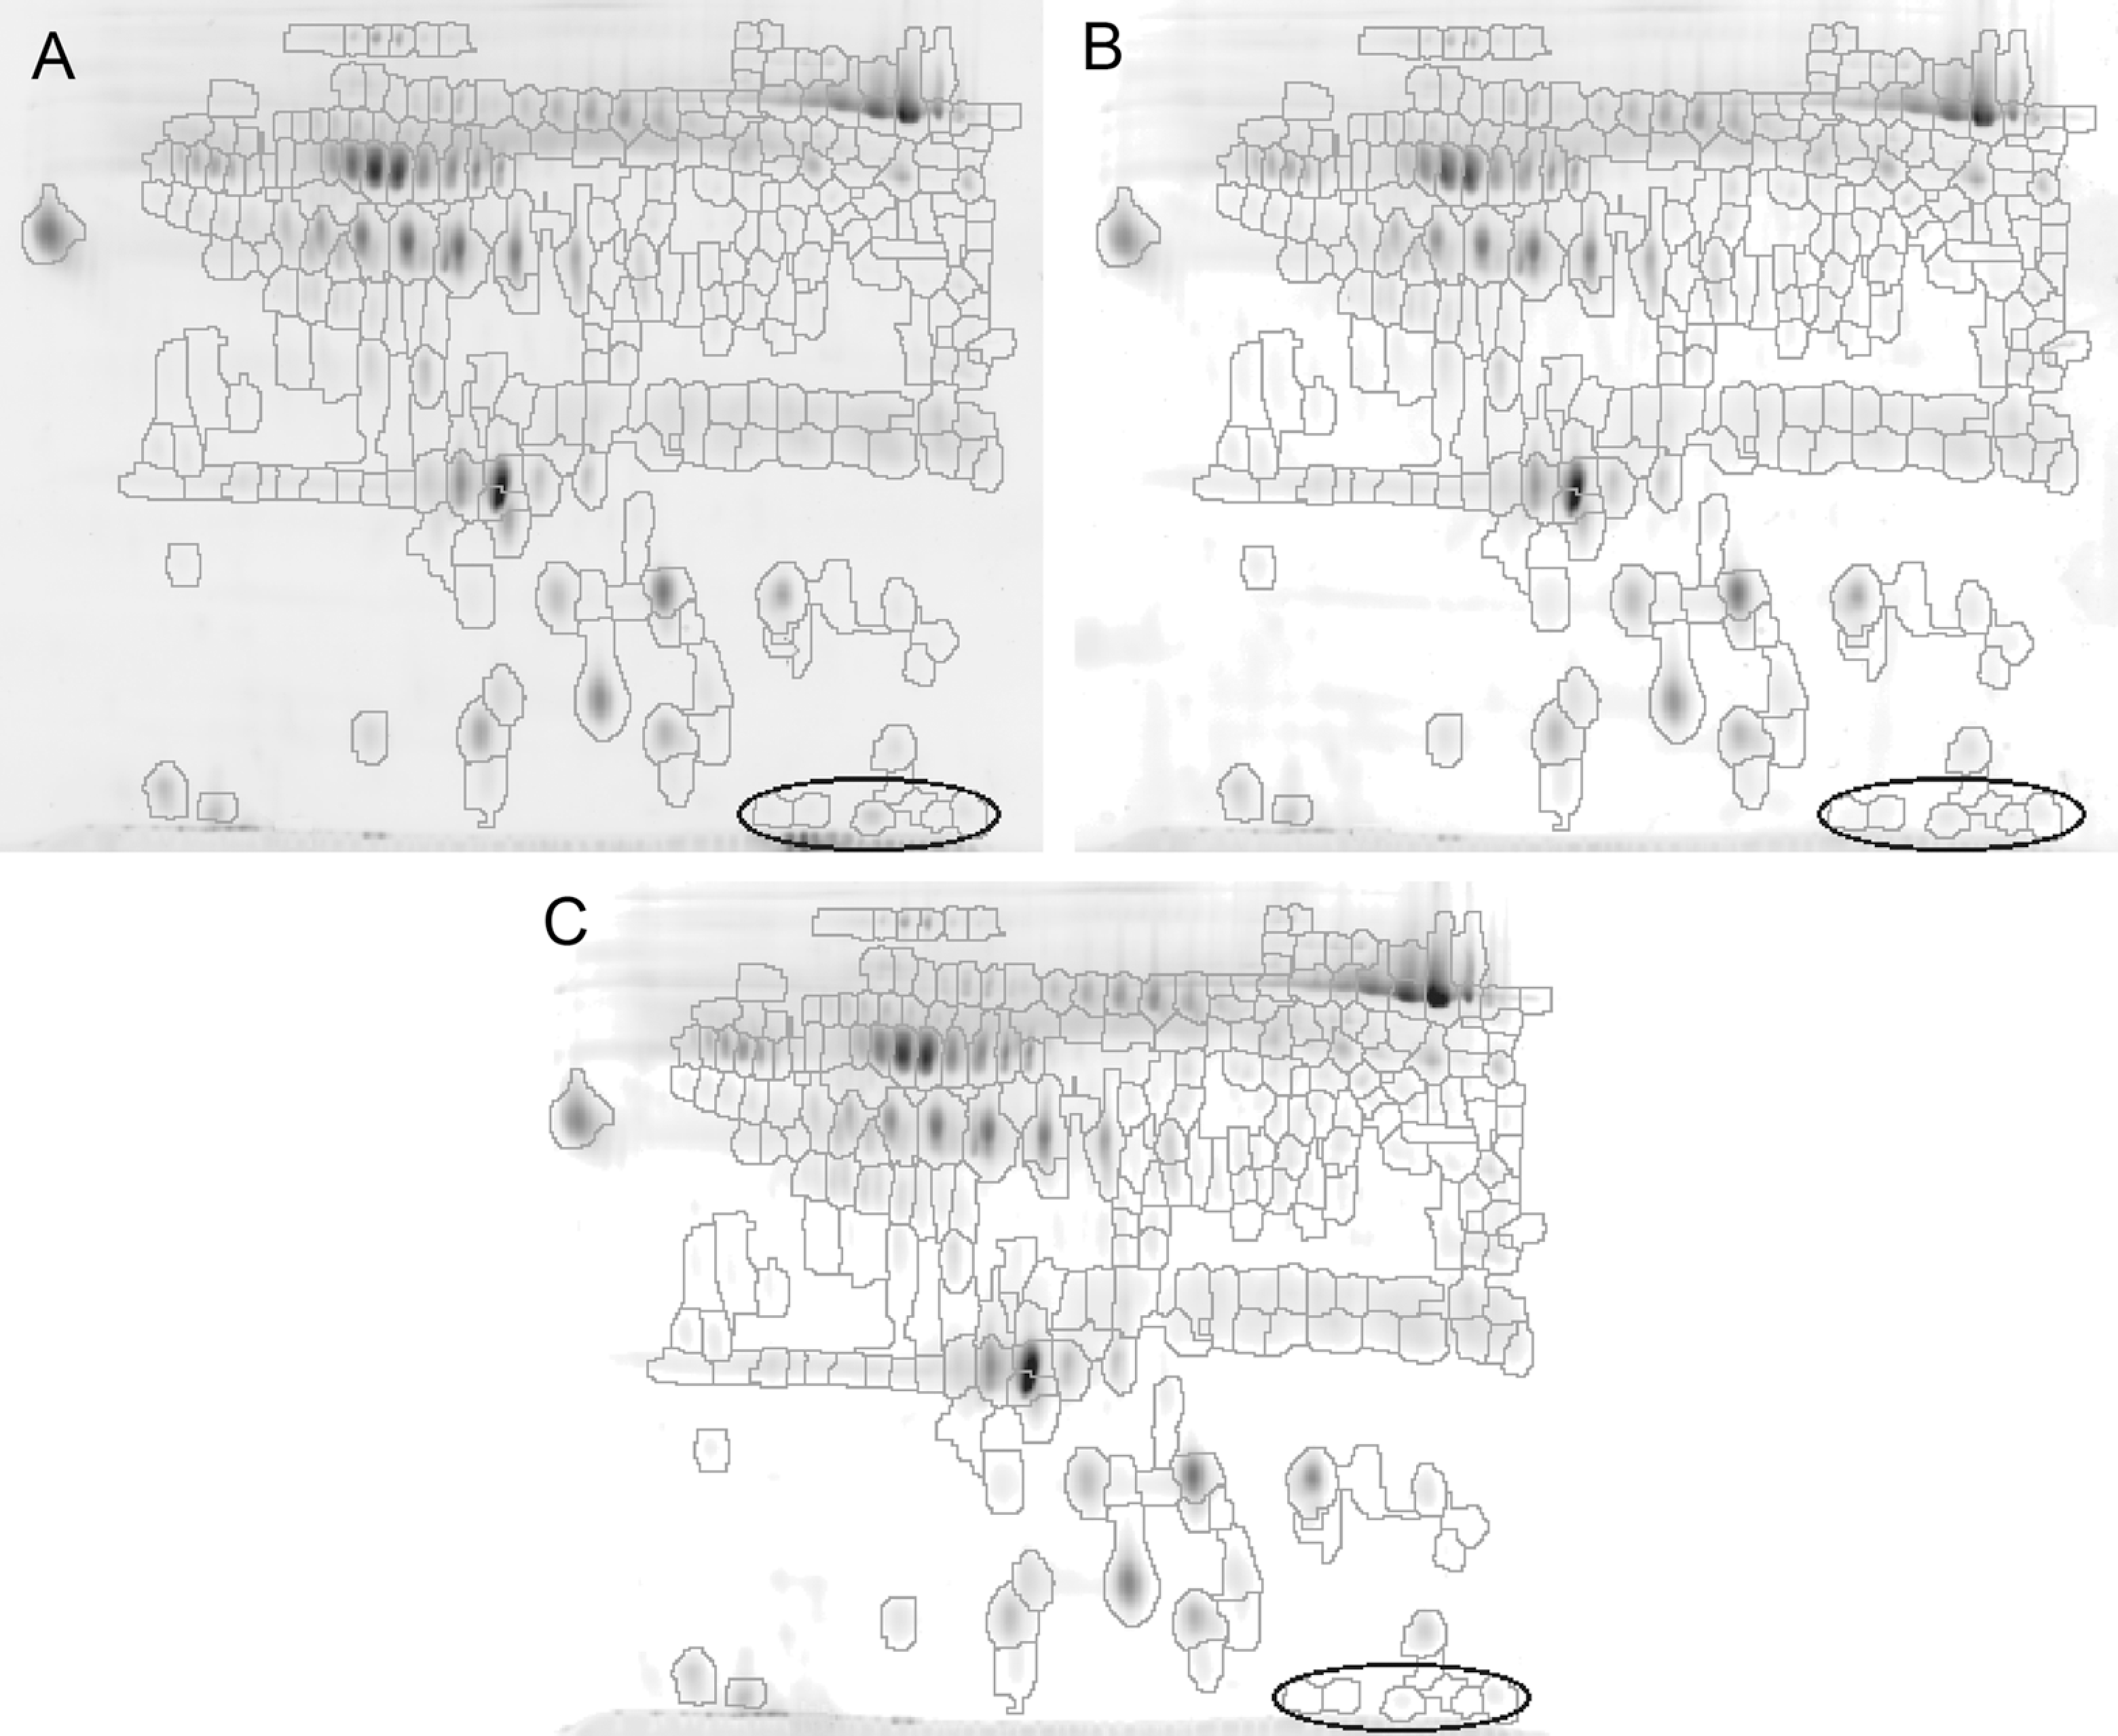
Results of 2D separation of sera proteome corresponding to samples representative for nondioalyzed (A), hemodialyzed (B), and healthy participants (C). Only peptides with isoelectric point (pI) between 4 and 7 are present in the figure. Codetected spots are outlined on each gel. In total, 257 spots were codetected. Region of highest increase in peptide expression is also marked.
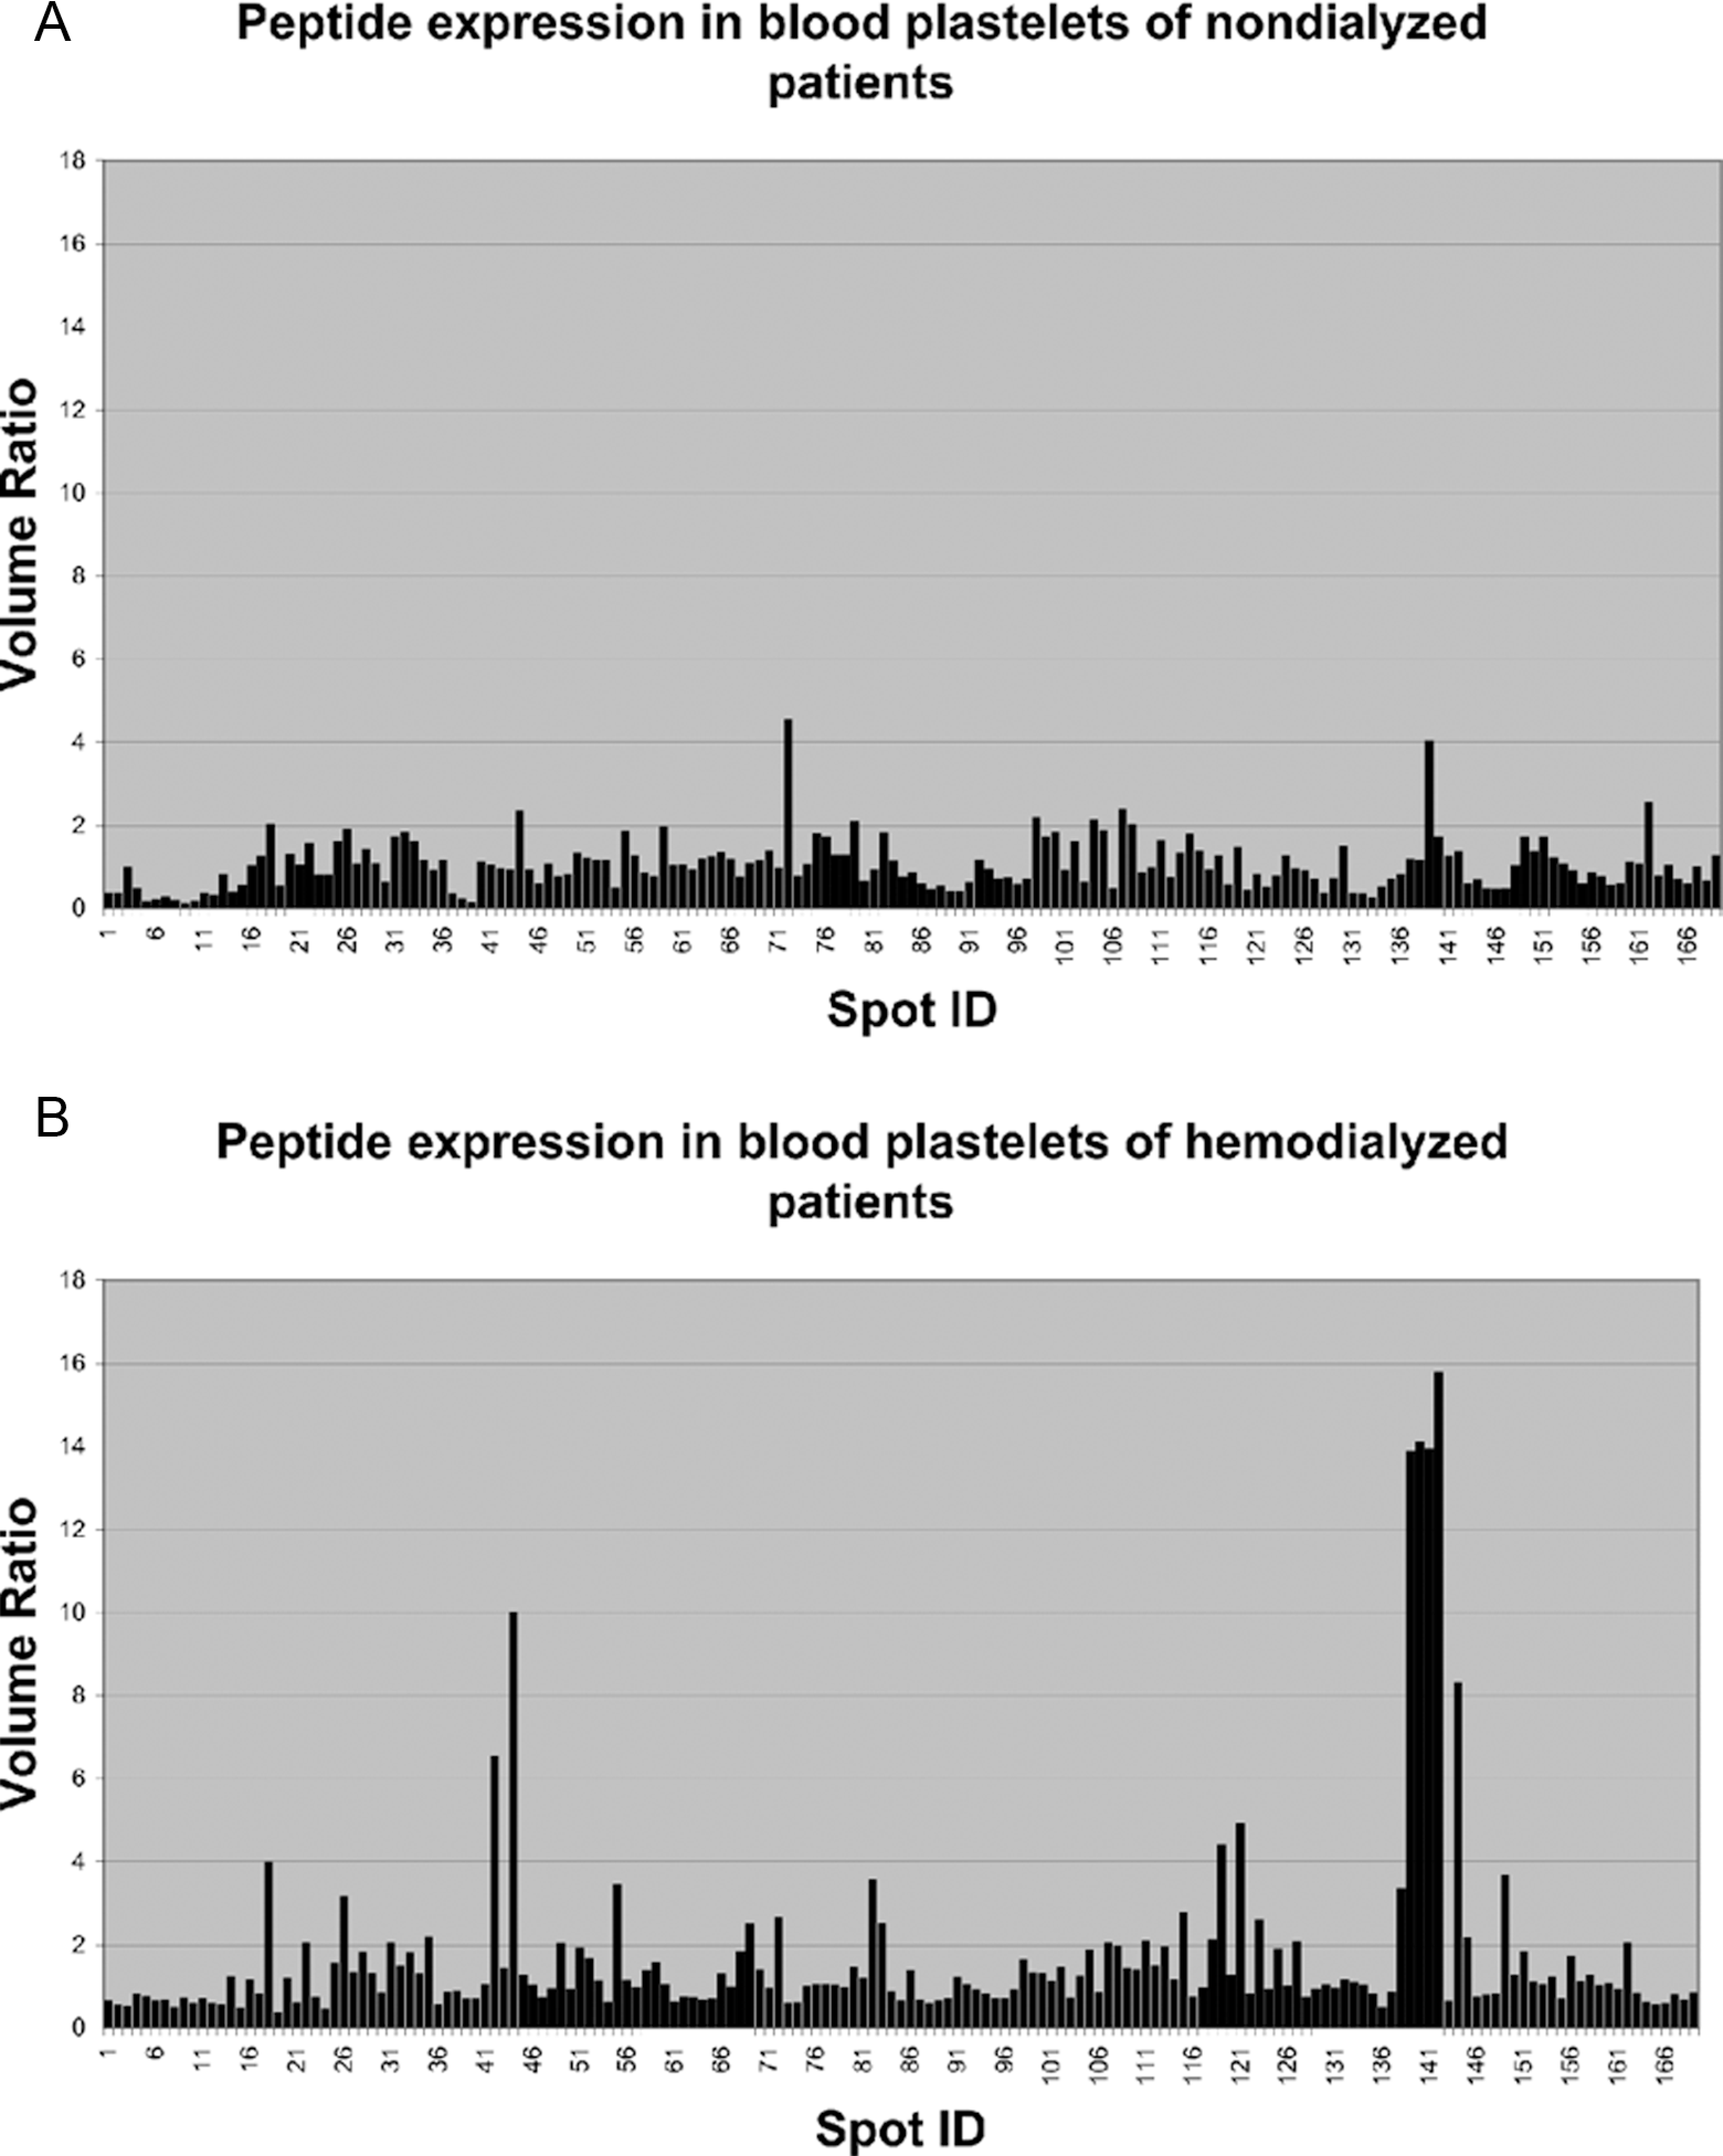
Peptide expression profile obtained for blood platelets of nondialyzed (A) and hemodialyzed (B) patients. The volume ratio describes the quantity ratio of a peptide found in the sample with respect to the amount of this peptide in a sample representative for healthy participants.
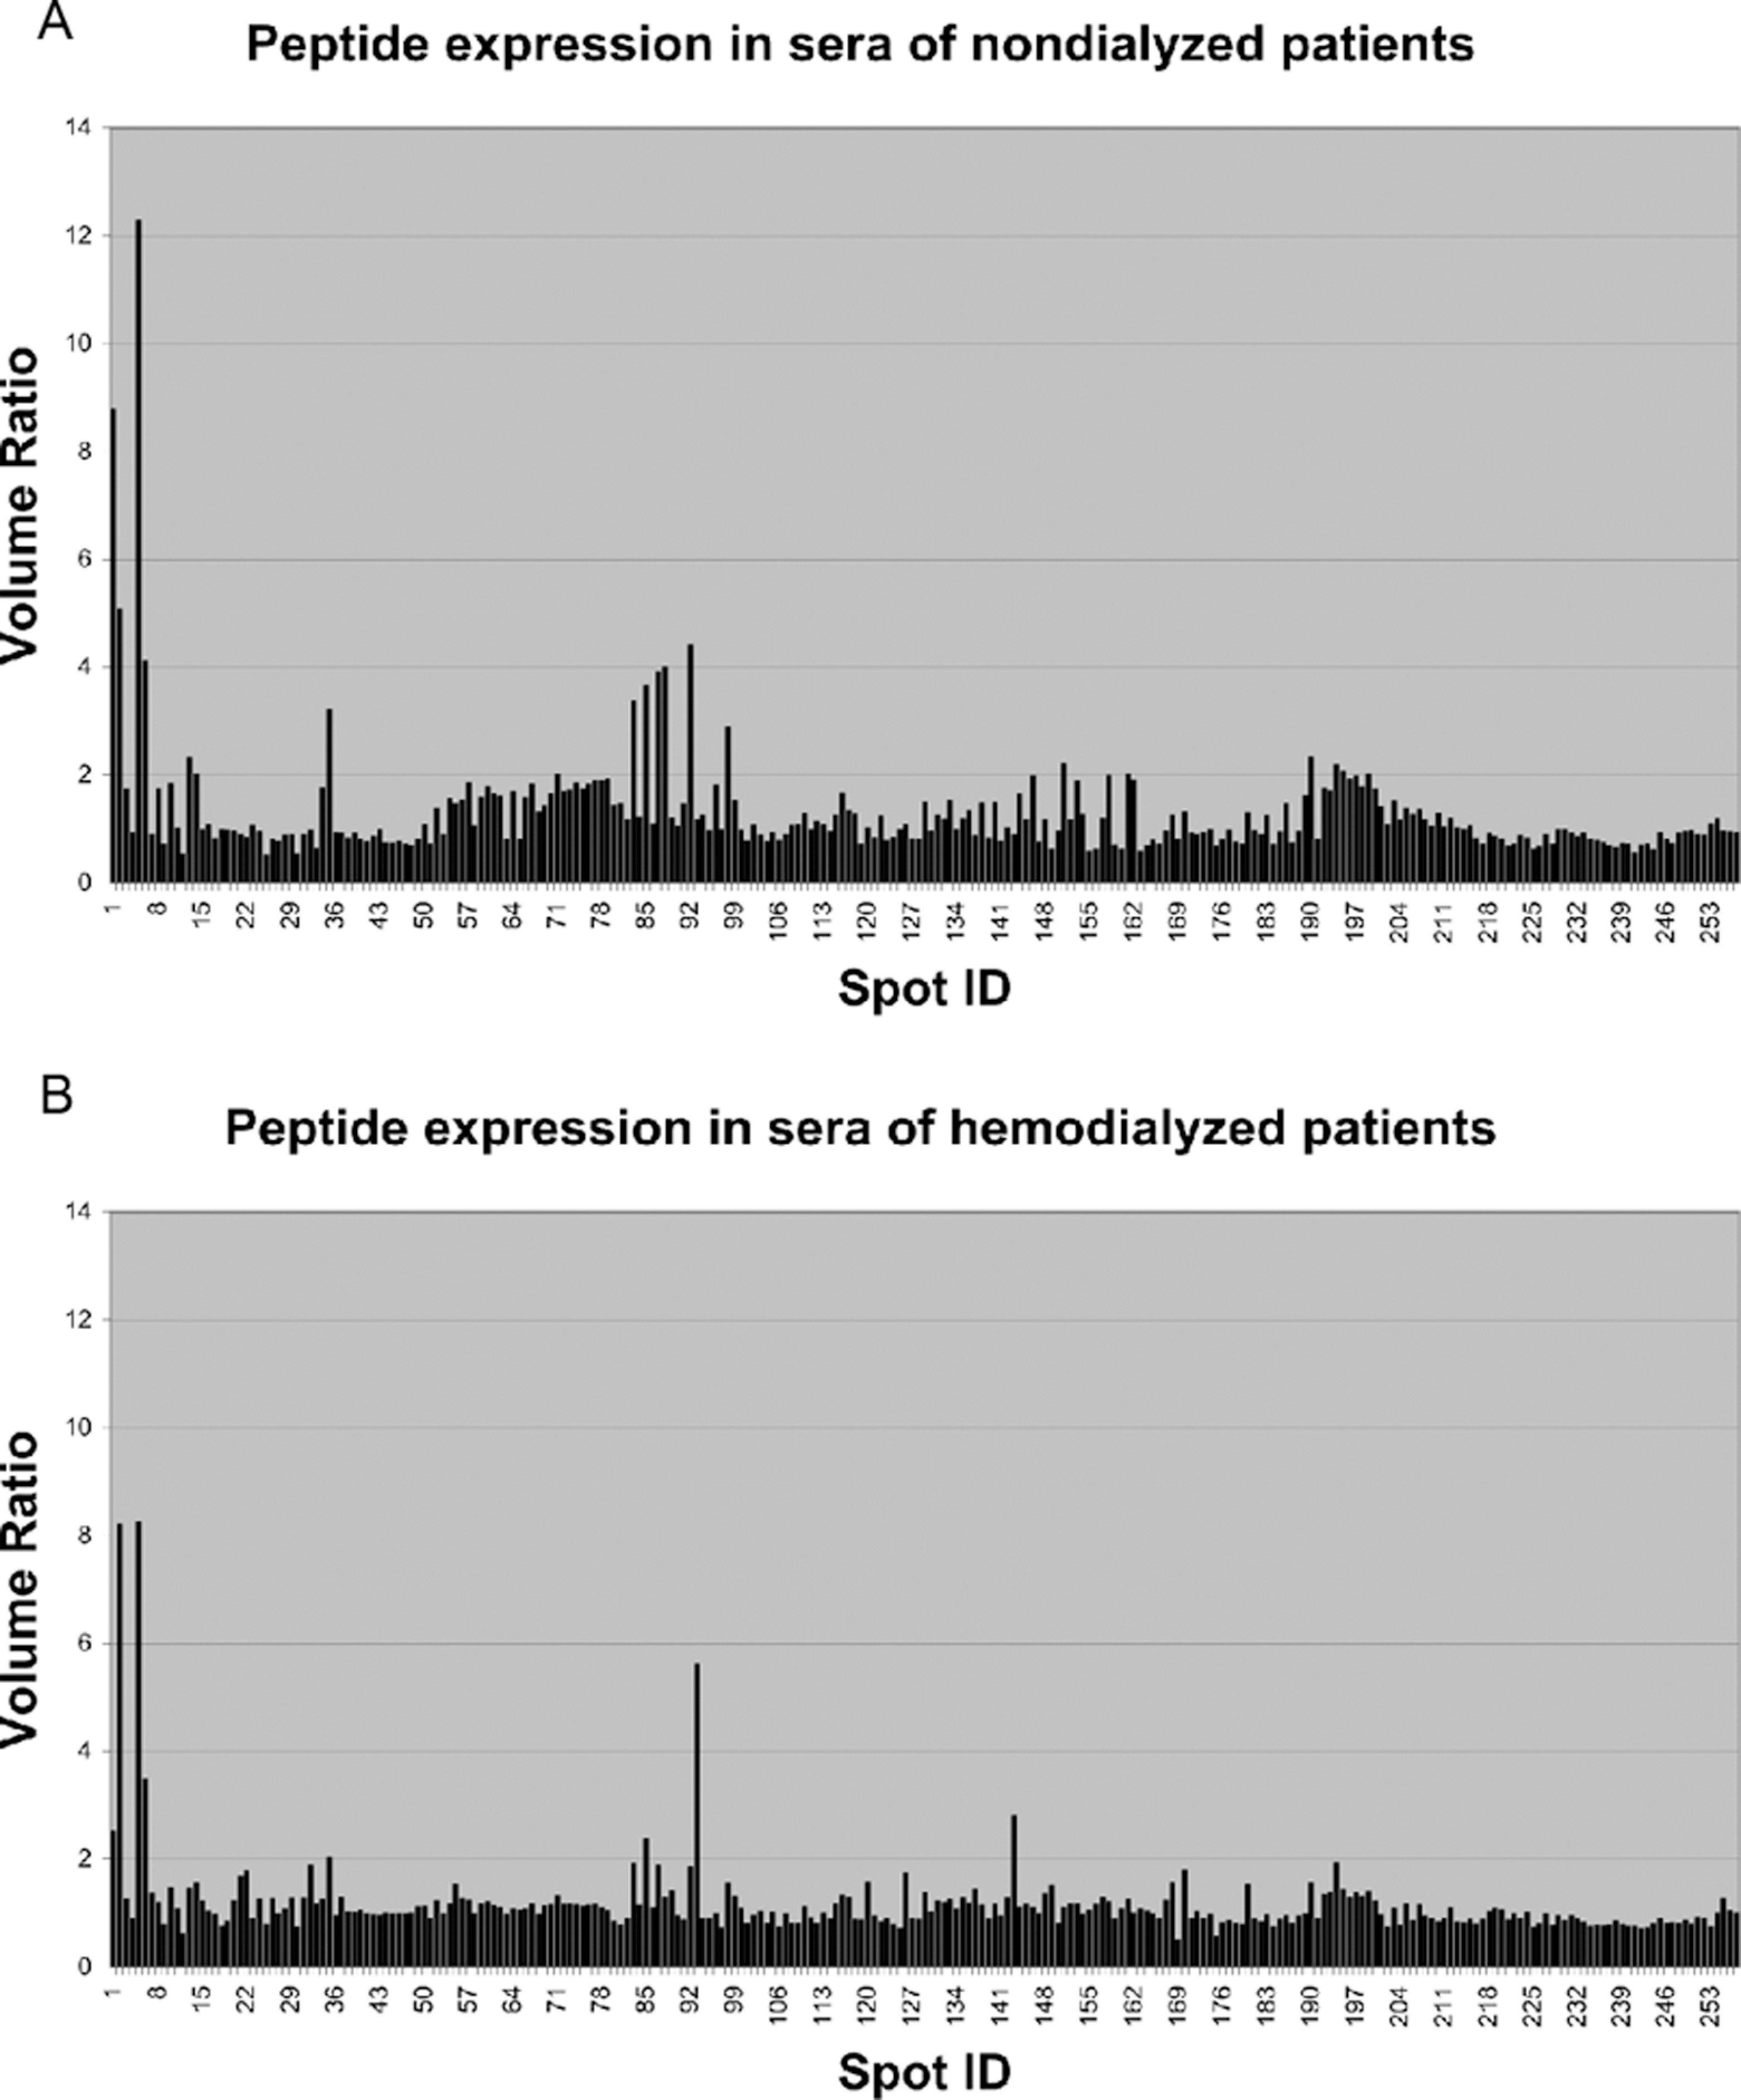
Peptide expression profile obtained for sera of nondialyzed (A) and hemodialyzed (B) patients. The volume ratio describes the quantity ratio of a peptide found in the sample with respect to the amount of this peptide in a sample representative for healthy participants.
A 2-fold increase or decrease in peptide expression, in relation to control group peptides, is usually considered to be significant. Taking into account the above and results of ANOVA analysis for each class of the gels analyzed, in relation to the control gels, we found that 23 peptides were significantly overexpressed in platelets of hemodialyzed patients. Furthermore, among these the expression of 4 peptides was more than 10 times higher than in the control group (Table 1 ). For the group of patients treated conservatively, only 6 peptides were found with increased expression, and differences in relation to the control group were less than 5 times higher (Table 2 ). On the other hand, for these patients 18 peptides with reduced expression in comparison with the control group were found, while for hemodialyzed patients only 1 such peptide was found (Table 2). Areas where the largest changes in the peptide expression were observed are shown in Figure 1.
Summary of ANOVA Test Selected (P < .05) Peptides With Increased Expression Present in the Platelet Proteome of Patients With Uremia.a
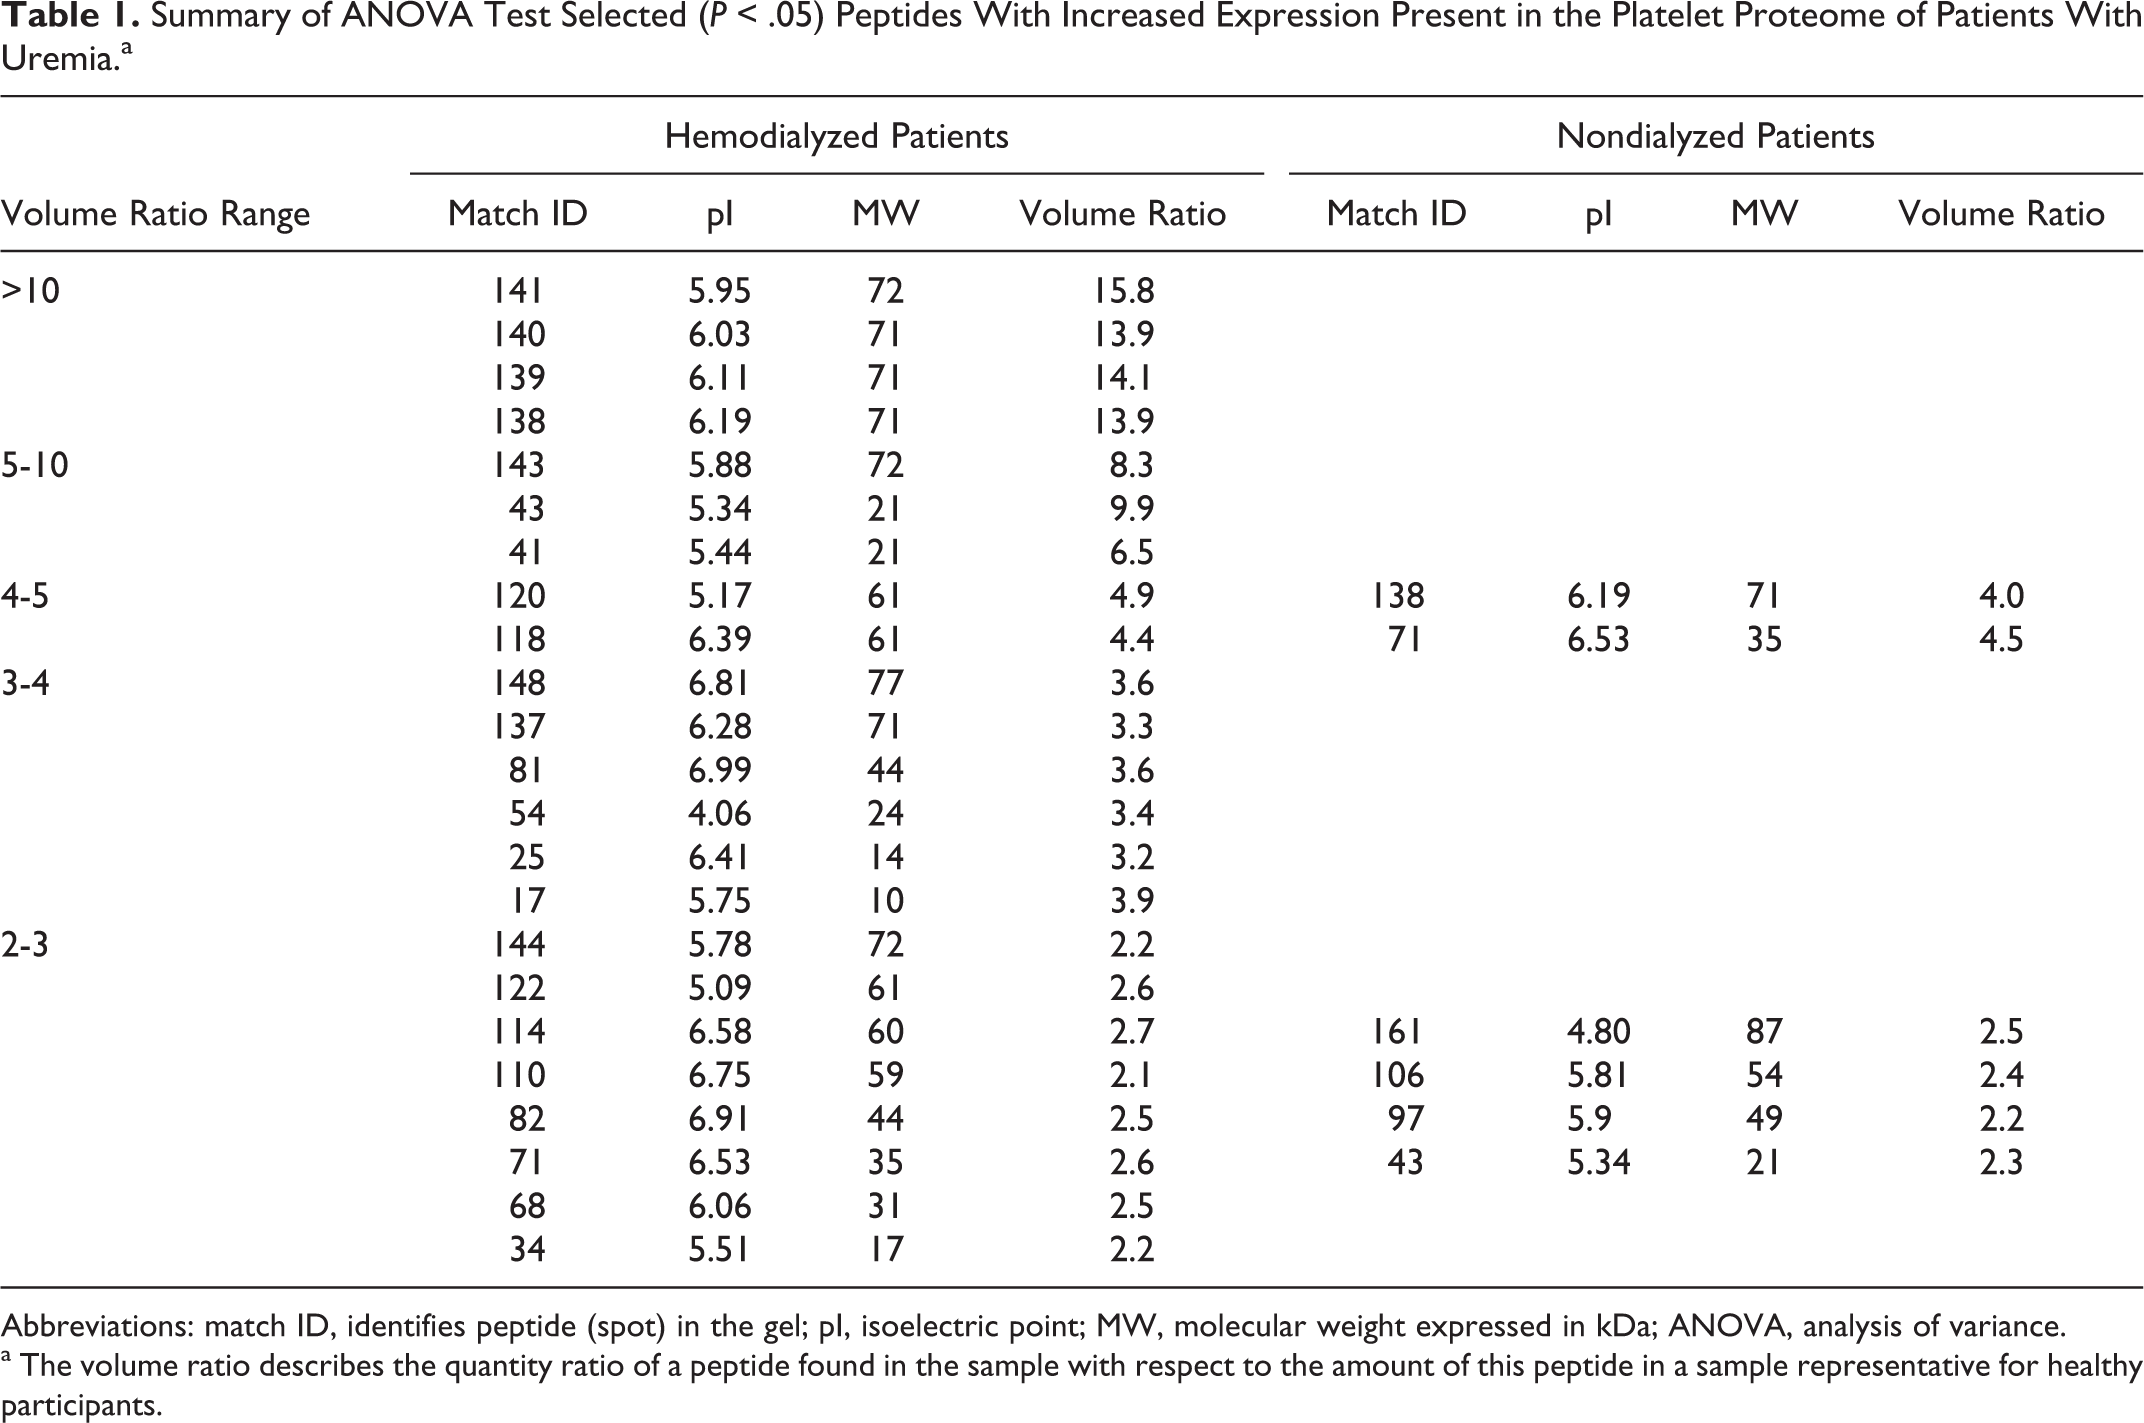
Abbreviations: match ID, identifies peptide (spot) in the gel; pI, isoelectric point; MW, molecular weight expressed in kDa; ANOVA, analysis of variance.
a The volume ratio describes the quantity ratio of a peptide found in the sample with respect to the amount of this peptide in a sample representative for healthy participants.
Summary of ANOVA Test Selected (P < .05) Peptides With Decreased Expression Present in the Platelet Proteome of Patients With Uremia.a
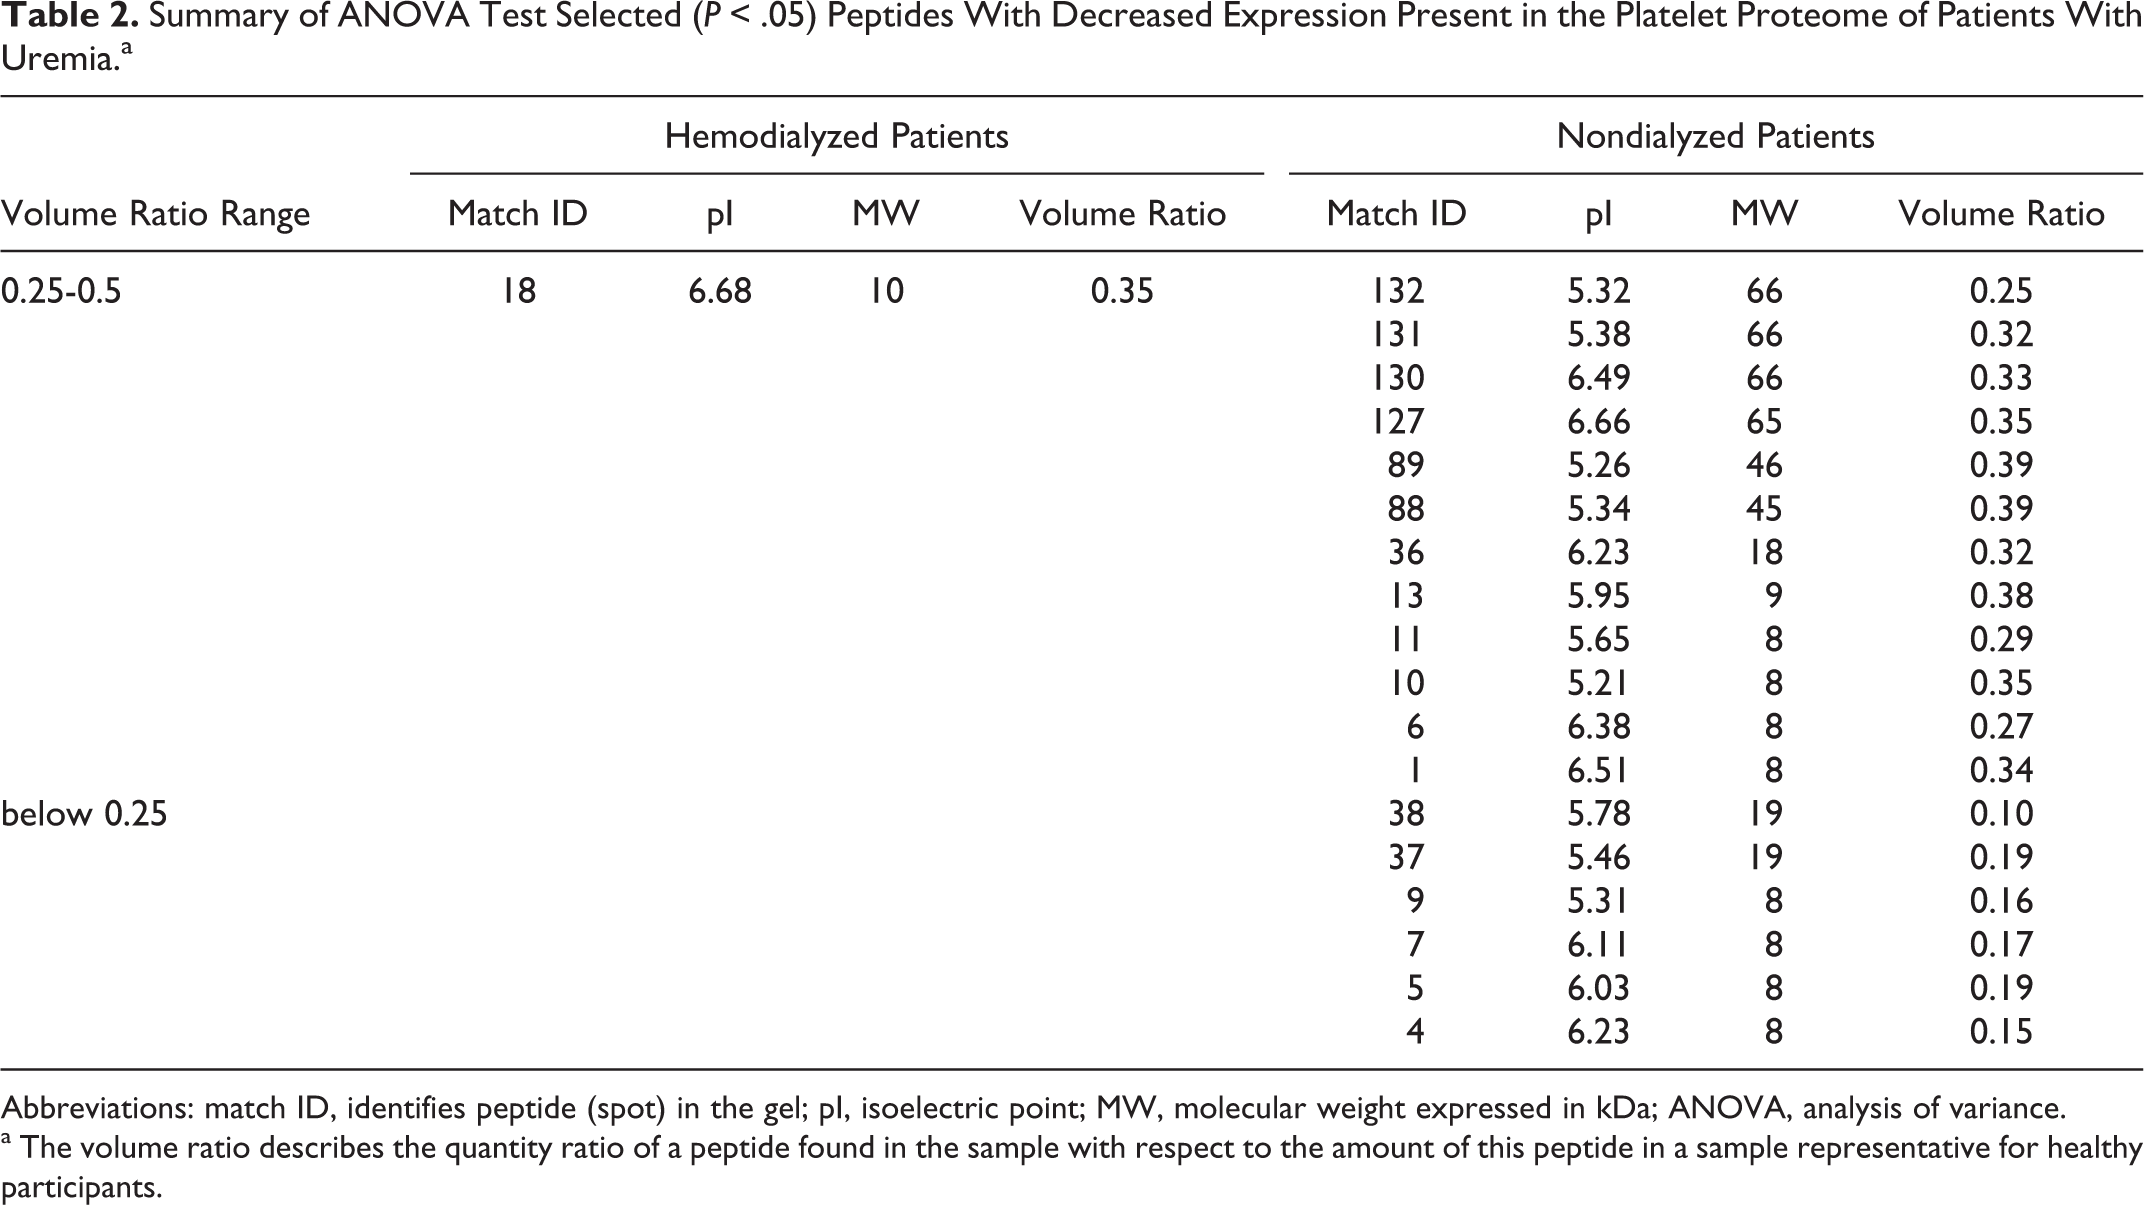
Abbreviations: match ID, identifies peptide (spot) in the gel; pI, isoelectric point; MW, molecular weight expressed in kDa; ANOVA, analysis of variance.
a The volume ratio describes the quantity ratio of a peptide found in the sample with respect to the amount of this peptide in a sample representative for healthy participants.
Similar analysis of sera peptide profiles showed only 6 peptides with increased expression in patients undergoing hemodialysis, while 15 peptides with increased expression in the sera of patients treated conservatively were found. Most of these peptides, for which the increase in expression was 3-fold or higher, were characterized by low molecular weight that was on average approximately 10 kDa and did not exceed 30 kDa (Table 3 ). The area with the highest overexpression is shown in Figure 2 . The decrease in peptide expression in sera was small and statistically irrelevant.
Summary of ANOVA Test Selected (P < .05) Peptides With Changed Expression Present in the Sera Proteome of Patients With Uremia.a
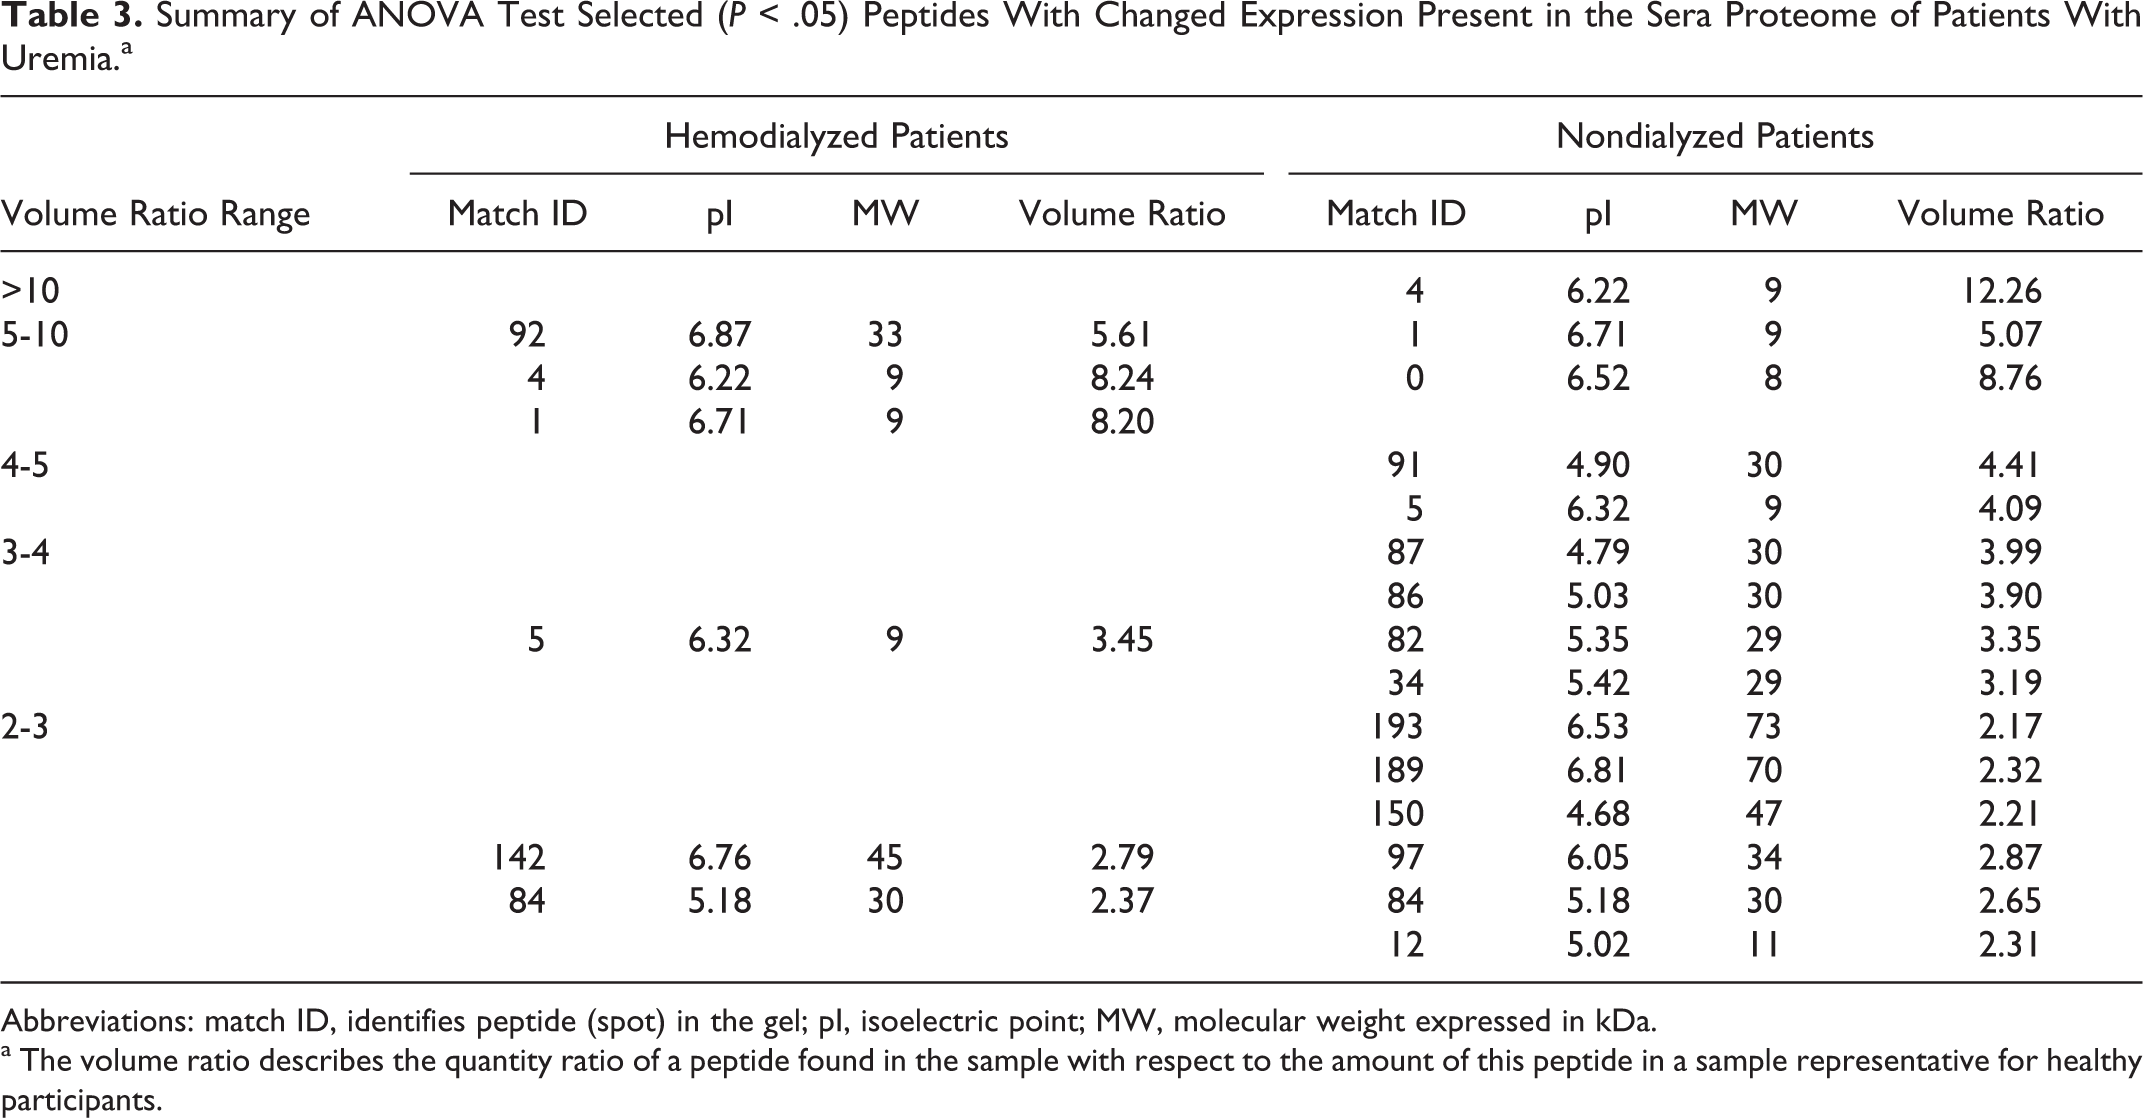
Abbreviations: match ID, identifies peptide (spot) in the gel; pI, isoelectric point; MW, molecular weight expressed in kDa.
a The volume ratio describes the quantity ratio of a peptide found in the sample with respect to the amount of this peptide in a sample representative for healthy participants.
Discussion
The results obtained indicate that the process of hemodialysis significantly affects the platelet proteome profile. A very significant increase in the presence of several peptides was observed, which can result in functional changes in these platelets. Although many attempts were made to identify these peptides using mass spectrometry, these efforts were unfortunately unsuccessful at this stage. The amounts of peptides that were present in our analytical gels were too low for the method of identification used and the results were not conclusive.
Despite the lack of peptide identification, it is worthy of note that some peptides are overexpressed in blood platelets of both hemodialyzed and nondialyzed patients (eg, peptides marked as 138, 71, or 43), although the volume ratio is markedly different in each case. This suggests the presence of some common intracellular mechanisms, which are more closely associated with uremia metabolism than with the process of hemodialysis. However, the vast majority of overexpressed peptides is attributed to blood platelets of hemodialyzed patients, which in turn indicates metabolic changes caused by the dialysis process, including EPO treatment. On the other hand, a large number of suppressed peptides in the platelets of conservatively treated patients can be related to downregulation of several intraplatelet mechanisms found in them. 1 –3 The changes described here, regarding blood platelet proteome of hemodialyzed patients, are not an isolated occurrence. For example, hemodialysis significantly contributes to remodeling of erythrocyte membrane proteome and overexpression of stress markers. 14
It is also worth noting that the sera of patients treated conservatively had significantly higher content of numerous peptides, most of which had a mass of about 10 kDa. This is consistent with other observations indicating the presence of toxins in uremic plasma, including peptides derived from the process of metabolism. 4,15 However, it should be emphasized, that some of these peptides (marked as 1, 4, 5, and 84) were also present in elevated amounts in sera of hemodialyzed patients before hemodialysis. This indicates that within the interdialysis period these peptides are accumulated effectively in the plasma of hemodialyzed patients. Moreover, some of them can reach similar or even higher (see peptide 1) concentrations than in the plasma of nondialyzed patients. A similar interdialysis accumulation effect has been reported recently, 16 where characteristic differences were observed in the predialytic serum composition and corresponding postdialytic serum or serum from healthy donors.
The observed overexpression of identical blood platelet peptides, common for both hemodialyzed and conservatively treated patients suggests that the same mechanisms are involved in uremic patients regardless of the treatment method. Taking into account common and significant overexpression of another set of peptides present in the sera of both groups of patients with uremia, it should be considered rather as a possible effect present at the stage of megakaryocytopoiesis instead of an effect of change in process regulation in blood platelets, at least in respect of these common peptides. The other overexpressed platelet peptides may represent changes at both platelet and megakaryocytopoiesis levels.
An appropriate starting point of this study was a previously reported observation by the authors, regarding significant changes in platelet proteome profile in patients treated with hemodialysis, particularly in the presence of a significant excess of low-molecular-weight peptides in a wide range of pH.
10
On the basis of this, the following 2 hypotheses were formulated: The first hypothesis assumes that hemodialysis can trigger an apoptosis-like process in platelets and as a result of this platelets undergoing apoptosis could accumulate a significant amount of low-molecular-weight degradation products of proteins. The second assumes the possibility of inducing structural changes in the platelet membrane, that can result from the process of hemodialysis (platelets exposed to contact with artificial surfaces), responsible for the accumulation of low-molecular-weight products of metabolism.
The previous work of the authors
12
confirmed in part the veracity of the first hypothesis. It has been shown that patients treated with hemodialysis have a significantly higher percentage of platelets exhibiting apoptotic features when compared to patients treated conservatively and to healthy participants. Thus, we decided to check whether peptides reported earlier,
10
which are abundantly present in the platelet proteome of hemodialyzed patients, were collected from plasma or are the result of apoptosis.
Unfortunately, the results of the first 2D separations performed for protein material currently isolated from the platelets of patients undergoing hemodialysis were shocking. This was due to the fact that no increase in concentration of peptides with a molecular weight of approximately 10 kDa, in the full range of pH 4 to 7, was observed. This was very surprising as such peptides were the most important characteristic for hemodialyzed patients in the previous study. After subsequent 2D separations, it was confirmed that for the current platelets of hemodialyzed patients the previously described effect did not occur.
Following this a thorough and detailed analysis of the hemodialysis treatment and experimental conditions used to isolate platelets was carried out, which focused on both the present work and the previous study. 10 This lead to the conclusion that there is only 1 dissimilarity between the 2 studies, however this is an important fundamental difference. In the previous study, platelets were obtained from patients who underwent hemodialysis with reused dialyzers, while patients receiving dialysis in the present research were hemodialyzed using single-use dialyzers. Whether or not this 1 factor can have such a profound effect on the results of 2D separations remains unclear.
Recently, there has been much discussion on the safety of reused dialyzers. There are 3 important factors concerning their use: economic, environmental, and reducing the risk of the so-called first use syndrome, that is, a rare but severe anaphylactic reaction to an artificial kidney. The economic and environmental factors are obvious and are not the subject of discussion. Repeated use of the same dialyzer is more economical and results in significantly lower amounts of waste. It has been indicated that the third factor may be beneficial to the patient, as any new dialyzer and consequently a new membrane may activate the complement system. However, the reuse of dialyzers is associated with allergic reactions, 17 which means that the surface of such a regenerated dialyzer is not free of residues from previous treatments, including small peptides. This has been confirmed by the observed reduction in water permeability that increases with prolonged use of the same dialyzer. 18,19 A recent report describes the presence of large amounts of various proteins adsorbed to dialyzer surfaces. 20 Consequently, the dialyzer pores become clogged and their surfaces get covered by residual protein molecules from previous treatments. As a result of this, it is possible that low- and medium-molecular-weight peptides, which have accumulated over a large area of the dialyzer, are collected by platelets during contact with the reused dialyzer surface in the course of hemodialysis.
Unfortunately, in the present work we could not check the veracity of this hypothesis due to the fact that in all the local kidney dialysis stations, at present only single-use dialyzers are used.
In conclusion, it should be noted that the process of hemodialysis significantly modifies the platelet proteome profile. As a hypothesis, with regard to single dialyzer use, one can say that in this case the changes in platelet proteome are not as dramatic as those of reused dialyzers.
Footnotes
Declaration of Conflicting Interests
The author(s) declared no potential conflicts of interest with respect to the research, authorship, and/or publication of this article.
Funding
The author(s) disclosed receipt of the following financial support for the research, authorship, and/or publication of this article: project No. N N401 227434.