
Abstract
Background: Rapid identification of clinically relevant coagulopathies in, acute coagulopathy of trauma shock (ACOTS) has led to the development of faster point-of-care viscoelastic whole-blood-based tests like rapid thrombelastography (RapidTEG). The sensitivity of RapidTEG to detect hyperfibrinolysis, as compared to standard KaolinTEG, is unknown. To investigate this, the ability of RapidTEG, KaolinTEG, and functional fibrinogenTEG (FFTEG) to detect tPA-induced (tissue plasminogen activator) lysis in whole blood from healthy individuals was investigated. Our hypothesis was that the initial powerful clot formation in the RapidTEG assay would reduce the sensitivity as compared to the normally used KaolinTEG assay. We also evaluated the FFTEG assay. Methods: In vitro comparison of the sensitivity of RapidTEG, KaolinTEG, and FFTEG to 1.8 nmol/L tPA in citrated whole blood (299 ± 23 ng/mL plasma) induced hyperfibrinolysis in 10 healthy individuals and duplicate titration of the tPA whole blood (WB) concentration from 0.09 to 7.2 nmol/L (14-1144 ng/mL plasma) in 1 healthy donor. Results: At 1.8 nmol/L tPA, KaolinTEG, RapidTEG, and FFTEG all detected fibrinolysis but with different sensitivities. In the titration study, KaolinTEG and FFTEG displayed a continuous dose–response association and RapidTEG also displayed a dose-dependent response but only for higher levels of tPA, thus yielding a smaller “dose-sensitive range” compared to KaolinTEG and FFTEG. Conclusion: This pilot study demonstrated that KaolinTEG, RapidTEG, and FFTEG all were able to detect lysis at 1.8 nmol/L tPA but with a difference in sensitivity. Furthermore, KaolinTEG and FFTEG showed a continuous dose dependence related to the tPA concentration, whereas RapidTEG only detected lysis at higher tPA concentrations.
Keywords
Introduction
The trauma remains the most common cause of death during the first 4 decades of life with hemorrhage accounting for 40% of these. 1 Several studies have reported that one fourth of trauma patients present with an acute or early coagulopathy at admission to the trauma bay, according to prolonged conventional plasma-based coagulation tests like the international normalized ratio (INR), prothrombin time (PT), and activated partial thromboplastin time (aPTT). This acute coagulopathy of trauma shock (ACOTS) is associated with a 4-fold increase in mortality.1 –4 The pathophysiologic mechanisms contributing to ACOTS remain intensively studied although there are no clear answers. 5 Some of the suggested important mechanisms are enhanced protein C activation and hyperfibrinolysis caused by tissue injury and shock, which are proposed to be drivers of an entity designated ACOTS.5 –8 Recently, the endothelium has been proposed as an important contributer, 9 and it has also been shown that ACOTS occur before appreciable fluid administration and vasopressor or colloid use. 10
Given that early traumatic coagulopathy increases the risk of massive hemorrhage, early diagnosis, and goal-directed therapy of this entity is of pivotal importance. In this regard, assessment of hemostasis in whole blood by thrombelastography (TEG) and Rotation Thromboelastometry (ROTEM) is today considered as the gold standard to monitor and direct transfusion therapy in massively bleeding patients.9 –12 Importantly, whole blood viscoelastic assays have been reported to better predict bleeding as well as to reduce the transfusion requirement in patients undergoing major surgery including trauma.12 –14
With the introduction of the rapid thrombelastography (RapidTEG) assay, clot formation is initiated by a combination of tissue factor and kaolin, which accelerates the clotting process by simultaneously stimulating the intrinsic and extrinsic coagulation pathways and thereby shorten the clot initiation time significantly. 16 Thus, earlier identification of coagulopathy might be identified and allow earlier targeted hemostatic therapy. Due to its more powerful clot activation, it can be speculated that RapidTEG may be less sensitive in identifying fibrinolysis and possibly miss some patients with trauma with a lower degree of hyperfibrinolysis and coagulopathy.
No studies have previously evaluated the sensitivity of RapidTEG to hyperfibrinolysis in a laboratory setting. In the present study, we evaluated the ability of RapidTEG, KaolinTEG, and functional fibrinogenTEG (FFTEG) assays to detect tPA-induced hyperfibrinolysis in whole blood from 10 healthy individuals and further investigated the lower limit that produced a signal by tPA titration in 1 healthy donor.
Materials and Methods
Study Participants
The study was conducted in accordance with the Declaration of Helsinki and was approved by the regional ethics committee in Copenhagen, Denmark (protocol number: H-1-2010-100). Written informed consent was obtained from each participant prior to trial entry. Blood was collected from 10 healthy donors: 5 women and 5 men with a mean age of 27.9 ± standard deviation (SD) 5.9 years.
Blood Sampling and Hematology
Blood (12 mL) was obtained by a smooth cubital venipuncture employing minimal stasis and a 21-gauge needle. Blood was collected in a 9 mL anticoagulated sodium citrate (3.2%; Vacuette) tube and a 3 mL EDTA tube (Vacuette). Whole blood was also evaluated for leukocyte count, hemoglobin, hematocrit, and platelet count using a Sysmex SF-3000 analyzer.
Detection of tPA-Induced Fibrinolysis (1.8 nmol/L WB) in Blood From 10 Healthy Donors
Three different TEG assays were performed using citrated whole blood: KaolinTEG, RapidTEG, and functional fibrinogenTEG (FFTEG), all with and without addition of 1.8 nmol/L tPA (final concentration in the TEG cup; American Diagnostica, Stamford, Connecticut; 1-chain recombinant human tPA, molecular weight: 70 kDa, product number: 171). Each analysis with and without tPA was run in duplicate, yielding a total of 12 analyses per study participant (Figure 2). Thawed tPA (5 μL) was mixed with 338 μL of buffer and kept on ice until added to the whole blood samples. To calculate the tPA concentration in plasma, the hematocrit was measured for all donors. The mean ± SD plasma concentration was 299 ± 23 ng/mL.
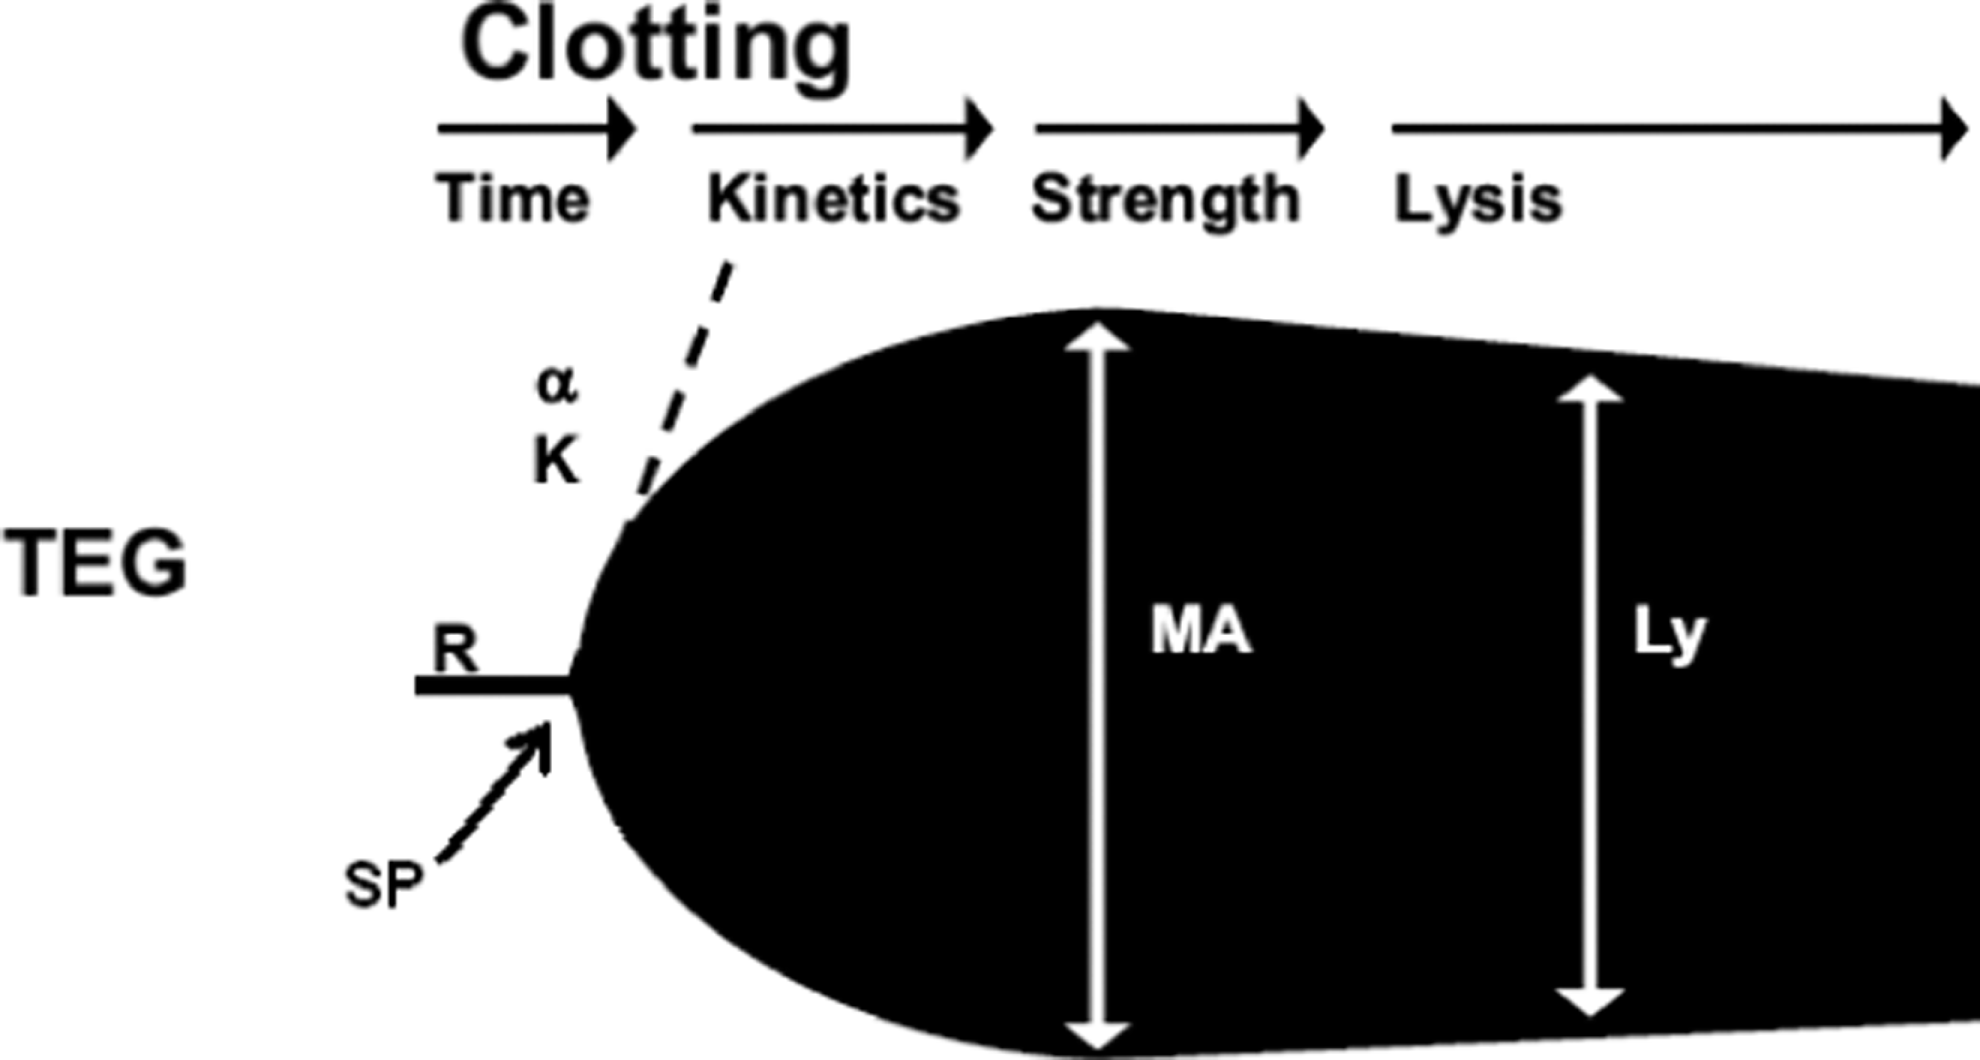
Schematic TEG trace indicating the commonly reported variables; reaction time (R), K-value (K), alpha angle (a), maximum amplitude (MA) and Lysis (LY).
Preparation of RapidTEG/KaolinTEG/FFTEG with tPA
To 1/1/0.5 mL of citrated whole blood was added 9.2/9.0/4.5 μL tPA dilution in a glass/Kaolin-tube/FF-glass and gently mixed (Table 1 ). A 340-μL aliquot of the whole blood mixed with tPA was then transferred to a 37°C TEG cup preloaded with 20 μL 0.2 mol/L CaCl2 for recalcification; and for the RapidTEG, another 10 μL of RapidTEG dilution (primarily consisting of rat brain tissue factor), giving a final concentration of 1.8 nmol/L tPA (299 ± 23 ng/mL plasma, calculated after adjusting for hematocrit) in all investigated TEG cups.
Preparation of Rapid TEG/Kaolin TEG/FFTEG with tPA.
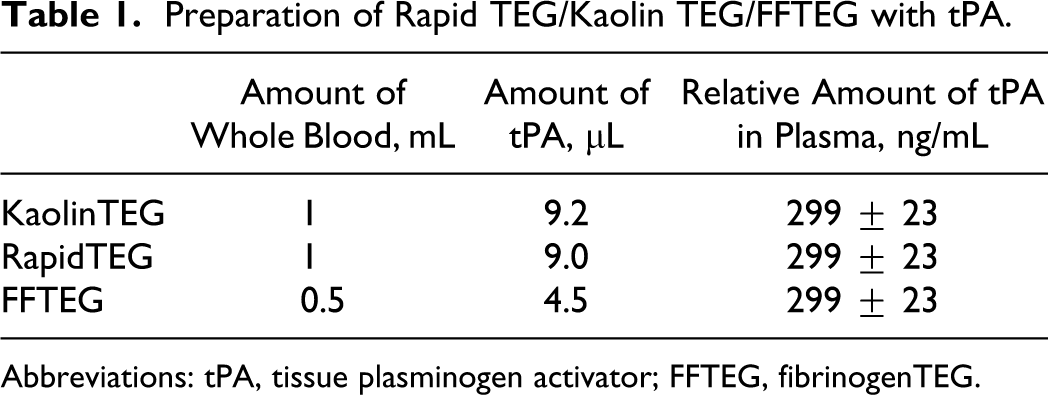
Abbreviations: tPA, tissue plasminogen activator; FFTEG, fibrinogenTEG.
Titration of tPA in 1 Healthy Donor in Normal Blood (range 0.09-7.2 nmol/L tPA)
For 1 donor, tPA was titrated to investigate the sensitivity of the respective assays. The study included a total of 16 analyses in duplicate and was performed on all 3 assays. The setup was the same as described above but was extended to include tPA-concentrations at 7.2, 3.6, 1.98, 1.8, 1.62, 1.35, 1.17, 0.9, 0.72, 0.45, 0.30, 0.23, 0.18, 0.15, 0.13 and 0.09 nmol/L.
Throughout the study, the same volume of dilution was added to the blood samples but with increased/decreased concentrations of tPA as seen in Figure 3 . Plasma tPA levels in trauma patients range from <12.3 to 50 ng/mL, 6 and we have measured plasma values up to 95 ng/mL (P.J. unpublished data). In this study, the investigated range was from 14 to 1144 ng/mL plasma.
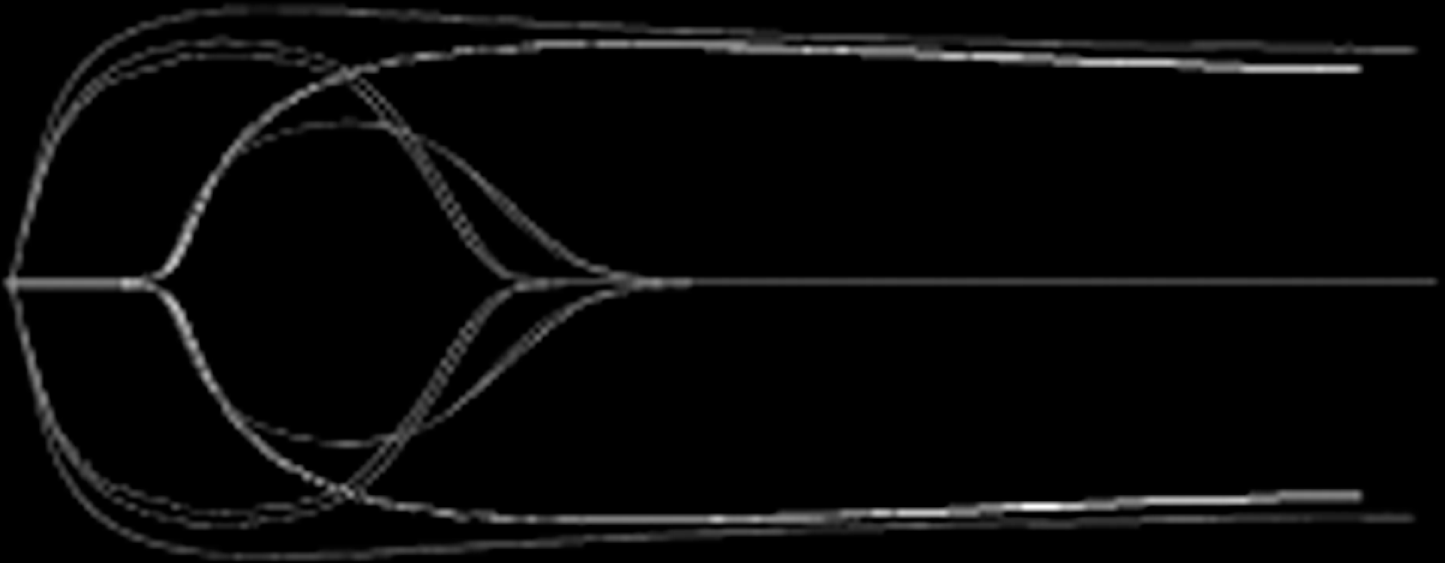
Thrombelastography (TEG) tracings from the laboratory study. Kaolin TEG and Rapid TEG after addition of 1.8 nmol/L tPA in one healthy donor (double tracing).
Thrombelastography
The clotting potential of the citrated whole blood was assessed by TEG analysis using a computerized Thrombelastograph (TEG, model 5000, Software Version 4.1.73, database version 1.0.16, Haemoscope Corporation [Niles, IL, USA]) according to the manufacturer’s recommendations. Thrombelastography analysis was preformed precisely 30 minutes after blood sampling.
The variables recorded by the TEG analyzer (shown in Figure 1 ) were split point (SP time; time [minutes] from recording start to the first sign of divergence), reaction time (R-time; rate [minutes] of initial fibrin formation reflecting plasma clotting factors, that is, how long it takes for the blood to start to clot), α angle (rate [degrees] of clot growth reflecting platelet function, fibrinogen, and plasma components residing on the platelet surface, that is, the speed of fibrin build-up and cross-linking), maximum amplitude (MA; maximum clot strength [mm] reflecting the maximum dynamic properties of platelet–fibrin interaction, that is, measure of platelet function), LY-30, and LY-60 (the relative decrease [%] in amplitude 30 and 60 minutes after MA reflecting the clots resistance to fibrinolysis, that is, shows the degree of clot breakdown after 30 or 60 minutes), G value (a computer-generated measure of clot strength calculated as G = 5000 × A/100-A, where A is a point just beyond the “spilt point”), EPL (%; estimated percentage lysis at 30 minutes after MA).
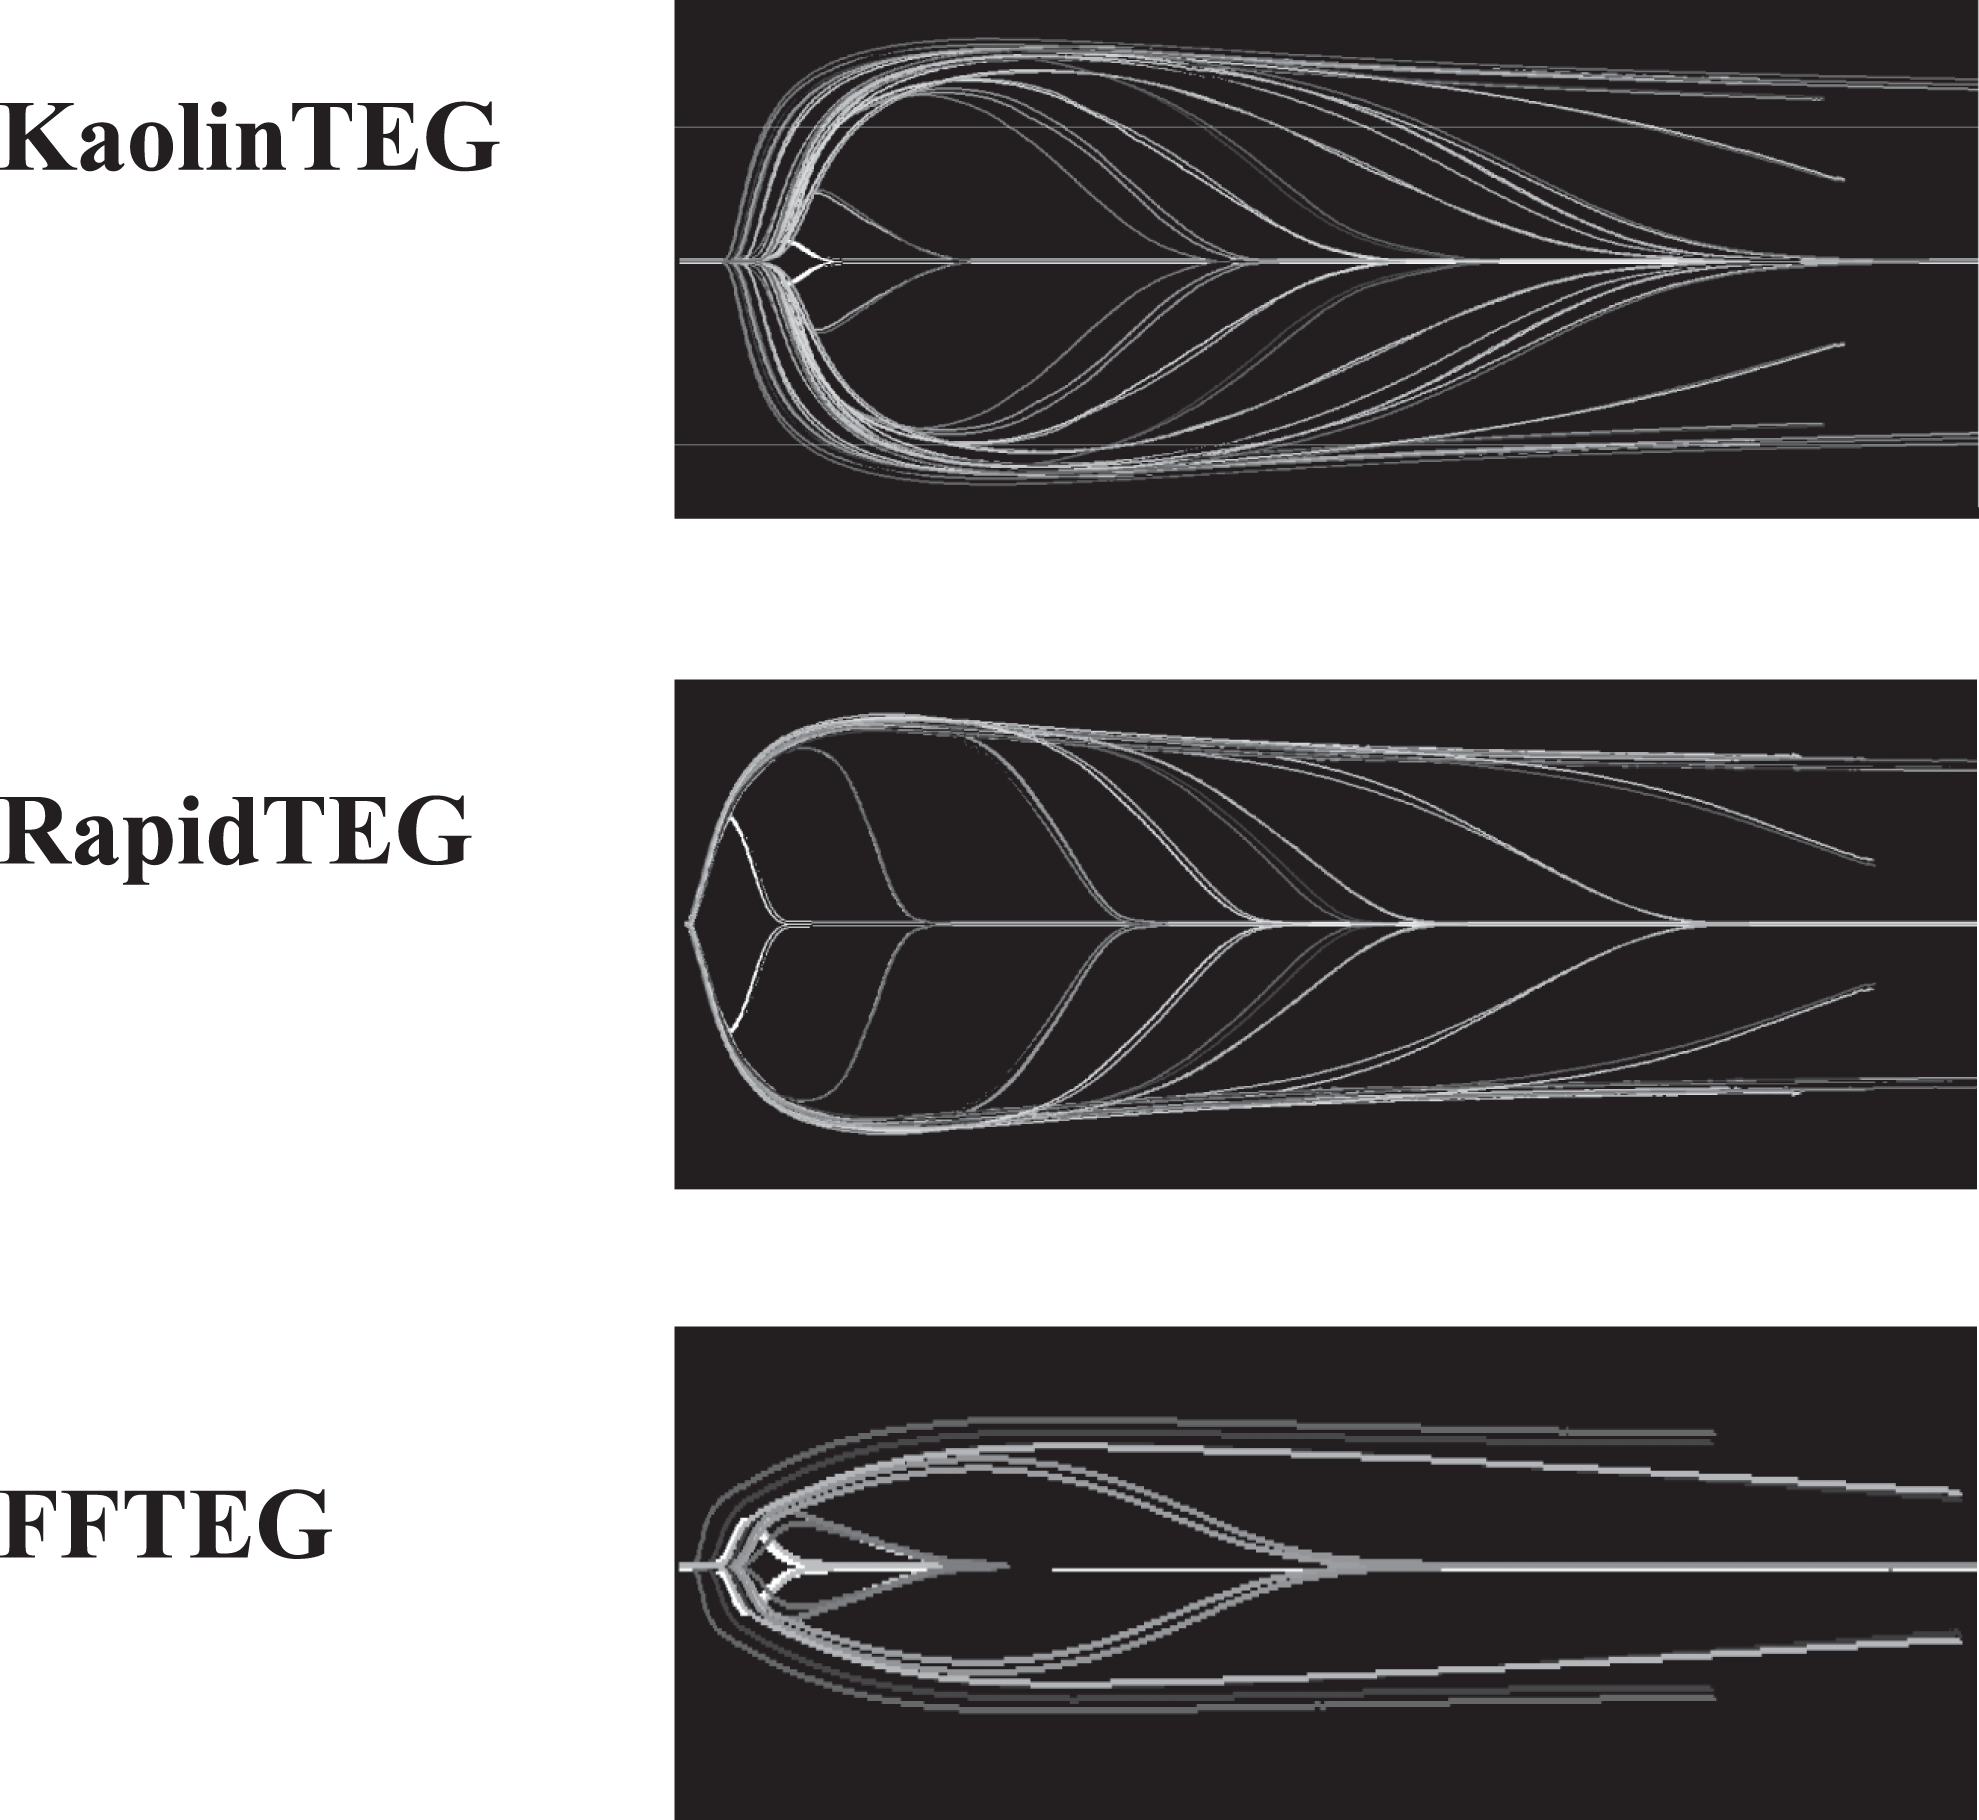
Thrombelastography (TEG) tracings from the laboratory study (the titration study). As seen there is a difference between the KaolinTEG and RapidTEG. This is observed as a smoother transition between the various concentrations of added tPA in the KaolinTEG assay. We hypothesize that the lack of this in the RapidTEG is due to the more resistant clot.
Statistics
All data were gathered in Excel (windows) and analyzed by SPSS v. 17. All data were normally distributed as assessed by the Kolmogorov–Smirnov test. Thrombelastography variables with and without tPA were compared by paired t test. Mean and SD are reported unless otherwise stated. P values < .05 were considered to be statistically significant.
Results
tPA-Induced Fibrinolysis (1.8 nmol/L) in Normal Whole Blood
Both KaolinTEG and RapidTEG were significantly affected by tPA. K-time was increased as a result of a decrease in the speed until a certain clot strength. Angle and MA were reduced due to the fibrinolysis of the clot initiated by tPA. LY-30 and LY-60 were increased because of the increase in fibrinolysis. The FFTEG was also affected by tPA with lower MA and higher LY-30 and LY-60. There was a difference between the relative change in parameters after addition of tPA (tPA relative) for KaolinTEG and RapidTEG in angle, MA, LY-30, and LY-60 since these parameters were most affected in KaolinTEG (Table 2 ). Also, there was a difference between RapidTEG and FFTEG in MA where FFTEG was decreased to 49% (tPA relative) versus RapidTEG to 87% (tPA relative; P < .05).
Mean ± SD (CV) Values for Citrated Whole Blood KaolinTEG, RapidTEG, and Functional Fibrinogen TEG With or Without Addition of 1.8 nmol/L tPA in 5 Men and 5 Womena
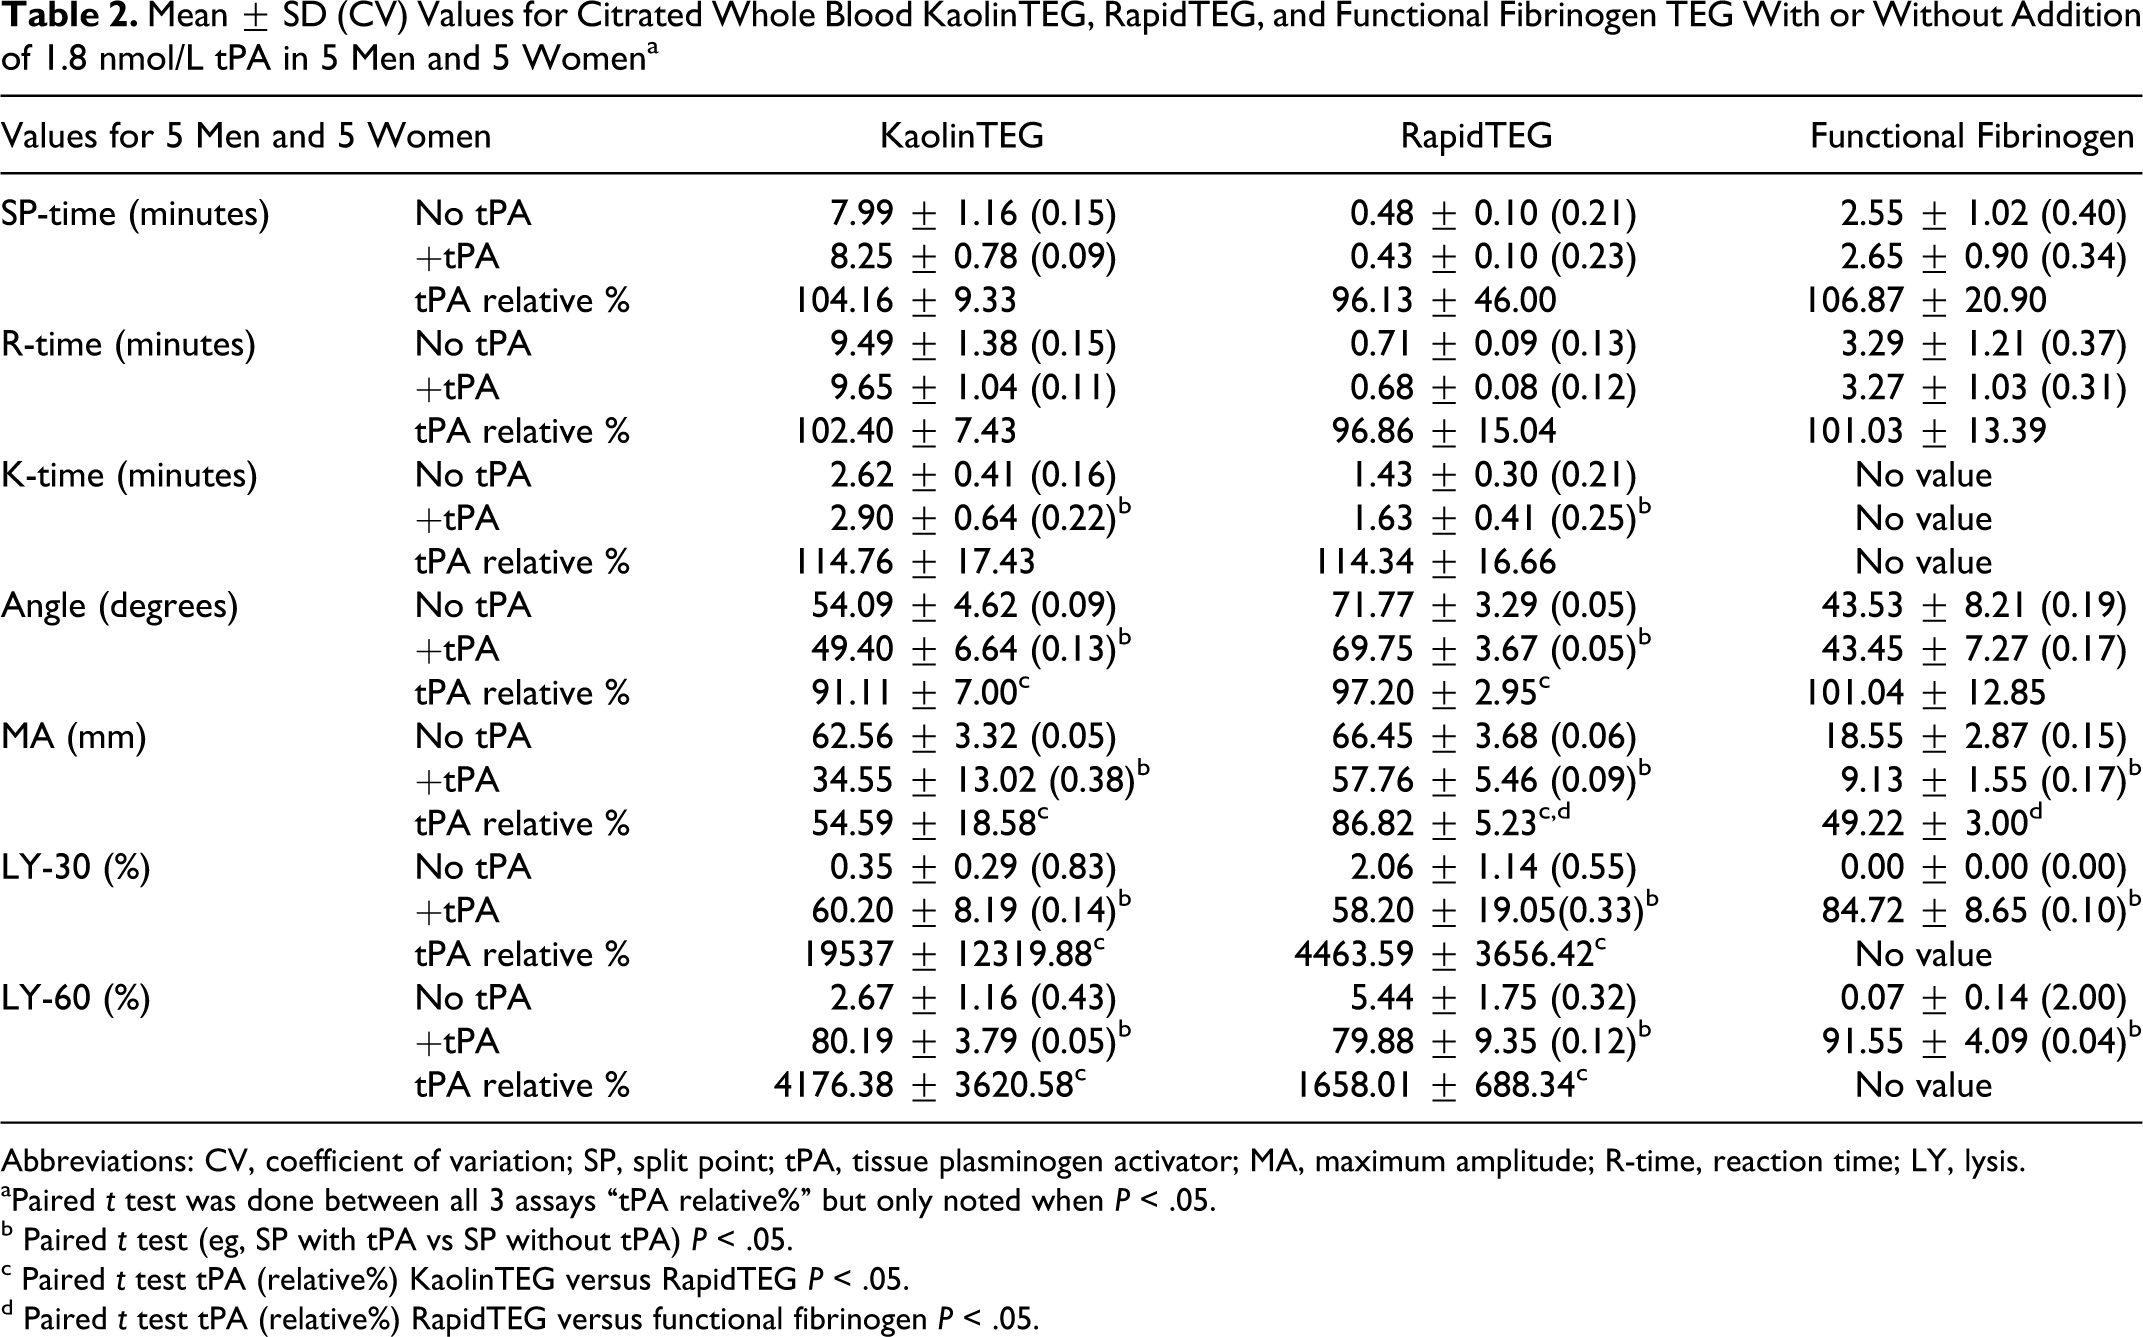
Abbreviations: CV, coefficient of variation; SP, split point; tPA, tissue plasminogen activator; MA, maximum amplitude; R-time, reaction time; LY, lysis.
aPaired t test was done between all 3 assays “tPA relative%” but only noted when P < .05.
b Paired t test (eg, SP with tPA vs SP without tPA) P < .05.
c Paired t test tPA (relative%) KaolinTEG versus RapidTEG P < .05.
d Paired t test tPA (relative%) RapidTEG versus functional fibrinogen P < .05.
tPA-Titration in Whole Blood (range 0.09-7.2 nmol/L WB)
In Figure 4 , in none of the assays did R-time change after addition of tPA.
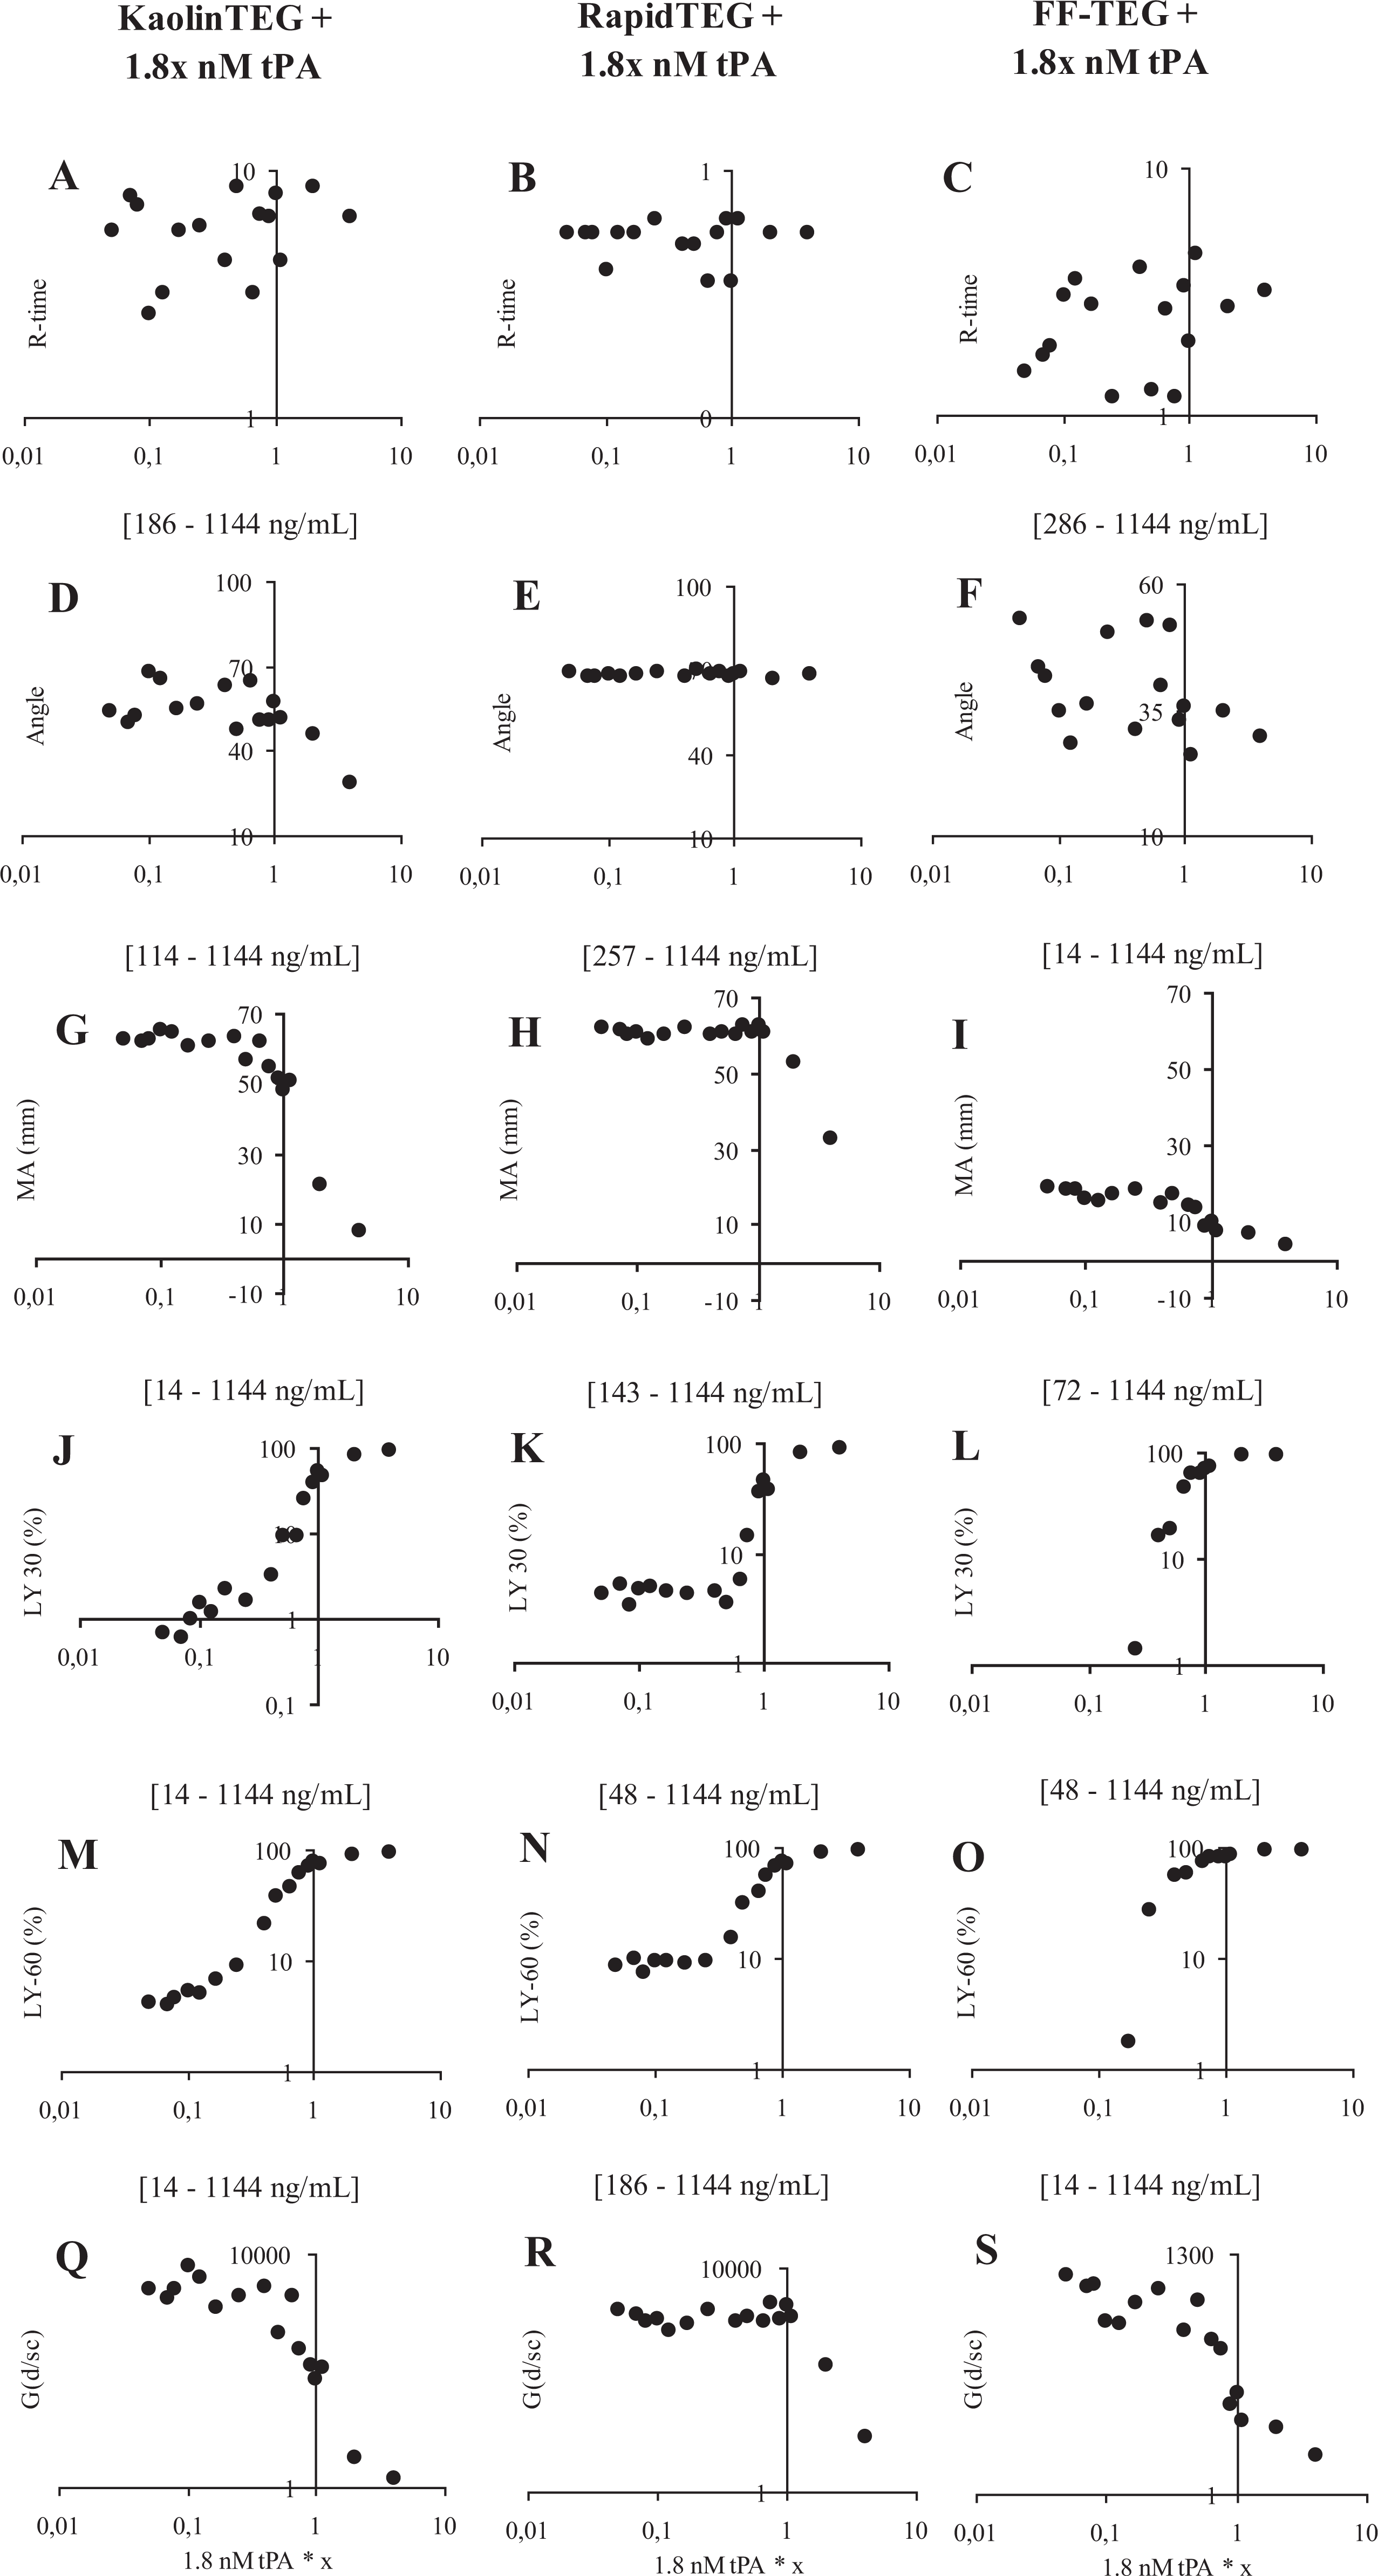
Hemostatic function evaluated by thrombelastography (TEG) ± x * 1.8 nmol/L tissue-type plasminogen activator (tPA) in 1 healthy individual evaluated by the following tPA concentrations: 7.2, 3.6, 1.98, 1.8, 1.62, 1.35, 1.17, 0.9, 0.72, 0.45, 0.30, 0.23, 0.18, 0.15, 0.13, and 0.09 nmol/L. A-C + J-S shows a log-y-scale and A-S a log-x-scale. X-axis = tPA concentration. Y-axis = TEG value; R-time (min), Angle (degrees), MA (mm), LY-30 (%-lysis after 30 min.), LY-60 (%-lysis after 60 min) and G-value (d/sc).
RapidTEG
Angle was not influenced by the investigated tPA concentrations (E), whereas MA tended to display a dose dependence for values >1.35 nmol/L(H) (215 ng/mL plasma). Both LY-30 and LY-60 displayed no dose dependence for values <0.72 nmol/L (K+N) (114 ng/mL plasma). For higher values, however, a clear dose-dependent response was observed (Figure 3). G-value displayed no dose dependence for values <0.9 nmol/L(R) (143 ng/mL plasma) but for higher values a clear dose-dependent response was observed.
KaolinTEG
Angle and MA showed a dose dependence for values >1.17 nmol/L (D+G) (186 ng/mL plasma) and >0.72 nmol/L (114 ng/mL plasma), respectively. The LY-30, LY-60, and G-value showed a clear dose dependence throughout the studied range (J+M+Q)(14-1144 ng/mL).
FFTEG
Angle displayed a dose dependence for values >1.8 nmol/L (F) (286 ng/mL plasma). Both MA and G-value showed dose dependence throughout the studied range (I+S). The LY-30 showed a dose dependence for values >0.30 nmol/L (L) (48 ng/mL plasma) and LY-60 (O) for values >0.23 nmol/L (36 ng/mL plasma).
Summary
KaolinTEG appeared to be more sensitive to tPA compared to RapidTEG. Both LY-30 and LY-60 in the RapidTEG did not sense any lysis for values <0.72 nmol/L, whereas KaolinTEG showed a dose dependence throughout the titration. The FFTEG also showed to be sensitive but only at tPA ranges that did not cause total lysis.
In Figure 5 , sensitivity of RapidTEG and KaolinTEG to EPL (%) is seen. We found a cutoff value for RapidTEG <0.09 nmol/L tPA (143 ng/mL plasma) from where there was no sensitivity compared to KaolinTEG that was dose dependent throughout the studied tPA range.
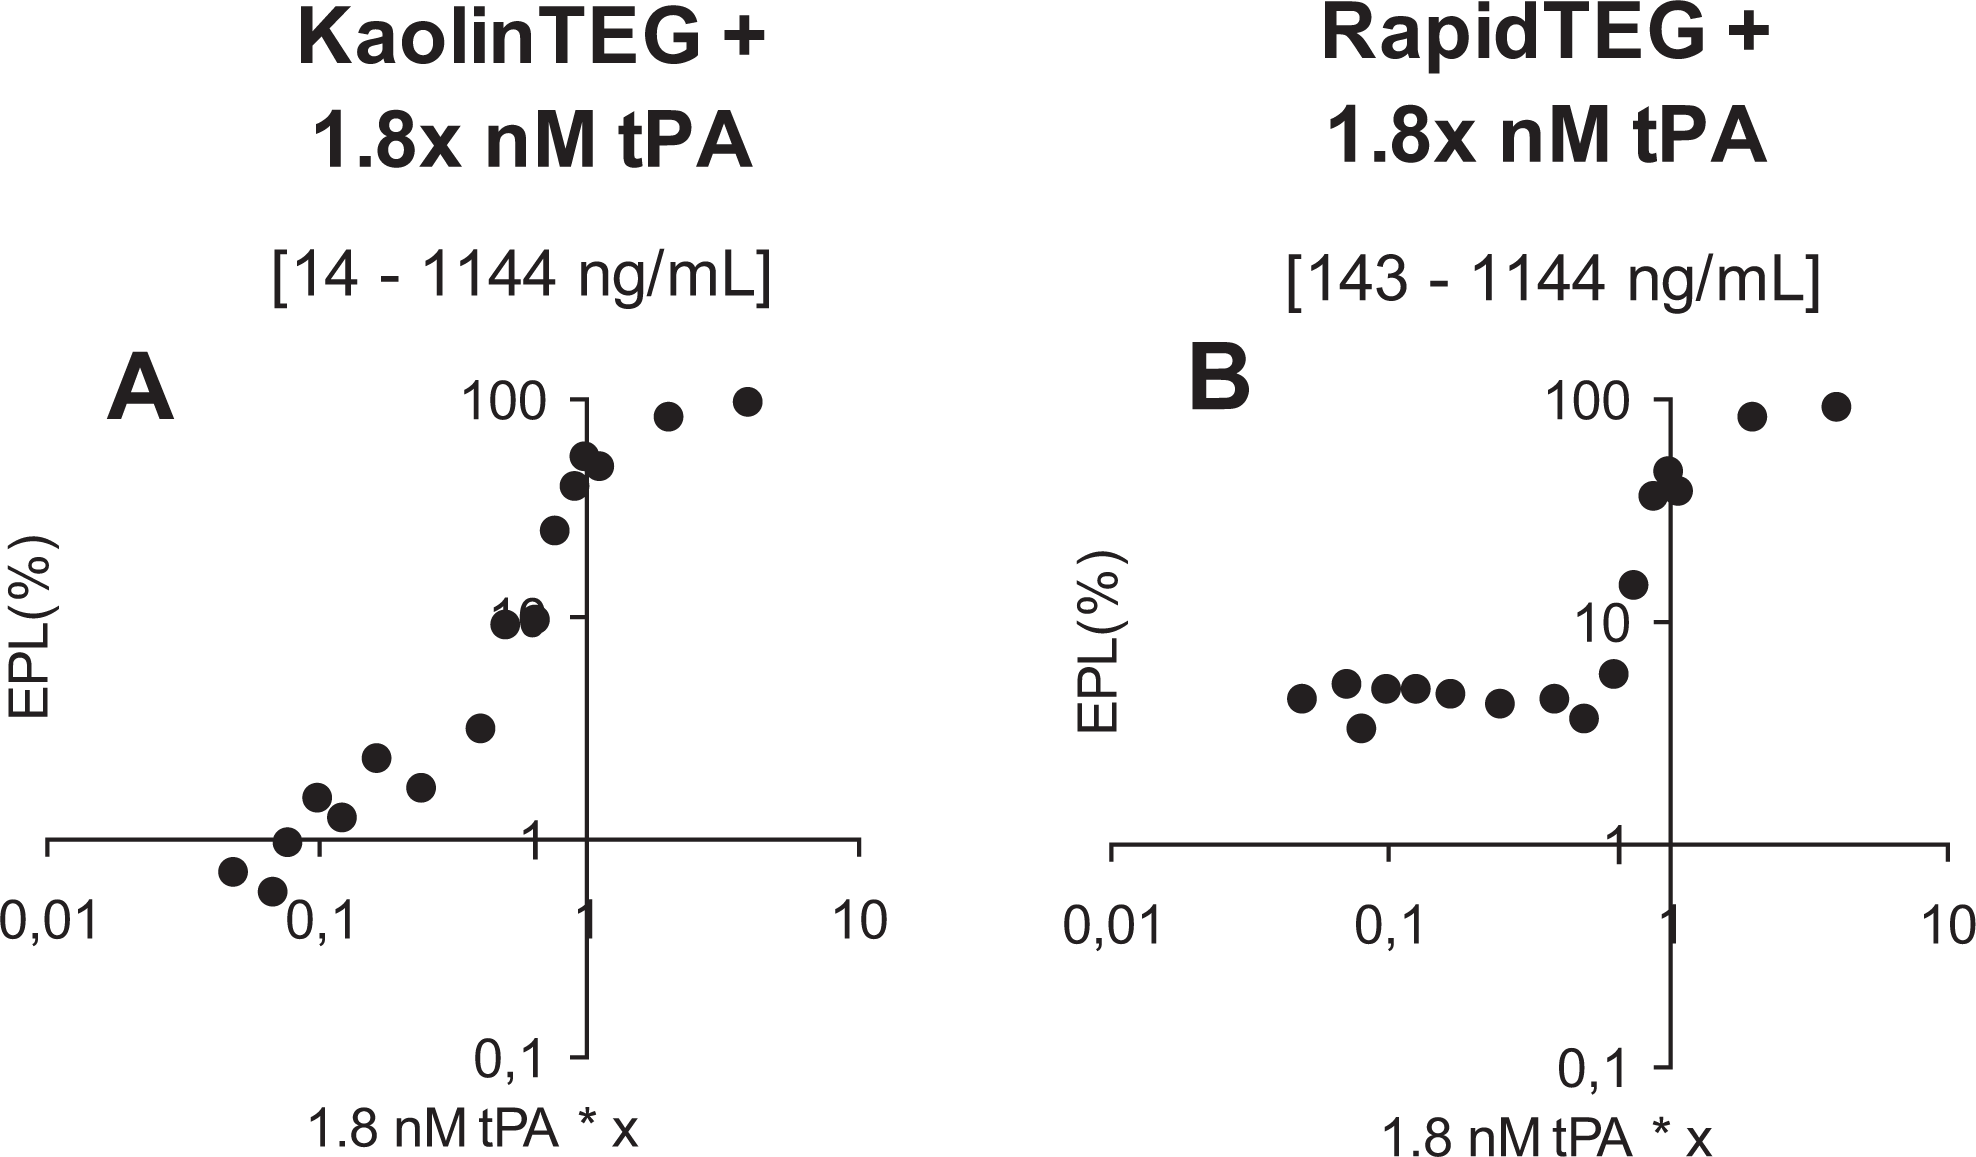
Hemostatic function evaluated by thrombelastography (TEG) ± x * 1.8 nmol/L tissue-type plasminogen activator (tPA) in 1 healthy individual evaluated by the following tPA concentrations: 7.2, 3.6, 1.98, 1.8, 1.62, 1.35, 1.17, 0.9, 0.72, 0.45, 0.30, 0.23, 0.18, 0.15, 0.13, and 0.09 nmol/L. A-B shows a log-y-scale and log-x-scale X-axis = tPA concentration, Y-axis = EPL (%). EPL, estimated percent lysis.
To calculate the tPA value in plasma, the hematocrit was measured several times for the single donor during the titration study and the mean ± SD was 0.44 ± 0.01. The 1.8 nmol/L WB tPA concentration in the TEG cup therefore equals a concentration of 286 ng/mL in the plasma and the studied range was from 14 to 1144 ng/mL.
Discussion
The present study confirms that the 3 investigated TEG assays are able to detect tPA-induced fibrinolysis in vitro with the main finding being that the influence of tPA on the RapidTEG parameters is reduced as compared to that observed for both KaolinTEG and FFTEG. This indicates that the more powerful activation performed in RapidTEG not only result in a faster clot formation but also in a stronger clot that is more resistant to fibrinolysis. We hypothesize that this might be explained by both the conversion of coagulation factor XIII (FXIII) to FXIIIa and thrombin activatable fibrinolysis inhibitor (TAFI) to TAFIa occurs in a concentration-dependent manner relative to thrombin generation. 17 Consequently, the stronger activation of the clot formation secondary to increased thrombin generation, the more resistant to fibrinolysis the clot will become.
In trauma patients, tPA levels have been reported from <12.3 to 50 ng/mL 6 and we have found levels up to 95 ng/mL (P.J. unpublished data), levels that are all well below the detection limit for increased fibrinolysis by the RapidTEG. The KaolinTEG however appeared sensitive to these concentrations of tPA.
In this pilot study, we used a significantly higher amount of tPA (14-1144 ng/mL plasma). The reason for this is that the initial concentration of 1.8 nmol/L (299 ± 23 ng/mL plasma calculated after adjusting for hematocrit) reduces the clot significantly but not excessively.
Furthermore, we used active tPA which is different from Brohi et al 6 who preformed a quantitative antigen measurement of the total tPA level in plasma (enzyme-linked immunosorbent assay [ELISA] method). One needs to consider that the amount of active tPA, as used in this pilot study, can be as low as 1% of the total amount of tPA when measured by the ELISA method. Therefore, one can only comment on the sensitivity regarding this laboratory study since we used tPA concentrations not directly comparable to the in vivo ACOTS but instead adapted for a laboratory study. Instead, these findings need to be verified in larger clinical trials with patients with real trauma, and we are concerned about the use of RapidTEG since there are no published studies regarding its sensitivity compared to the normally used KaolinTEG.
Kashuk et al 12 recently reported that primary fibrinolysis was an integral part of the acute coagulopathy of trauma, based on the observation that EPL, as evaluated by RapidTEG, was significantly higher in trauma patients receiving massive transfusion compared to those not receiving massive transfusion. Several explanations for the discrepant finding are possible. First, Kashuk et al studied actual trauma patients, whereas we merely added tPA to whole blood from healthy volunteers implying that our observations are limited to persons with an intact hemostatic system including the thrombin burst. This is clearly not the case in the trauma patients investigated by Kashuk et al. They reported of substantial hypocoagulation in those with increased EPL, consistent with decreased thrombin generation and hence reduced clot-stabilizing effects attributed to FXIIIa and TAFIa. Second, we measured fibrinolysis by the parameters LY30 and LY60, whereas Kashuk et al used EPL, where LY-30 and LY-60 predicts the relative decrease in amplitude 30 and 60 minutes after MA and EPL the estimated percent lysis at 30 minutes after MA. Third, in the present study, citrated blood samples were used for analysis and all analyses were run at exactly 30 minutes after blood sampling, whereas Kashuk et al employed native blood samples analyzed within 4 minutes from drawing. 18
In the present study, we found that the result of the RapidTEG analysis were available significantly earlier than the KaolinTEG. This is in alignment with Jeger et al 19 who recently reported that RapidTEG provided a quicker test result (30.8 ± 5.7 minutes) compared to KaolinTEG (41.5 ± 5.7 minutes). This was measured from arrival of the patient in the resuscitation bay until TEG results were available to the treating physician. But before running the RapidTEG assay, one must prepare the RapidTEG dilution, which takes about 1 to 2 minutes. After the addition of 20 µL of water to the RapidTEG dilution glass containing the rat brain tissue factor, one must further wait until the tissue factor is dissolved in the water. On the other hand, the preparation prior to the KaolinTEG assay is limited to adding 1 mL of whole blood to the KaolinTEG test tube. The result is that the timesaving aspect of the RapidTEG is limited.
The data presented here should give the reader a picture of the preliminary data concerning the sensitivities of the 3 assays. This is a comparison that has never been published before. We believe that it is important because doctors in some parts of the world have started using the RapidTEG due to the faster test results, but they might not be aware of the possible difference in sensitivity. This may lead to underdiagnosis for some cases of hyperfibrinolysis.
In conclusion, the accelerated clotting process by simultaneously stimulating the intrinsic and extrinsic coagulation pathways in the RapidTEG assay appears to result in a clot that is more resistant to tPA-induced fibrinolysis as compared to KaolinTEG and FFTEG. This suggests that KaolinTEG may be superior in identifying low degrees of fibrinolysis, although this needs to be evaluated prospectively in a clinical setting including patients with hyperfibrinolysis.
Footnotes
Acknowledgments
The technical assistance from laboratory technicians Karen Dyeremose and Rola Ghadban is greatly acknowledged. We thank the Danish Agency for Science Technology and Innovations (Ministry of Science Technology and Innovation) for their financial support of this project.
Declaration of Conflicting Interests
The authors declared no potential conflicts of interest with respect to the research, authorship, and/or publication of this article.
Funding
The authors disclosed receipt of the following financial support for the research, authorship, and/or publication of this article: supported by Danish Agency for Science Technology and Innovations (Ministry of Science Technology and Innovation).