
Abstract
Introduction
The Prospective Investigation of Pulmonary Embolism Diagnosis III (PIOPED III) was a National Institutes of Health (NIH)-funded prospective multicenter cohort trial performed to assess the accuracy of gadolinium contrast-enhanced magnetic resonance angiography (MRA) for the detection of acute pulmonary embolism (PE). The PIOPED III was third in a series of multicenter trials to assess the performance of a variety of diagnostic tests for PE.1–3 If pulmonary MRA proved valid, it would provide a viable alternative for patients having a contraindication to iodinated contrast material and would eliminate exposure of patients to ionizing radiation. While the pulmonary MRA technique has existed for over 15 years, most publications on this topic introduce technological enhancements4–11 or report single-institution trials.12–17 In contrast to this, the PIOPED III study was the first large multicenter trial incorporating standardized inclusion/exclusion criteria that yielded a broad spectrum of patients with and without PE, along with patients having comorbid conditions that are commonly associated with PE.3,18 In addition, since the PIOPED III study was performed at several centers having variable experience in performing pulmonary MRA, and the examinations were conducted on a variety of magnetic resonance imaging (MRI) hardware platforms, this study provides an insight into the performance of pulmonary MRA if used on a large-scale clinical basis. Among technical variations was 1 center utilizing a 3 T scanner with all other scanners being at 1.5 T. Magnetic resonance imaging protocols typically require adjustment between 1.5 and 3 T to exploit gains afforded by the higher field, as well as address field strength–dependent issues such as radiofrequency (RF) power deposition. The pulmonary vasculature resides in the most sensitive environment for air/tissue susceptibility artifact in the body. This study offered the opportunity to quantify the impact of not just increasing signal-to-noise ratio (SNR) and spatial resolution at higher field strengths, which has been well reported, but also the impact of the greater air/tissue susceptibility artifact. 19 As previously reported of the PIOPED III study, 3 there was a signal-to-noise gain in the 3 T system relative to the 1.5 T system. This article presents a retrospective analysis of the impact of field strength on MRA SNR of the main pulmonary vessels using images provided by these 2 PIOPED III study centers.
Methods
Patients
In all, 60 MRA examinations were drawn from the PIOPED III study that included 371 patients with suspected acute PE. These patients were recruited from the emergency department, inpatient clinics, outpatient clinics, or radiology and underwent a pulmonary MRA within 72 hours of the onset of acute symptoms. Exclusion criteria included common MRI contraindications as well as exclusion of patients having a glomerular filtration rate (GFR) below18,20,21 60 mL/min per 1.73 m 2 , although levels of serum creatinine and GFR that excluded patients changed during recruitment as information about the risks of nephrogenic systemic fibrosis/nephrogenic fibrosing dermopathy became available. The 60 MRA examinations were drawn from 2 of the 7 PIOPED III centers. The protocol and consent forms were approved by the institutional review board of each center and by a Data Safety Monitoring Board appointed by the National Heart Lung and Blood Institute. All recruited patients gave written informed consent. Additional study details are available elsewhere. 18
Among the 7 PIOPED III centers, 1 center utilized a 3 T MRI system and another used the same vendor platform but at 1.5 T. The last 30 cases submitted from both of these centers were extracted for a retrospective analysis of image quality versus field strength. Both of these centers contributed over 50 cases to the PIOPED III study, so any potential effect of a learning curve was minimized by selection of the last 30 cases from each center. No patients included in this article had PE.
Pulmonary MRA
The PIOPED III MRA protocol was designed to allow latitude for system- and site-specific MRA capabilities. 18 The 1.5 and 3 T sites involved in this substudy had a common vendor platform and utilized the same sequence class: centric-ordered 3-dimensional (3D) T1-weighted fast-field-echo sequence at minimum time repetition (TR) and time echo (TE). Significant protocol differences between the sites are summarized in Table 1.
Scan Parameters a
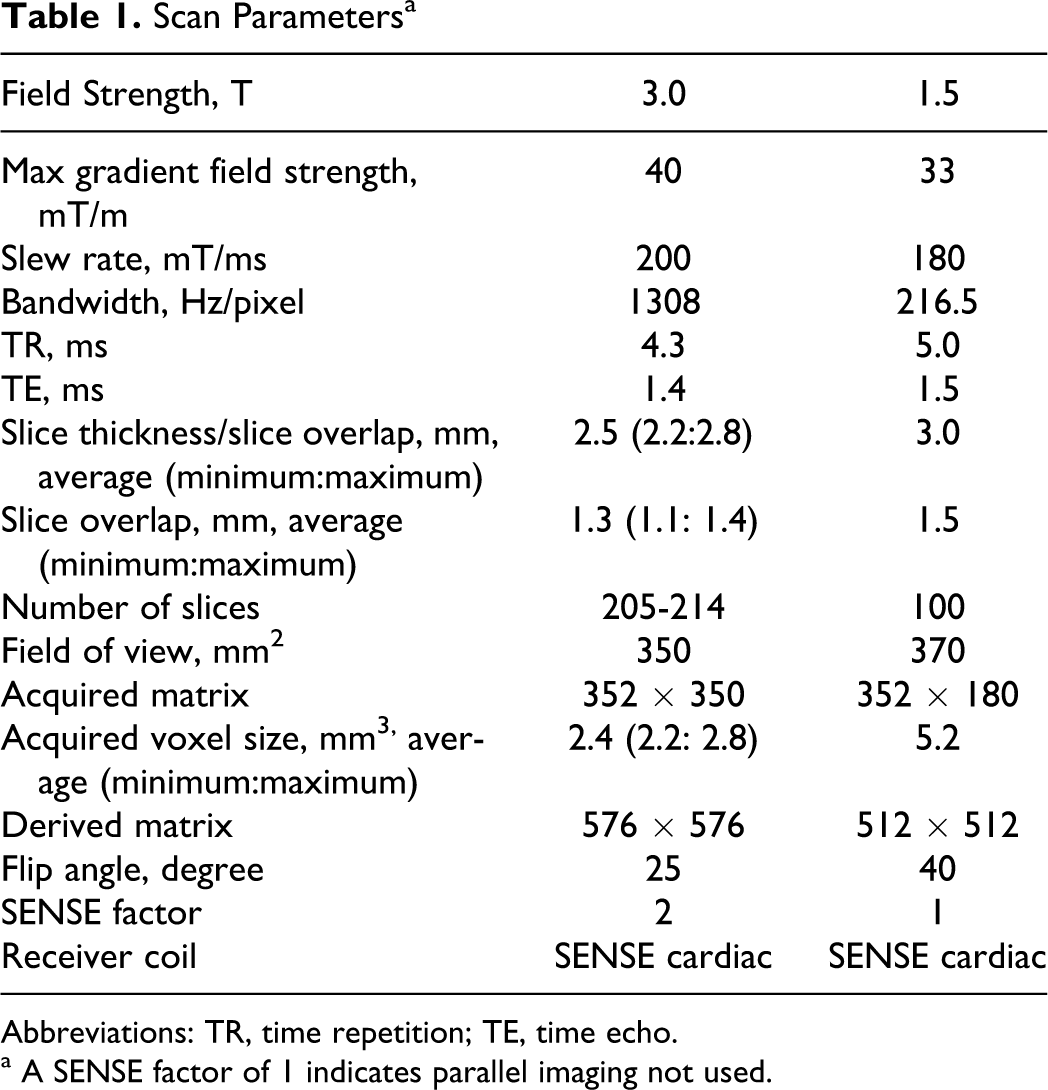
Abbreviations: TR, time repetition; TE, time echo.
a A SENSE factor of 1 indicates parallel imaging not used.
The PIOPED III image acquisition protocol called for a single arterial phase gadolinium-enhanced, breath hold, pulmonary MRA. The MRA scan was performed in the coronal plane with field of view (FOV) and anterior–posterior coverage adjusted to guarantee adequate coverage of the pulmonary vasculature. For the 2 centers in this substudy, timing of the MRA scan was determined using the test-dose method consisting of a single sagittal location transecting the pulmonary artery and vein, with injection of 1 mL of contrast material followed by 15 mL saline flush injected into an antecubital vein (Figure 1). Both the test-dose and subsequent MRA dose combined to a total body weight dose of 0.1 mmol/kg gadobenate dimeglumine (Multihance, Bracco, Milan, Italy). The test-dose and contrast material for diagnosis with a 15 mL saline flush were injected at 2 mL/s. Time to peak enhancement of the main pulmonary artery on the sagittal test-dose images (Figure 1) was used to calculate the pulmonary MRA scan delay for each patient according to a well-established formula. 22 Patients were instructed to suspend respiration over the ≤22 s pulmonary MRA scan interval.
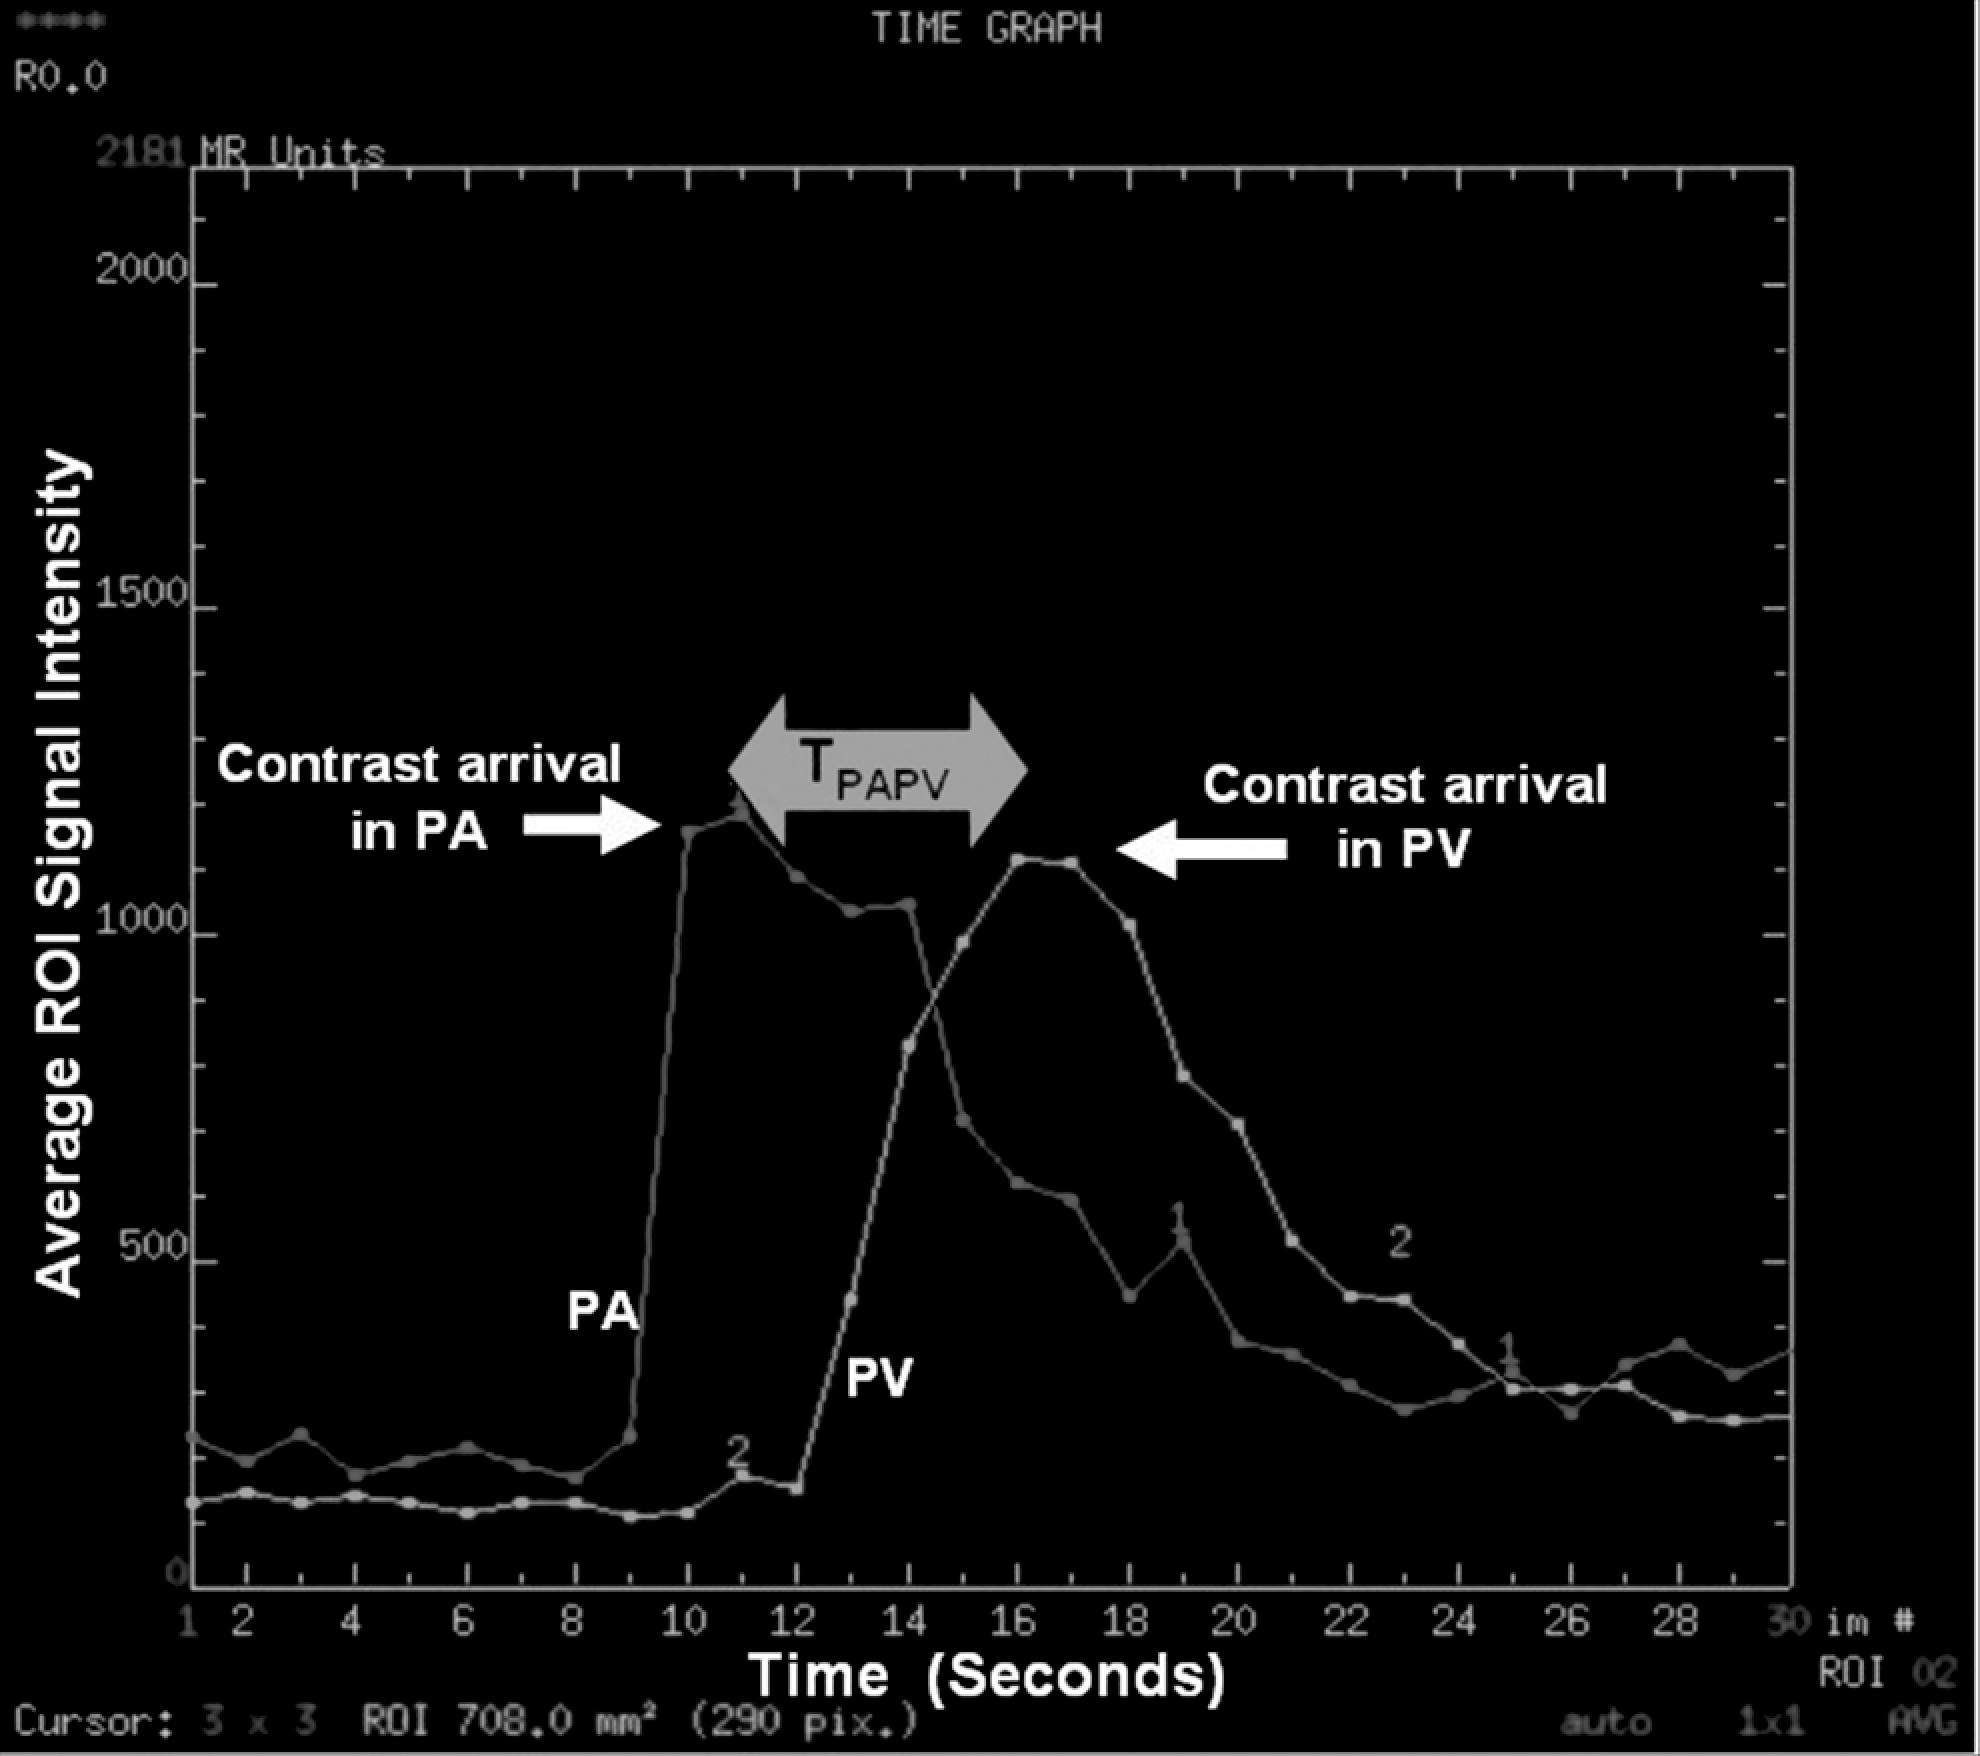
Plot of signal intensity versus time for a test bolus consisting of 1 mL of contrast followed with a 15 mL saline flush. Difference in test dose arrival time from the pulmonary artery to the pulmonary vein, denoted TPAPV, was used as an indicator of patient hemodynamic properties.
Measurements
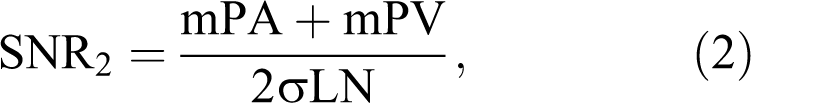
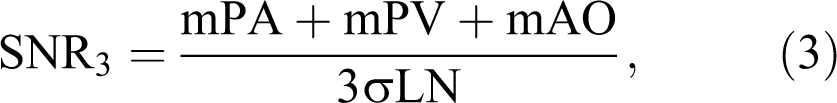
All image data were shipped from George Washington University, the PIOPED III Biostatistics Center, to the University of Michigan on optical CDs in Digital Imaging and Communications in Medicine (DICOM) format. All images were de-identified of personal health information, although technical MRI factors were retained and available. Region of interest (ROI) measurements were defined by 1 person (F.J.L.) and were performed on a clinical 3D workstation using commercial software tools. Figure 2 illustrates the typical ROI placements of the pulmonary artery, right and left superior and inferior pulmonary veins, aorta, and nonenhancing lung in the left upper lobe as a measure of background. Signal mean and standard deviation within the ROIs drawn on source images were recorded for each patient as mPA (mean of pulmonary artery ROI), mPV (average of the 4 mean pulmonary vein ROIs), mAO (mean of aorta ROI), and σLN (standard deviation of nonenhancing lung ROI). These values were used to calculate the following SNR and contrast-to-noise ratio (CNR) quantities:


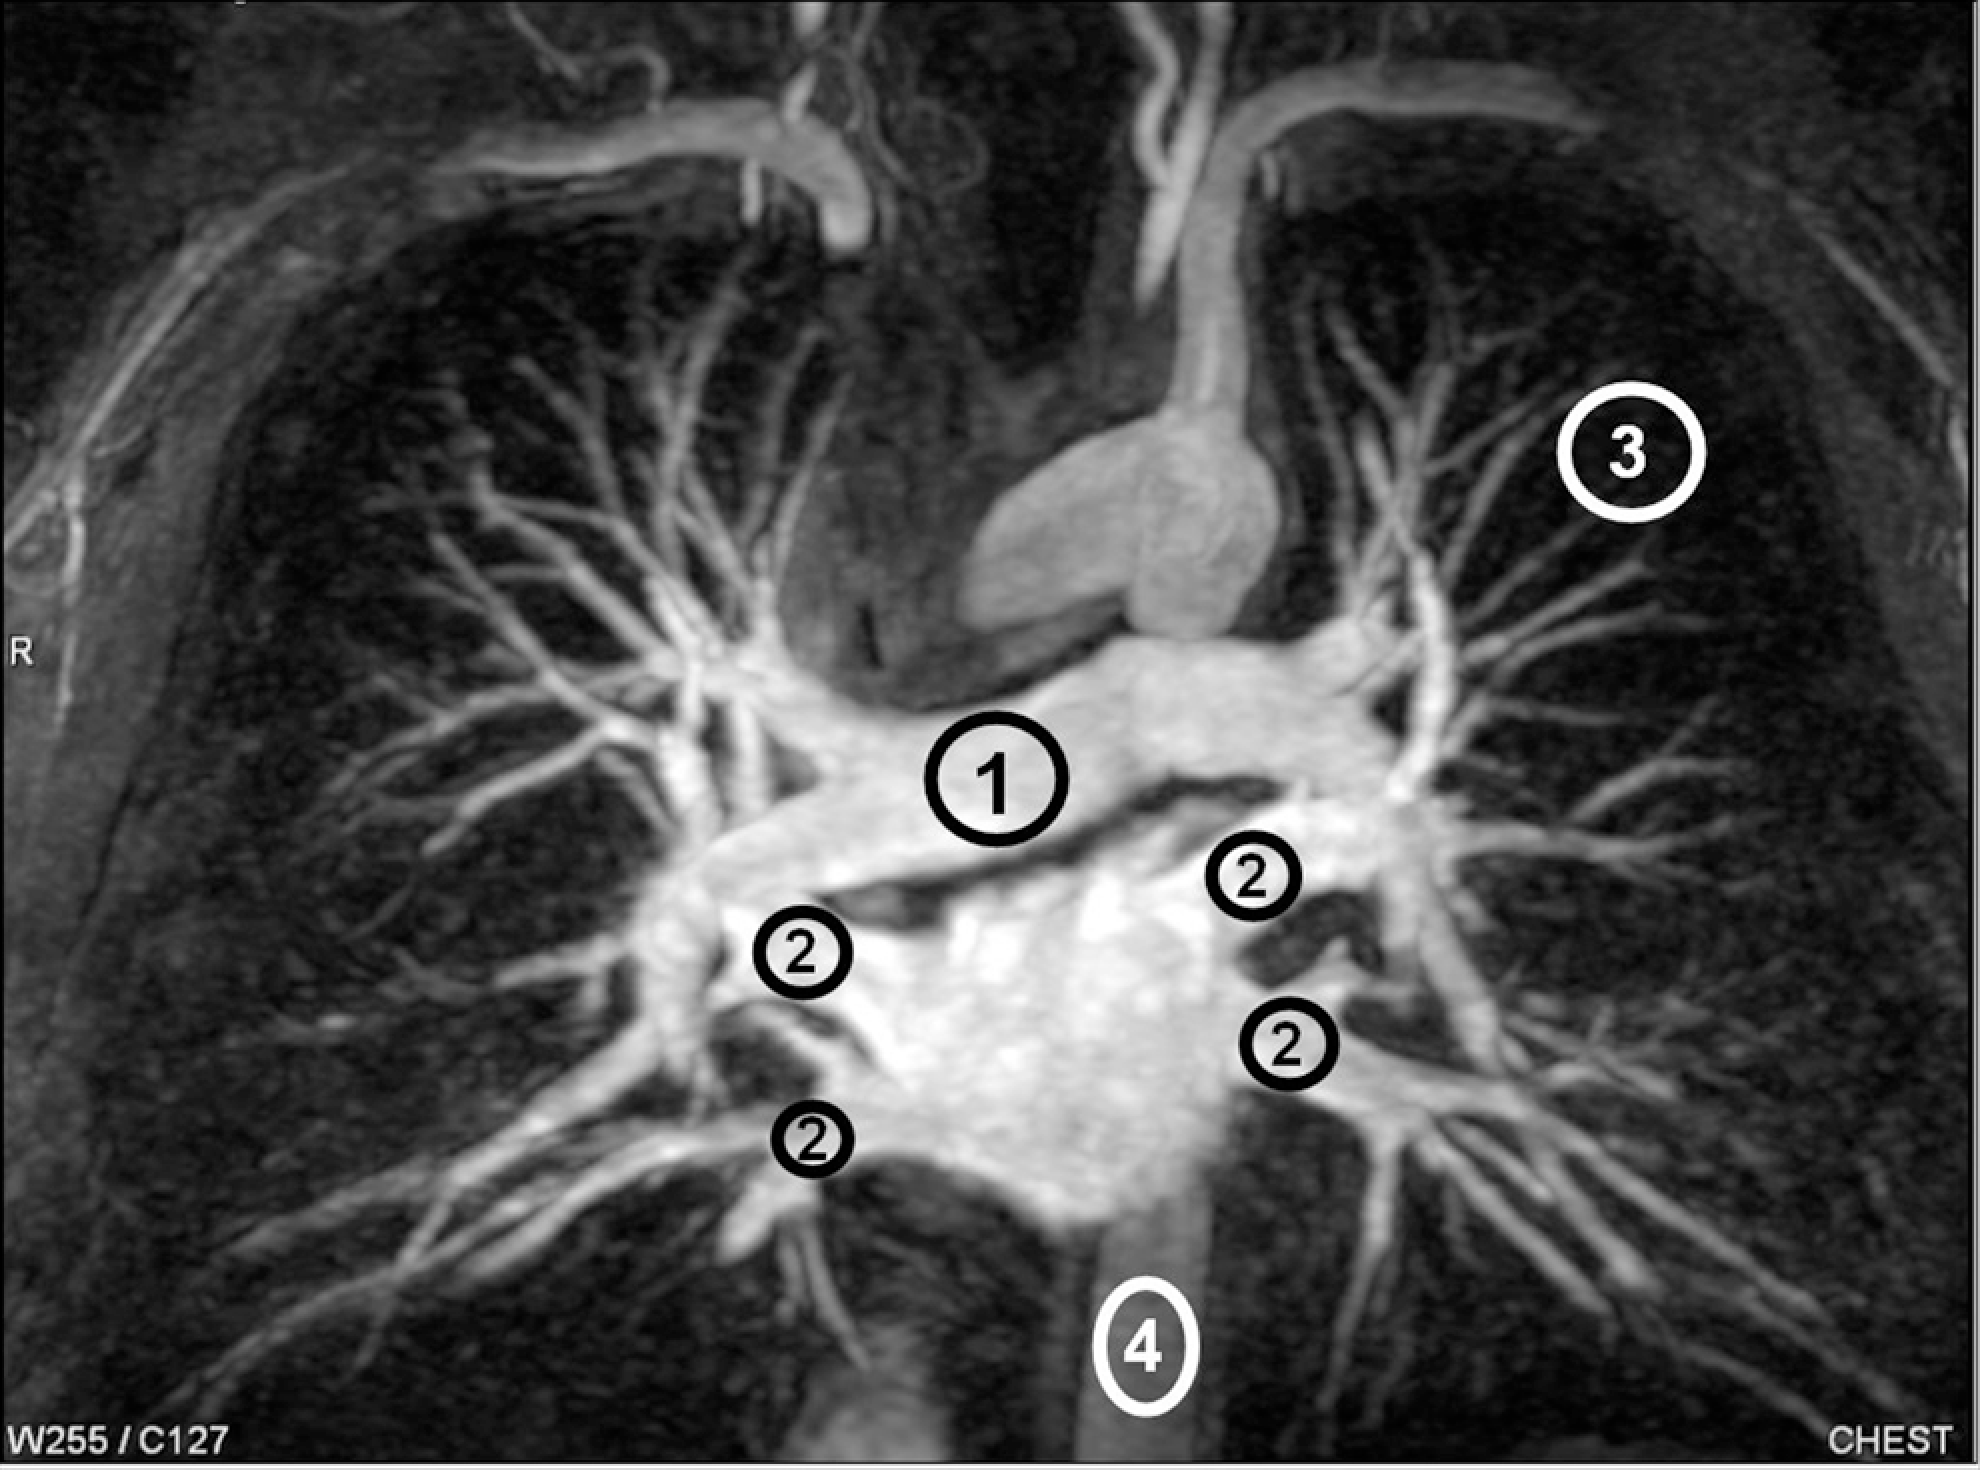
Representative ROI locations and sizes for pulmonary artery (1), pulmonary veins (2), unenhanced lung (3), and aorta (4) illustrated on an MIP. The actual ROI measurements were preformed on source images. ROI indicates region of interest; MIP, maximum intensity projection.
Finally, the dynamic test-dose series was used as an indicator of patient hemodynamic properties. Two ROIs were defined on the pulmonary artery and pulmonary vein that were intersected by the sagittal test-dose slice. Inspection of peaks from signal intensity versus time plots provided a quantitative measure of pulmonary-artery-to-vein transit time (TPAPV) as graphically illustrated in Figure 1. This quantity was used to test the hemodynamic differences between the 1.5 and 3 T patient groups.
Statistics
Data for each parameter defined above were available for 30, 1.5 T scans and 30, 3 T scans. Most of the parameter distributions were skewed. Therefore, a Wilcoxon sign rank test was used to test significant differences between 1.5 and 3 T groups. 23
Results
Results for each parameter in 1.5 and 3 T groups are presented as median along with minimum and maximum value and are summarized in Table 2. There was a significant difference between groups for all 3 SNR parameters with the 3 T group showing higher SNR values by at least 13% relative to the 1.5 T group. Decreasing P values from SNR1 to SNR2 and SNR3 indicates the 3 T group had incremental signal enhancement gains as sensitivity to bolus timing was reduced by the inclusion of downstream vessels in the SNR calculation. However, a systematic bias in bolus timing was not detected between the 1.5 and 3 T groups as indicated by a lack of significant group differences in CNR1 and CNR2. Also note, there was no significant difference between 1.5 and 3 T groups in terms of hemodynamics as characterized by the pulmonary-artery-to-vein transit time TPAPV. These findings suggest that image signal-to-noise differences between 1.5 and 3 T groups are not attributable to bolus timing bias between centers or to cardiac flow dynamics.
Quantitative Comparison Between 1.5 and 3 T Data Sets
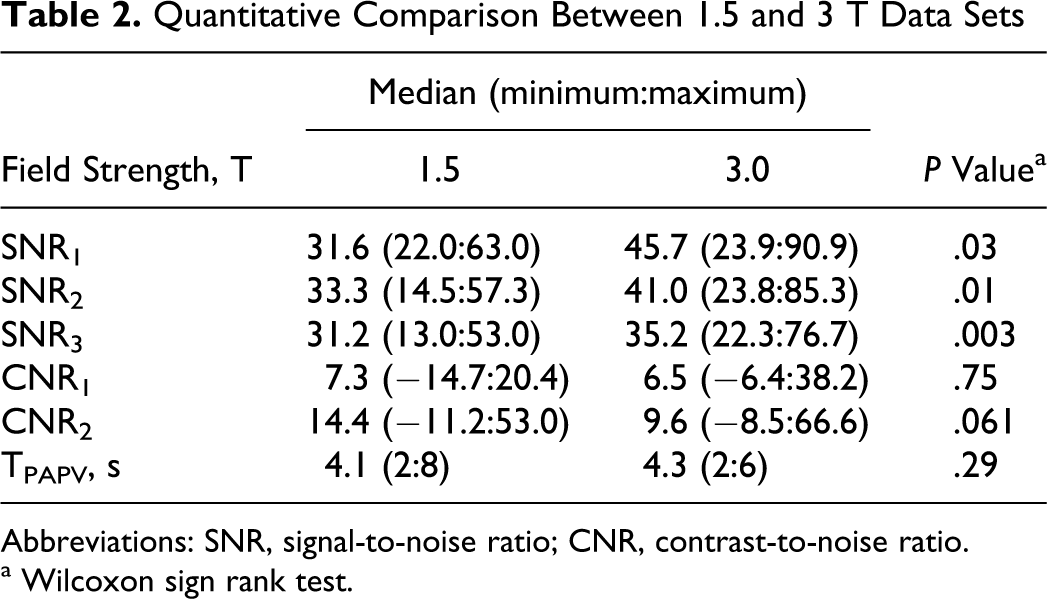
Abbreviations: SNR, signal-to-noise ratio; CNR, contrast-to-noise ratio.
a Wilcoxon sign rank test.
Representative pulmonary MRA maximum intensity projections (MIPs) from 1.5 and 3 T patients are illustrated in Figure 3. These MIPs were derived from native MRA images (ie, without subtraction of a precontrast mask). While both MRA pairs exhibit good bolus timing and good quality, the increased in-plane and through-plane spatial resolution of the 3 T MIPs is visually apparent.
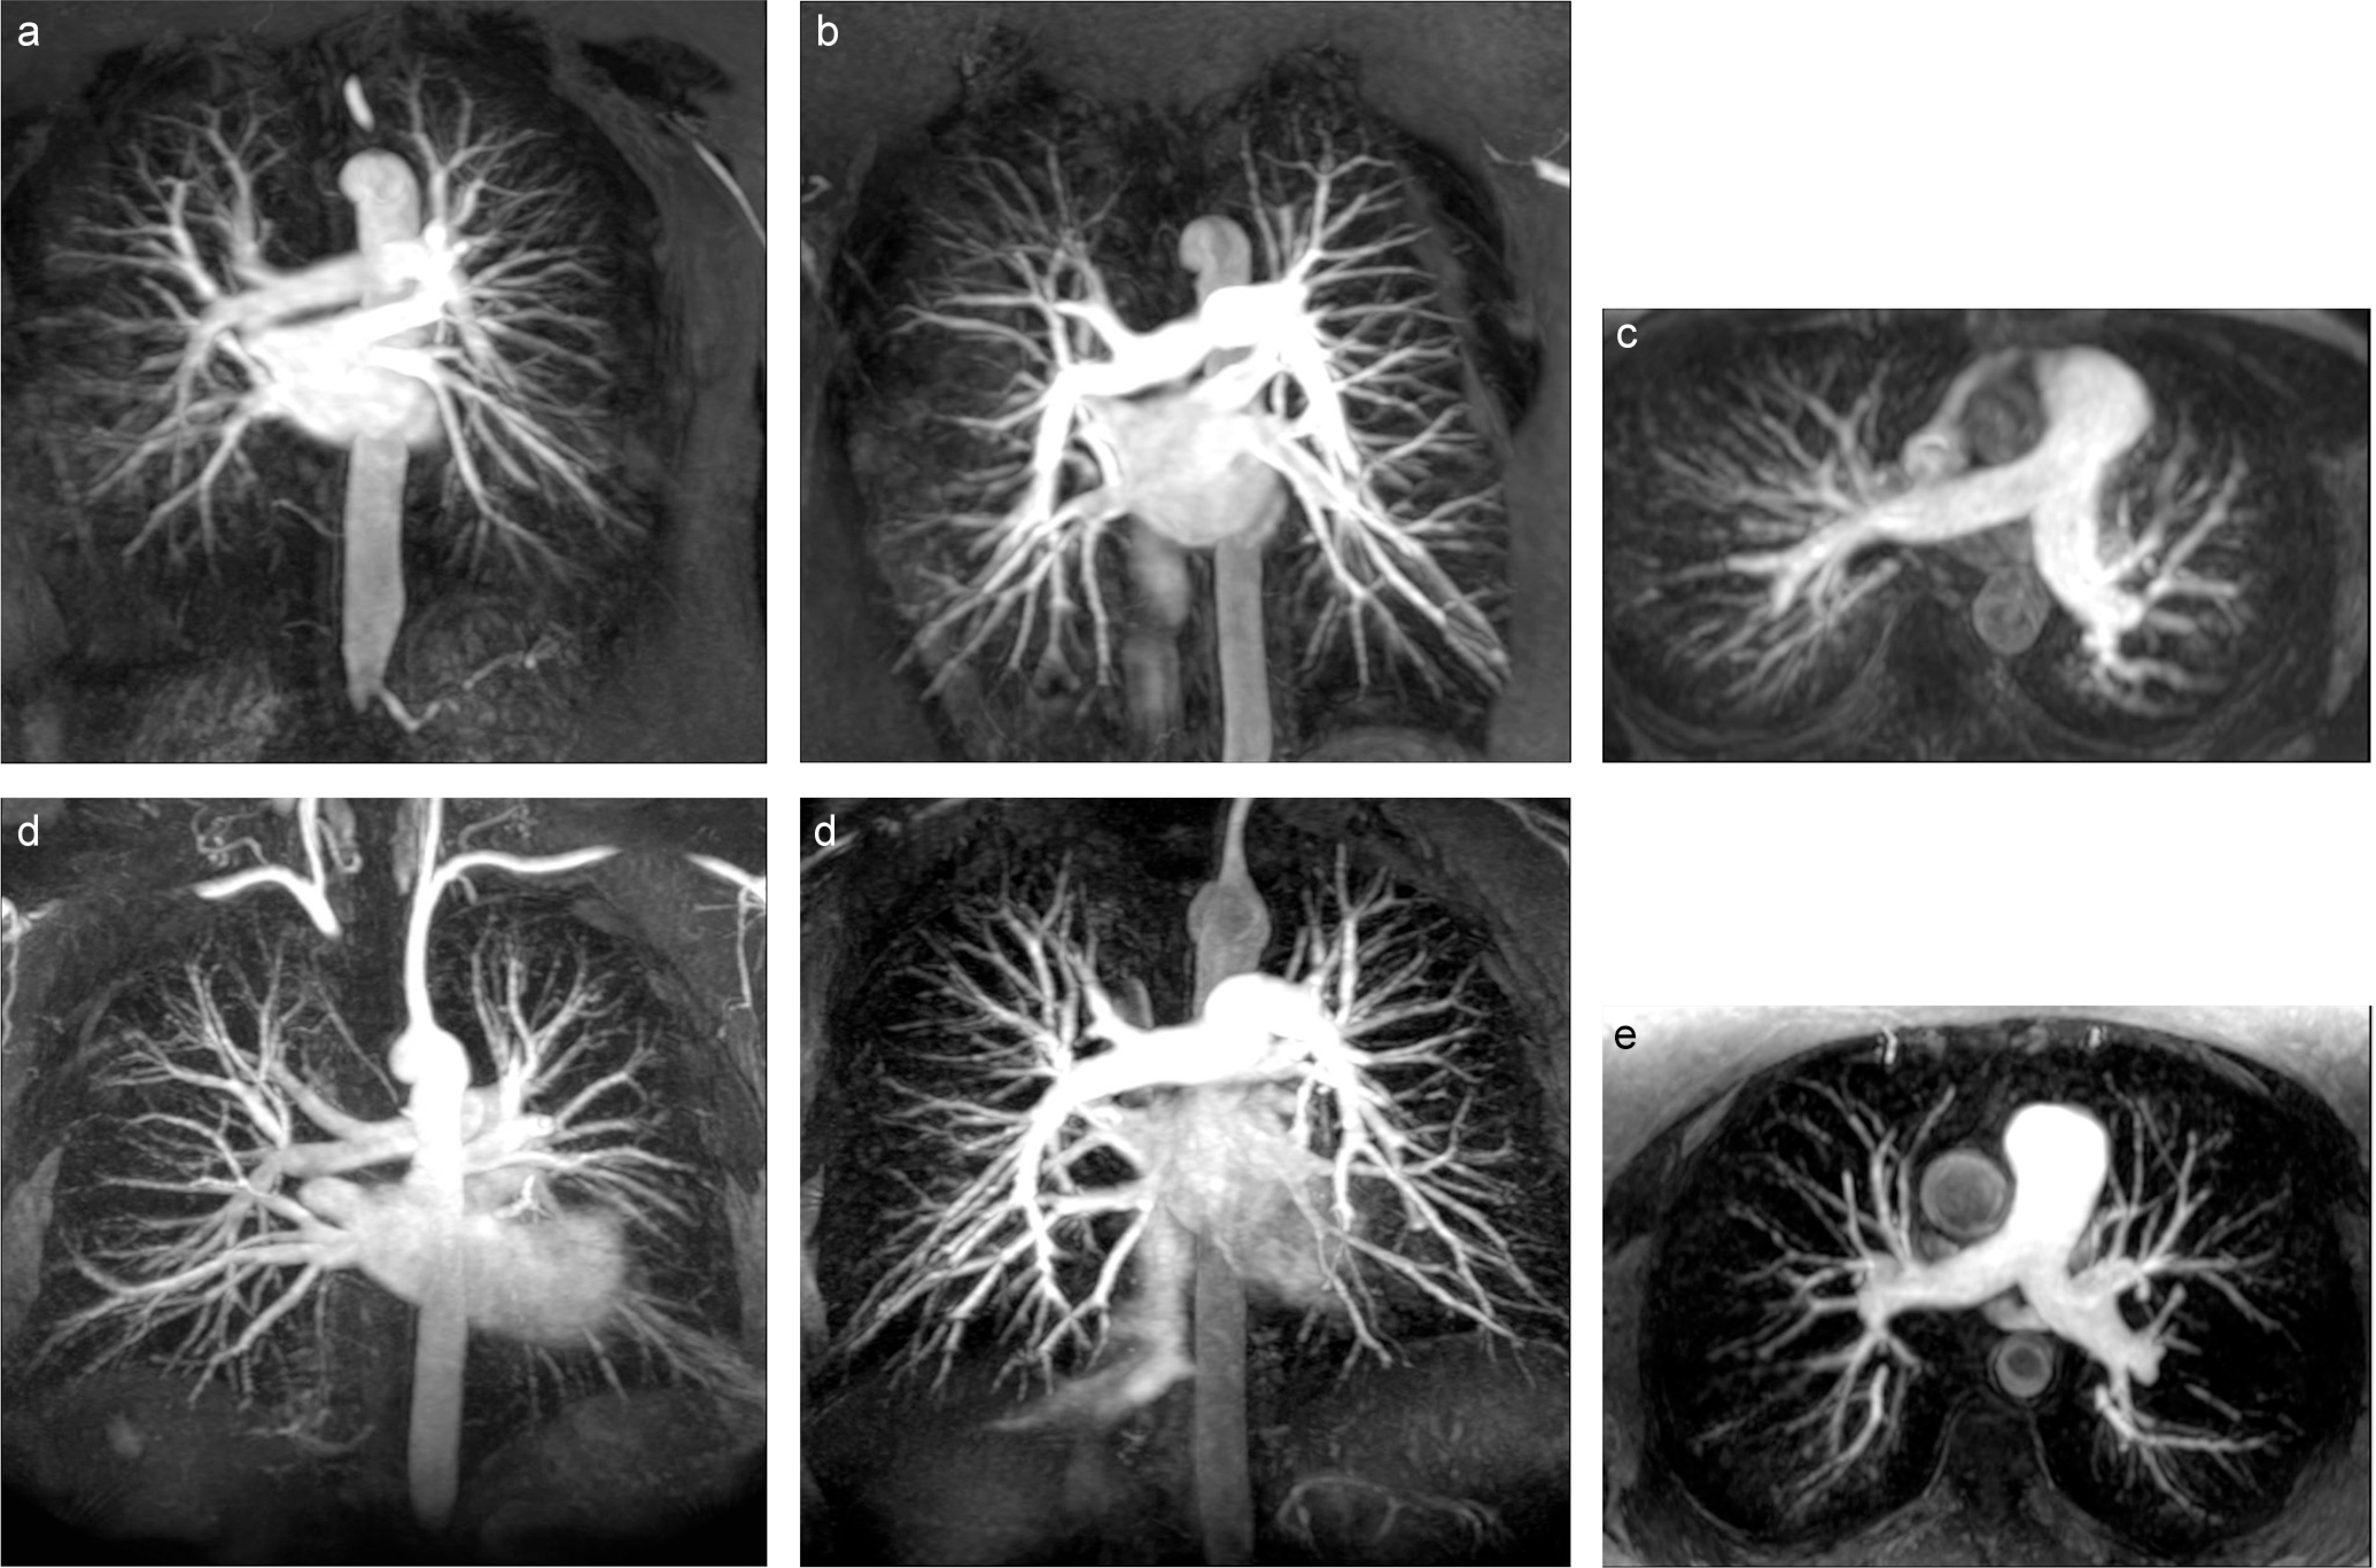
Representative subvolume, pulmonary MRA MIPs of patients scanned at 1.5 T (A, B, and C) and 3 T (D, E, and F). Coronal 7.5 cm thick subvolume MIPs demonstrate the higher in-plane spatial resolution that was achieved on the 3.0 T scans (D and E) relative to 1.5 T (A and B) with comparable enhancement quality. Pulmonary MRA data sets shown in (B) and (E) were also reformatted into axial 3.5 cm thick subvolume MIPs (C and F, respectively), to illustrate the effect of thinner slices used for the 3 T. MRA indicates magnetic resonance angiography; MIP, maximum intensity projection.
Discussion
There are several magnetic field strength-dependent factors that affect image quality and SNR for a given MRI/MRA application. Despite an assumed SNR gain at 3 T, there are recognized physical and technical drawbacks to 3 T MRI. Local magnetic susceptibility gradients near air/tissue interfaces dephase 3 T signal more rapidly relative to 1.5 T. Field strength–dependent tissue relaxation rates along with higher per-pulse RF power deposition force imaging protocol adjustments that result in altered image contrast, signal-to-noise, and scan time. These along with dielectric-induced nonuniformity of the transmitted field, all affect the net gain (or loss) in the final SNR realized on 1.5 and 3 T images. Considering the pulmonary MRA application, for a fixed voxel size and technique factors, signal loss due to local magnetic susceptibility gradients in lung parenchyma is expected to be greater at 3 relative to 1.5 T. Indeed, this was demonstrated by others. 24 While signal loss in nonenhancing lung is greater at 3 T, others have demonstrated higher SNR in contrast-enhanced vessels at 3 T24,25 which is in agreement with our findings. These prior studies involved healthy volunteers, each scanned twice by contrast-enhanced MRA on 1.5 and 3 T systems (same vendor) with relatively fixed acquisition parameters. These groups demonstrated 50% to 80% increased SNR of contrast-enhanced pulmonary vasculature with 3 T. Our data involved 2 patient groups, all with symptomatic of PE, but scanned at 2 different institutions. Although the 1.5 and 3 T systems shared a common vendor, there were significant protocol differences driven in part by field strength issues and local preferences. The lower flip angle at 3 T was selected to reduce RF power deposition, which allowed a shorter repetition time thus more phase-encode steps per 22-s breath-hold interval. Lower flip angle can also reduce T1 contrast, but gadolinium contrast enhancement is amplified by longer tissue T1 relaxation times at 3 T. Shorter TR combined with higher SENSE factor allows a higher acquired matrix, resulting in reduced voxel volume which mitigates intravoxel signal loss due to magnetic susceptibility effects. In our study, the additional signal gain due to higher field strength led to a slight (13%-45%) but significant net SNR improvement in the 3 T studies and afforded a substantially higher spatial resolution. Our analysis of several SNR and CNR indices was performed to expose any potential bolus timing bias between the 1.5 and 3 T examinations, and none was revealed. The rationale behind this combination of SNR and CNR indices is to determine whether there is signal-to-noise difference between 1.5 and 3 T protocols but also detects any evidence of systematic bolus timing bias between the 1.5 and 3 T MRA scan groups. Recall, these studies were performed at separate centers by different staff. Test-dose calculations were based on peak enhancement in the main pulmonary artery, thereby targeting a high SNR1. However, if 1 center systematically added scan delay to favor downstream enhancement of the pulmonary veins and aorta, then SNR1 may be reduced somewhat but there would be a compensatory increase in SNR2 and SNR3. That is, all 3 SNR quantities reflect the degree of MRA contrast enhancement relative to noise, although the sensitivity to precise bolus timing is reduced by inclusion of multiple vascular targets that enhance over a broader temporal window. By similar argument, CNR1 and CNR2 are quantities designed to amply sensitivity to potential timing bias between 1.5 and 3 T groups. That is, if either center systematically aimed for maximal pulmonary artery enhancement at the expense of downstream pulmonary vein and aorta enhancement, then CNR1 and CNR2 should increase relative to results where one conservatively adds scan delay to favor downstream enhancement which reduces CNR1 and CNR2. Moreover, both patient groups appear to be hemodynamically similar suggesting the sustained high SNR level at 3 T was not a result of operator bolus timing or patient hemodynamics.
Our subanalysis of PIOPED III data was strictly limited to investigate the impact of field strength on contrast-enhanced pulmonary MRA signal to noise. For consistency, we used ROIs drawn by 1 individual on clearly defined large vascular targets relative to nonenhanced lung tissue. These measurements were performed independent of other PIOPED III measures done at the various participating centers and by central readers. Central readers assessed presence or absence of PE, subjectively scored degree of vascular opacification for 3 orders of pulmonary arteries (main/lobar, segmental, and subsegmental) and level of artifacts (image wrap, parallel imaging artifact, and motion artifact). 26
Conclusion
In this comparison of MR PE examinations, we were able to demonstrate that relative to 1.5 T, there was a significant gain (>13%) in signal to noise in the pulmonary vasculature at 3 T. This gain in signal was achieved despite a higher spatial resolution. We also were unable to detect any systematic operator bias in bolus timing or a difference in patient hemodynamics that could have attributed to this difference.
Footnotes
The authors declared no potential conflicts of interest with respect to the research, authorship, and/or publication of this article.
The authors received no financial support for the research, authorship, and/or publication of this article.