
Abstract
Monitoring of direct inhibitors of thrombin (DTI) is critical for their safe and effective use as anticoagulants. We examined samples containing several concentrations of argatroban or lepirudin in reconstituted standard human plasma and plasma from medical outpatients and intensive care patients. Prothrombin time (PT), activated partial thromboplastin time (aPTT), and thrombin time (TT) were determined using automated analyzers. Ecarin clotting time (ECT) was measured using a 10 IU/mL dilution of ecarin in 0.05 mol/L CaCl2. Calibration curves were approximately linear for TT and ECT in samples containing argatroban and lepirudin, respectively. Activated partial thromboplastin curves reached a plateau at DTI concentrations ≥2 µg/mL, suggesting that the aPTT may not reliably detect overdosing. Prothrombin time increased exponentially. A broad range of clotting times was seen in patient samples with all tests suggesting that individual morbidity and therapies may strongly influence test results and may lead to underestimation of DTI doses.
Introduction
Argatroban, a small-molecule, direct inhibitor of thrombin (DTI), is used as anticoagulant for prophylaxis and therapy of thromboembolic complications in type-II heparin-induced thrombocytopenia (HIT II). 1 –3 Argatroban offers several advantages compared to lepirudin or bivalirudin, both recombinant bivalent and irreversible DTIs. Reversible binding of argatroban to the active centre of thrombin and a short plasma half-life of 60 minutes provide safe anticoagulant control. 3,4 Hepatic elimination is fast and prevents accumulation of argatroban in patients with renal failure, which makes argatroban a frequent choice for anticoagulation during dialysis. 5,6 Even repeated use will not lead to the formation of specific antibodies, and there is no cross reactivity with HIT-II antibodies because argatroban is a small chemical compound and not a protein. 7 Argatroban reaches plasma concentrations up to 2 µg/mL, with infusion doses up to 10 µg/kg per minute in healthy volunteers (http://us.gsk.com/products/assets/us_argatroban.pdf).
Functional drug monitoring using appropriate clotting tests is recommended for safe and optimal anticoagulation by DTIs. The analysis of the activated partial thromboplastin time (aPTT) is generally recommended for argatroban: aPTT should be determined before therapy (baseline) and at least once daily during treatment. The target aPTT of a steady state reached after few hours of treatment should be 1.5- to 3.0-fold of baseline aPTT but must not exceed 100 seconds. 8
However, the aPTT does not appear to be the optimal choice for several reasons. For example, the dose-effect relationship is not linear for higher doses and aPT-times >100 seconds. A direct comparison between measurements with different aPTT reagents is impossible because the commercial aPTT assays exhibit different sensitivities toward DTIs. 8,9
We examined several hemostaseological tests to determine whether there are better alternatives to the aPTT assay to monitor DTIs. We compared aPTT to the prothrombin time (PT), the thrombin time (TT), and the ecarin clotting time (ECT), which is the recommended assay for the monitoring of lepirudin. Plasma samples containing defined concentrations of argatroban and lepirudin (control) were prepared by adding of appropriate amount of argatroban and lepirudin. The plasma samples were analyzed in a central hospital laboratory under routine conditions. Samples from patients who were seen in the outpatient unit, or who were hospitalized in the departments of cardiac surgery or gastroenterology, were included to determine the generalizability of the results.
Methods
Prothrombin time and aPTT were determined using an automated CA7000 analyzer (Siemens Healthcare, Germany) and assay protocols using original reagents as recommended by the manufacturer. Thrombin time was determined in plasma samples that were first diluted 1:10 (v/v) using physiological saline and then 1:1 (v/v) using standard human plasma (SHP; Dade Behring GmbH, Germany). Thrombin time was then determined in these diluted samples using original reagents and protocols for the CA7000 analyzer. These preanalytical dilution steps were required to obtain clotting time ranges below 150 seconds in the TT assay. Otherwise, clotting times would exceed >600 seconds. Ecarin clotting time was determined using a KC10 clotting timer (Amelung, Germany) and a 10 IU/mL dilution of ecarin (Sigma-Aldrich, Germany) in 0.05 mol/L calcium chloride as previously described. 10
Calibration
Argatroban and lepirudin were added to samples of SHP to obtain calibration samples with defined concentrations (0 µg/mL, 0.25 µg/mL, 0.5 µg/mL, 1.0 µg/mL, 2.0 µg/mL, 4.0 µg/mL). These samples were analyzed in duplicate to obtain calibration curves for all tests reported here. Calibration samples were also used to determine within-run (n = 10) and between-day (n = 3) coefficients of variation for ECT and TT.
Patient Samples
Anonymous sample materials remaining after routine diagnostics were obtained from patients who were seen in a general outpatient unit or were hospitalized in the Departments of Cardiac Surgery or Gastroenterology. Argatroban or lepirudin were added to these samples to obtain a final concentration of 2 µg/mL, respectively. Similar concentrations can be measured in many patients receiving a “high-dose” anticoagulation regime. Ecarin clotting time, TT and aPTT were determined in patient samples.
Statistics
This study was descriptive. Quantitative results were summarized calculating arithmetic means. The coefficient of variation was obtained by dividing standard deviations by the means and by multiplying these results with 100%. All measurements including outliers are illustrated in Figure 3 rather than giving 95% confidence intervals. The purpose was to point to the large within-group variation that can be expected. Between-group comparisons were not intended and did not make sense because nothing was known about the anonymous samples except for their origin.
Results
Dose-Response Relationships
As expected, all clotting assays demonstrated a close correlation between their test results and the increasing concentrations of argatroban or lepirudin (Figures 1 and 2 ). A linear response curve was obtained for ECT and lepirudin, only. Curvilinear responses suggested that ECT and TT were more suitable for monitoring argatroban than aPTT or PT. However, if the concentration of argatroban exceeded 1 µg/mL, ECT became longer than 200 seconds. In contrast, TT remained below 100 seconds until concentrations of argatroban exceeded 3.5 µg/mL. Although the dose response of TT was curvilinear for argatroban concentrations up to 4 µg/mL, TT exhibited an exponential dose-response curve for lepirudin and TT was markedly longer than 100 seconds in SHP with a concentration of 2.0 µg/mL lepirudin.
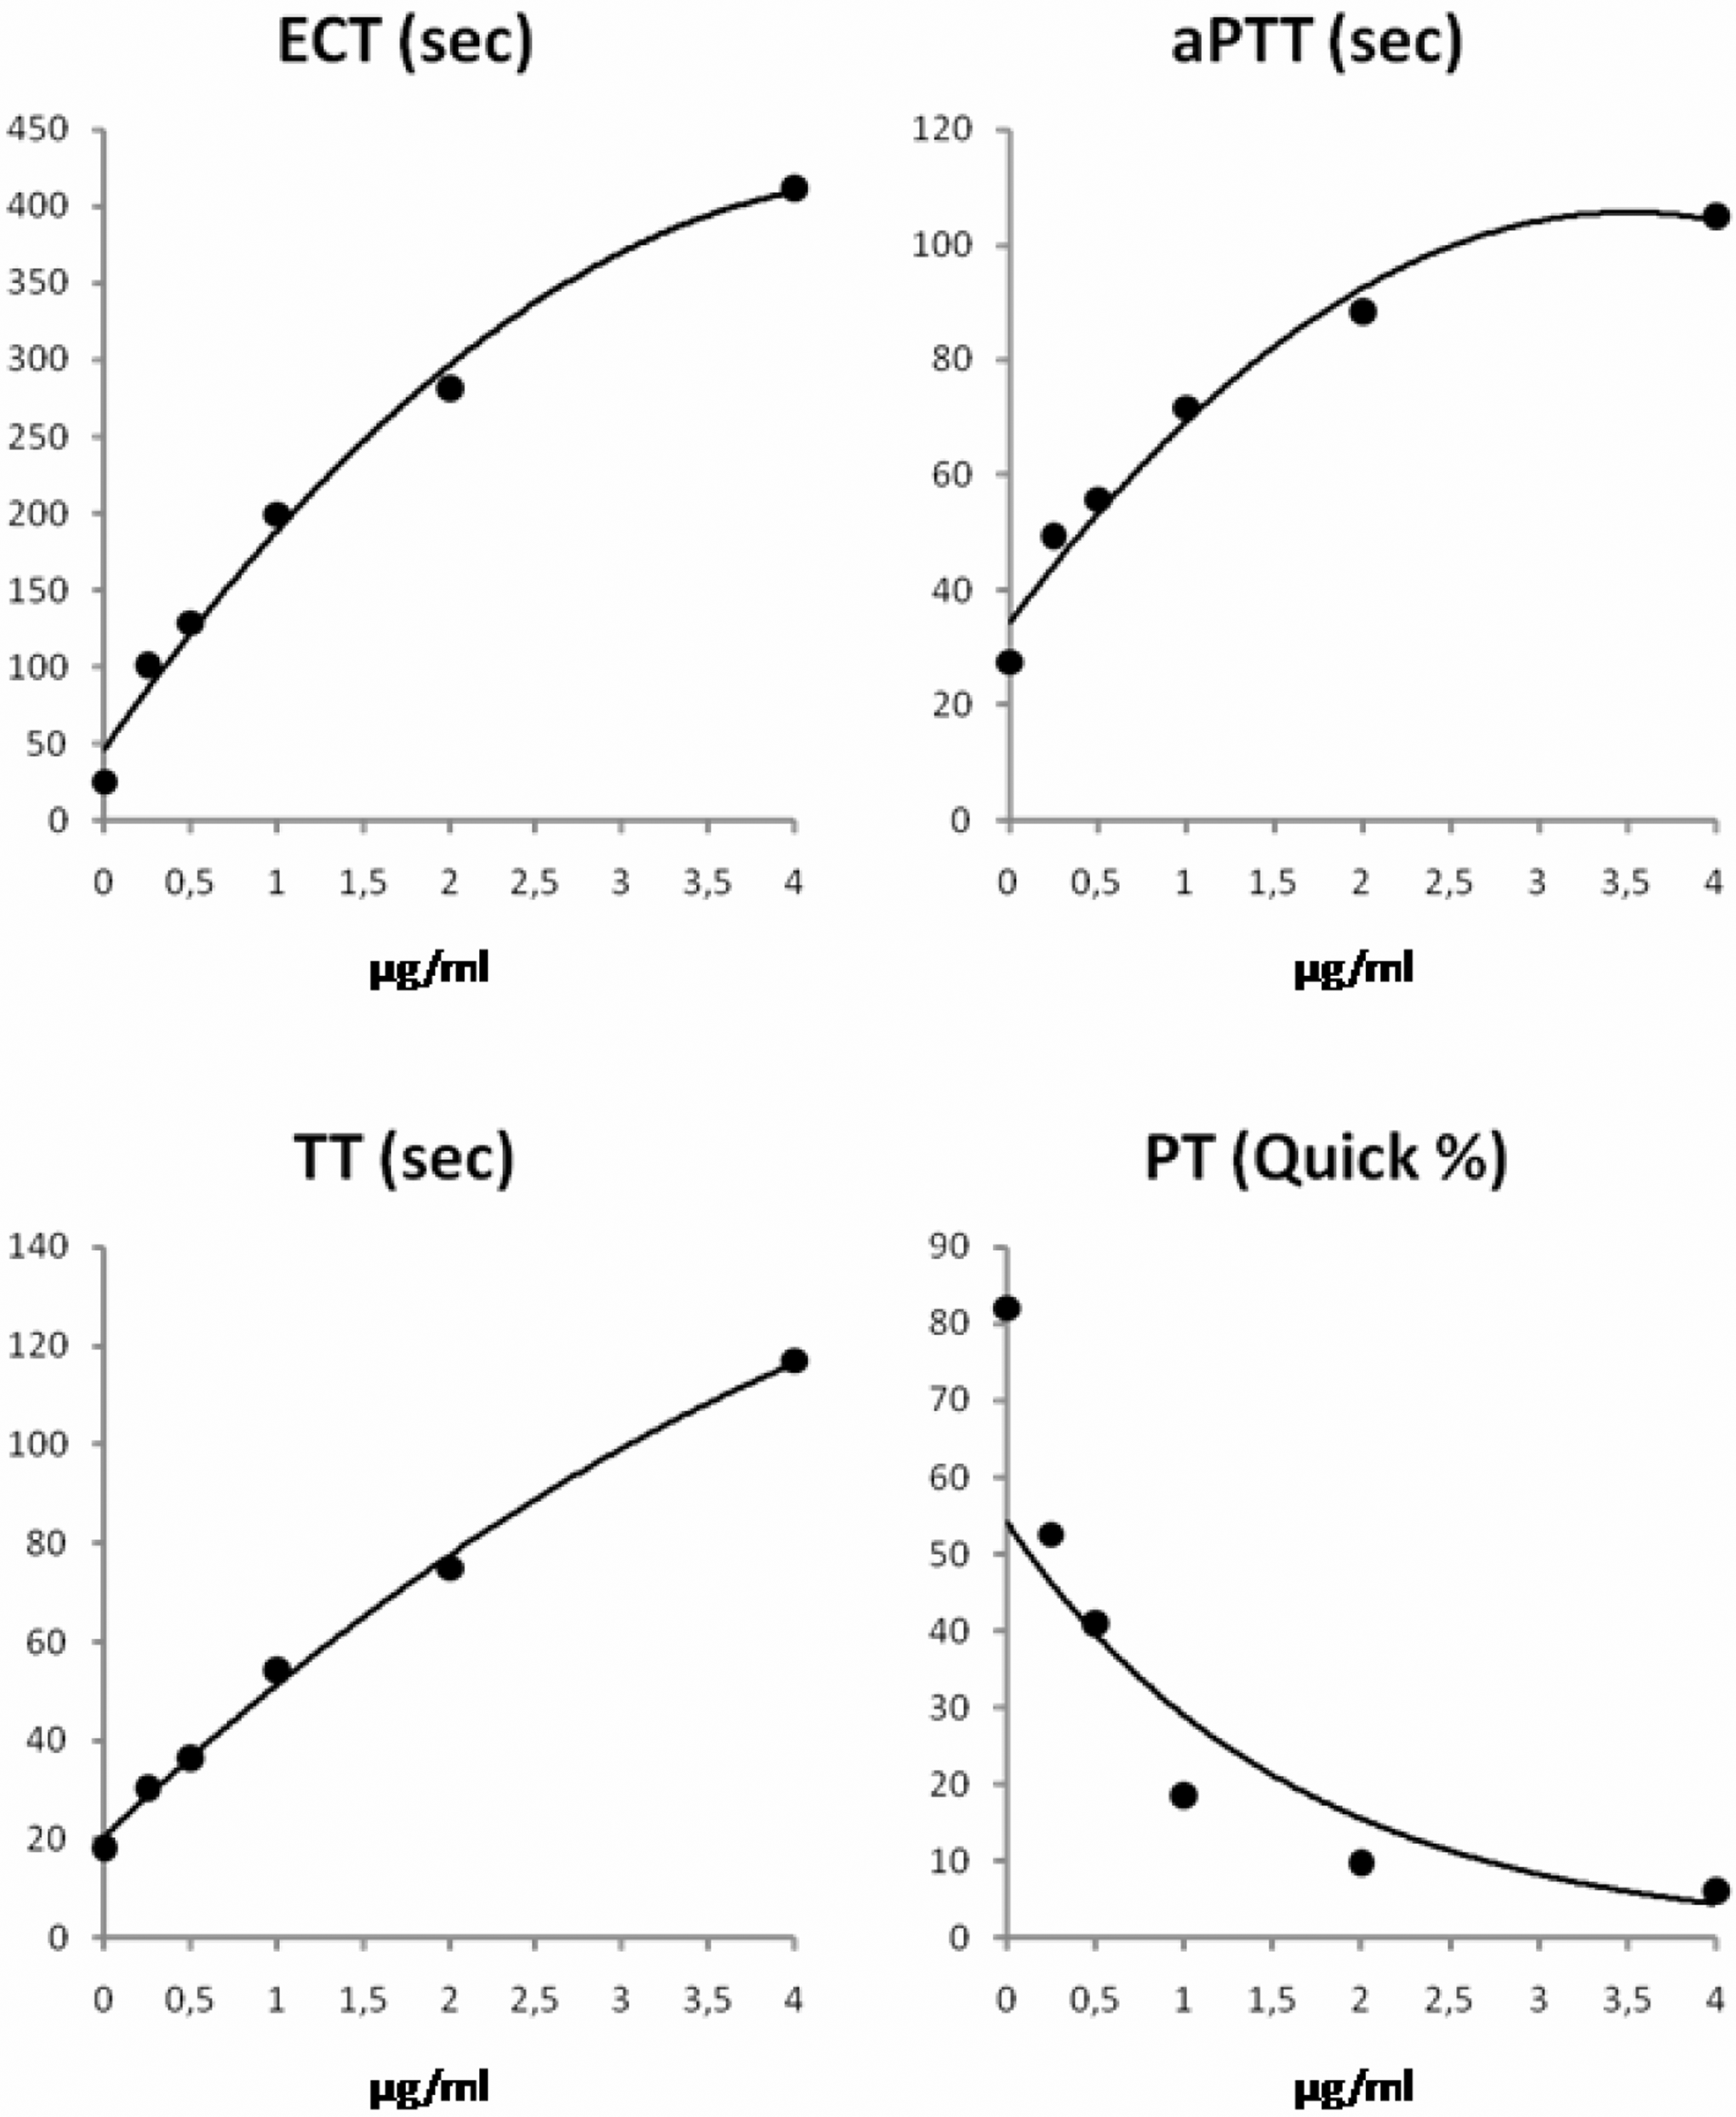
Dose-response curves for argatroban in standard human plasma.
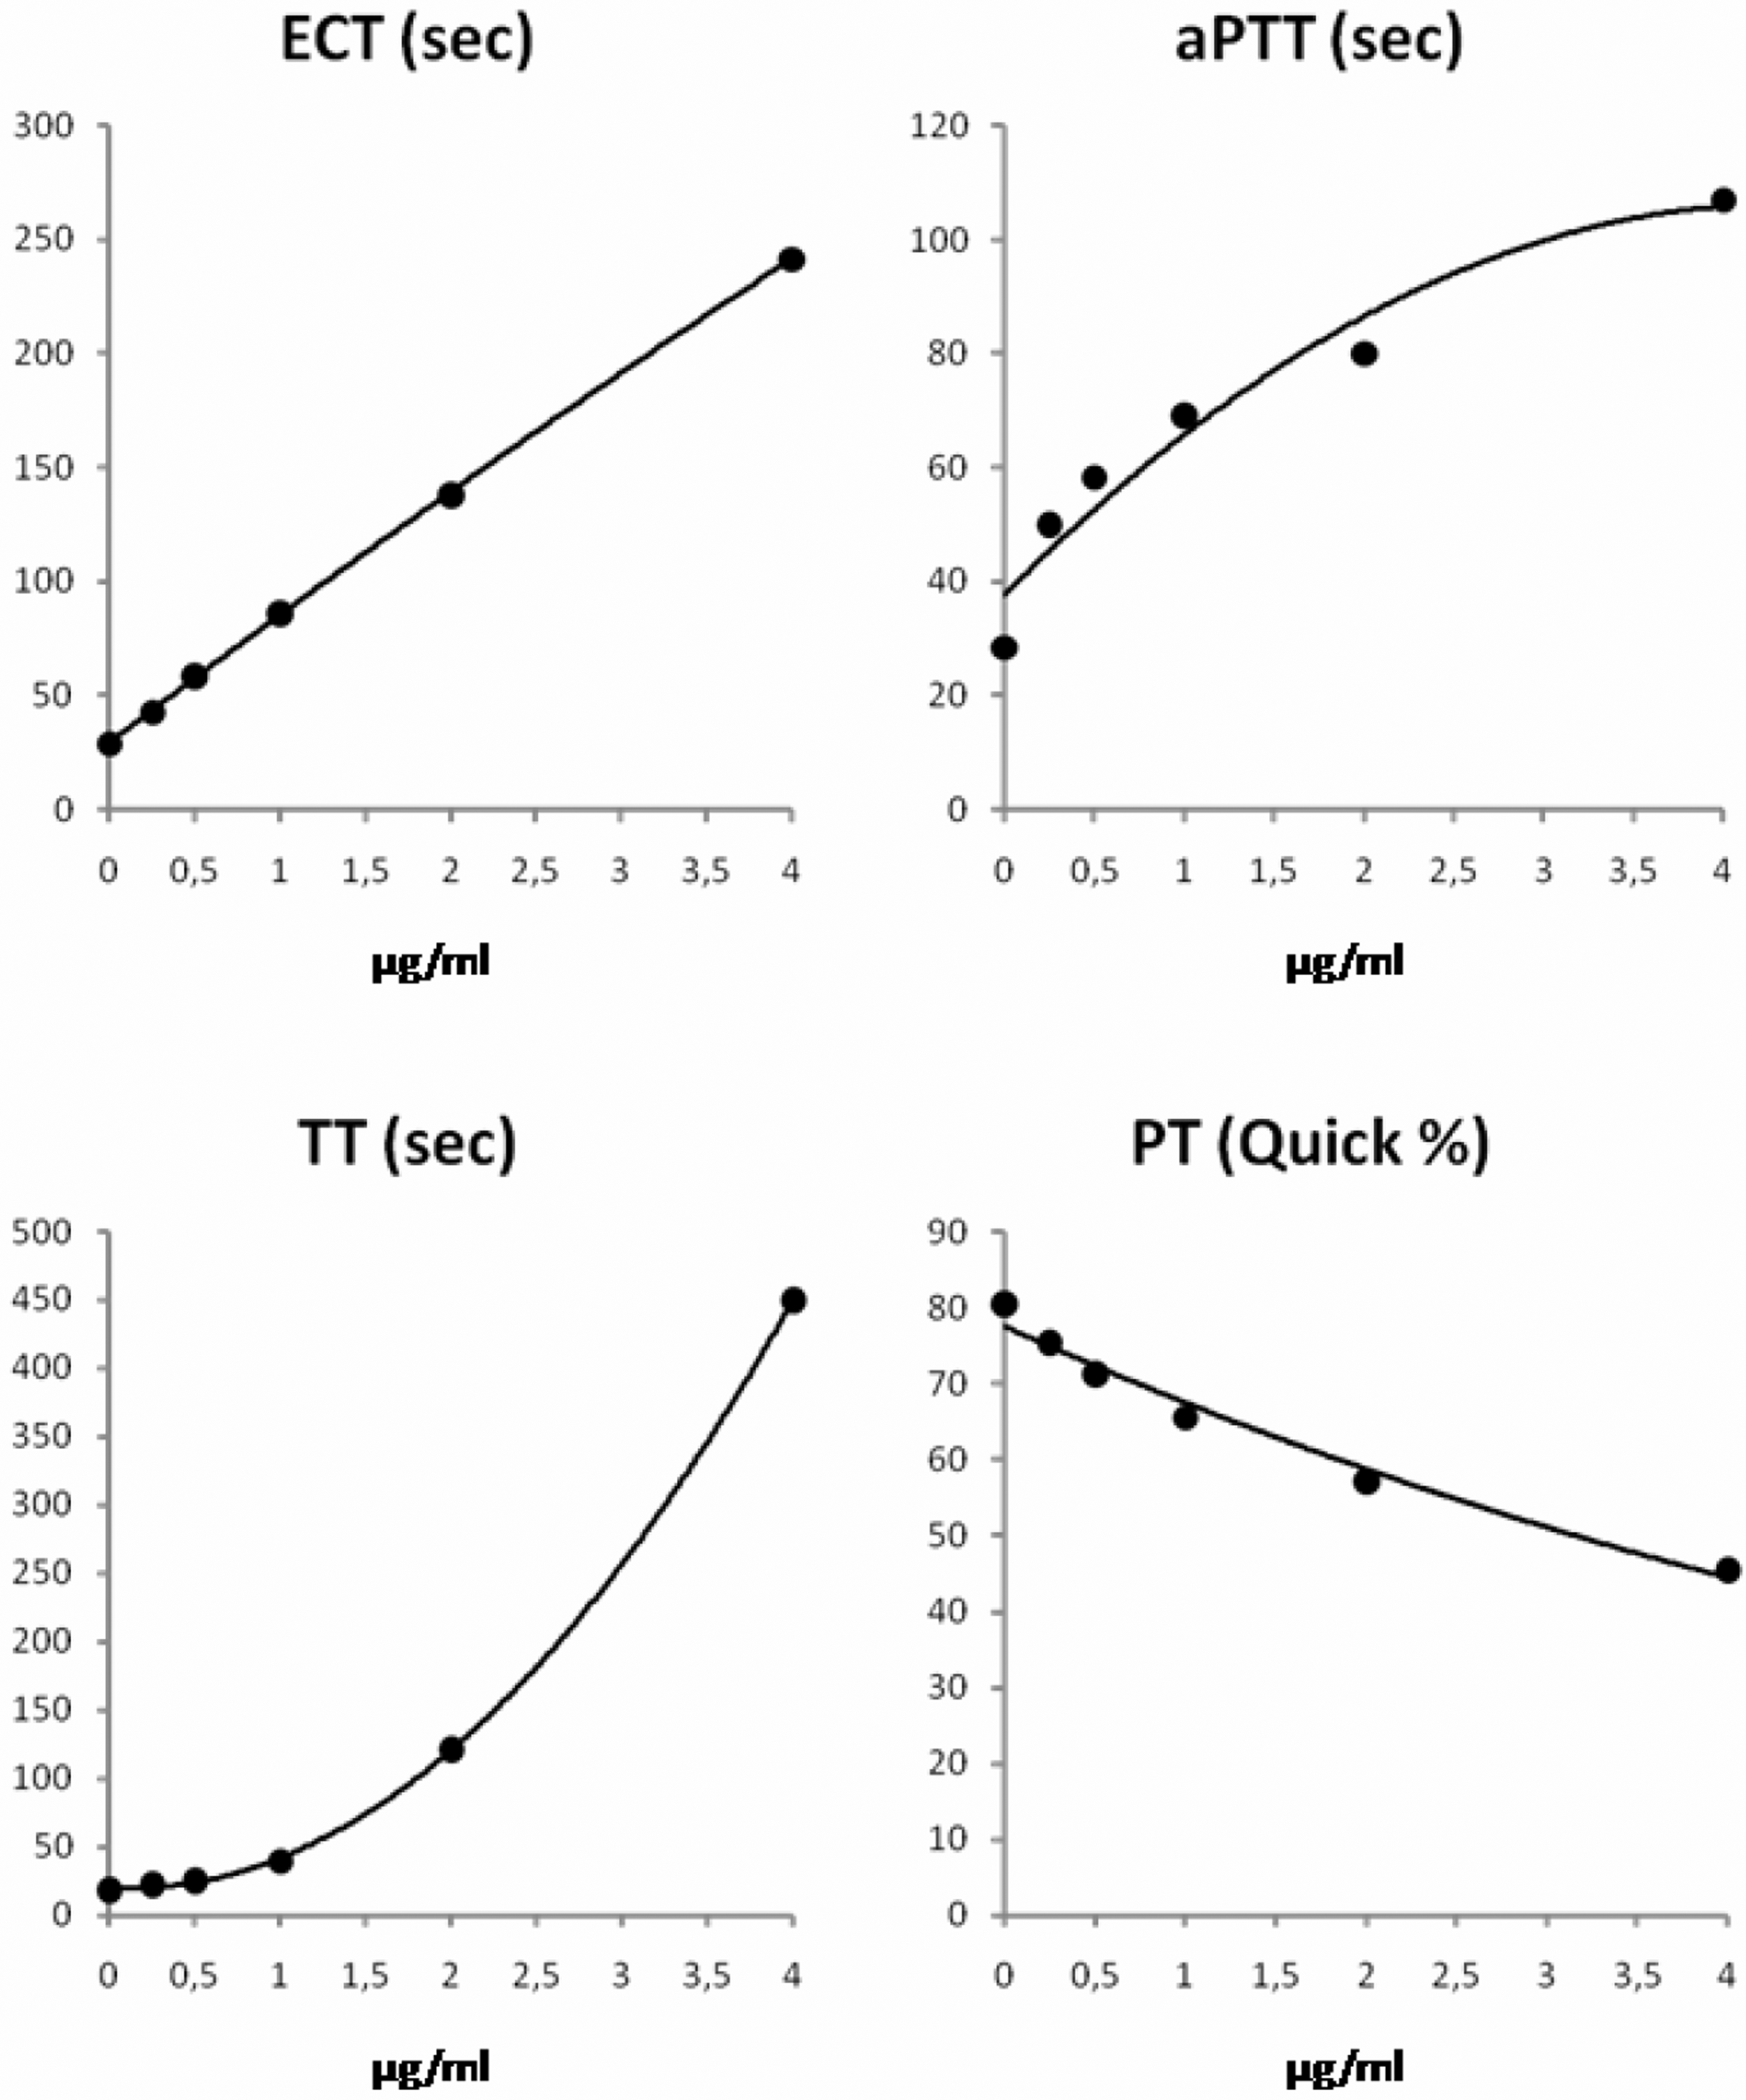
Dose-response curves for lepirudin in standard human plasma.
Dose responses of aPTT were similar for both argatroban and lepirudin. If the concentration of argatroban was higher than 2 µg/mL, the aPTT reached a plateau at approximately 90 seconds (Figure 1). Consequently, aPTT could not differentiate concentrations ≥2 µg/mL argatroban because aPTT hardly increased even if the concentration of argatroban increased further. Activated partial thromboplastin time results are usually reported up to a prespecified cutoff. In the laboratory in which the study was carried out, the respective cutoff was 150 seconds. This cutoff was too high to be used for detecting DTI overdoses.
Prothrombin time increased markedly producing Quick values <10% (corresponding INR >5) for argatroban concentrations ≥2 µg/mL (Figure 1). In comparison, the increase in PT and hence the decrease in Quick value was smaller with lepirudin (Figure 2).
Individual Dose Response in Patients
Morbidity and therapeutic interventions may influence the dose response to DTIs in addition to the pharmacodynamic relationships described above. To demonstrate the existence of these influences, we examined plasma samples from 3 different groups of patients: outpatients who were seen in the general medical department (group “Outpatient”), patients who were hospitalized in the intensive care units of the department of cardiac surgery (group “Cardio”), and the department of gastroenterology (group “Gastro”). Although argatroban or lepirudin were added in the same way to all samples to obtain final concentrations of 2 µg/mL, the test results differed much between the patient groups (Figure 3). Clotting times of all tests tended to be longer in the groups “Cardio” and “Gastro” than in the group “Outpatient” (Figure 3).
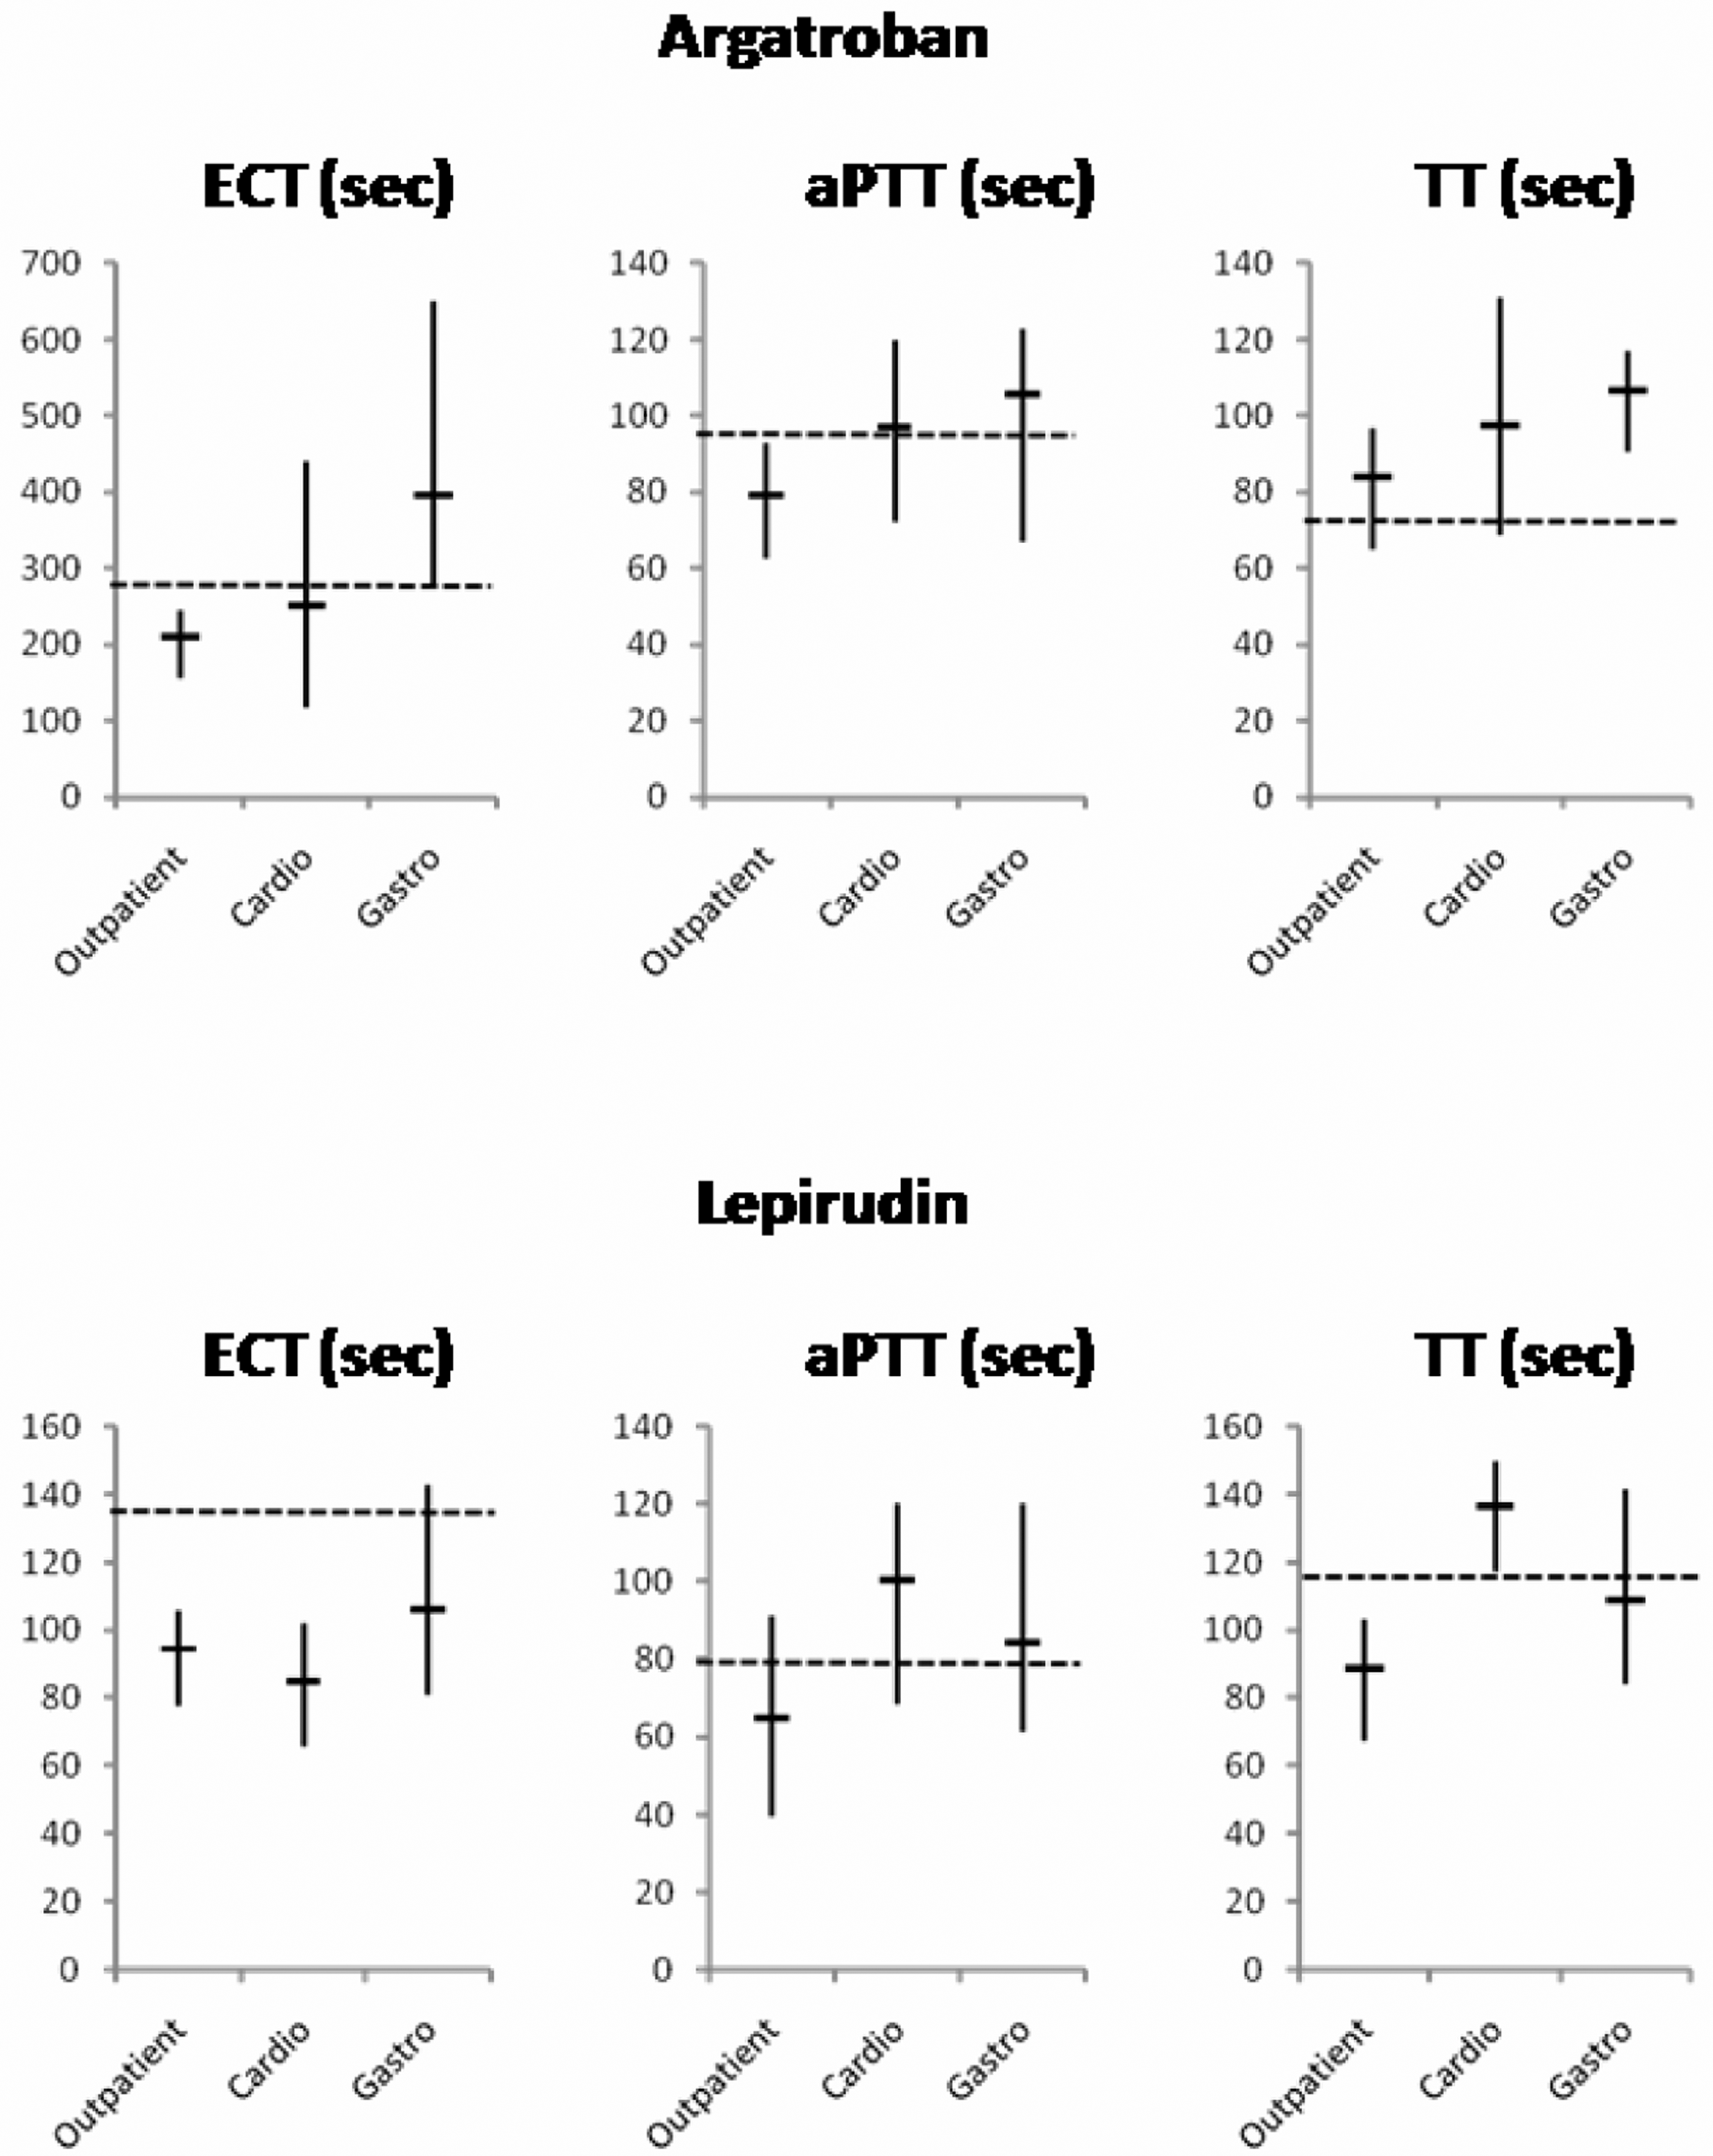
Clotting times measured by use of ecarin clotting time (ECT), activated partial thromboplastin time (aPTT), or thrombin time (TT) assays in citrate plasma samples containing 2 µg/mL of argatroban or lepirudin. Samples were obtained from patients (n = 10 in each group) who were either seen in a medical outpatient unit (“Outpatient”) or were hospitalized in intensive care units at the Departments of Cardiac Surgery (“Cardio”) or Gastroenterology (“Gastro”). Vertical bars span the full range of results (minimum to maximum) and short, horizontal bars delineate the means of each group. The broken horizontal lines illustrate the clotting times determined in SHP, which contained a concentration of 2 µg/mL of argatroban or lepirudin.
Imprecision Correlated With the Concentration of Thrombin Inhibitors
Serial measurement and daily determinations revealed an increasing imprecision with increasing concentrations of argatroban or lepirudin (Table 1 ). The coefficients of variation remained within the ranges generally accepted for clotting assays such as PT and aPTT. Thrombin time showed less reproducibility than ECT, probably because its determination involved a 2-step manual dilution. Coefficients of variation were not obtained for PT and aPTT because they are routinely determined anyway in every clinical laboratory.
Coefficients of Variation (CV) of ECT and TT Assays in SHP Containing 0, 0.25, or 2.5 µg/mL Argatroban or Lepirudin, Respectively
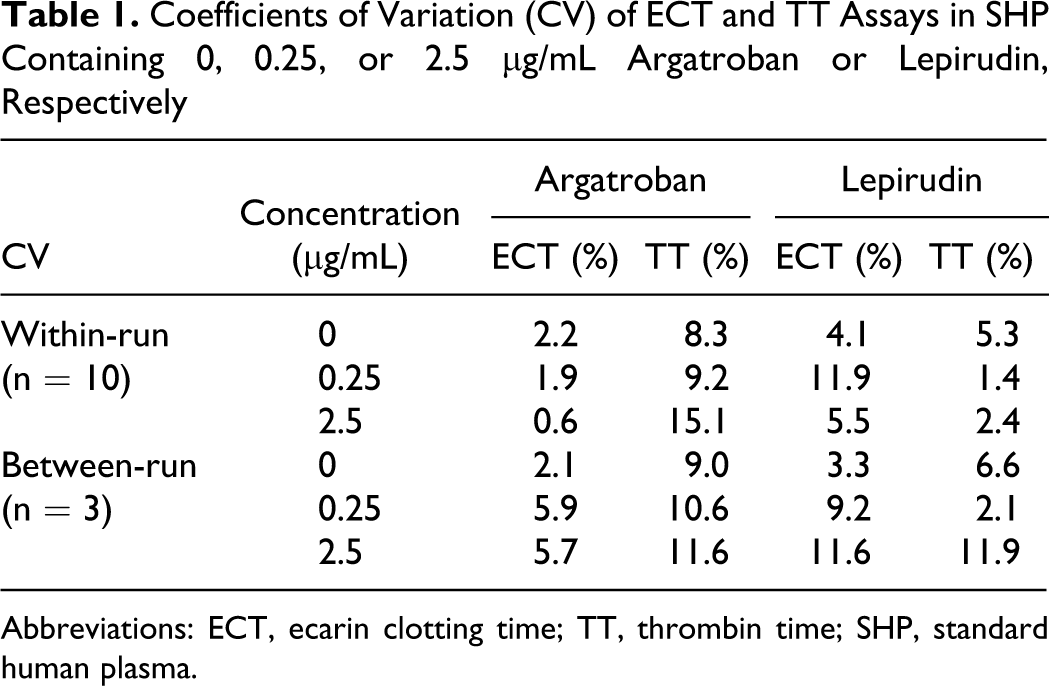
Abbreviations: ECT, ecarin clotting time; TT, thrombin time; SHP, standard human plasma.
Discussion
Monitoring of DTIs is critical for their safe and effective use as anticoagulants in patients with suspected or diagnosed HIT II. These patients are often severely ill and may have recently undergone surgery or other invasive procedures. Therefore, circulatory or organ failure and multiple drug interactions rather than a narrow therapeutic range may account for a highly variable, individual bleeding risk, which makes correct dosing of DTIs challenging. Clearly, the determination of pharmacological DTI concentrations would insufficiently reflect the hemostaseological situation present in critically ill patients. In the past, several authors reported dose-response relationships between either argatroban or lepirudin and 1 or 2 clotting tests in particular conditions, for example, type II heparin-induced thrombocytopenia or in the presence of lupus inhibitors. 8,9,11,12 We report here a more comprehensive, direct comparison of argatroban and lepirudin using 4 frequently used clotting tests and examined the generalizability to clinical patients of the dose-responses obtained with SHP.
For DTI monitoring, it is generally accepted to employ functional assays that involve 1 or several steps of the clotting cascade. One-step assays usually contain bovine thrombin (eg, TT) or reagents that directly generate thrombin (e. g. ECT). Hence, the direct interaction of the thrombin reagent with the reversible DTI argatroban and with the irreversible DTI lepirudin produced approximately linear and exponential dose responses, respectively, in the TT assay. Typical clotting assays, such as aPTT, involve multiple steps of the clotting cascade and the thrombin-dependent activation of clotting factors, for example, factor VIII. Interestingly, the calibration curve of the aPTT reached a plateau for argatroban or lepirudin concentrations ≥2 µg/mL. This is consistent with increasing substrate inhibition in a classical enzymatic reaction and suggested that, at high concentrations, argatroban molecules may increasingly compete for their binding sites.
The dose-response relationships obtained with SHP cannot directly be translated to the clinical situation where patients may have additional coagulation problems and therapies. Under ideal conditions, individual calibration curves should be prepared for each patient using their plasma rather than SHP before DTI therapy was started. As this is difficult to realize in a large hospital, we examined also sample material from patients to assess the magnitude of the difference between clotting times obtained in SHP and patient plasma. As this study analyzed anonymous sample remainders (after other routine diagnostic tests were performed in them), further details on the patients' diseases or treatments were not available. Only the origin of the samples was known. There was also no sample material left for additional phenotyping of the clotting system.
The agreement between the results obtained with SHP and patient plasma samples, which all contained 2 µg/mL of argatroban or lepirudin, was important to determine whether calibration curves obtained with SHP could be relied on for monitoring. Not unexpectedly, the range of clotting times obtained with different patient samples was large for ECT, aPTT, and TT, respectively. However, for some patients, the deviation from the result obtained with SHP was surprisingly large (up to 100%). The aPTT seemed to agree better with the results obtained in SHP compared to other tests. Notably, this may not be true and could be explained by the plateau of the dose-response curve of the aPTT. Standard human plasma and patient samples do not agree better but the aPTT can hardly differentiate them if DTI concentrations are equal or greater than 2 µg/mL.
In summary, our experimental study shed light on some aspects of DTI monitoring, which deserve further investigation because they are clinically relevant. First, we confirmed the nonlinear dose response of a frequently used aPTT assay. Importantly, this test may be “blind” in a situation where it is needed most, that is, to reliably detect overdosing. One-step assays are clearly superior in this situation. The TT with prediluted samples and the ECT were most appropriate for the monitoring of argatroban and lepirudin, respectively. Although simple, these tests are also influenced by individual factors present in many of the patients targeted for DTIs, for example, the concentrations of factor II, antithrombin, fibrinogen, or fibrin degradation products. This clinically relevant problem is demonstrated by the ECT, which was specifically developed for the monitoring of lepirudin. Although ECT offered a linear dose response, the concentrations of lepirudin were underestimated in almost all patients when compared to SHP (Figure 3). A limitation of our study is the lack of additional data, which could explain this disagreement: baseline results (ie, before addition of argatroban or lepirudin) of PT, aPTT, TT, and ECT were not determined because plasma sample material was limited.
In conclusion, it appears advisable to determine clotting times with a linear, automated assay system, for example the TT test with prediluted samples, in the patient sample before DTI therapy is started (baseline determination). The dose of the DTI should then be targeted to obtain a 1.5× to 3.0× increase in clotting times compared to baseline. The use of a calibration curve made by use of SHP is discouraged. Notably, the clinical consequences of these suggestions remain to be elucidated further.
Footnotes
The author(s) declared no conflicts of interest with respect to the authorship and/or publication of this article.
The author(s) disclosed receipt of the following financial support for the research and/or authorship of this article: Mitsubishi Pharma Deutschland GmbH.