
Abstract
The effectiveness of empagliflozin (EMPA), a sodium glucose cotransporter type 2 inhibitor, on the kidney, pancreas, and heart was investigated in the Cohen Rosenthal diabetic hypertensive rat model (CRDH rat). Six-week-old CRDH male rats were fed a sugar diet (SD) and treated with the compound EMPA (group Drug/SD) or respective comparator with vehicle (group Veh/SD). A control group was fed a regular diet without treatment (group Veh/P). Preventive treatment with EMPA was measured during 4 months of follow-up. The treatment effect was evaluated according to results observed after 4 months in group Drug/SD when compared to those in group Veh/SD. Significant effect resulted in the following parameters: enhancement of urinary glucose excretion in association with diuresis; amelioration of postprandial hyperglycemia and fasting blood glucose levels; and decrease in calculated Homeostatic Model Assessment of Insulin Resistance (HOMA-IR) as well as lower systolic and diastolic blood pressures. At the end of treatment, EMPA preserved nephrin integrity in the kidney, reduced proteinuria, and prevented diabetes-induced damage to glomerular diaphragm structure. In the pancreas, EMPA demonstrated an impressive decrease in fatty infiltration and atrophy. Blood pressure was significantly reduced in the EMPA-treated group (15 ± 5.1 mm Hg, P < .05) in contrast to the vehicle and control groups. Finally, compared to controls, EMPA significantly reduced left ventricle (LV) mass and LV systolic dilatation, according to 2-dimensional echocardiography. The importance of the study lies in demonstrating the efficacy of an antidiabetic drug with beneficial effects on blood pressure, weight, kidney, and pancreas and a positive effect on the heart.
Keywords
Introduction
Estimates of the increase in diabetes mellitus (DM) in the coming decades reach as high as 552 million people affected by type 2 diabetes mellitus (T2DM) by the year 2030. 1 The worldwide prevalence of diabetes has been well established, but there is little documentation on the leading cause of mortality in patients with DM—cardiovascular (CV) disease, which accounts for more than half the deaths in these patients. 1 Decreasing rates of cardiovascular events have proved to be more difficult than simply intensifying the management of hyperglycemia. 2
Until recently, the kidney’s central role in regulating the balance of glucose was largely ignored. Now, a new class of drug has been developed that targets the sodium glucose cotransporter type 2 (SGLT2), which is mainly expressed in the kidney. Inhibition of the SGLT2 by the new antidiabetic drugs lowers plasma glucose levels mainly by raising urinary glucose excretion. The main activity of SGLT2 transporter, which is confined to the S1/S2 segment of the proximal renal tubule, is reabsorption of glucose and sodium following kidney filtration. Their mode of action in lowering glucose levels is unique in that it is independent of pancreatic β-cell function and the degree of insulin resistance. Of the 3 mechanisms that regulate glucose homeostasis—the release of glucose into the circulation via gluconeogenesis, its uptake from the circulation, and its reabsorption into the circulation from glomerular filtrate—reabsorption appears to be a major contributor to elevated glucose levels in patients with T2DM. 3 The new class of drugs, gliflozin derivatives, has been found to reduce hyperglycemia, fasting, and postprandial blood glucose levels and to lower hemoglobin A1c by inhibiting the reabsorption of glucose by the kidney and promoting its urinary excretion. 3 –5 Apart from the glucose-lowering effect, they were also found to lower body weight and systolic blood pressure 6 and to reduce proteinuria. Chilton et al 7 emphasized the beneficial effects of empagliflozin (EMPA) on markers of arterial stiffness and vascular resistance.
Diabetic kidney disease, which develops in approximately 40% of patients with T2DM, further increases the morbidity and mortality due to CV disease, 8 highlighting the importance of the proven beneficial effect of the sodium SGLT2 inhibitor EMPA on the heart. Extensive efforts have been made to determine the relationships among the various risk factors for both diseases and treatment modalities that can interrupt that connection. The aim of the present study was to evaluate the beneficial effect of EMPA given as prophylactic monotherapy on amelioration of developing diabetes, and protection against renal and CV function parameters, in a unique rat model having both diabetes and hypertension, the Cohen-Rosenthal diabetic hypertensive rat (CRDH).
Methods and Materials
The Experimental Model
The CRDH model is the outcome of the cross-breeding between spontaneous hypertensive rats and Cohen diabetic rats. 9 At the age of 6 weeks, the animals are fed a sugar-rich copper-poor diet. Due to genetic as well as environmental cues present in the special diet given to the animals, they develop hypertension and T2DM at around 4 months of age. Examination of the prophylactic effect of a drug in this model proved feasible in a previous study with telmisartan. 10
Experimental Design
The experiment was designed to determine the protective effect of EMPA against developing cardiac and renal pathologies in the hypertensive and diabetic CRDH rats, in addition to the anticipated improvement in glucose homeostasis. The study was approved by the institutional review board of Tel Aviv University, which adheres to the Guide for the Care and Use of Laboratory Animals from the Institute for Laboratory Animal Research, National Research Council, Washington, DC, National Academy Press, 2011.
Six-week-old CRDH male rats (N = 36) were divided into 3 groups: Group Drug/SD (n = 12): CRDH rats given a sugar diet (SD) and treated with the compound BI-10773 (EMPA). Group Veh/SD (n = 12): CRDH rats given an SD with no treatment (Vehicle). Group Veh/P (n = 12): CRDH rats given regular chow or pellets with no treatment (Control).
Male rats available from the breeding colony were used, and the experiment was conducted in cycles, each cycle containing all 3 groups. An identical 4-month time line was designated for each of the cycles. The experiment was begun in the drug and vehicle groups with the introduction of the SD and treatment. During the course of the experiment, animals were subjected to diabetes and hypertension evaluation, and blood was collected at monthly intervals.
Drug Preparation and Dosing
Empagliflozin was dissolved in 1.5% ethanol until a clear solution was obtained, which was then added into the final water volume (98.5% volume of drinking water) and stirred for 5 minutes until clear and homogenous. The dose of the drug was adjusted to previously measured weight and drinking volume of the animals to a final dose of 10 mg/kg/d. Drug was freshly prepared every other day and introduced to rats (2 rats with similar body weight per cage) in their drinking water. Drug dose was calculated per cage, every other day, based on water volume consumed and change in animal weight; subsequent dosing was adjusted accordingly. Vehicle solution was introduced to group SD/Veh parallel to the introduction of EMPA to the SD/Drug group.
Procedures and Methodology
Body weight
Body weight was monitored once a week on a calibrated scale with a sensitivity of 0.01 mg.
Blood glucose levels
Blood glucose level (BGL) was determined twice a month using a digital glucometer. Animals were fasted overnight from 8:00
Blood harvesting
Blood was drawn for analysis of biochemical parameters at 0, 1, 2, 3, and 4 months from study initiation. Following overnight fasting, animals were slightly anesthetized with isoflurane, the retro-orbital sinus of the eye was punctured with a glass Pasteur pipette, and blood was collected into vacuum tubes containing separation gel and coagulation activator. The tubes were centrifuged at 3500 rpm for 10 minutes, and the collected serum was divided into aliquots and stored at −80°C for later analysis.
The collected serum was analyzed for electrolyte content including Na, K, creatinine, total protein, triglyceride, cholesterol, high-density lipoprotein (HDL), and fasting glucose levels. All analyses were carried out with a biochemical analyzer with Modular Analytics-Roche Diagnostics (American Medical Laboratory-AML, Israel). Insulin levels were analyzed with enzyme-linked immunosorbent assay kits (Mercodia Rat Insulin Kit No. 10-1250-01; Mercodia, Uppsala, Sweden). Homeostatic model assessment (HOMA) index was calculated according to formula I in Appendix A.
Urine collection
Urine was collected at 0, 1, 2, 3, and 4 months for assessment of glucose, electrolytes (Na, K), creatinine, and total protein. Animals were placed in individual metabolic cages for 48 hours, with access to food and drink (containing vehicle or drug). Urine collected in the second 24 hours was taken for analysis. Urine volumes were measured and aliquots were frozen at −80°C for later use. Creatinine clearance was calculated according to formula II in Appendix A.
Blood pressure measurement
Systolic and diastolic blood pressures were measured before treatment and periodically throughout the study using a noninvasive tail-cuff sphygmomanometer (BP-2000 series II; Visitech Systems, Apex, North Carolina). Fully alert animals were placed in a restraining holder on a platform with the internal heating system set at 37°C. The tail was inserted into an occlusion tail cuff equipped with a light emitter/sensor assembly, which measured systolic and diastolic blood pressures concomitantly. Animals were adapted to the setting with training measurements until calmed. Values of at least 10 consecutive repeated measurements with a standard deviation of <10% were averaged for each animal, and the mean was used to calculate the overall mean per group at a specific time point.
Intraperitoneal glucose tolerance test
Intraperitoneal glucose tolerance test (IPGTT) was performed on overnight fasted animals. Rats were injected in the peritoneal cavity with 0.7 mL/100 g body weight, from a stock of 50% glucose solution, with a final dose of 3.5 g/kg. The BGLs (mg/dL) of whole blood sampled from tail puncture were measured at 0, 15, 30, 60, 120, and 180 minutes post glucose load.
Cardiac function
Transthoracic echocardiography was performed for evaluation of left heart hypertrophy as well as ejection fraction/contractility of the heart in all 3 groups at 0, 8, and 16 weeks from study initiation (Table 1). Echocardiograms were performed with a commercially available echocardiography system (Vevo 2100; VisualSonics, Toronto, Ontario, Canada) equipped with an 18-MHz phased-array transducer. All measurements were averaged over 3 consecutive cardiac cycles. Measurements were carried out by an experienced technician who was blinded to treatment, and data were analyzed by another expert (MSF) also blinded to treatment. Fractional shortening (%) was calculated as ([LVIDd − LVIDs]/LVIDd) × 100, where LVID indicates left ventricle (LV) internal dimension, s is systole, and d is diastole. The LV fractional area change (%) was calculated as ([EDA − ESA]/EDA) ×100, in which EDA indicates LV end-diastolic area and ESA end-systolic area.
Measurements of LV Parameters.a

Abbreviations: LV, left ventricular; MV E/A, mitral valve E/A waves (diastolic function); RM ANOVA, repeated-measures analysis of variance; SEM, standard error of mean.
aValues are mean ± SEM. Probability values in the right-hand column reflect comparison of the differences between the different treatment groups and their interactions over time by 2-way RM ANOVA followed by Holm-Sidak multiple comparison test. Probability values in the table represent comparison of the differences between baseline and 11 weeks measurements in each treatment group by Holm-Sidak multiple comparison test.
Organ collection
Animals were killed with 15% KCl under deep anesthesia with an overdose of phenobarbital. Following euthanization, the left kidney was cut open longitudinally: one side was mounted on a clay-like substance, frozen in liquid nitrogen–cooled isopropane, and stored at −20°C, and the other side was immediately frozen in liquid nitrogen for possible use for gene expression identification. The right kidney (cut in half) and pancreas were collected and immersed in 4% paraformaldehyde.
Histology
Immunohistology of the kidney
Immunofluorescence analysis of nephrin and podocin in the renal cortex was performed in the experimental groups as well as in normal rats. The whole kidneys were rapidly frozen in liquid nitrogen, and 4-µm-thick cryostat sections were placed on Silane-coated slides and dried at room temperature. Sections were fixed in acetone/ethanol (4:1) solution for 10 minutes and washed in phosphate-buffered saline (PBS). The samples were incubated with 10% normal goat serum (NGS) in PBS at room temperature for 1 hour and then with either antinephrin antibodies (polyclonal antibody against the intracellular portion of nephrin; gift of Dr David Salant, Boston, Massachusetts ) or antibodies to podocin (Sigma Aldrich, St. Louis, MO, USA) diluted 1:200 in 1% NGS in PBS for 2 hours at room temperature. The slides were washed with PBS, and the primary antibody was incubated with fluorescein isothiocyanate–conjugated goat anti-rabbit immunoglobulin G (Chemicon, Temecula, California) diluted in 1% NGS in PBS for 1 hour at room temperature. The slides were then washed with PBS, dried in a dark room, and covered with a cover glass and Vectashield mounting medium with DAPI (Vector Laboratories, Burlingame, California). Nephrin and podocin immunoreactivities were analyzed by measuring fluorescence intensity using digital image analysis (Image Pro-Plus; Media Cybernetics, Rockville, Maryland) of images obtained with a low-light video camera (MicroMax:1300Y). Specifically, semi-quantification of the immunofluorescence staining of both nephrin and podocin was performed, analyzing 10 glomeruli from each rat.
Histology of the heart and pancreatic tissues
The hearts were perfused with 4% formaldehyde (15 mm Hg) for 20 minutes, after which they were sectioned into 3 to 4 transverse slices parallel to the atrioventricular ring. Each slice was fixed with 4% formalin, embedded in paraffin, and sectioned into 5-µm slices. The slides were stained with Masson trichrome to assess fibrosis, photographed, and analyzed with planimetry software (Sigma Scan Pro version 5). Average wall thickness was calculated from 3 measurements of septum thickness, LV muscle area (including the septum), LV cavity area, and whole LV area (sum of LV muscle area + LV cavity area). Serial sections were stained with hematoxylin–eosin (H&E) to detect cellular infiltration.
The pancreas was removed and sectioned into slices, and each slice was fixed in 4% formalin, embedded in paraffin, sectioned into 5-µm slices, and stained with H&E.
Statistical Analysis
The effect of EMPA with respect to each measured variable was based on comparing the results observed in the treated rats (Group Drug/SD) with those observed in the comparative rats (Group Veh/SD) at month 4. Assuming that the effect be under a built-up or a lining process, the focus of the analyses was on results observed at the end of the study, when values were closer to the steady state. Results observed prior to month 4 were used to detect any temporal trend. Results observed in Group Veh/P were used as a control for possible effect of the vehicle.
Results were analyzed using 1-way AA test, and significance between groups was further assessed using Tukey multiple comparison tests. The t-test and 1-way AA were used when applicable between 2 sets of data (analysis of single parameter in single time point) or between more than one set of data in a single time point, respectively.
To analyze cardiac remodeling and function, all variables were expressed as mean ± standard error of the mean. Normality was tested with the Kolmogorov-Smirnov test. The percentage of change from baseline measurement was calculated for each animal as follows: ([follow-up parameter − baseline parameter]/baseline parameter) × 100. The t test was used when applicable between 2 sets of data (analysis of a single parameter in a single time point), respectively, and Wilcoxon Mann-Whitney U test otherwise. Results of each analysis were considered significant at 5% level by a 2-tailed test. Statistical analysis was performed with GraphPad Prism version 6.00 for Windows (GraphPad Software, San Diego, California). The morphometric data were tested using 1-way AA.
Results
Body Weight
All groups showed a steady increase in body weight throughout the study (Figure 1). The weight of Group Veh/SD is consistently and, after a month, significantly (P < .05) higher than that of each of the other 2 groups. Treatment with EMPA showed slight improvement in body weight gain compared to the diabetic Veh/SD group.

Effect of Empagliflozin (EMPA) on body weight of Cohen Rosenthal Diabetic Hypertensive (CRDH) rats monitored over 20 weeks, represented by the mean ± standard error of the mean (SEM). Significant (P < .05) increase was shown for the Veh/P versus the sugar diet groups.
Blood Glucose Levels
Mean fasting BGLs (Figure 2A) were lower in the treated than in the Veh/SD group over the entire follow-up. The difference in the fourth month was significant. Treatment with EMPA led to a significant reduction in fasting BGLs evident at 1 month after treatment, compared to baseline values. This was further seen at 4 months when the level was significantly lower in the EMPA-treated animals (Drug/SD) than the corresponding vehicle-treated animals (Veh/P) and the control group (Veh/SD). With regard to the postprandial glucose levels (Figure 2B), animals fed SD (Veh/SD group) had remarkably increased BGLs over time, reaching a plateau of nearly 300 mg/dL after 3 months, demonstrating the development of impaired glucose tolerance in these animals. Treatment with EMPA ameliorated such sugar-induced increase in diabetes and maintained the glucose levels at nearly 180 mg/dL, which is still higher than baseline. The change versus the diabetic animals in the Veh/SD group was very significant (P < .01) but did not reach baseline levels.
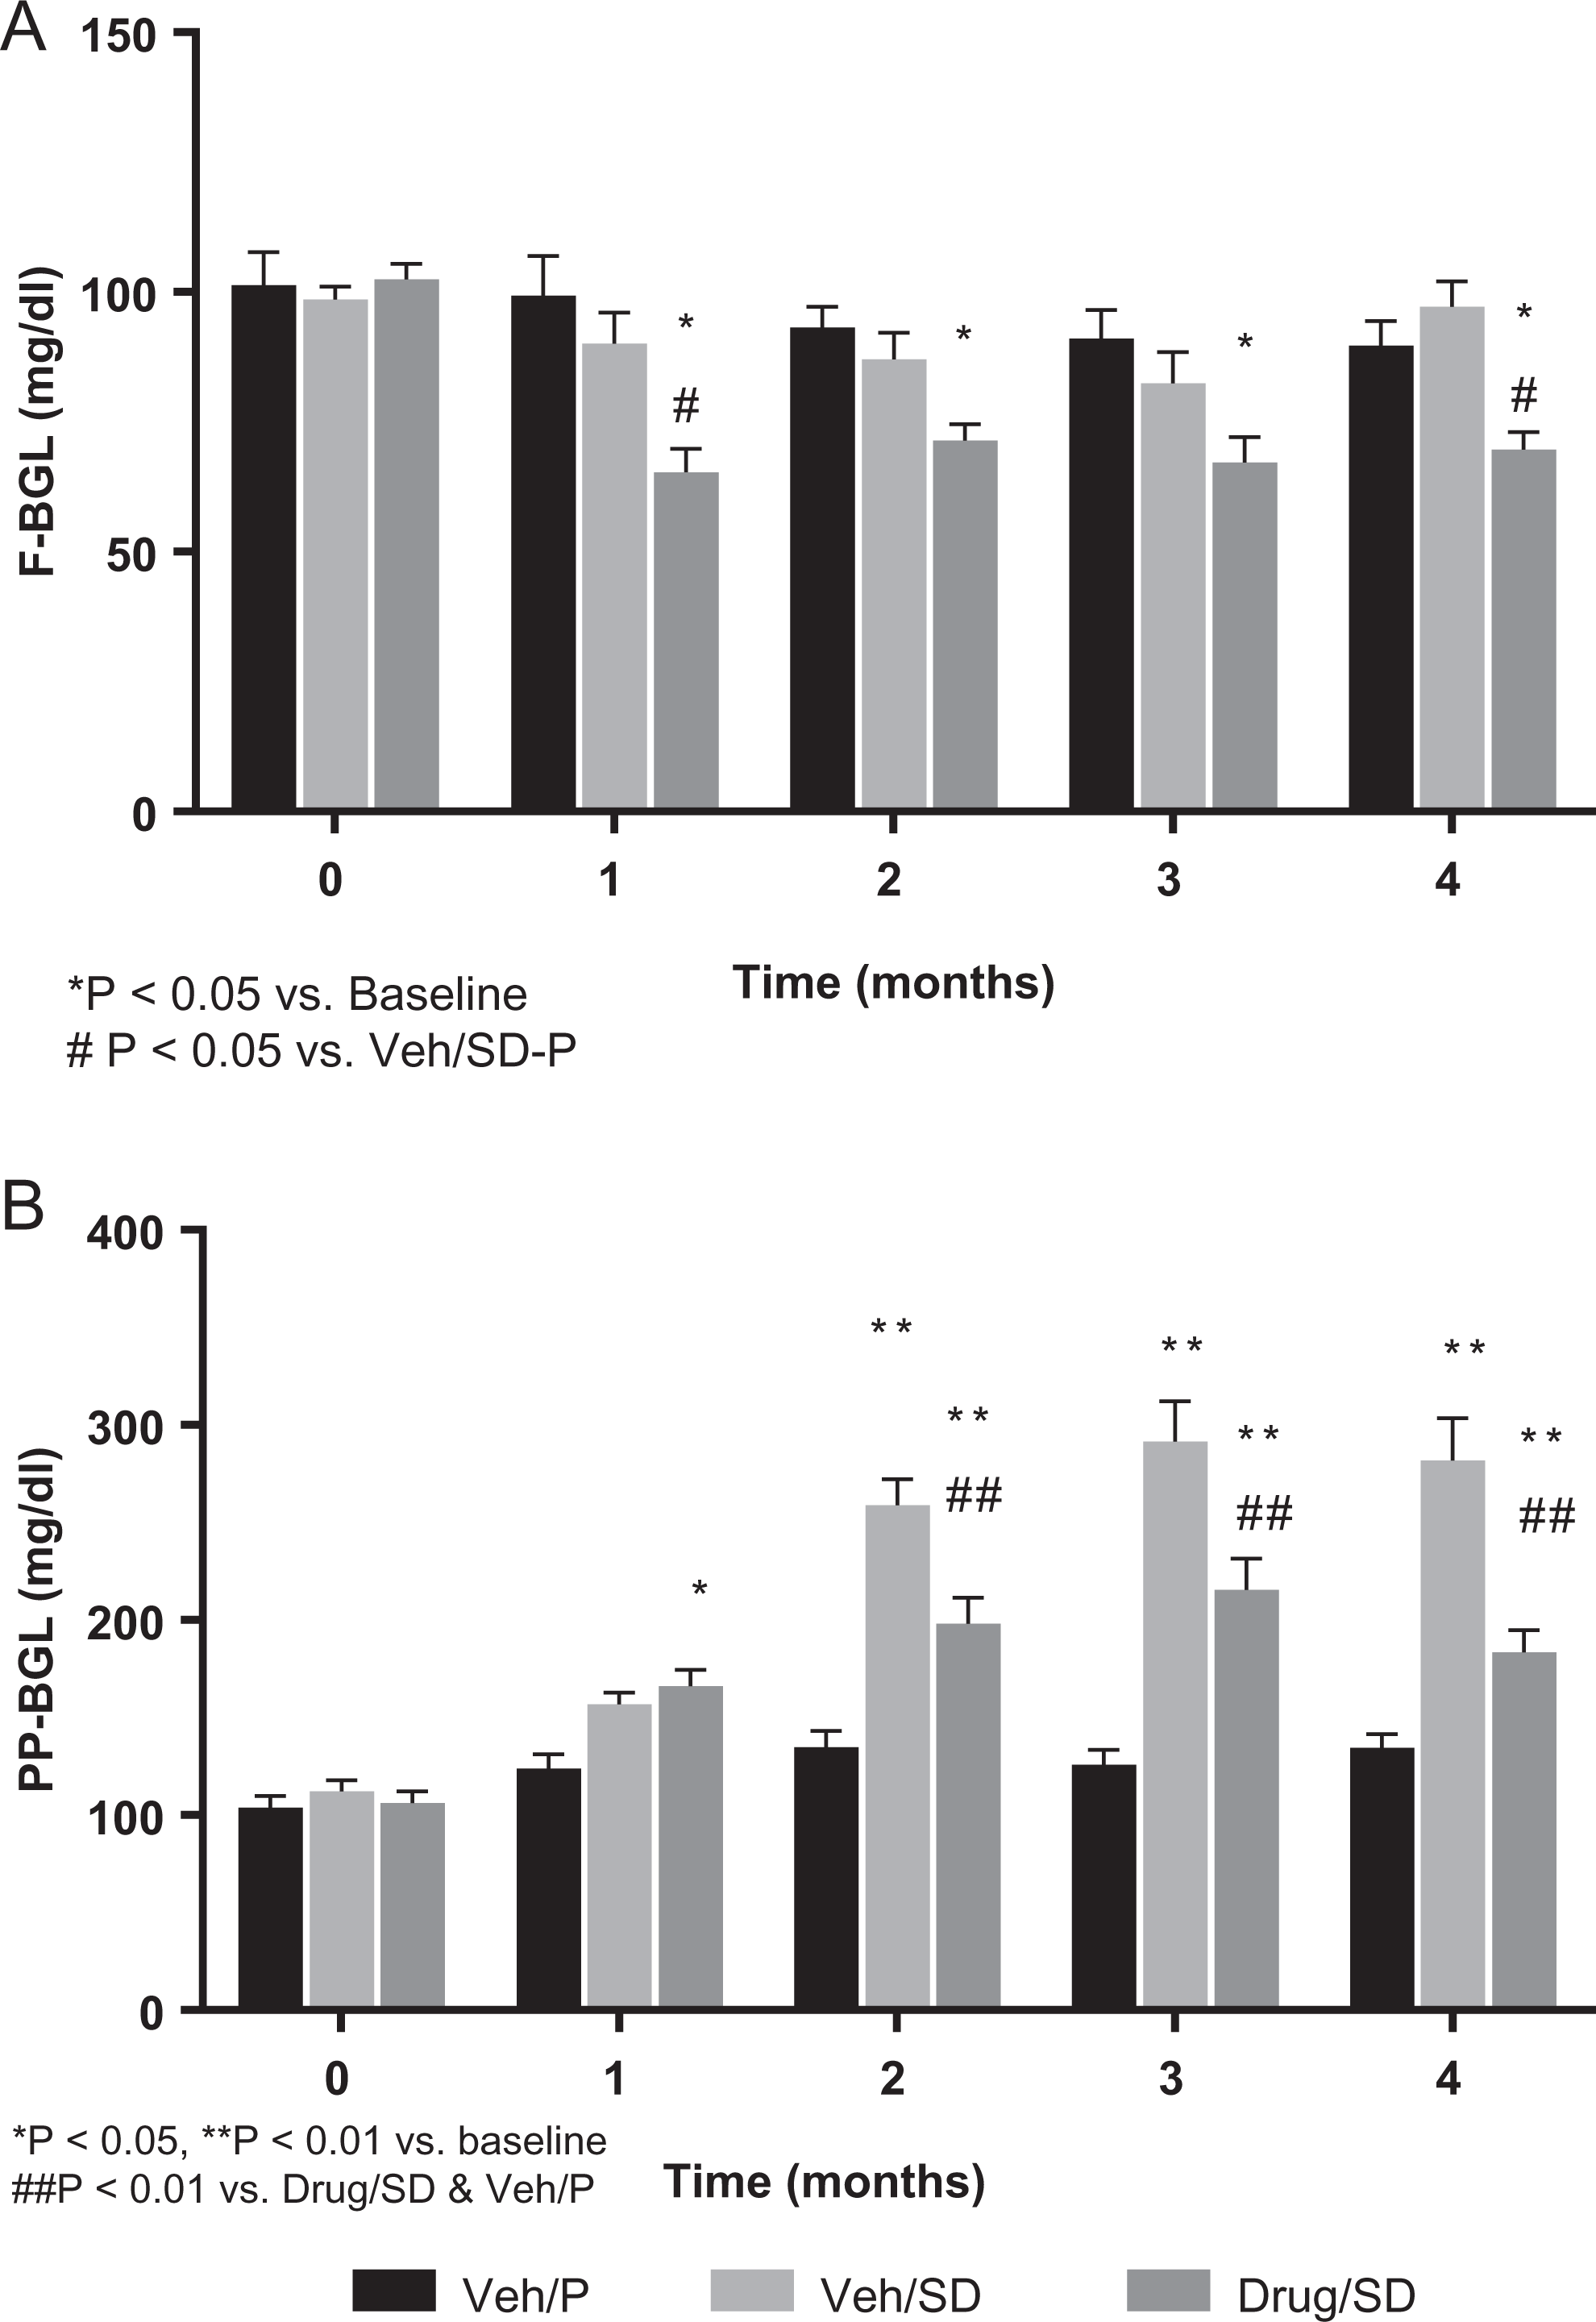
Fasting and postprandial blood glucose levels (BGLs) were monitored over 4 months. (A) Fasting BGL (F-BGL); overnight deprivation of food and assessment of glucose levels in the morning. (B) Postprandial blood glucose levels over 4 months; 2 hours after feeding, BGL was assessed. Data are presented as mean ± standard error of mean (SEM). Significance was shown when P value <.05.
Insulin and HOMA Index
Insulin level remained nearly unchanged in all treated groups relative to corresponding baseline, with the exception of a single significant reduction in the second month posttreatment compared to a surge on day 30 posttreatment (see Figure 3A). Because of the EMPA-induced decrease in the fasting glucose levels, the HOMA Index (Figure 3B) showed a significant (P < .05) reduction at months 2 and 4 in the Drug/SD group versus the Veh/SD group. Thus, while the insulin sensitivity remained about the same in all untreated animals, treatment with EMPA resulted in an overall improvement in the sensitivity.

(A) Insulin levels and (B) calculated homeostatic model assessment (HOMA) index in the 3 groups over 4 months. Data are presented as mean ± standard error of mean (SEM). Significance was shown when P value <.05.
Glucose Tolerance Test
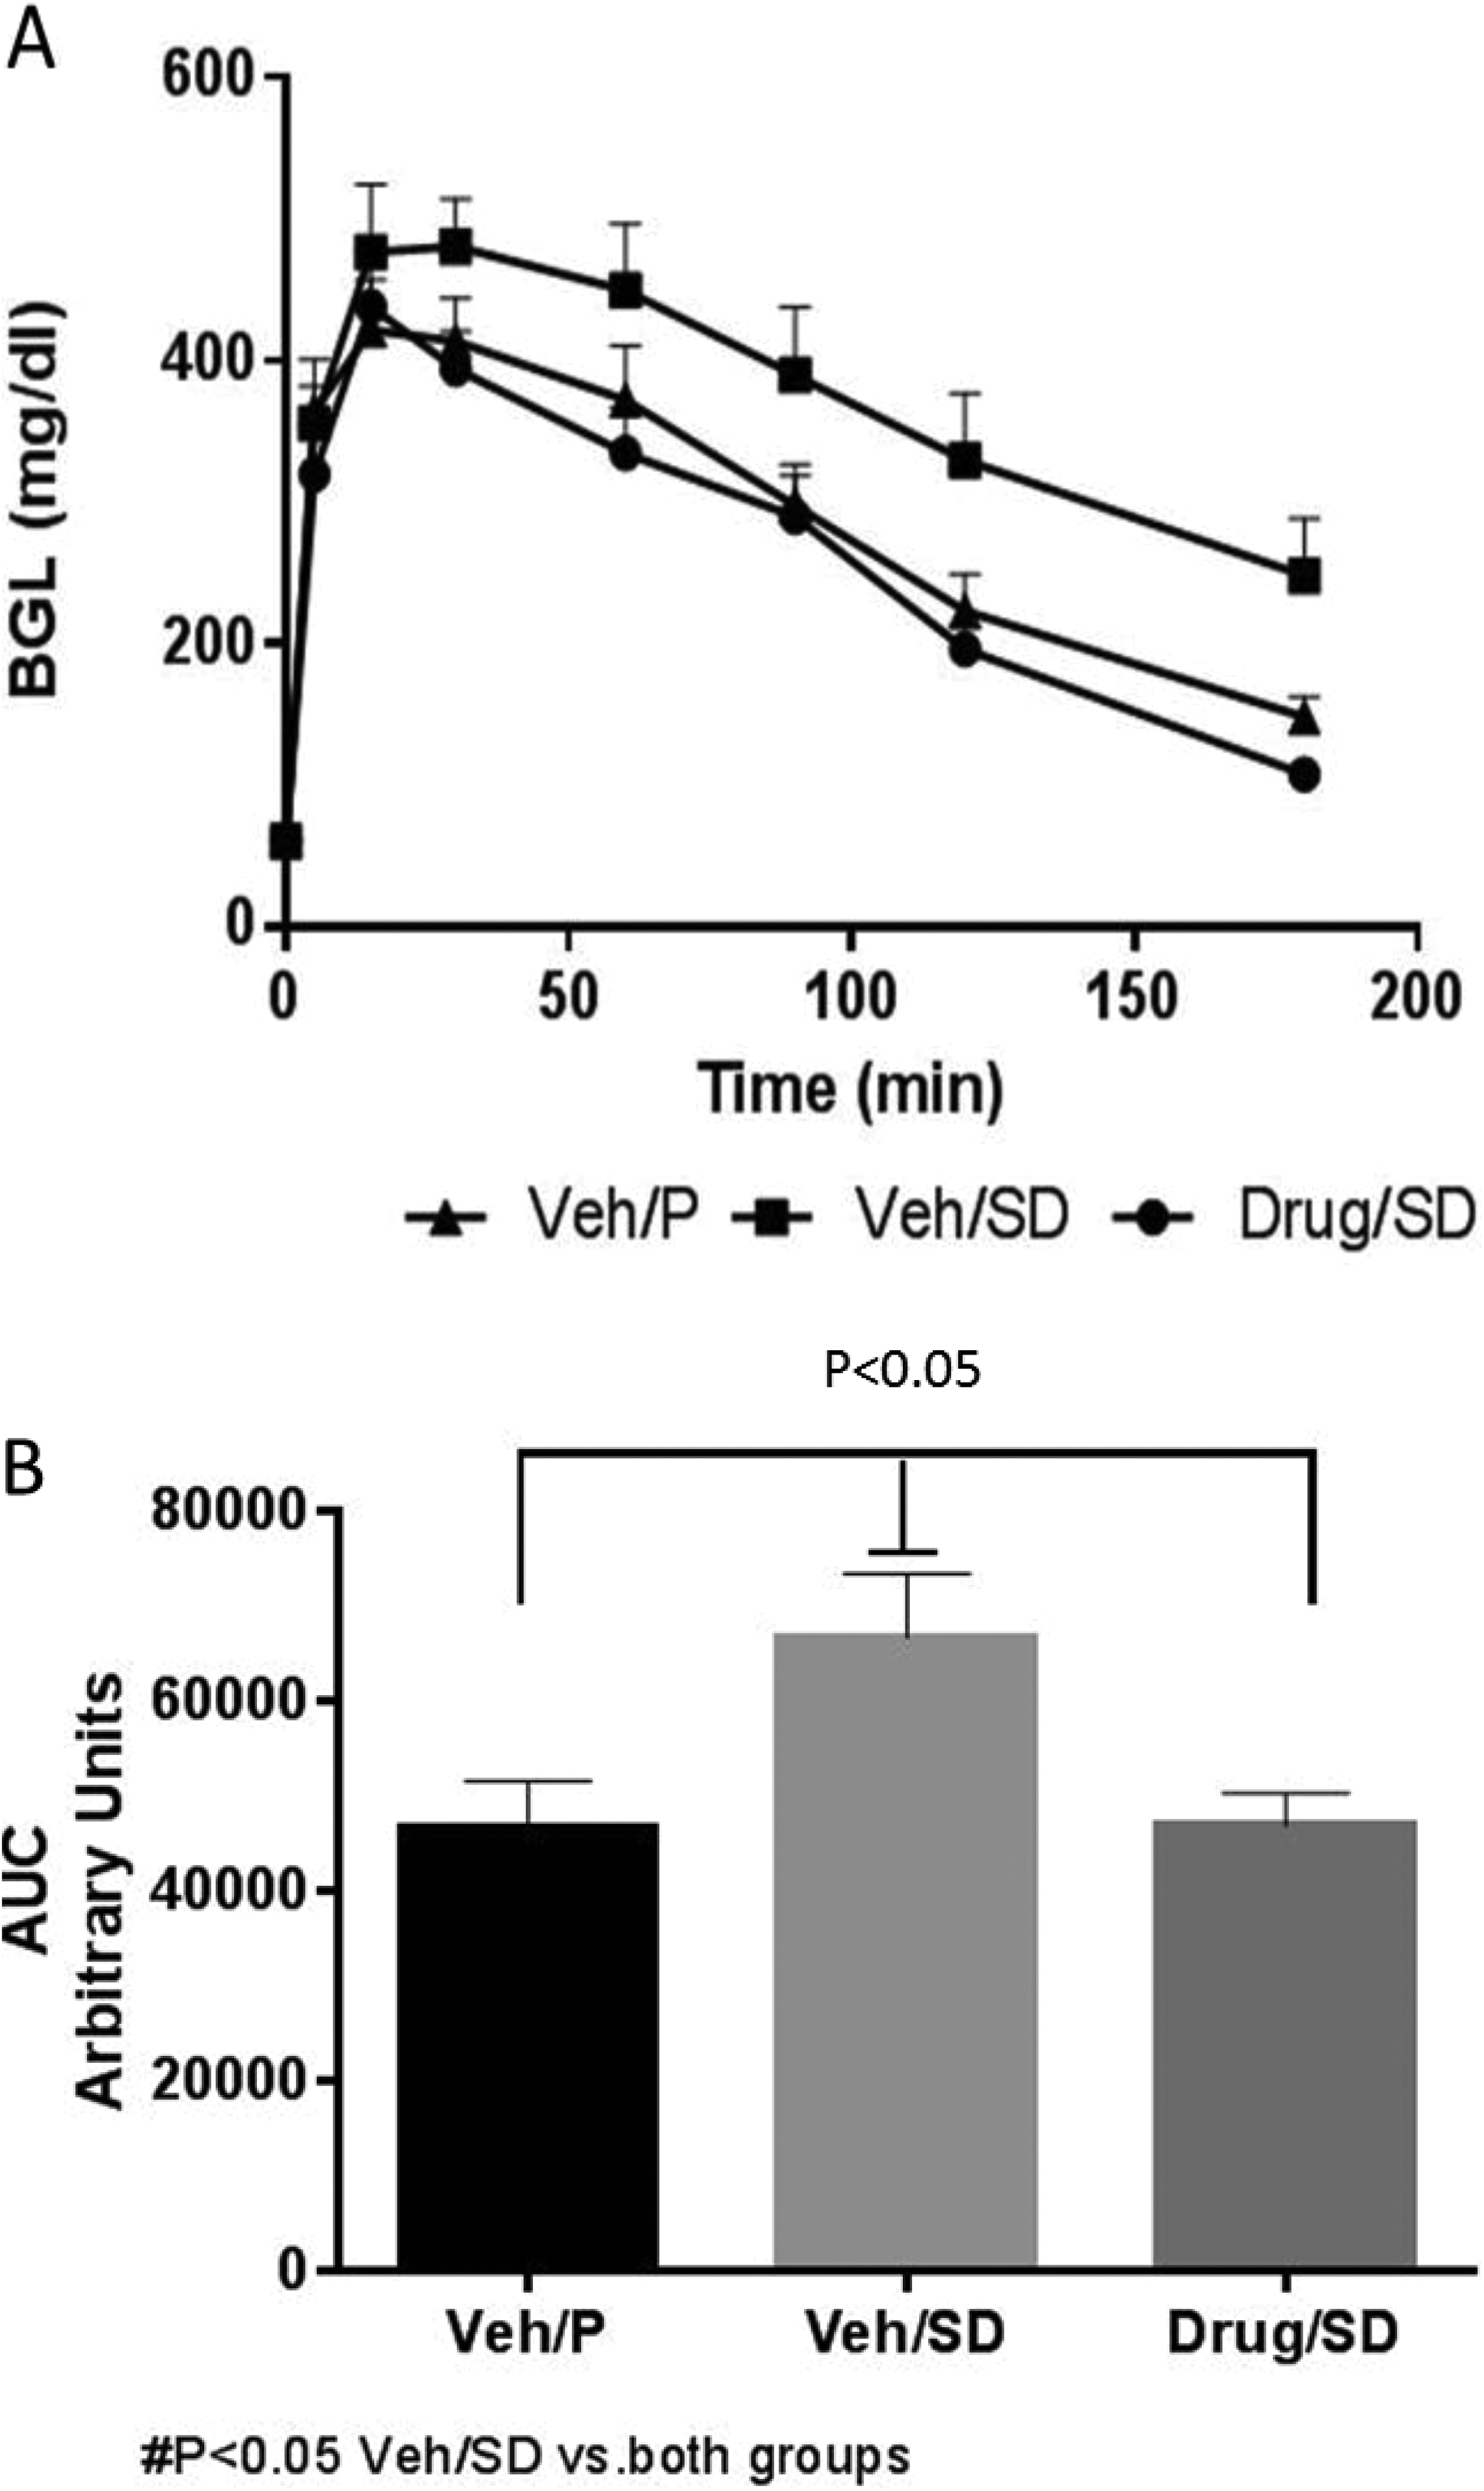
Further evidence of the glucose-lowering effect of EMPA was seen following intraperitoneal injection of glucose on days 80 and 120 posttreatment (Figures 4A and 5A). While Veh/SD animals exhibited a slower elimination of the glucose compared to animals of the Veh/P group, EMPA improved glucose tolerance of Drug/SD animals, normalizing the elimination of glucose, similar to the Veh/P group at day 120. Indeed, calculated area under the curve (AUC) showed a nearly significant (P = .058) change in the treated group versus the Veh/SD group on day 80 (Figure 4B). This trend of improved glucose intolerance in the treated group continued at the end of the experiment on day 120 when impaired glucose tolerance was clearly observed in the Veh/SD group compared to the Veh/P group (Figure 5B). Thus, EMPA was completely effective in restoring the glucose tolerance to a level similar to that of the Veh/P group. The AUC of IPGTT revealed a significant (P < .05 vs Veh/SD) change in glucose tolerance, similar to the control group (Veh/P).

A, Intraperitoneal glucose tolerance test (IPGTT) profile of animals in each of the groups on day 80 is monitored for 3 hours post-glucose intraperitoneal injection. Treatment with EMPA seems to decrease glucose intolerance seen in the Veh/sugar diet (SD) group. B, Calculated area under the curve (AUC) of the IPGTT in the 3 groups on day 80 shows near-significant change (P < .058) due to treatment with empagliflozin (EMPA) versus diabetic group Veh/SD.
A, Intraperitoneal glucose tolerance test (IPGTT) profile of animals in each of the groups on day 120 is monitored for 3 hours post glucose intraperitoneal injection. Treatment with empagliflozin (EMPA) seems to decrease glucose intolerance seen in the Veh/sugar diet (SD) group. B, Calculated area under the curve (AUC) of the IPGTT in the 3 groups on day 120 shows a significant change (P < .05) due to treatment with EMPA versus diabetic group Veh/SD.
Blood Pressure
Both systolic and diastolic blood pressures (Figure 6A and B) in the EMPA-treated group were higher at baseline than in the other 2 groups, but decreased significantly during the experiment. The blood pressure values in the EMPA-treated group were even further decreased, reaching significance compared to both the Veh/SD and Veh/P groups at the end of the experiment.

(A) Systolic and (B) diastolic blood pressure in the 3 groups over 4 months. Data are presented as mean ± standard error of mean (SEM) of the mean of several measurements per animal in each group. Significant changes (P < .05) between groups at time point or versus baseline are shown.
Renal Function
The baseline levels of serum creatinine were comparable and remained stable throughout the follow-up period in all groups, suggesting that kidney function was almost not altered at this stage by either the disease or the treatment, until 4 months, at which time Drug/SD rats clearly showed significantly lower mean creatinine level than the other 2 groups (Figure 7). The differences between the other 2 groups were quite small and not consistent in direction throughout the study. Creatinine clearance is illustrated in Figure 7B. Briefly, basal creatinine clearance test (CCT) levels were comparable in all groups but delined in the untreated diabetic rats especially after 3 and 4 months. In contrast, the CCT was slightly attenuated in the EMPA-treated diabetic animals, suggesting a nephroprotective effect of the drug.

A, Serum creatinine levels in the 3 groups over 4 months. Data are presented as the mean ± SEM standard error of mean (SEM). Significant reduction in creatinine (Cr) at 4 months in treated group versus diabetic Veh/sugar diet (SD), P < .05. B, Creatinine clearance in the 3 groups over 4 months. Treatment with empagliflozin (EMPA) maintained levels of CR clearance similar to the Veh/P group. Diabetic animals (Veh/SD) show significant decrease at 3 and 4 months posttreatment. Data are presented as mean ± standard error of mean (SEM).*P < .05 versus other groups at corresponding time points.
Urine Volume and Glucose levels
There is a clear gradual and consistent elevation in daily urine volume in group Drug/SD (Figure 8A). No such trend is observed in group Veh/SD. The volume in group Drug/SD is clearly consistently larger than that of each of the other 2 groups at each point in time under treatment. Results at month 4 are significantly larger in Drug/SD than that in Veh/SD rats. Urine glucose (Figure 8B) showed a clear trend of elevation in Drug/SD (no increase is observed in Veh/SD) and was significantly (P < .01) larger at month 4 as well as at any other earlier time.
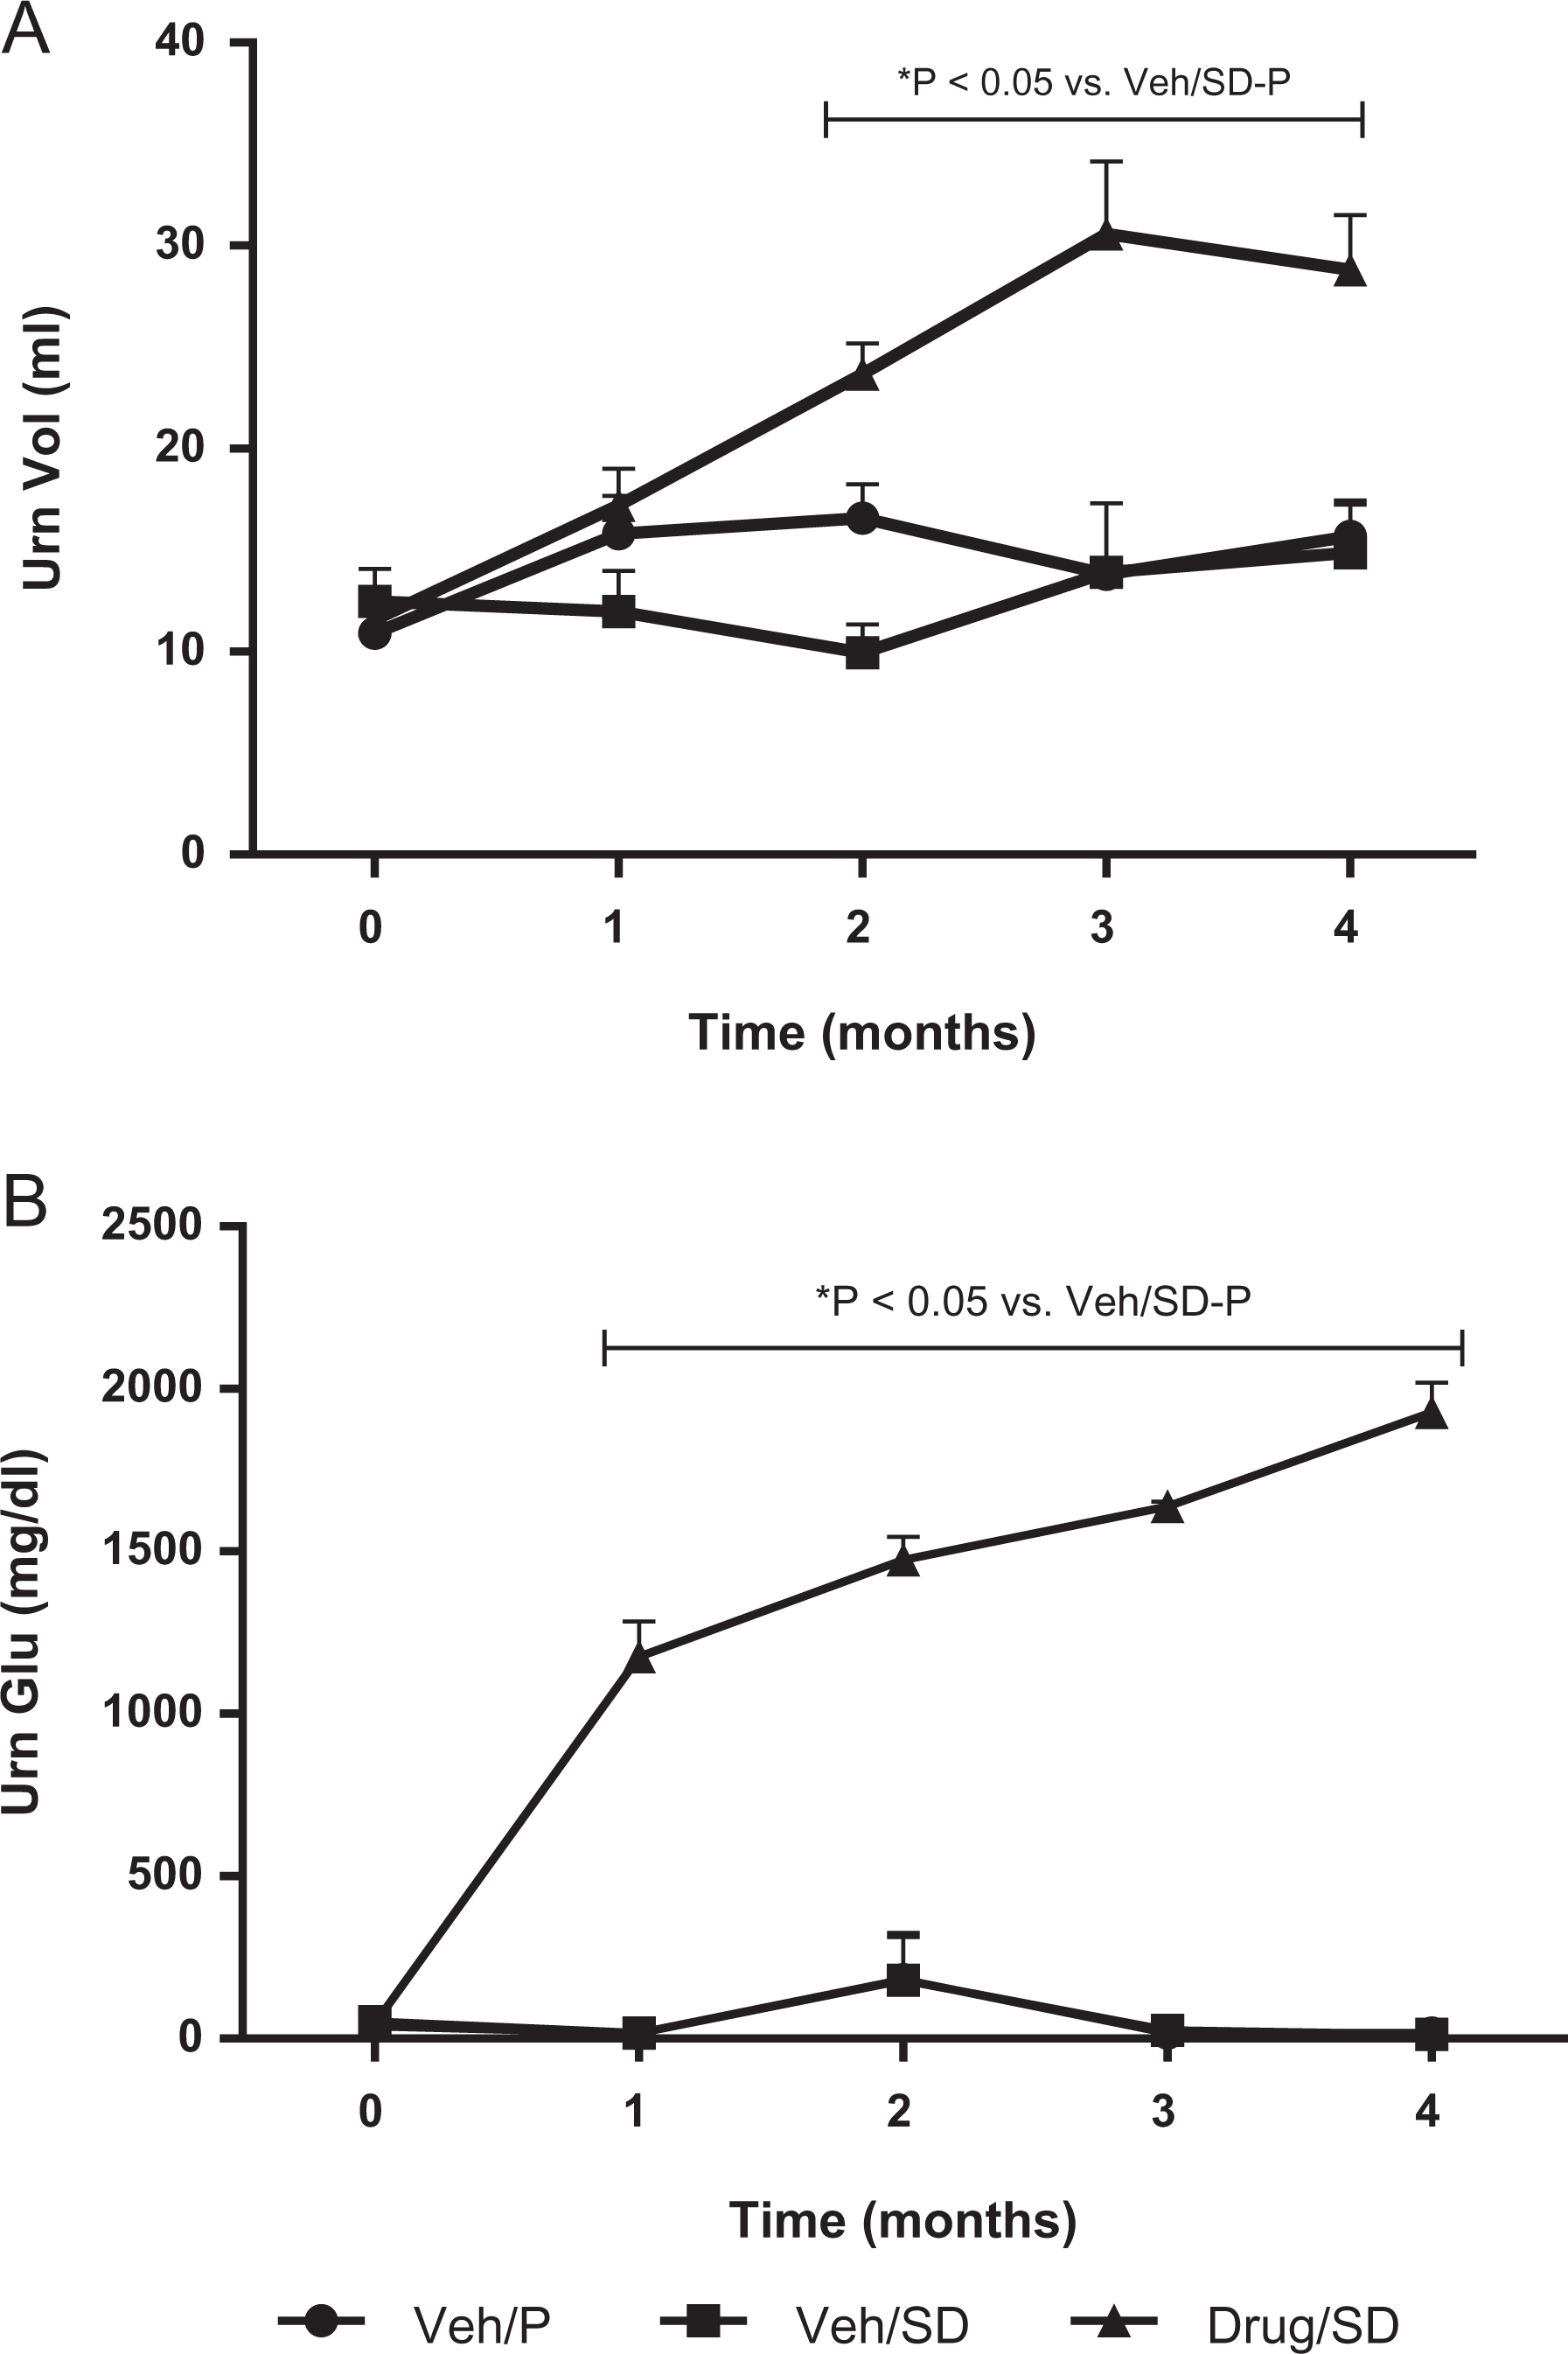
(A) Urine volume and (B) glucose concentration in the 3 groups over 4 months. Urine collected over 24 hours in one metabolic cage per animal and glucose content were assessed. Mean volume and glucose content ± standard error of mean (SEM) at each time point. Significant increases (P < .05) in both volume and glucose increase were evident at 1 month and thereafter.
Kidney: Nephrin and Podocin
Immunofluorescence studies using antibody to nephrin or podocin in normal kidney showed a finely dotted, linear, epithelial staining pattern (Figure 9A). Diabetic rats exhibited moderate disruption in slit diaphragm structure as seen by a moderate nonsignificant loss of nephrin (increase in the relative nephrin fluorescence density), while no change in podocin was observed (Figure 9A and B). The EMPA treatment preserved nephrin, to some extent, as determined immunohistochemically and enabled prediction of antiproteinuric responses (Figure 9B).
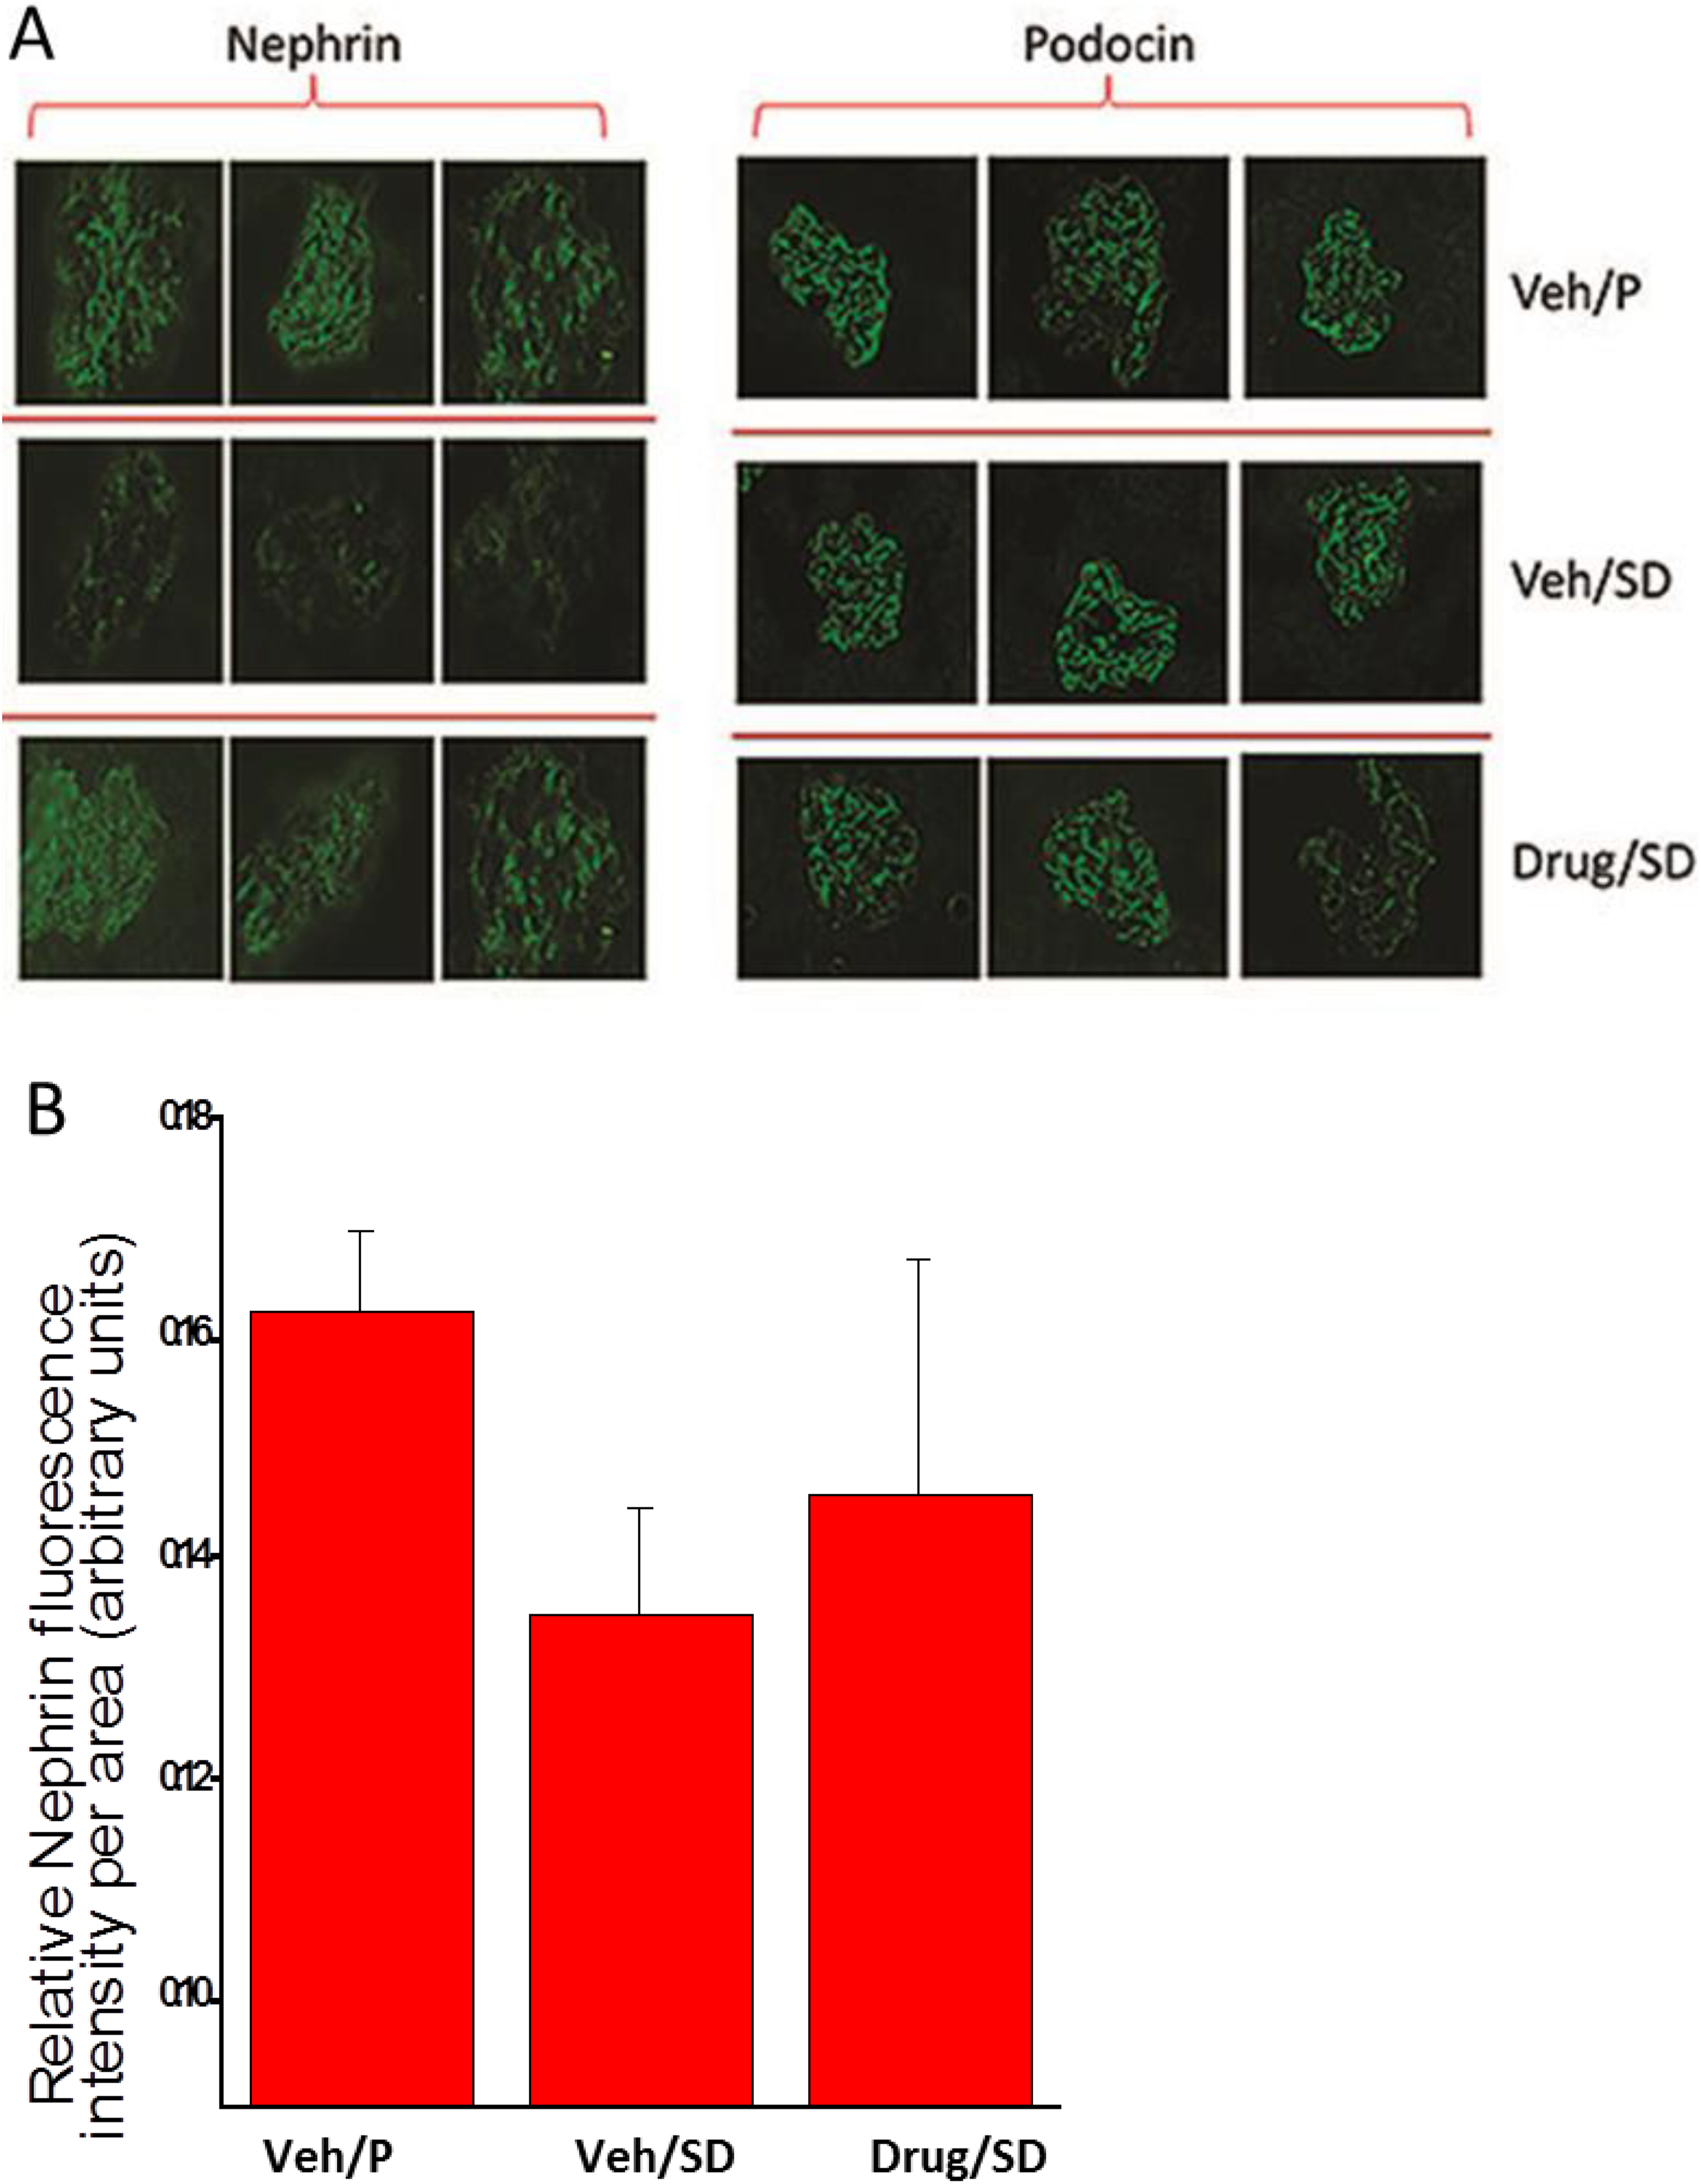
Immunofluorescence studies using antibody to nephrin and podocin in kidney of vehicle and drug-treated rats. Kidneys from 5 to 6 rats were subjected to immunofluorescence analysis of nephrin and podocin. A, Representative images of nephrin and podocin immunostaining in 1 glomeruli from 3 separate rats of each experimental group. B, Semi-quantitative analysis of nephrin and podocin expression in glomeruli of normal rats, untreated diabetic rats, and empagliflozin (EMPA)-treated animals. For each rat, we analyzed 10 glomeruli.
Pancreas
The H&E analysis of the pancreatic tissue revealed a dramatic difference between diabetic animals treated with EMPA (Drug/SD) and diabetic animals receiving vehicle (Veh/SD). In the diabetic animals treated with vehicle, 46% of the exocrine tissue of the pancreas was replaced by adipose tissue. This was prevented by EMPA treatment, which led to only 12% replacement by fat tissue (Figures 10 and 11).

Hematoxylin and eosin (H&E) histology analysis of the pancreas showing (A) normal pancreas, (B) after sugar diet (SD), and (C) during empagliflozin (EMPA) treatment. Note restoration of tissue to near pretreatment condition.
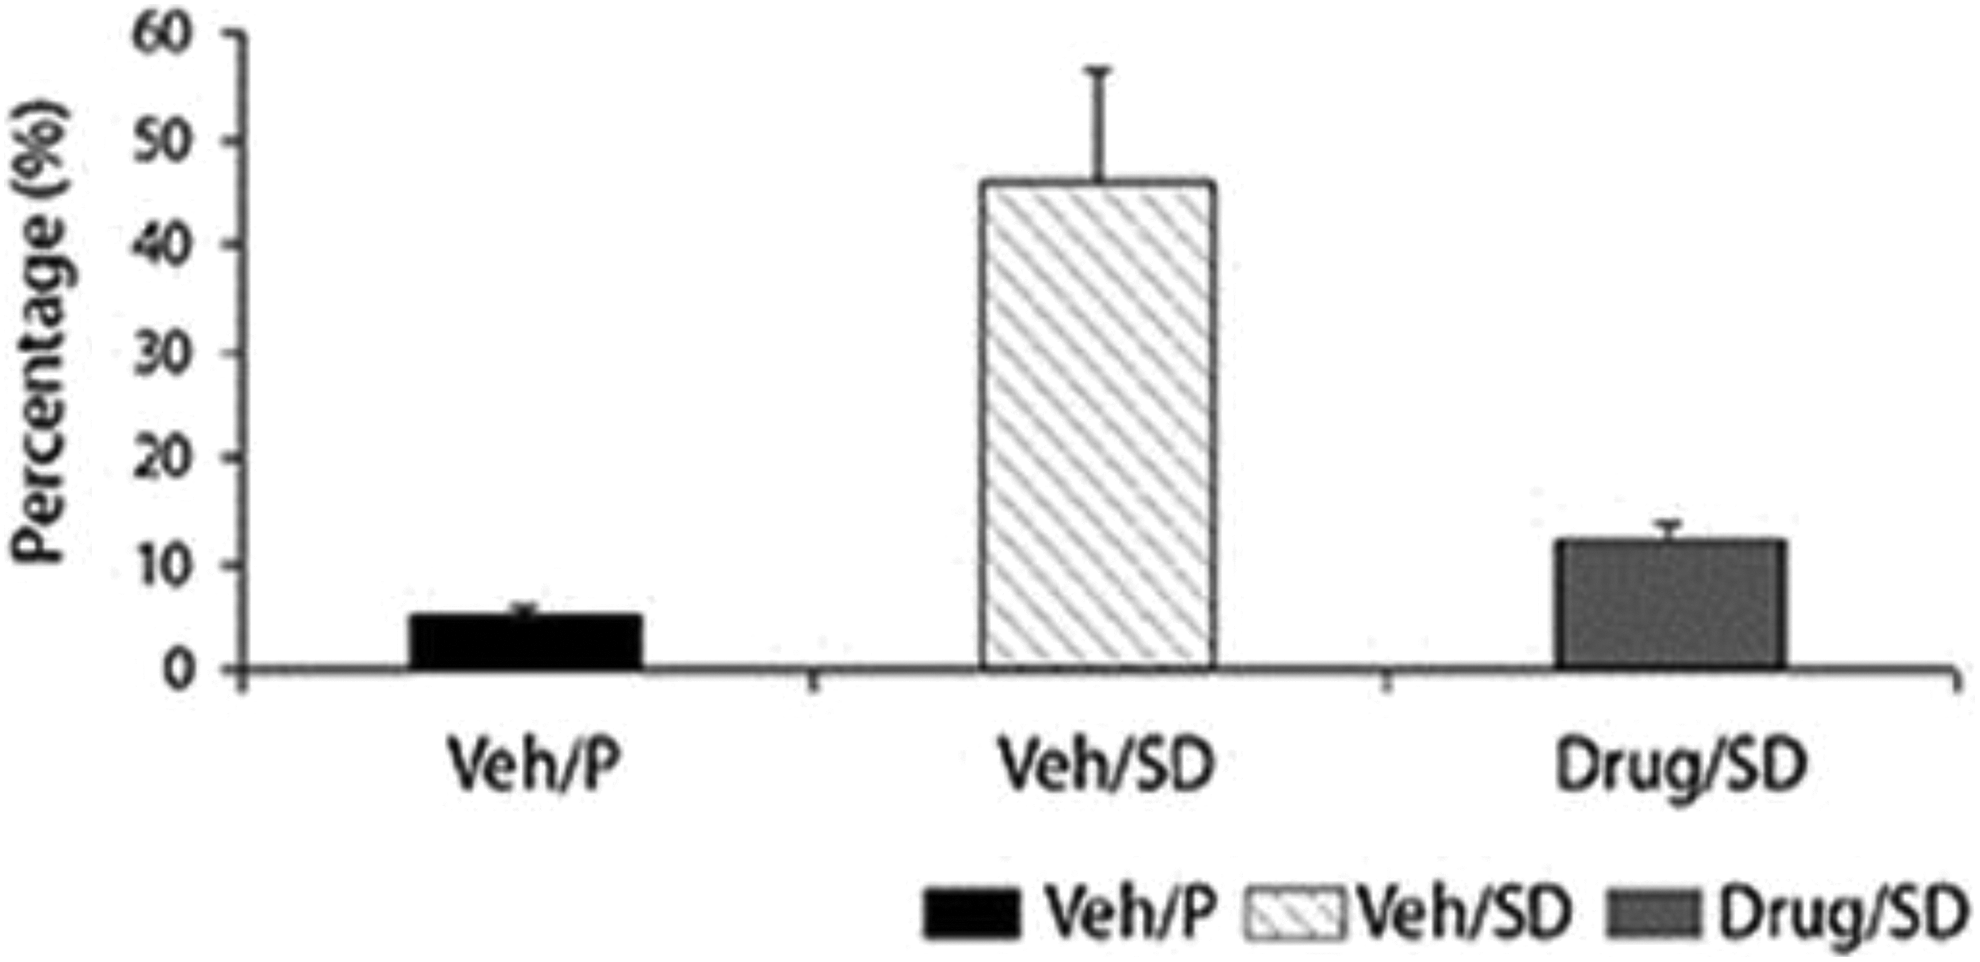
Percentage of adipose tissue in the pancreas histology in Figure 10 of the Veh/P, Veh/ sugar diet (SD), and Drug/SD animals. Comparison between the groups shows a significant (P < .05) amount of adipose tissue in Veh/SD, while treated group, adipose tissue was restored to control levels shown for Veh/P group.
Heart
To assess LV remodeling and function, we used a special small animal echocardiography system (Table 1 and Figure 12). After 16 weeks, EMPA significantly reduced LV mass and LV systolic dilatation, compared with controls (Table 1). Empagliflozin also reduced LV diastolic dilatation. However, this effect was not statistically significant (Table 1). Other LV parameters evaluated were not significantly affected by EMPA (Table 1). Diastolic function was determined by measurement of mitral flow (mitral valve E/A waves) and was not affected by time and treatment (Table 1).

After 11 weeks of treatment, rats were euthanized, and hearts were removed, sliced, fixed, and stained for histology analysis. A, Representative images of Masson trichrome staining for collagen fibers (blue) in the empagliflozin (EMPA)-treated group, compared to controls. Assessment of the fibrotic area (blue) did not detect significant fibrosis among the various groups. Postmortem morphometry assessment of left ventricular (LV) anterior wall thickness (B), LV internal area (C), LV muscle area, and (D) LV total area (E) revealed no difference between the treatment groups.
Surprisingly, Masson-Trichrome staining did not detect fibrosis in the hearts from different groups (Figure 12A), making it impossible to determine whether EMPA affects cardiac fibrosis in this model. Postmortem morphometry assessed LV anterior wall thickness (Figure 12B), LV internal area (Figure 12C), LV muscle area (Figure 12D), and LV total area (Figure 12E) and revealed no difference between the treatment groups.
Discussion
Diabetic nephropathy is a hallmark of CRDH rats as evidenced by albuminuria. In this work, instead of albuminuria, we measured proteinuria, which is a valid surrogate marker for diabetic kidney disease. 11 The enhanced proteinuria could be explained by damage to the glomerular barrier, a well-known occurrence in clinical and experimental diabetic nephropathy. In our study, there was a decrease in total urinary excretion of protein in the last measurement of the study.
Several studies have implicated the podocyte in the pathogenesis of DM-induced development and progression of diabetic proteinuria. For instance, loss of nephrin and podocin, 2 key proteins localized to the slit diaphragm that bridges adjacent podocyte foot processes, plays a deleterious role in the development of diabetic nephropathy. 12 Nephrin, a major part of the structure of the slit diaphragm and crucial to the renal filtration barrier, is dissociated from podocin and excreted into urine in the early stages of glomerular damage. The combination of the reduced expression and dissociation of nephrin and podocin contributes to the development of proteinuria in nephritis. 13 Indeed, our CRDH rats exhibited downregulation of nephrin but not podocin compared to Veh/P controls. These findings are in line with previous clinical and experimental diabetic conditions where proteinuria develops together with disruption of nephrin in the glomerulus. 12 This is largely attributed to increased podocyte loss due to failure to phosphorylate AKT, leading to increased apoptosis, 14 and/or due to the induction of cell cycle arrest by advanced glycation end products (AGEs). 15
Ojima and coworkers 16 attributed the diabetic nephropathy they observed in diabetic rats in part to advanced AGEs and receptor AGE (RAGE). These authors suggested that EMPA might inhibit oxidative, inflammatory, and fibrotic reactions in the kidney of the animals partly by suppression of the AGE-RAGE axis. Their findings pointed to EMPA’s effect of blocking the enhanced glucose uptake into renal proximal tubular cells as a therapeutic target for tubulointerstitial damage in diabetic nephropathy.
Interestingly, treatment with EMPA reduced the proteinuria in our CRDH rats, in agreement with Gembardt et al 17 who reported that EMPA treatment for 12 weeks lowered plasma glucose together with albuminuria in BTBR ob/ob T2DM mice with and without hypertension. The nephroprotective effects of EMPA also stem from the antihypertensive effects of the drug, evidenced in our study and other experimental and clinical studies of diabetes alone or with hypertension. 17,18 Finally, the antiproteinuric effect of EMPA may be secondary to attenuation of the hyperfiltration characterizing the untreated diabetic subgroup. Our findings extend these studies by demonstrating that EMPA restores the abundance of nephrin in the kidney, thereby attenuating the proteinuria. Lytvyn et al 19 summarize the key pharmacological effects of SGLT2 inhibitors and the clinical evidence that support the rationale for the use of SGLT2 inhibition in patients with congestive heart failure without diabetes.
In line with the findings in Akita/+ mice, 20 our data suggest that a mechanism secondary to the substantial blood glucose reduction accounts for the amelioration of proteinuria by EMPA, seemingly independent of the tubuloglomerular feedback loop.
Our results are in line with a number of studies on humans that documented the ability of SGLT2 inhibitors to reduce glucose levels. 18,20 –25 In clinical trials of T2DM, SGLT2 was found associated with significant renal effects, including modest, acute declines in estimated glomerular filtration rate followed by maintenance of stable renal function and reduced albuminuria. 26,27 These findings suggest that SGLT2 inhibition—with its capacity to simultaneously decrease hyperglycemia, hyperfiltration, and blood pressure, resulting in renal and CV protection—might offer a safe therapy. Indeed, kidney disease progressed more slowly, and clinically relevant renal events were fewer with EMPA in patients with T2DM at high CV risk. 27
Our findings are also in line with the strong evidence from the Empagliflozin, Cardiovascular Outcomes, and Mortality in Type 2 Diabetes (EMPA-REG OUTCOME) trial of the CV and renal benefits of EMPA in patients with T2DM at high CV risk. 8 Other studies also found that EMPA added to standard treatment for patients with T2DM with established CV disease lowered death from CV causes, hospitalization for heart failure, and progression to end-stage kidney disease. 28 –30 Like Macisaac and colleagues, 30 we too found that SGLT-2 inhibitors reduce blood pressure and promote weight loss in addition to their glucose-lowering effect. Kaku and coworkers 31 confirmed the EMPA-REG OUTCOME study findings of lowered risk of CV outcomes and mortality with EMPA in Asian patients with T2DM and established CV disease. Anderson’s group 28 noted, however, that the improvements in glycemic control, body weight, and blood pressure are not as great as in patients with declining renal function. Many factors are involved in the increased CV and renal protection provided by EMPA, including lowering of body weight and blood pressure, diuresis, a shift in substrate utilization, and initiation of tubuloglomerular feedback. 8 Indeed, other clinical trials have examined the drug in patients with T2DM in different combinations. In one such publication, Wanner et al 32 report on a secondary objective of the EMPA-REG OUTCOME trial: the effects of EMPA on microvascular outcomes, in particular on progression of kidney disease in patients with T2DM at high risk of CV event. They reported that EMPA added to standard care was associated with slower progression of kidney disease than was placebo and with a significantly lower risk of clinically relevant renal events. 32 Thus, while the mechanisms responsible for the impressive CV and renal protective effects of EMPA remain to be fully characterized, they appear to encompass several mechanisms, including reduced body weight and blood pressure. 8 A caveat to this statement is the need to consider each patient’s clinical picture before introducing the drug.
This new class of glucose-lowering agents, SGLT2 inhibitors, includes EMPA, canagliflozin, 33 and dapagliflozin. Until the release of the Liraglutide Effect and Action in Diabetes: Evaluation of Cardiovascular Outcome Results (LEADER) trial results, 34 the only dedicated CV study to document an decrease in major cardiac events, reduced CV mortality, and fewer hospitalizations for heart failure with EMPA was the EMPA-REG OUTCOME study. 35 In the large LEADER trial, nearly 25% of patients had elevated lipase or amylase levels without symptoms of acute pancreatitis, which should be routinely checked.
We document an important phenomenon in our study: the beneficial effect of EMPA on the pancreas, which returned to almost normal following treatment with the drug. This result is supported by the conclusion of Cheng and coworkers 36 in a study on type 1 DM that EMPA improves blood glucose homeostasis in the disease by its action to preserve β-cell regeneration—most likely by protecting pancreatic β-cell from glucotoxicity-induced oxidative stress. In simpler terms, the kidney took over and the pancreas had a chance to recover.
Another very important finding in the present study was the therapeutic effect of EMPA on LV remodeling. The EMPA improved CV outcomes in patients with T2DM and CV risk, in whom it reduced heart failure hospitalizations and CV death, with a consistent benefit among patients with and without baseline heart failure. 29 In this study on 7020 patients, the rates of myocardial infarction or stroke did not differ significantly between the placebo and the EMPA-treated groups, but the EMPA-treated group had significantly lower rates of death from CV causes (3.7% vs 5.9% in the placebo group; 38% relative risk reduction), hospitalization for heart failure (2.7% and 4.1%, respectively; 35% relative risk reduction), and death from any cause (5.7% and 8.3%, respectively; 32% relative risk reduction). 29 The improved LV remodeling recorded here provides a potential explanation for the favorable effects of EMPA in high-risk patients.
The mechanism by which EMPA reduced adverse LV remodeling in our rat model of obesity, diabetes, and hypertension is unclear but is most likely related to the favorable effects on systolic blood pressure and plasma glucose levels. Since hypertension is a major risk factor for both systolic and diastolic heart failure, and also a modifiable target, the effects of EMPA on blood pressure would be an important mediator of the observed benefit. Moreover, Habibi et al 37 found cardiac diastolic function improved with EMPA in the female diabetic rodent model, db/db mice. Furthermore, the hemodynamic effects of combined diuresis and natriuresis with concomitant vasodilator effect lead to blood pressure lowering. This probably results in decreased preload and afterload, which leads to reduced remodeling. 38 Other potential mechanisms include reduction in oxidative stress and improved cardiomyocyte energy. 39
We were unable to detect a beneficial effect on diastolic function and cardiac fibrosis, recently described in db/db mice. 37,40 Our cardiac results are in line with the good cardiac prognosis reported by Zinman et al 29,41 in a study of the safety and possible cardioprotective activity of EMPA in 7034 patients from Europe, North America, and Asia and by Fitchett et al 42 who reported a decrease in hospitalization due to heart failure and CV death in patients with T2DM and high CV risk treated with EMPA, as well as benefit to patients with and without baseline heart failure.
It must be emphasized that the purpose of our study was to examine the ability of EMPA to prevent severe diabetes and hypertension in the CRDH rats by giving the drug early in the development of the 2 entities; this was 2 months after initiation of the SD, before the animals reached the stage of full-blown disease after 6 months on the SD. Hence, the less impressive results. Had we begun the experiments after 6 months on the diet when the animals’ clinical status was more severe, and not 2 months, the drug’ effects would have been more significant. Nevertheless, this caveat does not detract from the beneficial effects of EMPA on blood pressure, weight, kidney, pancreas, and heart demonstrated in this diabetic–hypertensive rat model. While the question remains whether the cardiorenal benefits of EMPA are unique to the drug or are a class effect of SGLT-2 inhibitors, 30 it is clear that glucose control is not the only factor contributing to the beneficial effects of EMPA, as highlighted also in recent outcome clinical trials. Considering all the data together, EMPA appears to be a promising option for many patients with T2DM, but care will still be needed to ensure that use is appropriate for an individual patient’s characteristics.
Footnotes
Appendix A
Acknowledgments
The authors thank Dr Rina Chen, PhD, biostatistician (BioForum, Applied Knowledge Center, Ness-Ziona, Israel), for assistance with the statistical analyses.
Author Contributions
Firas Younis contributed to the design of the study with E.M., carried out most of the handling and preparation of the rats for experiments and analyses, analyzed the laboratory results, and wrote up the major sections on the research data. Jonathan Leor performed the echocardiography and interpreted the results, contributed to the discussion, and reviewed/edited all sections of the manuscript dealing with the heart. Zaid Abassi contributed the section on the kidney. Natalie Landa was a technician on the heart examinations. Lea Rath-Wolfson was responsible for pathology of the pancreas. Nili Naftali-Shani was a technician on the heart examinations. Kenneth Hollander contributed to handling the rats and collecting data. Talma Rosenthal wrote the greater part of the Discussion, introduced most of the references, reviewed/edited the manuscript, and takes responsibility for the contents of the article.
Declaration of Conflicting Interests
The author(s) declared no potential conflicts of interest with respect to the research, authorship, and/or publication of this article.
Funding
The author(s) disclosed receipt of the following financial support for the research, authorship, and/or publication of this article: The authors thank Boehringer-Ingelheim for supplying the drug and providing financial support for the study.