
Abstract
Purpose:
To determine the effect of a high-fat meal on evacetrapib exposure at steady state in healthy participants.
Methods:
This was a randomized, 2-period, 2-sequence, open-label, crossover study. Patients were randomly assigned to 1 of the 2 treatment sequences in which they received evacetrapib 130 mg/d for 10 days following a 10-hour fast each day or following a high-fat breakfast each day. Plasma samples collected through 24 hours were analyzed for evacetrapib concentrations and pharmacokinetic parameter estimates including area under the concentration–time curve during a dosing interval (AUCτ), maximum observed concentration (Cmax), and time of Cmax (tmax) were calculated. Pharmacodynamic parameters, including cholesteryl ester transfer protein (CETP) activity, high-density lipoprotein cholesterol (HDL-C), low-density lipoprotein cholesterol (LDL-C), total cholesterol, and triglycerides, were also assessed.
Results:
A total of 34 males and 6 females, mean age 41.5 years and mean body mass index 26.6 kg/m2, were enrolled. Statistical analysis showed AUCτ was 44% higher (90% confidence interval [CI]: 29%-62%) and Cmax was 51% higher (90% CI: 28%-79%) in the fed state than in the fasted state, indicating an effect of food. Consistent with higher evacetrapib exposure, changes in HDL-C, LDL-C, and CETP activity appeared to be greater in the fed state than in the fasted state. There were no notable changes in total cholesterol or triglycerides following administration in the fed and fasted states. The 130-mg doses of evacetrapib were well tolerated with and without food.
Conclusion:
A high-fat meal increased evacetrapib mean exposure at steady state by 44% in healthy participants.
Introduction
Evacetrapib is a potent, selective inhibitor of cholesteryl ester transfer protein (CETP) and has demonstrated ability to inhibit CETP activity, increase high-density lipoprotein cholesterol (HDL-C), and decrease low-density lipoprotein cholesterol (LDL-C). Aggressive lowering of LDL-C has been shown to be beneficial in lowering cardiovascular events, 1 but there remains a need for additional therapies targeting other lipid-related risk factors to address residual cardiovascular disease (CVD). Epidemiological evidence shows that HDL-C levels are inversely correlated with CVD risk 2,3 ; therefore, evacetrapib is being investigated as a potential treatment to reduce the risk of major adverse cardiovascular events in patients with high-risk vascular disease.
Food effect studies are used to assess the effects of a meal on the rate and extent of drug absorption when dosed shortly after a meal (fed state) compared to the fasted state. 4 Studies of evacetrapib’s food effect have shown variable results. When a single evacetrapib dose of 100 mg as an earlier tablet formulation was dosed with a low-fat meal, there was no notable change in exposure compared to dosing in the fasted state (Eli Lilly, data on file). 5 However, when single 200-mg doses as the phase 3 formulation were given after a low-fat or high-fat meal, area under the concentration–time curve from 0 to infinity (AUC[0-∞]) was 49% and 51% higher, respectively, compared to the fasted state (Eli Lilly, data on file). 6 The ongoing phase 3 study uses the same phase 3 formulation but as a 130-mg dose. 7 The current phase 1 study was conducted to definitively determine the effect of a high-fat meal on evacetrapib exposure when evacetrapib is given as a 130-mg tablet once daily.
The design of this study adapts the Food and Drug Administration (FDA) guidance for food effect bioavailability studies, which recommend administering a single dose of drug after fasting and shortly following a high-fat, high-calorie meal. 4 Because of inconsistent results with previous food effect evaluations using the phase 3 formulation and other formulations, the authors wanted to definitively quantify the food effect for the intended dose and phase 3 formulation under conditions that mimic the worst-case scenario during clinical use. 5,6 This involved dosing to steady state with and without the high-fat, high-calorie meal recommended in the FDA guidance, although such a meal is not recommended for the intended population of patients with high-risk CVD. Evaluating drug exposure at steady state is atypical for food-effect studies, but it mimics the clinical situation and is therefore a clinically relevant design. In the current study, the phase 3 formulation of evacetrapib was dosed once daily with a high-fat, high-calorie meal each morning because multiple dosing with such meals would create the worst-case scenario for a food effect.
Method and Material
Study Design
This was a randomized, multiple-dose, 2-treatment, 2-period, 2-sequence, open-label, crossover study designed to investigate the effect of a high-fat meal on evacetrapib exposure when dosing evacetrapib as the phase 3 formulation under steady-state conditions (NLM identifier: NCT01810432). 8 Patients were randomly allocated to 1 of the 2 treatment sequences in which they received evacetrapib 130 mg/d for 10 days following a 10-hour fast each day, and evacetrapib 130 mg/d for 10 days following a high-fat breakfast each day. The standardized high-fat breakfast conformed to recommendations of the FDA guidance for food-effect studies and consisted of about 800 to 1000 calories with fat comprising about 50% of the caloric content. 4
The study adopted a group sequential adaptive design to include an interim analysis to possibly stop the study with a smaller number of patients. An interim analysis was to be performed after at least 30 patients completed both periods, and the study might then be stopped based upon the results of statistical analyses. Alternatively, the sample size was to be reestimated after the interim analysis, and the study was to continue with the new target enrollment.
For each patient, the study consisted of a screening visit, 2 dosing periods, and a poststudy follow-up examination. All patients were admitted to the clinical research unit on day 1 of both treatment periods. Patients received daily doses of evacetrapib following an overnight fast or following a high-fat breakfast, with the same dietary conditions maintained for 10 days. Based on evacetrapib’s apparent terminal elimination half-life (t1/2) of about 30 to 50 hours and data from previous clinical trials, 10 days of dosing were expected to be adequate to reach pharmacokinetic steady state. Patients were discharged on day 11. To allow for adequate washout of evacetrapib between dosing periods, there were at least 14 days between the last dose in period 1 and the first dose in period 2. Patients returned for a follow-up examination at least 14 days after the final dose in period 2.
Study Patients
Eligible patients included healthy men and women 18 to 65 years of age with a body mass index of 18.0 to 32.0 kg/m2. Use of over-the-counter or prescription medication was prohibited within 14 days prior to dosing and during the study.
The study protocol was approved by an institutional review board and was conducted in accordance with the Declaration of Helsinki and Good Clinical Practice guidelines. All patients provided written informed consent prior to participating.
Pharmacokinetic Assessments
Blood samples were collected for pharmacokinetic analysis predose and 0.5, 1, 2, 3, 4, 6, 8, 10, 12, and 24 hours following the evacetrapib dose on day 10 of each treatment period. Plasma samples were analyzed for evacetrapib using a validated liquid chromatography with tandem mass spectrometric detection method at Covance Laboratories, Inc (Madison, Wisconsin). The lower and upper limits of quantification were 1.00 and 1000 ng/mL, respectively.
Pharmacokinetic parameter estimates for evacetrapib were calculated using standard noncompartmental methods of analysis using WinNonlin Version 6.2 (Pharsight Corporation, Mountain View, California). The primary parameters for analysis were area under the concentration versus time curve during a dosing interval (AUCτ), maximum observed concentration (Cmax), and time of Cmax (tmax).
Pharmacodynamic Assessments
Pharmacodynamic parameters, including CETP activity and fasting lipid panels (HDL-C, LDL-C, total cholesterol, and triglycerides), were assessed in both treatment periods. Blood samples were collected for pharmacodynamic analysis predose and 24 hours following the evacetrapib dose on day 10 of each treatment period. Samples were analyzed for fasting lipids at Covance, Inc (Indianapolis, Indiana) and for CETP activity at Pacific Biometrics Inc (Seattle, Washington).
Safety Assessments
Safety was assessed by physical examinations, clinical laboratory evaluations, vital signs, and safety electrocardiograms (ECGs) as well as monitoring of treatment emergent adverse events (TEAEs). Assessment of clinical laboratory safety parameters included hematology, urinalysis, and biochemistry panels.
Statistical Analysis
Pharmacokinetic parameter estimates were analyzed using an analysis of variance (ANOVA) model, which included fixed effects for the sequence, period, and treatment (high-fat meal and fasted) and a random effect for patient. The least squares (LS) means for each treatment, the difference in LS means, and their 90% repeated confidence intervals (RCIs) were estimated from the ANOVA model and back-transformed from the log scale to provide estimates of the geometric means, the ratio of the geometric means (high-fat meal vs fasted), and their 90% RCIs. A lack of food effect was to be declared if the 90% RCI for AUCτ and Cmax was contained within the limits 0.80 to 1.25. The tmax for evacetrapib was analyzed using a nonparametric approach. The median difference and 90% confidence intervals (CIs) for the difference between the dietary states were calculated.
Pharmacodynamic measures including corrected CETP activity, HDL-C, and LDL-C were summarized by treatment using mean and standard deviation on days 1 and 11. The percentage of change from baseline (day −1 for each period) was also summarized by treatment.
It was determined that a maximum sample size of 74 completing patients would provide at least 90% overall power to demonstrate a lack of food effect, assuming an expected ratio of geometric means equalling 1.10, an intrapatient coefficient of variation of 26.3% for area under the concentration–time curve (AUC), an overall probability of wrongly declaring lack of food effect of 0.05, and accounting for 1 planned interim analysis. The RCI was used to preserve the overall type I error rate while an interim analysis was conducted to possibly stop the study with a smaller number of patients if a lack of food effect was established or if a food effect was likely present. The interim analysis was to occur after at least 30 patients completed both periods, which was the sample size needed to provide at least 90% power to demonstrate lack of food effect assuming the expected ratios of the geometric means equalled 1.00. The statistical hypothesis tests were derived based on RCIs and the stopping rule was defined as follows, in line with the approach for equivalence tests
9
: Lack of food effect would be established if the 90% RCI of ratio of geometric means of AUCτ between fed and fasted fell within 0.8 and 1.25. Stop the study. Lack of food effect would not be established if the lower bound of the 90% RCI was greater than 1.25 or the upper bound was less than 0.8. Stop the study. Otherwise, the sample size would be reestimated. If the reestimated sample size did not exceed 74 patients, then enrolment would continue up to the reestimated sample size. If the reestimated sample size exceeded 74 patients, then the study would be terminated and lack of food effect would not be established.
Results
Demographics and Disposition
Forty healthy participants entered the study and received at least 1 dose of evacetrapib. Table 1 shows the demographic characteristics. Patients included 34 males and 6 females, aged 20 to 62 years, inclusive, with a mean body mass index of 26.6 kg/m2. Thirty-two patients completed the study. Of the 8 patients who did not complete the study, 3 withdrew consent due to personal reasons, 2 were lost to follow-up, 1 discontinued due to an adverse event (AE) considered unrelated to study drug or study procedures, 1 discontinued due to protocol violation, and 1 discontinued due to physician decision.
Patient Demographics.
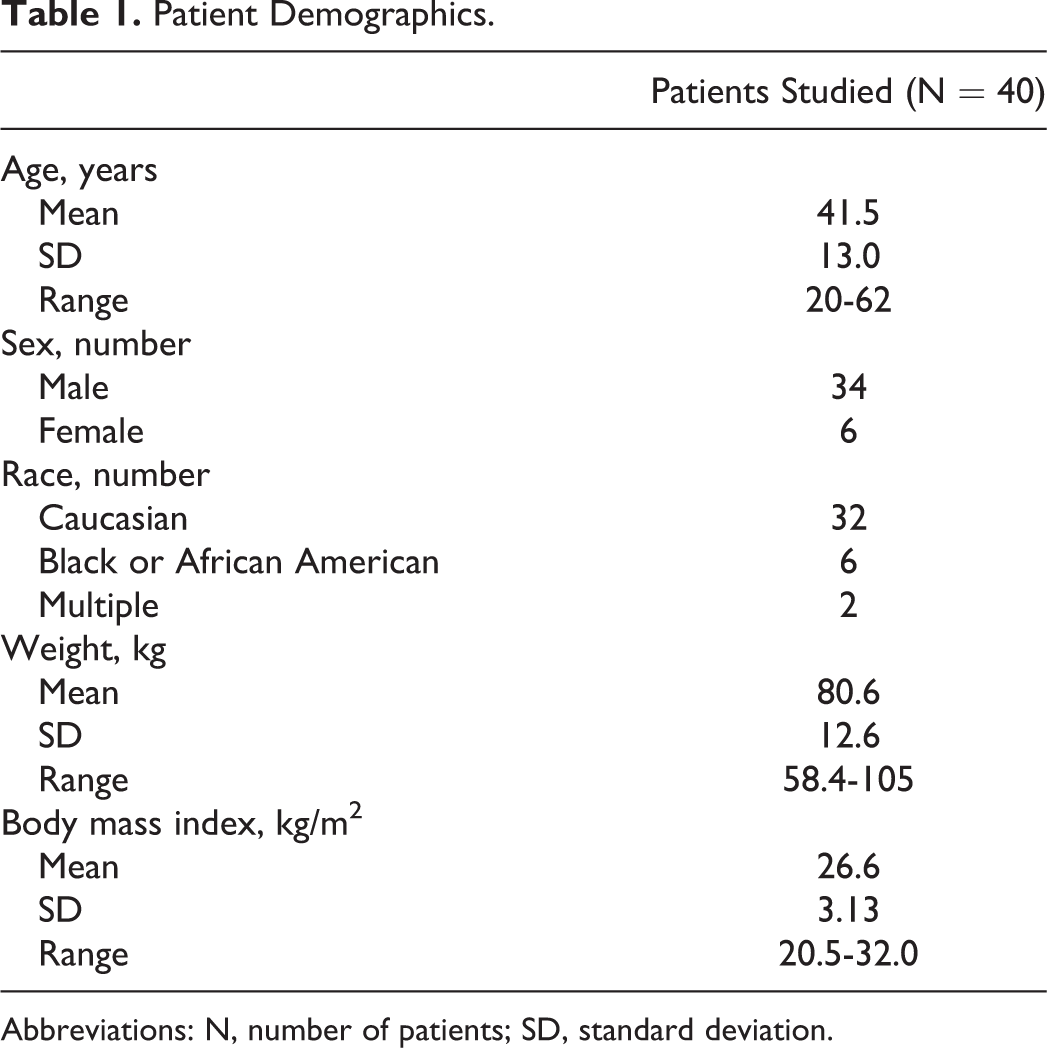
Abbreviations: N, number of patients; SD, standard deviation.
Pharmacokinetics
The mean plasma concentration versus time profiles of evacetrapib following the doses in the fed and fasted state on day 10 are shown in Figure 1. The planned interim analysis for food effect was conducted using preliminary concentration data and nominal sampling times. Following 130 mg evacetrapib every day for 10 days, the geometric mean AUCτ was 44% higher and the geometric mean Cmax was 51% higher in the fed state than in the fasted state. The lower bound of the 90% RCIs for the ratios of geometric LS means exceeded 1.25 for both parameters. Thus, a lack of food effect was not established, and the study was terminated per the prespecified stopping rule #2.

Mean (±standard deviation) plasma concentrations of evacetrapib on day 10 following 130-mg evacetrapib every day in the fed (open circles) and fasted (filled circles) state.
The plasma pharmacokinetic parameter estimates from the final analysis of evacetrapib concentration data and actual sampling times on day 10 are summarized in Table 2. The results of the final statistical assessment confirmed those of the interim analysis, with the AUCτ being 44% higher and the Cmax being 51% higher in the fed state than in the fasted state, and the lower bound of the 90% CIs for the ratios of geometric LS means exceeding 1.25 for both parameters (Table 3). There was no significant difference in tmax between the fed and the fasted states.
Summary of Evacetrapib Pharmacokinetic Parameter Estimates on Day 10 Following 130 mg Evacetrapib Every Day in the Fed and Fasted State.

Abbreviations: AUCτ, area under the concentration versus time curve during 1 dosing interval; Cmax, maximum observed drug concentration; CV, coefficient of variation; N, number of patients; tmax, time of maximum observed concentration.
aN = 36.
bMedian (range).
Final Statistical Analysis of Evacetrapib Pharmacokinetic Parameter Estimates on Day 10 Following 130 mg Evacetrapib Every Day in the Fed and Fasted State.a

Abbreviations: AUCτ, area under the concentration versus time curve during 1 dosing interval; CI, confidence interval; Cmax, maximum observed drug concentration; LS, least squares; N, number of patients; tmax, time of maximum observed drug concentration.
aModel: log(PK) = Treatment + Period + Sequence + Subject (random effect) + Random Error.
Pharmacodynamics
The mean decreases in corrected CETP activity, increases in HDL-C, and decreases in LDL-C on day 11 appeared to be greater following evacetrapib in the fed state compared to the fasted state (Table 4). There were no notable changes in total cholesterol or triglycerides following administration in the fed and fasted states (data not shown).
Summary of Corrected CETP Activity, High-Density Lipoprotein Cholesterol (HDL-C), and Low-Density Lipoprotein Cholesterol (LDL-C) Following 130 mg Evacetrapib Every Day in the Fed and Fasted State.

Abbreviations: N, number of patients; SD, standard deviation; CETP, cholesteryl ester transfer protein.
aBaseline defined as day −1 in each period.
Safety and Tolerability
All TEAEs reported after evacetrapib administration were mild in severity, and the incidence of treatment-related AEs was similar under fed and fasted conditions. The most frequently reported TEAE considered related to study drug was headache, which was reported by 4 (10%) patients. Gastrointestinal TEAEs considered related to study drug were abdominal pain and diarrhea, which were each reported by 3 (7.5%) patients. The 3 episodes of drug-related diarrhea, each consisting of 1 episode of loose stools, were reported by 3 patients following dosing on day 6 in the fasted state and resolved spontaneously.
One patient had elevated liver enzymes approximately 1 day after the final dose of evacetrapib in periods 1 (fasted state) and 2 (fed state). On day 11 of period 1, the patient’s aspartate aminotransferase (AST) level was 3.5 times the upper limit of normal (ULN) and alanine aminotransferase (ALT) level was 2.6 times the ULN. On day 1 of period 2, the AST level had fallen to within the reference range and the ALT level had fallen nearly to the ULN. On day 11 of period 2, the AST and ALT levels increased again to 4.7 times and 6.3 times the ULN, respectively. At the follow-up visit (2 weeks after final dose), the patient’s AST and ALT levels were both below the ULN. The AEs of increased AST and ALT were considered by the investigator to be mild in severity and related to study drug. No other patients had AST or ALT levels greater than the ULN during the study. There were no clinically significant findings in the safety assessments from vital signs or 12-lead ECGs for individual patients during the study.
Discussion
Previous studies of evacetrapib showed variable results in terms of food effect. 5,6 In the phase 3 study, Assessment of Clinical Effects of Cholesteryl Ester Transfer Protein Inhibition with Evacetrapib in Patients at a High Risk for Vascular Outcomes (ACCELERATE), evacetrapib is being dosed without regard to food. 8 The current study was conducted to determine the effect of a high-fat meal on the pharmacokinetics of 130-mg evacetrapib at steady state in healthy participants. This was a definitive study that used the phase 3 formulation and dose being used in the phase 3 study 8 and treated patients once daily to pharmacokinetic steady state to mimic the expected clinical dosing recommendation. As recommended in regulatory guidances, a high-fat, high-calorie breakfast was used to elicit the largest food effect that could be expected. The results showed that such a meal increased evacetrapib exposure, with AUCτ and Cmax 44% and 51% higher, respectively, in the fed state than in the fasted state. Changes in HDL-C, LDL-C, and CETP activity were consistent with the higher evacetrapib exposure after the meal. Doses of 130 mg evacetrapib every day were well tolerated with and without food.
As part of the group sequential adaptive design used in the study, a planned interim analysis was performed using data from the 40 enrolled patients. Based on the statistical analysis using RCIs, a lack of food effect was not established because the 90% RCIs fell outside the no effect range of 0.8 and 1.25. The study was ended based on the prespecified stopping rule #2, rather than continuing to complete up to 74 patients.
An interesting and somewhat unanticipated aspect of the study results was the large difference in intersubject variability estimates for evacetrapib AUCτ and Cmax when dosed after a meal compared to after fasting. The geometric coefficients of variation for AUCτ and Cmax were 49% and 73%, respectively, after fasting and 19% and 22%, respectively, after the high-fat meal (Table 2). In a previous study, it appeared that variability may have been higher after a single dose than after multiple doses, 10 but the differences were smaller than those observed in this study. The observed decrease in intersubject variability was one of the reasons that multiple dosing was considered for the current study. The most likely explanation for the lower variability after a high-fat meal than after fasting is that the fraction absorbed is higher. While the absolute bioavailability of evacetrapib has not been measured, it is expected that if the fraction absorbed under fasted conditions is high, then further increasing the fraction absorbed (ie, after a high-fat meal) will tend to reduce variability, as fraction absorbed moves closer to 100%.
The meals given in this study conform to guidances and were expected to elicit the largest food effect; however, this type of meal has more calories and greater fat content than that recommended for the intended patient population with high-risk CVD. Current patient guidelines call for a diet of moderate portions consisting of fruits, vegetables, and whole grains, and low in fat and cholesterol. The meals given prior to evacetrapib doses in this study had few, if any, of these attributes. Although the effect of food on evacetrapib exposure may be as high with a low-fat meal as with a high-fat meal, this was not tested in the current study. In previous food-effect assessments of evacetrapib, a low-fat meal had a smaller effect than that of a high-fat meal; however, these studies were conducted using single administrations with different doses or formulations and, therefore, were not definitive. 5,6
The changes in pharmacodynamic parameters in the current study were comparable to those observed with evacetrapib treatment in the multiple ascending dose study conducted with an earlier formulation. 11 In that study, 14 days of placebo or evacetrapib monotherapy at once-daily doses of 100, 300, and 600 mg produced a dose-dependent increase in HDL-C ranging from 59% to 81%, decrease in LDL-C from 24% to 27%, and decrease in CETP activity from 65% to 91% compared to baseline. The mean estimates of steady state AUC over a dosing interval during treatment with 100, 300, and 600 mg once-daily in that study were 4610, 7570, and 13 700 ng·h/mL, respectively. 11 Recent pharmacokinetic/pharmacodynamic analyses show that the effect on HDL-C is not at steady state after 10 days, and that HDL-C levels further increase from 10 days to 12 weeks of treatment with evacetrapib. 12 In a phase 2 safety and efficacy study A Phase 2 Efficacy and Safety Study of LY2484595 Alone and in Combination with Atorvastatin, Simvastatin, and Rosuvastatin in Patients with Hypercholesterolemia or Low HDL-C (clinicaltrials.gov Identifier: NCT01105975), HDL-C increased 98% and 132% after 12 weeks of treatment with 100 and 500 mg evacetrapib, respectively. 13
Another inhibitor of CETP, anacetrapib (MK-0859; Merck & Co, Inc, Whitehouse Station, New Jersey) is also in phase 3 of development. Initial single-dose and multiple-dose studies in normal healthy volunteers evaluating the pharmacokinetics, pharmacodynamics, and tolerability of anacetrapib demonstrated significant pharmacokinetic variability following administration in the fed or fasted state. 14,15 These biopharmaceutics studies used the phase 3 formulation in controlled phase 1 studies, administering a standard high-fat breakfast with single doses of 25 to 800 mg anacetrapib 14 or multiple doses of 150 mg anacetrapib, 15 and demonstrated an approximately 7.5-fold increase in AUC and an approximately 17-fold increase in Cmax relative to the fasted state. A CETP inhibitor in early clinical development is TA-8995 (Mitsubishi Tanabe Pharma Corp, Tokyo, Japan), which increased HDL-C up to 140% and decreased LDL-C up to 44% in healthy Caucasian males during once-daily dosing of 10 mg for 21 days. 16 The AUC of TA-8995 after a 50-mg dose to healthy Caucasian males was not affected by a high-fat meal. 16
Conclusion
Taking evacetrapib with a high-fat, high-calorie meal for 10 days increased the steady-state exposure of evacetrapib by 44% compared to taking evacetrapib under fasted conditions. This study used a meal higher in fat than that typically recommended for the intended patient population and therefore reflects a situation unlikely to be encountered with patients who are complying with their treating physician’s advice.
Footnotes
Author Contributions
D. Small, W. Zhang, E. Cannady, and J. Suico contributed to conception and design, acquisition, analysis, and interpretation, drafted the article, critically revised the article, gave final approval, and agreed to be accountable for all aspects of work ensuring integrity and accuracy. J. Royalty and S. Friedrich contributed to conception and design, acquisition, analysis, and interpretation, critically revised the article, gave final approval, and agreed to be accountable for all aspects of work ensuring integrity and accuracy. D. Downs contributed to acquisition, analysis, and interpretation, critically revised the article, gave final approval, and agreed to be accountable for all aspects of work ensuring integrity and accuracy.
Acknowledgments
The authors wish to acknowledge the investigators and patients who participated in this study; Eric Chen Quin Lam, PhD, and Malcolm Mitchell, MBBS, MFPM, of Eli Lilly and Company for scientific support and medical review; and Amanda Hodgson, PhD, of Covance Inc (Madison, Wisconsin) for providing writing assistance.
Declaration of Conflicting Interests
The author(s) declared the following potential conflicts of interest with respect to the research, authorship, and/or publication of this article: JGS, DSS, WZ, EAC, SF, and DD are employees of, and may hold stock in, Eli Lilly and Company. JR is an employee of Covance Inc.
Funding
The author(s) disclosed receipt of the following financial support for the research, authorship, and/or publication of this article: This study was funded by Eli Lilly and Company.