
Abstract
The main objective of cell therapy is the regeneration of damaged tissues. To distinguish graft from host tissue by magnetic resonance imaging (MRI), a paramagnetic label must be introduced to cells prior to transplantation. The paramagnetic label can be either exogenous iron oxide nanoparticles or a genetic overexpression of ferritin, an endogenous iron storage protein. The purpose of this work was to compare the efficacy of these 2 methods for MRI evaluation of engrafted cell survival in the infarcted mouse heart. Mouse skeletal myoblasts were labeled either by cocultivation with iron oxide particles or by engineering them to overexpress ferritin. Along with live cell transplantation, 2 other groups of mice were injected with dead-labeled cells. Both particle-labeled and ferritin-tagged grafts were detected as areas of MRI signal hypointensity in the left ventricle of the mouse heart using T2*-weighted sequences, although the signal attenuation decreased with ferritin tagging. Importantly, live cells could not be distinguished from dead cells when labeled with iron oxide particles, whereas the ferritin tagging was detected only in live grafts, thereby allowing identification of viable grafts using MRI. Thus, iron oxide particles can provide information about initial cell injection success but cannot assess graft viability. On the other hand, genetically based cell tagging, such as ferritin overexpression, despite having lower signal intensity in comparison with iron oxide particles, is able to identify live transplanted cells.
Keywords
Introduction
Noninvasive imaging is important in research and clinical applications; it can reliably assess changes in organ structure and function as well as report on therapeutic cell transplantation and gene expression. The goal of transplanted cell imaging is to achieve detectable signals from live grafts along with high spatial resolution in in vivo settings. Although the majority of available imaging modalities such as bioluminescence, 1 -3 positron emission tomography, 4,5 and single-photon emission computed tomography 6,7 are characterized by high sensitivity but low spatial resolutions, magnetic resonance imaging (MRI) can achieve excellent resolution and tissue contrast. 8,9 Magnetic resonance imaging has become a commonly used tool for noninvasive serial imaging of transplanted cell migration and engraftment. 10 -16 Typically, labeling of cells prior to transplantation is required for discrimination of grafts from the surrounding host tissue. At present, the most robust method of cell labeling for MRI detection is loading cells with synthetic superparamagnetic nanoparticles (10-200 nm diameter) containing high concentrations of iron oxide inside a shell composed of dextran or other biocompatible materials. These nanoparticles can be easily delivered to cells in culture dishes with or without use of transfection reagents and are accumulated in cytoplasm without altering cell viability and function. 8,9,12 -14 The presence of iron causes local disturbance of the magnetic field in the area of injected cells that appear in MRI as hypointense (ie, dark) in T2*-weighted images.
Another way of cell tagging is genetic overexpression of the endogenous protein ferritin. The natural iron-sequestering properties of ferritin enable its use as an MRI reporter gene. 17,18 Ferritin consists of 24 light and heavy chain subunits; it accumulates endogenous Fe(II) and stores it in the interior cavity of the protein cage in the form of ferrihydrite Fe(III). 19,20 It has been shown that ferritin overexpression leads to upregulation of transferrin receptor and increased iron uptake. 21,22 The MRI relaxivity increases with increased iron uptake by ferritin. 23,24 Importantly, there is no essential dependence of ferritin-based MRI contrast on exogenous substrate administration. 17,18 Some studies, however, suggest that exogenous iron supplementation increases MRI signal hypointensity of ferritin-expressing tissues. 25 During the last 10 years, the MRI reporter ferritin has been used by many research groups for various applications: to visualize tumors, 17,26 -29 for MRI tracking of stem cells, 30 -32 and for noninvasive imaging of atherosclerosis 33,34 ; ferritin overexpression was detected in utero in transgenic mice 35,36 and liver hepatocytes. 37 Ferritin shells have also been extensively used in materials science as a precursor for making nanocomposite particles. 33,34,38 -40
To our knowledge, no direct comparison between cells labeled by iron oxide particles and cells overexpressing ferritin to determine efficacy of MRI to detect live transplanted cells has been performed thus far. We have previously demonstrated the feasibility of MRI detection for cardiac grafts overexpressing ferritin 41 ; we also identified the optimal MRI sequences for detection and morphological measurements of ferritin-labeled grafts in rodent hearts in vivo. 42 The purpose of this study was to compare 2 labeling techniques, iron oxide particles versus genetic manipulations leading to ferritin overexpression, for MRI detection of transplanted cell survival in the infarcted heart.
Engraftment is difficult for many cell types, especially in the ischemic environment of the infarcted myocardium. 2,43 -47 The majority of transplanted cells are lost, first due to leakage from the injection site and then due to death from multiple mechanisms. 48 We have chosen mouse skeletal myoblasts (C2C12 cells) for transplantation into the infarcted mouse heart because C2C12 cells are a perfect model for proof-of-principle studies. First, skeletal myoblasts are resistant to ischemia 49 ; these cells survive well in the infarcted heart and form large grafts that are easily detectable by imaging and histology. 41,42 Second, C3H mice were chosen as recipients for C2C12 transplantation to minimize immunological rejection of engrafted cells, because the C2C12 myoblast line was originally derived from this mouse strain. 50
Methods
Cell Culture and Labeling
Murine C2C12 skeletal myoblasts were cultured in Dulbecco modified Eagle medium (DMEM; Invitrogen, Grand Island, New York) supplemented with 20% fetal bovine serum (HyClone, Logan, Utah), 2 mmol/L
In parallel, other C2C12 cells were genetically modified to overexpress endogenous ferritin. Since ferritin heavy chain catalyzes the ferroxidase activity 51,52 and its overexpression is sufficient for MRI contrast, 17 we used mouse heavy-chain ferritin complementary DNA (cDNA) for cloning into the pcDNA3 vector plasmid downstream of the cytomegalovirus promoter, thus enabling strong transgenic expression. DNA sequencing confirmed fidelity of the construct. Mouse C2C12 skeletal myoblasts were transduced with the engineered plasmid vector pcDNA3-ferritin using a FuGENE6 transfection reagent (Roche Applied Science, Indianapolis, Indiana). Stably transduced cells were selected with neomycin (G418, 1.2 mg/mL).
Confirmation of Cell Labeling
Standard Prussian blue staining was used to confirm iron accumulation in cytoplasm after C2C12 labeling with iron oxide particles and in cells overexpressing ferritin. For the staining, C2C12 cells were plated in 6-well plates and grown for 48 hours in media supplemented with iron (0.5 mmol/L ferric citrate water solution), due to low iron content in the standard cell growth media. Before staining, cells were washed twice with phosphate-buffered saline (PBS) and then fixed with 2% paraformaldehyde for 10 minutes. Equal amounts of 20% hydrochloric acid and 10% potassium ferrocyanide solution were mixed and then added to 6-well plates for 20 minutes. Nuclear fast red was used as a counterstain. In this assay, the presence of iron was indicated by a bright blue color in a granular cytoplasmic distribution.
Expression of ferritin was detected by Western blot analysis. Specifically, C2C12 cells were lysed, homogenized, and electrophoresed in a 12% polyacrylamide gel (30 µg protein/lane). Membranes were incubated overnight (4°C) with rabbit monoclonal antibody to ferritin, 1:2000 dilutions (cat# ab75973; Abcam Inc, Cambridge, Massachusetts). Identical blots were prepared and incubated with a mouse-nonconjugated monoclonal antibody against β-tubulin (1:400; Sigma, St Louis, Missouri) as a control for protein loading. Either horseradish peroxidase (HRP)-conjugated goat antirabbit antibody (ferritin detection) or rat antimouse antibody (β-tubulin detection), all 1:5000 in tris-buffered saline Tween, was used as a secondary antibody.
Assessment of Labeled Cell Viability, Proliferation, and Differentiation
Viability of mouse myoblasts was evaluated during every passage by Trypan Blue exclusion. Cell proliferation was assessed by monitoring the total number of cells plated in 6-well plates (5000 cells/well) during 1 week of growth using a Beckman Coulter Analyzer (Beckman Coulter, Inc., Indianapolis, Indiana). We compared the growth of wild-type, iron oxide particle-labeled cells and C2C12 overexpressing ferritin. All calculations were done in triplicate.
To assess the effect of ferritin overexpression and particle loading on differentiation of C2C12 cells into multinucleated myotubes, we used a myogenic differentiation protocol where the growth medium was replaced by DMEM containing 5% horse serum. Cells were maintained in the differentiation medium for 7 days and then fixed with ice-cold methanol. Myosin heavy chain was visualized using monoclonal antifast skeletal myosin heavy-chain antibody MY32 (1:400 dilution).
Cell Transplantation
All animal procedures were approved by the University of Washington (Seattle, Washington) Institutional Animal Care and Use Committee and performed in accordance with federal guidelines (Guide for the Care and Use of Laboratory Animals from the Institute for Laboratory Animal Research, National Research Council, Washington, District of Columbia). A total of 45 male C3H mice were included in the study (weight 20-25 g). The age of animals was between 3 and 4 months on the day of surgery. For surgery, mice were anesthetized by intraperitoneal injection of 2.5% Avertin (Phoenix Pharmaceuticals, Inc., Burlingame, California; 0.02-0.026 mL/g), intubated, and mechanically ventilated with supplemental oxygen and 3 cm H2O of positive end-expiratory pressure. The heart was exposed via a left thoracotomy and subjected to myocardial injury by permanent ligation of the left anterior descending artery by 8-0 Prolene suture. After verification that coronary occlusion had occurred (blanching of the tissue distal to the suture), 5 × 10⁵ C2C12 cells suspended in 7 µL of serum/antibiotics-free medium were injected into the border of infarcted region of the left ventricle (LV) in 2 injection sites using a 30-gauge needle. We used 0.05% trypsin solution to detach C2C12 cells from plate. Cells were spun in a centrifuge and resuspended in serum/antibiotics-free DMEM for transplantation. Two groups of animals received live C2C12 cells: the first group received wild-type C2C12 cells labeled with iron oxide particles (n = 10) and the second group received live C2C12 genetically modified to overexpress ferritin (n = 13). Along with live cell transplantation, the other 2 groups of mice were injected with dead C2C12 cells (cells were killed by repeated freeze–thaw cycles): one of these groups received wild-type C2C12 cells previously labeled in culture with iron oxide particles (n = 12) and the other group received transgenic cells overexpressing ferritin (n = 10). The C2C12 cells labeled with ferritin and iron oxide particles were injected on the same day in different animals to minimize study variability. The mouse chest was then closed aseptically. Animals recovered from surgery in a heated chamber.
Magnetic Resonance Imaging Protocol
All animals were imaged alive 1 month after C2C12 transplantation using a 3-T Philips Achieva MRI scanner (Best, the Netherlands), which has a bore of 60 cm. The gradient system has a maximum amplitude of 80 mT/m and a slew rate of 200 mT/m/ms. The 3-T scanner is equipped with 32 receivers and the latest magnetic field gradient hardware and software, including a single-channel solenoidal mouse coil (Philips Research Laboratories, Hamburg, Germany) with a built-in heating system to maintain physiological body temperature. During imaging sessions, animals were anesthetized with isoflurane (1.5% in oxygen, flow rate 1 L/min) delivered through a nose cone. Physiological monitoring of the heart rate, respiration, and body temperature was performed with a Small Animal Monitoring and Gating System (SA Instrument Inc, Stony Brook, New York). The MRI acquisitions were triggered by every third R-peak of the electrocardiogram (ECG) using needle electrodes attached subcutaneously to the animals’ extremities.
To detect transgenic C2C12 grafts overexpressing ferritin as well as iron oxide particle-labeled cells, we used MRI techniques we had developed previously. 41,42 Specifically, the imaging protocol included 2 ECG-gated sequences applied in the short-axis plane with a 1-mm slice thickness providing whole-heart coverage. First, we used an ECG-gated multislice proton density-weighted black-blood double inversion-recovery turbo spin echo (PD TSE BB) sequence to obtain high-resolution in vivo magnetic resonance images of the mouse heart. Imaging parameters are as follows: repetition time (TR) ∼ 1100 to 1200 ms dependent of the heart rate, echo time (TE) 10 ms, matrix 256 × 256, flip angle 90°, field of view 50 × 50 mm, and 4 signal averages. The PD TSE BB sequence allowed clear delineation of the left ventricular borders in the mouse heart with excellent blood suppression. To detect cells with accumulated iron oxide particles and overexpressing ferritin, a bright-blood T2*-weighted cine gradient recalled echo (GRE) sequence was used with TR = 14 ms, 2 echoes (5 and 9 ms), slice thickness 1 mm, flip angle 15°, field of view 50 × 50 mm, matrix 200 × 200, and 6 signal averages.
Image Analysis
For image analysis, we used the approach described previously. 42 Regions of interest (ROIs) were outlined on each image on where the graft was visible as a localized hypointensity. Mean signal intensity (SI) in the ROI was calculated. A ROI in the background air was used to measure the standard deviation of noise (SDnoise). Specifically, graft-to-myocardium SI ratio (SIR) was calculated as the ratio of SIs from in vivo MRI using ROI centered in the middle of the graft and in the noninfarcted area of the LV. SIR = SIgraft/SILV.
The signal-to-noise ratio (SNR) was calculated as the ratio of SI of the ROI centered in the LV wall (SILV) of the mouse heart, or at the area of graft (SIgraft), and the SDnoise in background air. SNRgraft = SIgraft/SDnoise; SNRLV = SILV/SDnoise.
The contrast-to-noise ratio (CNR) was calculated as the difference between the SNR of the noninfarcted area of the LV and the SNR of the graft area. CNR = SNRLV − SNRgraft.
Histological Analysis
Animals were euthanized by a lethal dose of pentobarbital. Hearts were fixed in methyl Carnoy solution and processed for histological analysis. The entire mouse heart was sectioned in the short-axis for histological staining: 8 tissue sections (5-μm thick) were cut at each millimeter of the heart to match the MRI short-axis images. Established histological and immunohistochemical methods were used to validate MRI assessment of infarct size, graft location, and ferritin accumulation in cardiac tissue. Picrosirius red (collagen specific)/fast green staining was used to define the infarct zone. Skeletal muscle grafts in mouse hearts were identified using a mouse monoclonal antibody against embryonic skeletal myosin heavy chain (hybridoma supernatant, 1:100; Developmental Studies Hybridoma Bank, University of Iowa, Iowa). Sections were blocked with 1.5% normal goat serum in PBS and incubated for 1 hour at room temperature with the biotinylated primary antibody (Animal Research Kit, Dako). Sections were then incubated for 30 minutes at room temperature with HRP-conjugated streptavidin (Dako), developed with 3,3-diaminobenzidine (Sigma), and counterstained with hematoxylin (Sigma). Prussian blue staining (20% aqueous solution of HCl and 10% of aqueous solution of potassium ferrocyanide, 1:1) was used for detection of iron deposition in cardiac tissue. Photographs of heart sections were taken with a QColor 3 Olympus digital camera (Olympus Corporation of the Americas, Center Valley, Pennsilvania) and a Nikon Eclipse 80i microscope (Nikon Instruments, Inc., Melville, New York).
Statistical Analysis
Microsoft Excel (Microsoft, Inc, Redmond, Washington) and SPSS 12.0 statistical software (International Business Machines Corp., Armonk, New York) were used for statistical analysis. The normality of distribution for each variable was assessed using 1-sample Kolmogorov-Smirnov test (K-S test), and the sample frequency distribution was compared with a reference probability distribution. Group comparisons between ferritin-tagged and iron oxide particle-labeled grafts were assessed by independent t-test for variables with unequal variances. Agreement between graft size measurements by MRI and histology (embryonic skeletal myosin staining) was assessed using Pearson correlation coefficient (r). A P value of <.05 was considered statistically significant. All measurements are presented as mean ± standard deviation.
Results
Effect of Particle Loading and Ferritin Overexpression on C2C12 Viability, Proliferation, and Differentiation
Wild-type C2C12 cells, as well as cells labeled by iron oxide particles and overexpressing ferritin, were grown for about a month in the standard C2C12 growth medium. The viability of mouse myoblasts was evaluated with every passage by a Trypan Blue exclusion assay; almost 100% of the cells remained viable after labeling by either particles or ferritin.
Western blot analysis with a rabbit monoclonal antibody specific to ferritin detected high levels of ferritin in transduced cells but not in the wild-type control (Figure 1). C2C12 proliferation was assessed by standard growth curves (Figure 2). There was no difference in proliferation of wild-type cells and transgenic myoblasts overexpressing ferritin. We noticed a slightly higher number of cells labeled by iron oxide particles by day 5 of the observation (although the difference was not statistically significant).

Western blot analysis confirming ferritin overexpression. First antibody: monoclonal rabbit antibody to ferritin, 1:2000; Abcam Inc, Cambridge, Massachusetts. Second antibody: horseradish peroxidase (HRP)-conjugated goat antirabbit antibody 1:5000 in TBS-T. 1: Molecular weight ladder. 2: Jurkat cell lysate (ferritin control). 3: Transduced C2C12 overexpressing ferritin. 4: C2C12 wild type (WT; negative control).

Standard growth curves of the wild-type C2C12 (green), C2C12 overexpressing ferritin (red), and cells labeled with iron oxide particles (blue).
Both particle-labeled and ferritin-tagged mouse skeletal myoblasts were differentiated into myotubes. No difference in differentiation patterns or timing was found. Labeling of C2C12 cells by iron oxide particles as well as ferritin overexpression persisted through multiple rounds of cell division and differentiation. Figure 3 represents Prussian blue staining for identification of iron in differentiated multinucleated myotubes. Higher accumulations of iron were detected in the cytoplasm of C2C12 cells labeled with iron oxide particles as well as overexpressing ferritin but not in wild-type control cells.
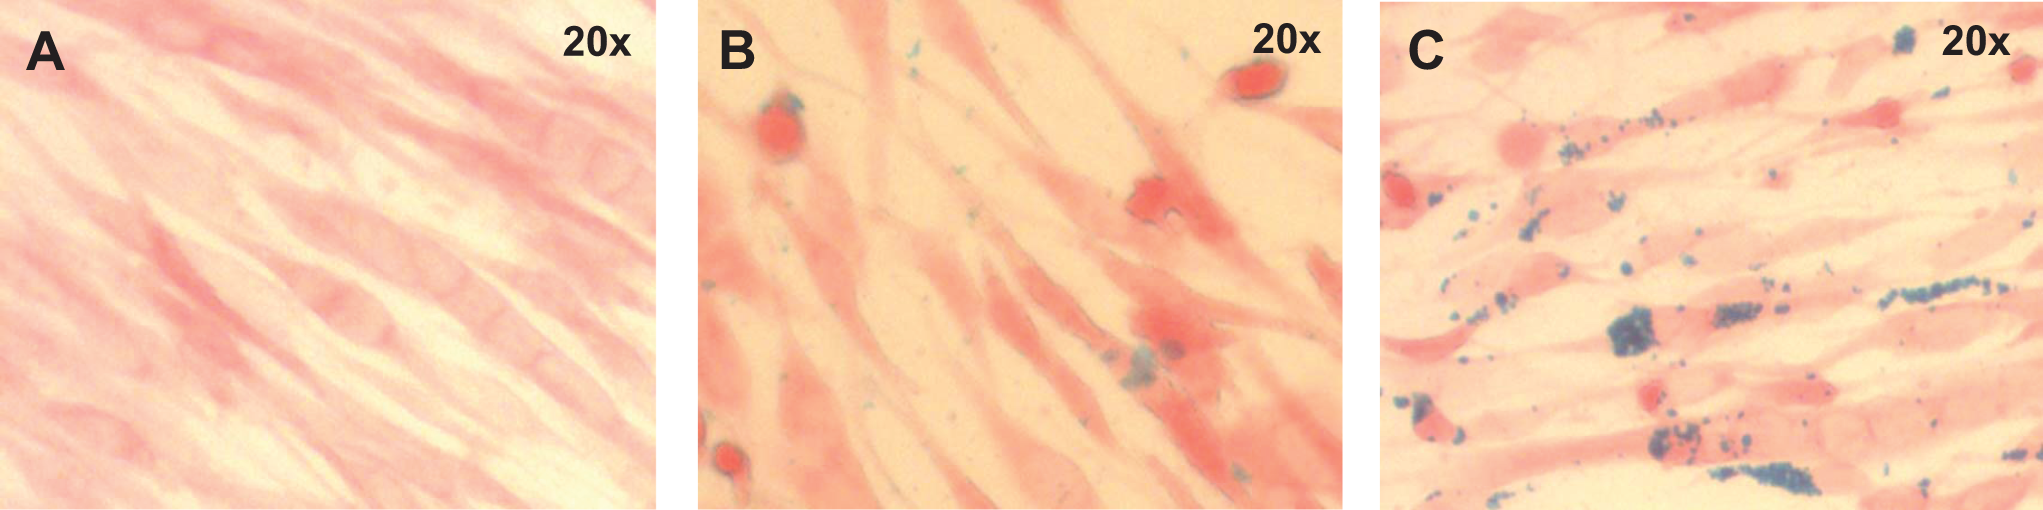
Prussian blue staining of mouse skeletal myoblasts (C2C12) differentiated into multinucleated myotubes. A, Wild-type unlabeled cells. B, Transgenic C2C12 overexpressing ferritin. C, Wild-type C2C12 cells labeled with iron oxide particles.
Magnetic Resonance Imaging Detection of Live Ferritin- and Particle-Tagged Grafts in the Mouse Heart
Wild-type C2C12 cells labeled by iron oxide particles, as well as transgenic C2C12 cells overexpressing ferritin were transplanted live to the infarcted mouse heart and formed large skeletal muscle grafts detected by MRI as significant thickening of the LV wall (Figure 4). The presence of the live grafts was confirmed by immunostaining for embryonic skeletal muscle myosin heavy chain (Figure 4F, K, and M).

In vivo MRI identification of the live transplanted cells labeled by iron oxide particles (top) or transgenic C2C12 overexpressing ferritin (bottom). Red arrows point to the graft area in the left ventricle of the mouse heart. A-F, Live C2C12 graft labeled with iron oxide particles. G-M, Live transgenic C2C12 graft overexpressing ferritin. A and G, The PD TSE black-blood MRI sequence. B and H, T2* GRE black-blood sequence with TE 5 ms. C and I, T2* GRE bright-blood sequence with TE 9 ms. D and J, Picrosirius red (collagen-specific)/fast green staining to define the infarct zone. E (with magnification) and L, Prussian blue staining depicting iron accumulation in cardiac tissue. F, K, and M, Embryonic skeletal myosin heavy chain staining to identify C2C12 graft.. Black rectangle (D) shows matching area of iron accumulation (E) and graft location (F). GRE indicates gradient recalled echo; LV, left ventricle; MRI, magnetic resonance imaging; PD TSE, proton density-weighted turbo spin echo; TE, echo time.
Live C2C12 grafts labeled by particles and by ferritin were detected in T2*-weighted GRE sequences as dark areas of signal hypointensity in the LV wall of the mouse heart (Figure 4, red arrows). The graft-to-myocardium SIR in the live transgenic grafts overexpressing ferritin was 0.71 ± 0.13 at the T2*-weighted GRE, which corresponds to a 30% MRI signal decrease (Table 1). The longer TE of 9 ms better visualized the iron accumulated in overexpressed ferritin complexes better than a 5-ms TE (Figure 4H and I). Live grafts overexpressing ferritin did not cause SI changes in PD TSE BB images (SIR 1.02 ± 0.14).
In Vivo Imaging Properties of Iron Oxide Particle-Labeled C2C12 Grafts and Grafts Overexpressing Ferritin in the Mouse Heart.a

Abbreviations: CNR, contrast-to-noise ratio; GRE, gradient recalled echo; PD TSE BB, black-blood proton density-weighted turbo spin echo; SIR, signal intensity ratio; SNR, signal-to-noise ratio.
a All values are shown as mean ± standard deviation.
b Statistically significant difference between ferritin-live and particle-live graft in SIR measured using the same pulse sequence (independent t-test, unequal variances): P < .0001.
c Statistically significant difference between ferritin-live and ferritin-dead groups in SIR and CNR measured using the same pulse sequence (independent t-test, unequal variances): P < .0001.
d Statistically significant difference between ferritin-dead and particle-dead groups in SIR measured using the same pulse sequence (independent t-test, unequal variances): P < .0001.
Live C2C12 graft labeled with iron oxide particles caused greater SI change in T2*-weighted GRE sequences: MRI signal decreased up to 80% (SIR = 0.23 ± 0.08; Figure 4A–C). The difference in SI between ferritin-tagged and particle-labeled grafts was statistically significant (P < .001). A 50% signal decrease caused by the presence of iron oxide particles was also detected in PD TSE BB images (SIR 0.48 ± 0.20).
Change in MRI Contrast After Injection of Dead Ferritin- and Particle-Labeled Cells
The injection of dead cells prelabeled with iron oxide particles also caused a strong signal void effect; graft-like areas were detected in the LV of the mouse heart with no live graft present (Figure 5A–C). The T2* signal attenuation in the dead particle-labeled C2C12 group resembled the signal void effect of the live particle-labeled grafts (SIR = 0.22 ± 0.08 and 0.23 ± 0.08, respectively, P > .05). Dark areas in the LV were also detected in PD TSE BB images (SIR 0.55 ± 0.20).

The MRI identification of the dead injected cells labeled by iron oxide particles (top) or transgenic C2C12 overexpressing ferritin (bottom). The injection of dead cells prelabeled with iron oxide particles caused strong signal void effect (red arrows); in contrast, injection of dead transgenic C2C12 genetically modified to overexpress ferritin did not cause MRI signal intensity change. A-E, Prelabeled with iron oxide particles C2C12 cells, injected dead. F-I, transgenic C2C12 ferritin-tagged, injected dead. A and F, The PD TSE black-blood MRI sequence. B and G, T2* GRE black-blood sequence with TE 5 ms. C and H, T2* GRE bright-blood sequence with TE 9 ms. D and I, Picrosirius red (collagen specific)/fast green staining to define the infarct zone. E, Positive Prussian blue staining depicting iron accumulation in myocardial tissue after injection of dead C2C12 cells prelabeled with iron oxide particles. J, Negative Prussian blue staining after injection of dead transgenic ferritin-tagged C2C12. GRE indicates gradient recalled echo; MRI, magnetic resonance imaging; LV, left ventricle; PD TSE, proton density-weighted turbo spin echo; TE, echo time.
In contrast to the injection of dead C2C12 cells prelabeled with iron oxide particles, the injection of dead transgenic C2C12 genetically modified to overexpress ferritin did not cause MRI SI changes in any slice of the LV (SIR 1.05 ± 0.06 in PD TSE BB and 0.96 ± 0.11 in T2*-weighted GRE, the difference in SIR with cells labeled by dead particles was statistically significant). All acquired images were characterized by high SNR and CNR (Table 1).
We would like to highlight the statistically significant difference in SIR and CNR between the ferritin-live and ferritin-dead groups (P < .0001). The same assessment did not show any difference in SIR and CNR between particle-live and particle-dead groups (Table 1). This emphasizes the high specificity of MRI signal hypointensity caused by ferritin overexpression to identify live transplanted cells, while artificial iron oxide particles cannot distinguish between live and dead grafts.
Histological Assessment of Cell Engraftment
Extensive infarctions were detected by Picrosirius red staining in all studied hearts (Figures 4D and J and 5D and I). Mouse skeletal myoblasts labeled with iron oxide particles, as well as transgenic cells overexpressing ferritin transplanted live to the hearts of C3H mice, survived well and differentiated to the multinucleated striated myotubes that were identified by embryonic skeletal myosin heavy-chain staining (Figure 4F, K, and M). No grafted cells were detected by histology when C2C12 cells were killed before transplantation by repeated freeze–thaw cycles.
Prussian blue staining of the heart tissues was used to identify iron-containing cells. Prussian blue-positive skeletal myotubes were detected in myocardial tissue sections of animals with transplanted live C2C12 labeled with iron oxide particles or overexpressing ferritin as well as at the injection sites of dead myoblasts labeled with particles (Figures 4E and L and 5E). No blue cells were detected in myocardia of animals after the injection of transgenic ferritin-labeled cells killed before transplantation by repeated freeze–thaw cycles (negative Prussian blue staining; Figure 5J).
Discussion
Noninvasive imaging of transplanted cell survival is important for evaluating the efficacy of cell therapy. The ability to label therapeutic cells with a magnetic resonance contrast agent has created the potential for longitudinal noninvasive tracking of transplanted cells. In this study, we evaluated 2 methods of cell labeling for MRI detection of transplanted cell survival in the infarcted heart. We compared exogenous paramagnetic iron oxide particles with genetic overexpression of the endogenous iron storage protein ferritin. In vitro tests demonstrated no effect of iron oxide particle accumulation and ferritin overexpression in C2C12 viability, proliferation, and differentiation into multinucleated myotubes. C2C12 cells transplanted live to mouse hearts formed large skeletal muscle grafts that are easily detected by MRI and histology. Both particle-labeled C2C12 and transgenic myoblasts overexpressing ferritin survived well after transplantation to infarcted mouse hearts and were visible by MRI as significant thickening of the LV wall in proton density-weighted black blood pulse sequences. Live-labeled C2C12 grafts were also detected by T2*-weighted gradient echo sequence as areas of signal hypointensity. Not surprisingly, grafts labeled by iron oxide particles exhibited a very strong effect on T2* GRE, decreasing SI up to 80%, while transgenic grafts overexpressing ferritin showed a moderate decrease in SI by 30%. Grafts labeled by iron oxide particles also exhibited decreased SI in PD TSE BB images by 50%.
We also conducted a series of experiments with injection of dead cells that were particle labeled or ferritin tagged before performing repeated freeze–thaw cycles. The same numbers of cells were injected in all 4 studied groups: live and dead ferritin-tagged cells and live and dead particles-labeled C2C12 cells. By performing dead as well as live cell injection, we were looking to answer whether the MRI signal void caused by iron accumulation persists after cell death, for example, due to phagocytosis of the iron oxide or ferritin complexes by macrophages. 46 The pattern of signal persistence 4 weeks after injection of dead cells prelabeled with iron oxide particles was similar to that in live particle-labeled grafts. In spite of the fact that dead cells do not form grafts, false-positive MRI signals depicted areas of iron oxide particle localization in the myocardium, and the size of these areas extended beyond LV boundaries (Figure 5B and C).
In contrast to particle-labeled cells, dead transgenic cells overexpressing ferritin were not detected by T2*-weighted MRI sequences. This important finding suggests that genetically based expression of natural iron storage protein ferritin has advantages for live cell imaging over the standard cell labeling approach with artificial iron oxide particles. Despite lower signal void effects on MRI from the ferritin-tagged grafts, the signal void areas represent live transplanted cells with functioning DNA. Conversely, the strong signal from iron oxide particles does not represent live cells, but only images particle location. In addition to ferritin’s advantages in detecting viable cells, iron oxide particles are diluted with each round of cell division, while the integrated ferritin transgene is expressed in each daughter cell.
Studies by other research groups also suggest that iron oxide particles are not a reliable marker to monitor transplanted stem cell location and survival. Amsalem et al showed that after engrafted cell death, enhanced MRI signals arise from cardiac macrophages that engulfed the iron oxide particles. 44 Terrovitis et al described cardiac-derived stem cells transplantation into intact rat heart. 53 Despite detectable MRI signals in the xenogeneic model, there were no surviving cells by histology, and the source of detectable MRI signal was cardiac macrophages. 44,53 In our study ferritin overexpression shows a difference in MRI signal between live and dead transplants, suggesting that genetic labeling is a better option for stem cell tracking than using exogenous iron oxide nanoparticles.
The main limitation of this study is the lack of serial imaging (only 1 MRI examination 1 month after cell transplantation); therefore, we were not able to follow transplanted cells over time. It is also unknown how quickly ferritin-based MRI signals will fade and disappear if transplanted cells die in the host tissue, or vice versa, how quickly ferritin complexes in proliferating grafts can accumulate endogenous iron so as to be detectable by noninvasive imaging. Detection of live ferritin-tagged cells by MRI can be improved by preincubation in iron-rich media prior to transplantation. In contrast to dead cells, live ferritin overexpression leads to increased iron accumulation in transplanted cells, resulting in increasingly better visualization. In this study, MRI was conducted 4 weeks after transplantation. A serial study is required to demonstrate the increased iron accumulation by ferritin and this should be demonstrated in forthcoming studies.
Conclusion
Our study demonstrated a dramatic discordance between MRI signal persistence and viability of grafted cells when labeled by iron oxide particles. Thus, use of iron oxide nanoparticles provides only particle localization rather than imaging of cell survival and engraftment. In contrast, genetically based cell tagging, such as ferritin overexpression, despite lower SI in comparison with iron oxide particles, can visualize live transplanted cells.
Footnotes
Acknowledgments
We would like to thank Jennifer Deem for performing cardiac surgery on mice, undergraduate students Merry Toh for valuable help with histological staining, and Karis Hanson for performing MRI analysis. We also thank Zachary Miller for proofreading the manuscript.
Authors’ Note
Research materials related to the article can be obtained by e-mailing the corresponding author.
Declaration of Conflicting Interests
The author(s) declared no potential conflicts of interest with respect to the research, authorship, and/or publication of this article.
Funding
The author(s) disclosed receipt of the following financial support for the research, authorship and/or publication of this article: This work was supported by the National Institutes of Health (grant numbers RC1 HL099230 [CY and CEM], R01 HL64387 [CEM], P01 HL094374 [CEM], and R01 HL084642 [CEM]) and the University of Washington Mouse Metabolic Phenotyping Center (grant number U54 DK076126).