
Abstract
Angiotensin-converting enzyme 2 (ACE2) is present in the heart and thought to exert protective functions. We conducted studies in ACE2 deficient mice to determine whether enzyme loss would exacerbate the cardiac and vascular pathological responses to chronic subcutaneous (sc) angiotensin II (Ang II) infusion. Eight-week-old male ACE2 knockout (KO) and wild type (WT) mice were infused with Ang II (1000 ng/kg per min, 4 weeks) using mini-osmotic pumps. Blood pressure (radiotelemetry), cardiac function (echocardiography, echo), cardiac/aortic structure (histology, collagen, and oxidative stress), and vascular inflammation were examined. Before Ang II infusion, ACE2 KO mice showed unaltered cardiac function and blood pressure. After 4 weeks of Ang II infusion, the mean arterial pressure (MAP) increased from 96 ± 2 to 136 ± 17 mm Hg (∼40%) in WT and from 104 ± 5 to 141 ± 13 mm Hg (∼ 35%) in ACE2 KO. While there were no differences in MAP between groups, the ACE2 KO responded differently to the hypertensive stimulus. Echo analysis revealed severe myocardial dysfunction in Ang II-infused ACE2 KO (Ang ACE2 KO). Ejection fraction was lower (39% versus 50%) as was fractional shortening (27% versus 38%) in ACE2 KO versus WT, respectively. Cardiac dysfunction was associated with hypertrophic cardiomyopathy shown by increased left-ventricular wall thickness, average cardiomyocyte cross-sectional area, and heart weight/body weight ratio. Collagen staining in the myocardium and aorta revealed increased collagen in Ang ACE2 KO, suggestive of remodeling. Results also showed enhanced oxidative stress in the myocardium and aorta of Ang ACE2 KO. There was a 3-fold elevation in macrophage inflammatory protein 1α (MIP 1α) in the aorta of ACE2 KO. Studies in the ACE2 KO model reveal the importance of ACE2 in the maladaptive cardiac and aortic responses to Ang II stimulation, seen as enhanced remodeling using physiological, structural, and biochemical markers. Results document a cardio- and vascular-protective role of ACE2 under pathological conditions.
Introduction
Activation of the renin–angiotensin system (RAS) is a well-known driving force in the progression of cardiovascular disease (CVD) and associated target organ damage. Angiotensin-converting enzyme 2 (ACE2) is a relatively new member of the RAS system, an additional means for processing angiotensin II (Ang II).1,2 ACE2’s main action is to shuttle Ang II metabolism toward Ang (1-7) formation. The catalytic efficiency of ACE2 is 400-fold higher with Ang II as a substrate compared to Ang I. 3 Angiotensin (1-7), the metabolic product of ACE2-mediated Ang II conversion, counteracts the harmful effects of Ang II, as related to vasoconstriction, cell growth, and cardiac remodeling and hypertrophy.4,5 Angiotensin-converting enzyme 2 is believed to play a pivotal role in CVD progression as a negative regulator of the RAS family. The fact that ACE2 was first cloned from the left ventricle of failing hearts 1 along with its predominant expression in the heart 2 suggests that ACE2 plays a crucial role in regulating cardiac function.
Studies have been conducted in ACE2 knockout (KO)6–8 and overexpressing animals9,10 with the goal of exploring the functional role of ACE2 in the cardiovascular (CV) system. Initially, it was reported that ACE2 null mice displayed impaired cardiac contractile function, as demonstrated by a decrease in ventricular fractional shortening (FS%). 6 Despite variations in the CV phenotype of ACE2 null mice observed in later studies,7,8,11 none of the studies negate the fact that ACE2 is a key player in Ang II metabolism 12 or that loss of ACE2 aggravates heart failure. 13 Assessment of ACE2 protein levels in the failing heart showed an elevation in the damaged myocardium in humans 14 and mice 15 . Studies in patients with end-stage heart failure showed that cardiac ACE2 messenger RNA (mRNA) was positively correlated with left ventricular (LV) diameter. 16 The activation of ACE2 in heart failure and the subsequent increase in Ang (1-7) may function protectively to limit the adverse effects of elevated Ang II. 17 This is supported by studies in which administration of recombinant ACE2 exerted a beneficial effect against Ang II-induced cardiac hypertrophy and fibrosis.18,19 Collectively, findings show that ACE2 is upregulated in the face of CV pathophysiological conditions, while decreased ACE2 is associated with maladaptive cardiac remodeling.
Angiotensin II is essential in the regulation of fluid balance and blood pressure. Long-term Ang II infusion is often used as an experimental model for essential hypertension, resulting in a gradual and sustained increase in BP along with multiple organ pathologies.20,21 With regard to Ang II effects in the heart, overexpression of cardiac Ang II is associated with LV hypertrophy and systolic and diastolic dysfunction, effects thought to be independent of pressure overload.22,23 In addition, it has been documented that cardiac myocytes undergo hypertrophy as well as fibrosis associated with collagen production in response to Ang II given either in vivo 4 or in vitro. 24
Cardiovascular remodeling is a pathophysiological feature which results from compensatory mechanisms triggered by changes in hemodynamic function. It includes structural maladaptation within the myocardium and blood vessels. Cardiac remodeling encompasses changes in LV geometry, such as concentric hypertrophy, as well as changes in cardiomyocyte morphology, such as size and level of extracellular matrix deposition. These mechanisms are directed initially to maintain cardiac output. 25 The ultrastructural modifications are mediated mainly by activation of RAS, 26 neurohormones, 25 and oxidative stress. 27 Vascular remodeling, particularly in the aorta, refers to changes in the structure of the arterial wall, manifested by increased arterial stiffness and loss of compliance, as well as increased inflammatory response, effects that can be mediated by Ang II. 28 Angiotensin-converting enzyme inhibitors and angiotensin receptor blockers (ARBs) have shown their efficacy in abrogating CV remodeling in response to pathological conditions.28,29
Vascular wall inflammation has been associated with CV pathologies and is mediated mainly by Ang II. 30,31 This response affects major arteries and accelerates CV disease progression. In later stages, it results in atherosclerosis. It is characterized by an increase in local cytokine expression, increase in infiltration of inflammatory markers such as macrophage inflammatory protein 1α (MIP- 1α), and the production of reactive oxygen species (ROS). Pharmacological inhibition of Ang II is a main principle for the inhibition of vascular inflammation and the associated oxidative stress. 32 Previous studies showed that loss of ACE2 enhances Ang II-mediated inflammatory cytokine gene expression in aorta. 33
The objective of this study is to use the ACE2-deficient animal model to investigate the role of ACE2 in the CV pathologies mediated by chronic Ang II stimulation. Cardiac structure and function were evaluated by echo, blood pressure by telemetry, and ultrastructural parameters using histochemical staining coupled with computerized morphometric techniques. Structural features and inflammation of aorta, a major transport vessel were also investigated. Results document that loss of ACE2 accentuated the cardiac and aortic remodeling associated with high-dose Ang II infusion.
Methods
Animals
Mice (8 weeks old male wild type (WT), and ACE2 KO, n = 7-8 per group) with C57Bl/6 background were housed at 22°C under a 12-hour light/12-hour dark cycle with ad libitum access to tap water and standard mouse chow (29% protein, 17% fat, 54% carbohydrate, diet 8640; Teklad Animal Diets, Harlan Labs, Indianapolis, IN). The ACE2 KO male and ACE2 heterozygous female breeding pairs were provided by Drs Thomas Coffman and Susan Gurley (Duke University). Mice were bred and genotyped for ACE2 gene expression. Generation of the C57Bl/6 ACE2 KO strain was described previously. 8 The absence of ACE2 protein in ACE2 KO mice was confirmed by western blot. 8
Experimental Protocol
Mice were anesthetized and telemetric probes were inserted into the carotid artery for blood pressure (BP) recording. After a minimum of 1 week recovery, mice were infused with Ang II (1000 ng/kg per min) for 4 weeks using Alzet osmotic pumps (ALZA, Co, Cupertino, California). Cardiac function and mean arterial pressure (MAP) were assessed at baseline and after 4 weeks of Ang II infusion by echo and telemetry, respectively. At the end of the peptide infusion, mice were decapitated with collection of hearts and aortas, frozen in liquid nitrogen or fixed in 4% paraformaldehyde. All experimental protocols were approved by the Wright State University (WSU) Animal Care and Use Committee. Fixed heart and aorta were sent to a commercial laboratory (AML Laboratories, Inc, Baltimore, Maryland) for paraffin embedding, sectioning, and Masson's Trichrome staining.
Surgical Insertion of Radiotelemetric Probes
Mice were anesthetized with ketamine/xylazine IM (75 mg/kg ketamine and 7.5 mg/kg xylazine; Butler Co, Columbus, Ohio). An incision was made from the submandibular area to the sternum. A radiotelemetric probe, model TA11PA-C20 (Data Sciences International, St Paul, Minnesota) was inserted into the left carotid artery and advanced into the aortic arch. The transmitter was inserted in a pouch made just below the skin on the right flank. Carprofene (5 mg/kg; Sigma-Aldrich, St Louis, Missouri) was administered subcutaneously (sc) for pain management immediately after surgery and at 24 hours postsurgery. Animals were allowed at least 1 week of recovery before conducting experiments.
Angiotensin II Infusion
Ang II (Bachem Inc, Torrance, California) was dissolved in sterile saline and loaded into osmotic pumps (model 1004, ALZA, Co). The Ang II dose was 1000 ng/kg per min (4 weeks). For pump insertion, mice were anesthetized with isoflurane (3% induction box, 1.5% maintenance using a nose cone). The upper back was shaved and cleaned with betadine/70% ethanol. A small transverse incision was made between the scapulae and the pump was inserted in an sc pocket on the left lower flank. Carprofen (5 mg/kg) was injected sc for analgesia as described.
Measurement of Blood Pressure
Radiotelemetry was used to measure BP continuously (500 Hz) for 24 hours at baseline and after 4 weeks’ Ang II infusion. The analysis system used was the standard Dataquest A.R.T. system (Data Sciences International).
Echocardiography
Echo measurements were performed using a Siemens ACUSON Sequoia 512 ultrasound system (Siemens Medical Solutions USA, Inc, Malvern, Pennsylvania) with an ACUSON 15 megahertz transducer (model 15L8, Siemens Medical Solutions USA). 35 Mice were anesthetized with 3% isoflurane in oxygen (1 L/min; Surgivet Anesco Isotec 4). Anesthesia was maintained with 1.5% isoflurane using a nose cone. Mice were placed in a supine position and body temperature was maintained using a heating pad. Chest hair was removed with an electric shaver and a commercial hair removal cream (Nair, Church & Dwight CO, Inc, Township, New Jersey). The plate was tilted 60° anteriorostrally from the vertical axis. Prewarmed ultrasound transmission gel (Aquasonic100, Parker Laboratories Inc, Fairfield, New Jersey) was applied to the chest. The transducer was positioned at a 90° angle to the chest, which proved to be the best position for optimal recording.
Initially, 2-dimensional (2-D) video clips were recorded during the parasternal long-axis view. The short-axis view was then obtained and 2-D video clips and 2-D guided M-mode (2-D M-mode) images of the interior LV wall were recorded. Images were standardized according to the plane of papillary muscles. The ejection fraction (EF%) was calculated based on the end-systolic and end-diastolic volumes measurement by the integrative function using the modified Simpson’s formula of areas along with major axes (calculated by the echo). During the parasternal short axis 2-D M-mode, the LV end-systolic diameter (LVESd) and end-diastolic diameters (LVEDd) as well as septal wall thickness (SWT) and posterior wall thickness (PWT) were measured. Fractional shortening (FS%) was calculated using the formula FS% = [(LVEDd−LVESd)/LVEDd] × 100. Whereas the relative wall thickness (RWT) was calculated using the formula RWT = [(SWT+ PWT)/LVEDd]. Mitral valve flow was assessed during pulse wave Doppler (PWD) mode. Images were obtained by tilting the mice backward (posteriocaudally) and directing the probe upward so that the probe is orthogonal with the apex of the heart. 36 Isoflurane level was increased up to 2% in order to slow down the velocity of the mitral valve. Isovolumetric contraction time (IVCT) and isovolumetric relaxation time (IVRT) were also measured. Finally, E-wave and A-wave velocities were measured and E/A ratio was calculated as a measure of diastolic function.
Hematoxylin and Eosin Staining and Cardiomyocyte Quantification
Paraformaldehyde-fixed, paraffin-embedded heart sections (5 µm) were stained with hematoxylin and eosin (H&E) using standard procedures. Light microscopic photos were taken at ×20, separate and random locations of the LV wall. Cell size was measured using the Metamorph 7.6.3 image analysis software (Molecular Device, Inc, Sunnyvale, California). The threshold selection tool was used in combination with the Integrated Morphometry Analysis (IMA) toolkit. Briefly, 2 thresholds were established, one for the nuclei and another for cardiomyocytes. Data were averaged and cell size was computed as total tissue area (pixels) per nucleus.
Picrosirius Red Staining and Quantification
Paraformaldehye-fixed, paraffin-embedded heart and aorta sections (5 µm) were stained with Picrosirius Red for visualization of collagen types I and III. This staining procedure was performed using a Weigert’s iron hematoxylin staining kit (ENG Scientific, Inc, Clifton, New Jersey). After staining for 8 minutes, the slides were washed with tap water and stained with a Picrosirius Red solution containing 5 gm of Direct Red 80 (Sigma-Aldrich) and 500 mL of saturated picric acid solution (Sigma-Aldrich).
Light microscopic photos were taken (×2.5) using polarizing light. The advantage of polarizing light is its high sensitivity that allows for specific detection of the thin collagen fibers. This method excludes detection of other possible birefringent fibers. The light source transmitter was connected to the microscope’s external port. Polarization was done using a specific polarizer and analyzer that were set at 90° to each other in order to restrict light refraction. A section of control heart was used to calibrate light intensity, plane of polarization, and microscope/camera settings. Once the settings were adjusted, they remained constant for all subsequent imaging sessions. Images were taken to include the whole heart section in 1 image. Quantification was done using Metamorph 7.6.3 with the threshold selection tool as described previously. The threshold was established by adjusting the saturation and intensity of the image to the appropriate level so that it selectively traces the collagen fibers. Image sizes were normalized to 700 pixel width and the threshold was applied to selectively measure the collagen. Total heart area was measured using trace region selection tool. The collagen volume fraction (CVF%) was computed as a percentage to the total section area. Quantification of aorta was done using the same methods as applied to heart.
Morphometry
Images of sections of the Picrosirius Red stained aorta from both strains were taken at ×2.5. Images were normalized to the same pixels. Quantification was done by Metamorph 7.6.3 image analysis software. The luminal areas were traced using the trace region selection tool and the selected areas were measured (Pixels).
Dihydroethidium Fluorescence for Reactive Oxygen Species
Dihydroethidium (DHE; Sigma-Aldrich) was used to evaluate the in situ superoxide (O2 −) levels within the heart and aorta. Dihydroethidium is freely permeable and after entry it is oxidized to fluorescent ethidium bromide (EB) in the presence of O2 −. Ethidium bromide is a potent mutagen and it is trapped intracellularly by intercalation into the DNA. Hearts were quickly removed and washed in cold PBS. A 3-mm transverse piece of tissue was trimmed from the left ventricle and frozen in liquid nitrogen. Frozen myocardium tissue was sectioned (30 µm) and thaw mounted onto prechilled gel-coated slides. Dihydroethidium, 1 mmol/L (Sigma-Aldrich) in DMSO (Fisher Scientific, Fair Lawn, New Jersey) was prepared as a stock solution. It was diluted to 2 µmol/L in acetone. In order to confirm that DHE will only stain the superoxide anion and not other reactive oxygen species (ROS), 10 mmol/L of freshly prepared sodium diethyldithiocarbamate (Sigma-Aldrich) was added to inhibit intracellular and extracellular superoxide dismutase (SOD) activity. Sections were incubated with the staining solution at 37°C for 30 minutes. Sections were washed with PBS and cover-slipped using VECTASTIN hard-set (Vector Laboratories, Inc, Burlingame, California). Quantification of the fluorescence was done using Metamorph 7.6.3. Areas (400 pixel) within the myocardium and aorta were selected and the threshold was determined by adjusting the intensity level to selectively trace ROS within the myocardium. Regions were normalized by the total selected area.
Cytokine Analysis
The Bio-Rad Bio-Plex 200 system (Bio-Rad Laboratories, Hercules, California) was used for analysis of cytokine inflammatory markers in aortic extracts. The system uses a multiplex kit for 23 different cytokines. The assay protocol followed the instructions provided by the company. A section of aorta (∼l cm) was homogenized in 250 µL of homogenization buffer 1× PBS containing a protease inhibitor cocktail (Roche applied science, Indianapolis, Indiana). The protein concentration was determined using a Bradford assay (Bio-Rad laboratories); 50 µL of sample was incubated with magnetic beads in the 96-well plate. The mixture was washed with Bio-Plex 200 wash buffer on a magnetic Bio-Rad plate washer. A multiplexed standard curve was generated for each of the cytokines. The data were normalized to protein concentration. The plate was run on the Bio-Plex 200 machine and data exported to an excel spreadsheet for further analysis. Cytokine concentration was expressed as ρg/mL.
Statistical Analysis
All data are expressed as mean ± standard error of the mean (SEM). Data were analyzed using STATISTICA7.1 (StatSoft Inc, Tulsa, Oklahoma). Significance was achieved when P < .05. Echo and cytokine data were analyzed using repeated measure and Factorial 2-way analysis of variance (ANOVA), respectively. Modified Tukey post hoc test was used to compare means. Cardiomyocyte size, collagen, and ROS were evaluated using MetaMorph 7.6.3 (Molecular Device, Inc) image analysis software as described. Unpaired student t test was performed to compare groups.
Results
Baseline Cardiac Function as Measured With Echo
Echo analysis showed no differences in baseline cardiac function between WT and ACE2 KO. 2D M-Mode echo analysis shows similar FS% in ACE2 KO as compared to WT (Figure 1 and Table 1). Results from the long-axis 2-D view show a slight but non-significant increase in LVESa in ACE2 KO (Table 1). There was no difference in the calculated EF%. The PWD analysis suggested normal transmitral valve function with no differences between strains.

Baseline echo images of LV in WT (A) and ACE2 KO (B). Representative 2-D M-mode images of LV show similar dimensions in the groups. Parasternal short axis 2-D images show similar LV end-systolic area (LVESa) in WT (C) and ACE2 KO (D). Transmitral pulse wave Doppler mode shows similar mitral valve function in WT (E) and ACE2 KO (F). LV indicates left ventricular; WT, wild type; ACE2 KO, angiotensin-converting enzyme 2 knockout; 2-D, 2-dimensional.
Detailed Echo Data Analysis of Cardiac Function in the WT and ACE2 KO at Baseline and After 4 Weeks of Ang II Stimulation (1000 ng/kg per min, 4 weeks).a

Abbreviations: ANOVA, analysis of variance; LVEDa, left ventricular end-diastolic area; LVEDd, left ventricular end-diastolic diameter; LVESa, left ventricular end-systolic area; LVESd, left ventricular end-systolic diameter; FS%, fractional shortening; SWT, septal wall thickness; PWT, posterior wall thickness; RWT, relative wall thickness; EF%, ejection fraction; E-wave, peak early transmitral inflow mitral E velocity; A-wave, transmitral inflow velocity due to atrial contraction. IVCT, isovolumetric contraction time; IVRT, isovolumetric relaxation time.
aData were analyzed using repeated measure 2-way ANOVA. Modified Tukey post hoc test was used to compare means.
b P < .05 versus ANG II WT.
c P< .05 versus baseline.
Angiotensin II-induced Cardiovascular Dysfunction in ACE2 KO
The effects of chronic high-dose Ang II infusion (1000 ng/kg per min, 28 days) were examined using echo and radiotelemetry. Results showed impaired cardiac function in Ang ACE2 KO mice as compared to Ang WT (Figure 2). The Ang II produced a marked reduction in FS% in ACE2 KO, from 40% to 27% (baseline versus Ang II; Figure 3A). The LVEDd was comparable between groups (Table 1). However, LVESd and LVESa were significantly increased in Ang ACE2 KO as compared to Ang WT (Figure 2). The end result was a reduction in EF% of almost 31% in Ang ACE2 KO as compared to 12% (NS) in Ang WT (Figure 3B). No difference was detected in the HR during echo assessment (Table 2). Results from the PWD mode showed a lower E/A ratio in Ang ACE2 KO, which suggests diastolic dysfunction. There was no difference in baseline MAP between strains (Table 2). The Ang II infusion increased MAP with equal pressor responses in the groups (maximal increase of ∼40 mm Hg; Table 2). This points against pressure overload as a mediator in exacerbating the cardiac dysfunction in the Ang ACE2 KO. Results suggest a cardioprotective role of ACE2 against the systolic and diastolic dysfunction induced by high-dose Ang II infusion.
Mean Arterial Pressure (MAP) and Heart Rate (HR) at Baseline and Post Ang II Infusion (1000 ng/kg per min, 4 weeks) Obtained Using RadioTelemetry.a
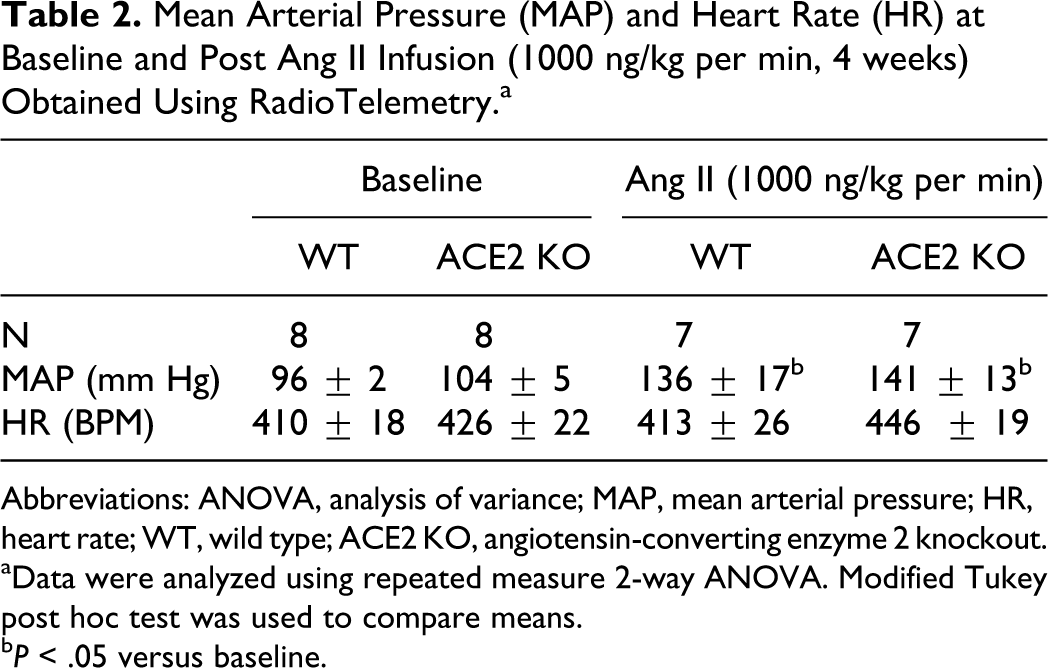
Abbreviations: ANOVA, analysis of variance; MAP, mean arterial pressure; HR, heart rate; WT, wild type; ACE2 KO, angiotensin-converting enzyme 2 knockout.
aData were analyzed using repeated measure 2-way ANOVA. Modified Tukey post hoc test was used to compare means.
b P< .05 versus baseline.
Cytokine Assay in Aortas From WT and ACE2 KO at the Baseline and After Ang II Infusion (1000 ng/kg per min, 4 weeks).a
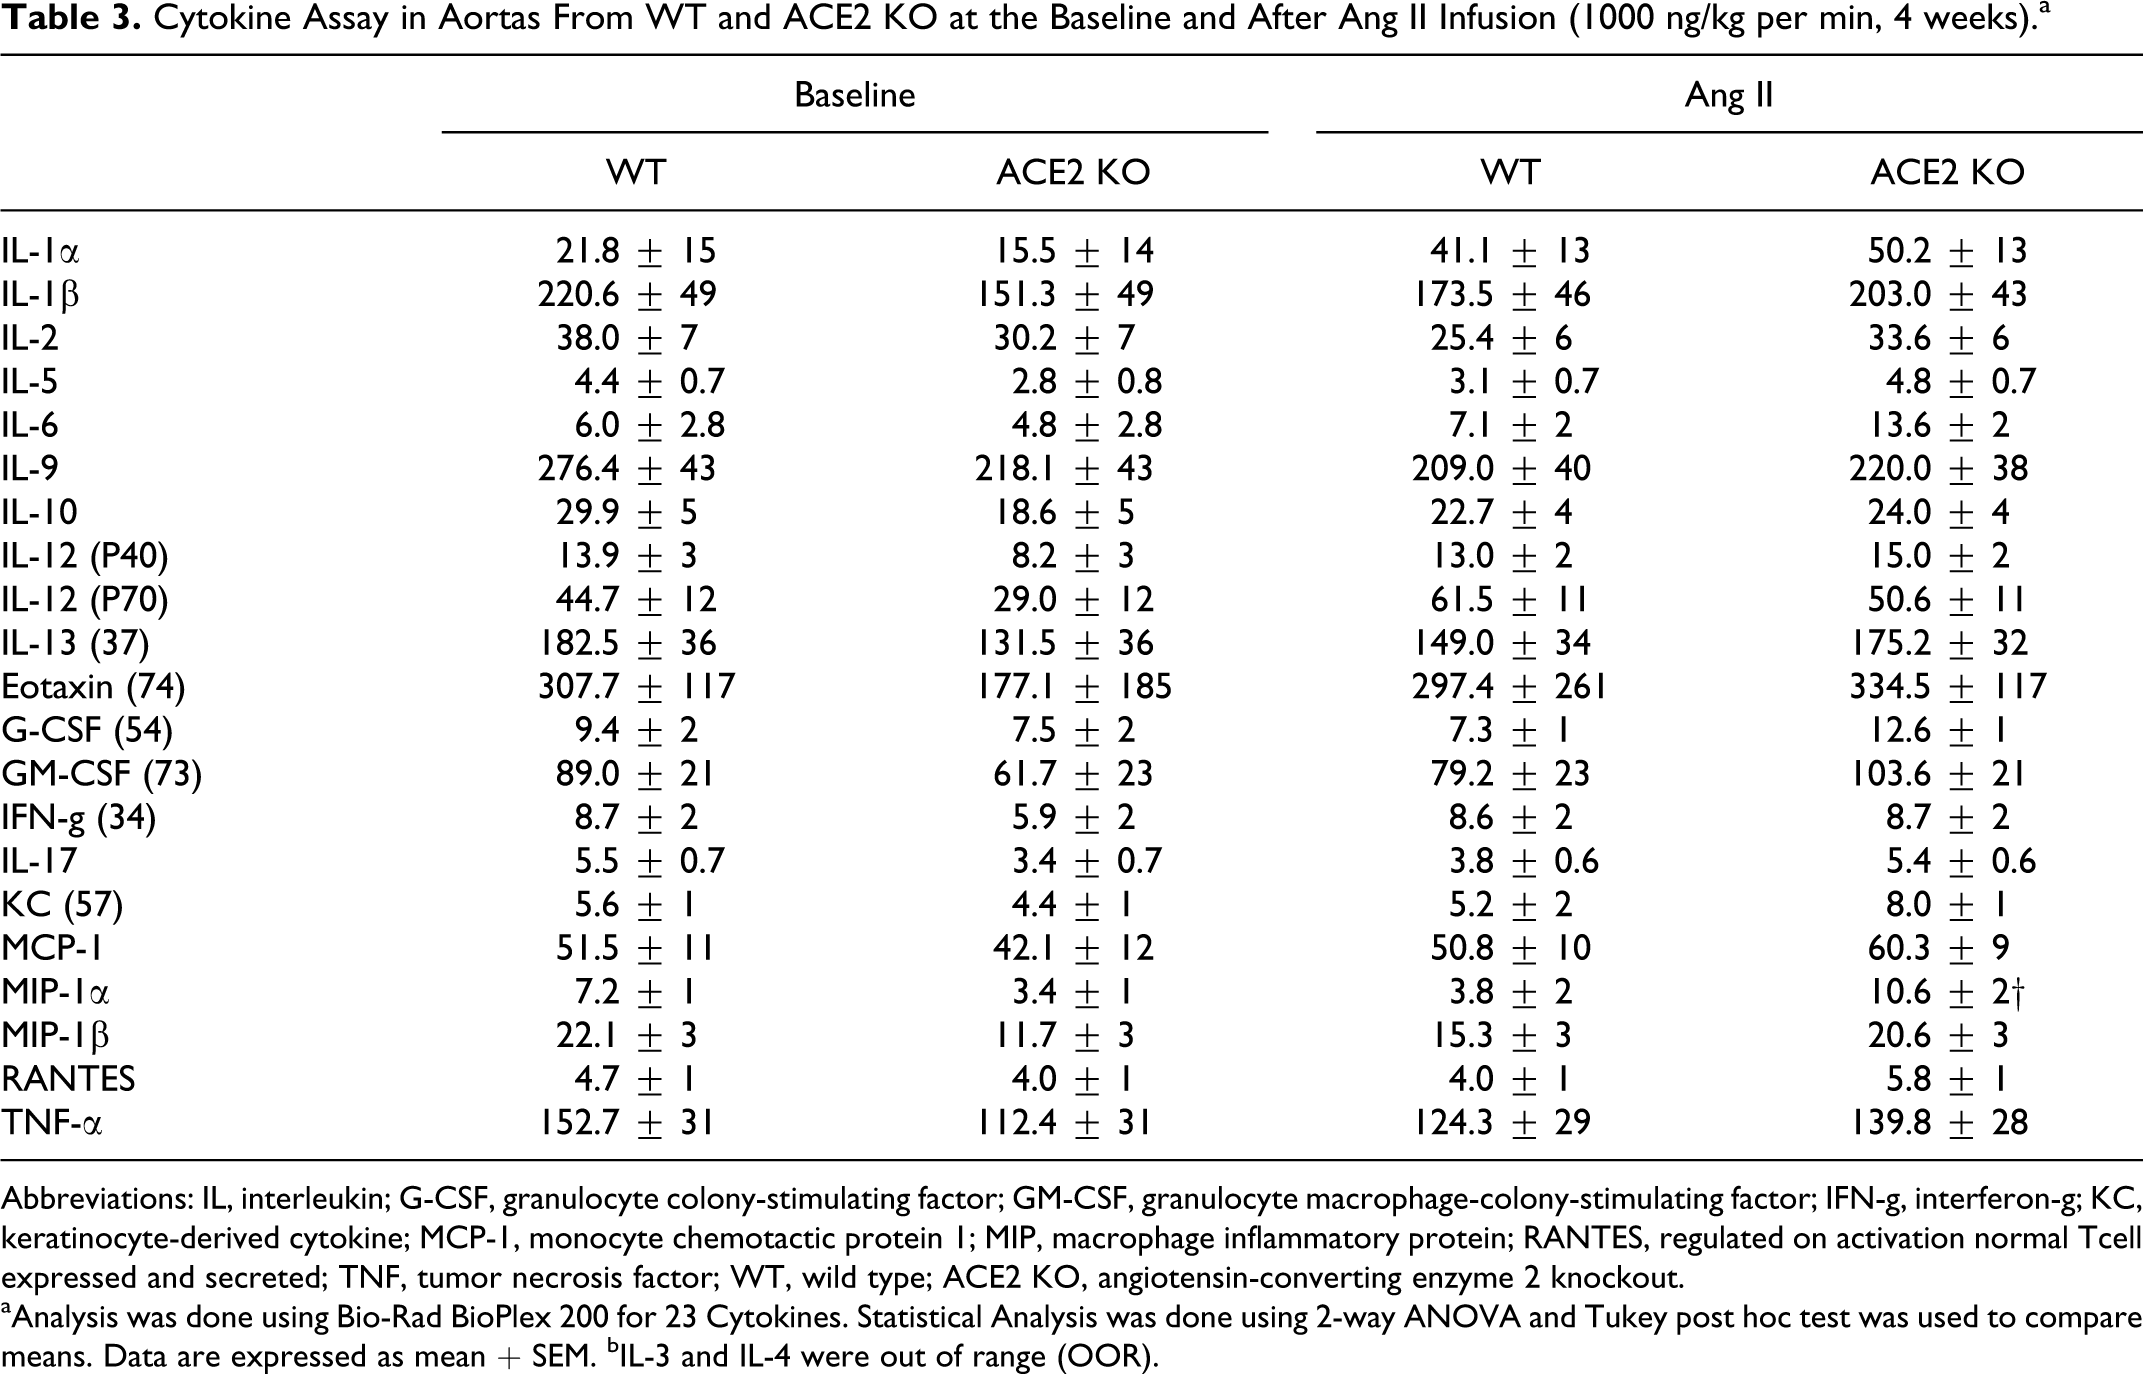
Abbreviations: IL, interleukin; G-CSF, granulocyte colony-stimulating factor; GM-CSF, granulocyte macrophage-colony-stimulating factor; IFN-g, interferon-g; KC, keratinocyte-derived cytokine; MCP-1, monocyte chemotactic protein 1; MIP, macrophage inflammatory protein; RANTES, regulated on activation normal Tcell expressed and secreted; TNF, tumor necrosis factor; WT, wild type; ACE2 KO, angiotensin-converting enzyme 2 knockout.
aAnalysis was done using Bio-Rad BioPlex 200 for 23 Cytokines. Statistical Analysis was done using 2-way ANOVA and Tukey post hoc test was used to compare means. Data are expressed as mean + SEM. bIL-3 and IL-4 were out of range (OOR).
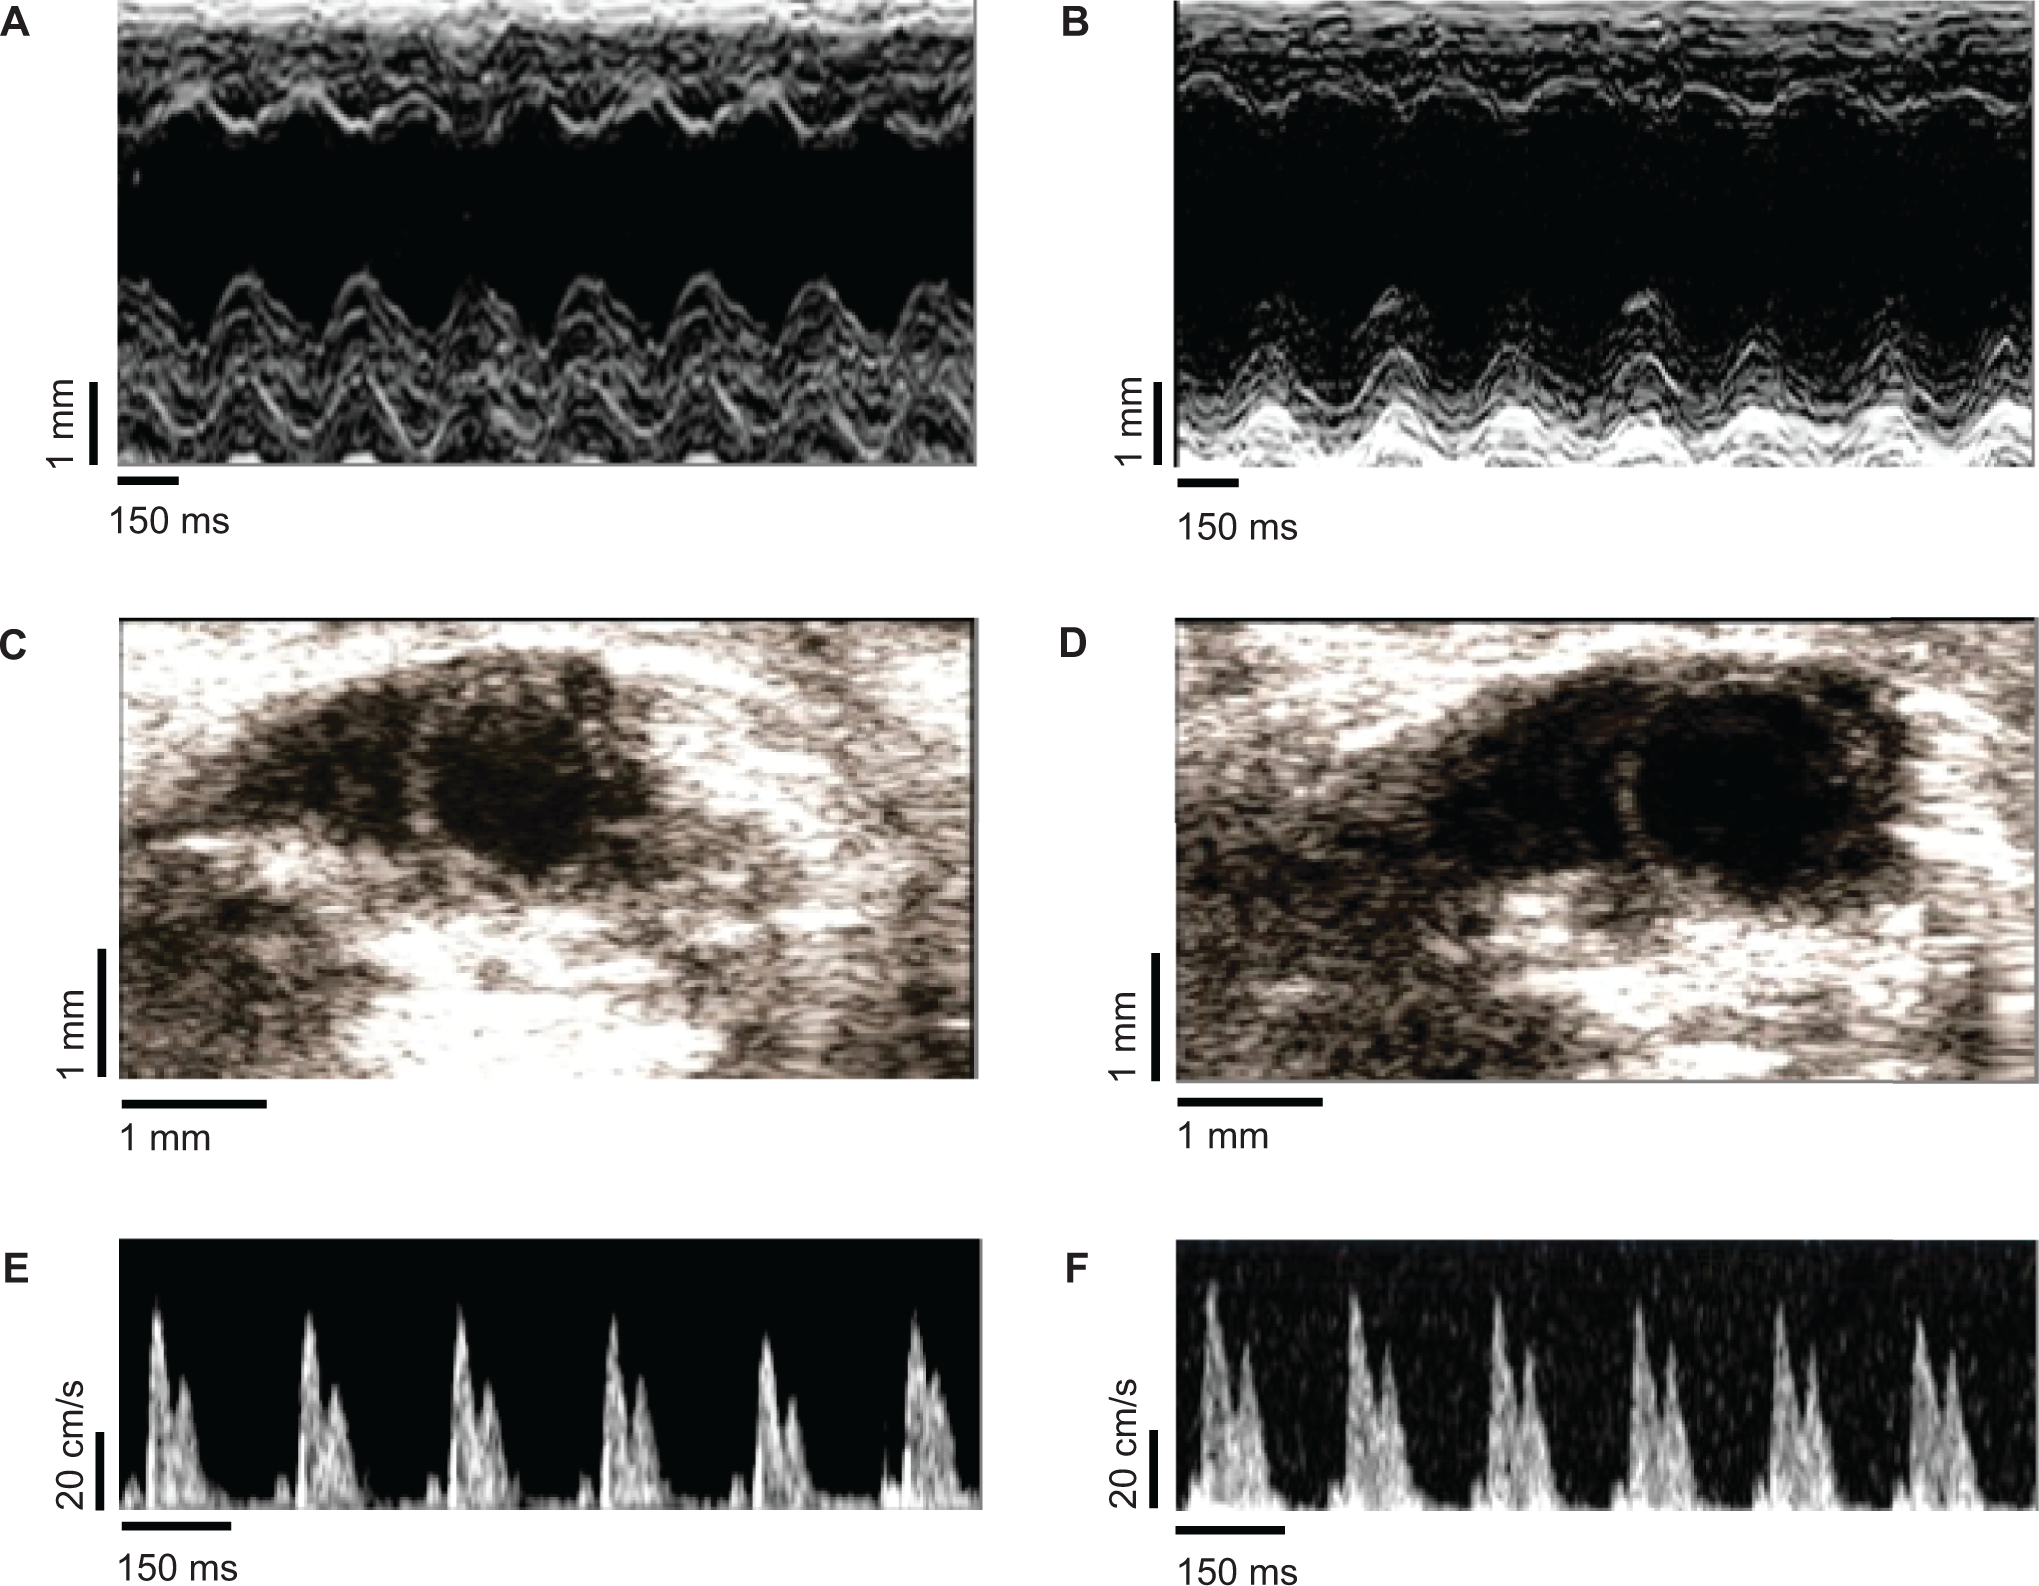
Echo assessments after 4 weeks of Ang II infusion (1000 ng/kg per min, 4 weeks). Representative 2-D M-mode images of LV show an increase in LVESd in Ang ACE2 KO (B) as compared to Ang WT (A). Parasternal short axis 2-D images show an exacerbated LV end-systolic area (LVESa) in Ang ACE2 KO (D) as compared to II Ang WT (C). Transmitral pulse wave Doppler mode shows a decrease in E-wave velocity in Ang WT (E) and Ang ACE2 KO (F) compared to their corresponding baseline values. LV indicates left ventricular; LVESd, LV end-diastolic area; WT, wild type; ACE2 KO, angiotensin-converting enzyme 2 knockout; 2-D, 2-dimensional.

Percentage of fractional shortening (FS%) at baseline and after 4 weeks of Ang II infusion (1000 ng/kg per min, 4 weeks) (A). Percentage of ejection fraction (EF%) at baseline and after 4 weeks of Ang II infusion (B). Data were analyzed using repeated measure 2-way ANOVA. Modified Tukey post hoc test was used to compare means; *P< .05 versus WT; † P< .05 versus baseline.
Increased Cardiomyocyte Size in Ang ACE2 KO
Cardiac cell size was measured in H&E stained tissue using computerized analytical methods. Microscopic examination of the LV cardiomyocytes showed cellular expansion with shrinkage in the intercellular space in the Ang ACE2 KO (Figure 4A and 4B). Cell size quantitation within the LV wall of Ang ACE2 KO showed a larger cardiomyocyte size than in Ang WT (Figure 4C). This indicates cardiac cellular hypertrophy in the Ang ACE2 KO. Data were compatible with cardiac hypertrophy observed by measuring heart to body weight ratio which was increased in Ang ACE2 KO (Figure 4D). No differences were seen in the number of counted cells within the selected areas. Collectively, data suggests a defense mechanism of ACE2 against Ang II-induced hypertrophic cardiomyopathy.
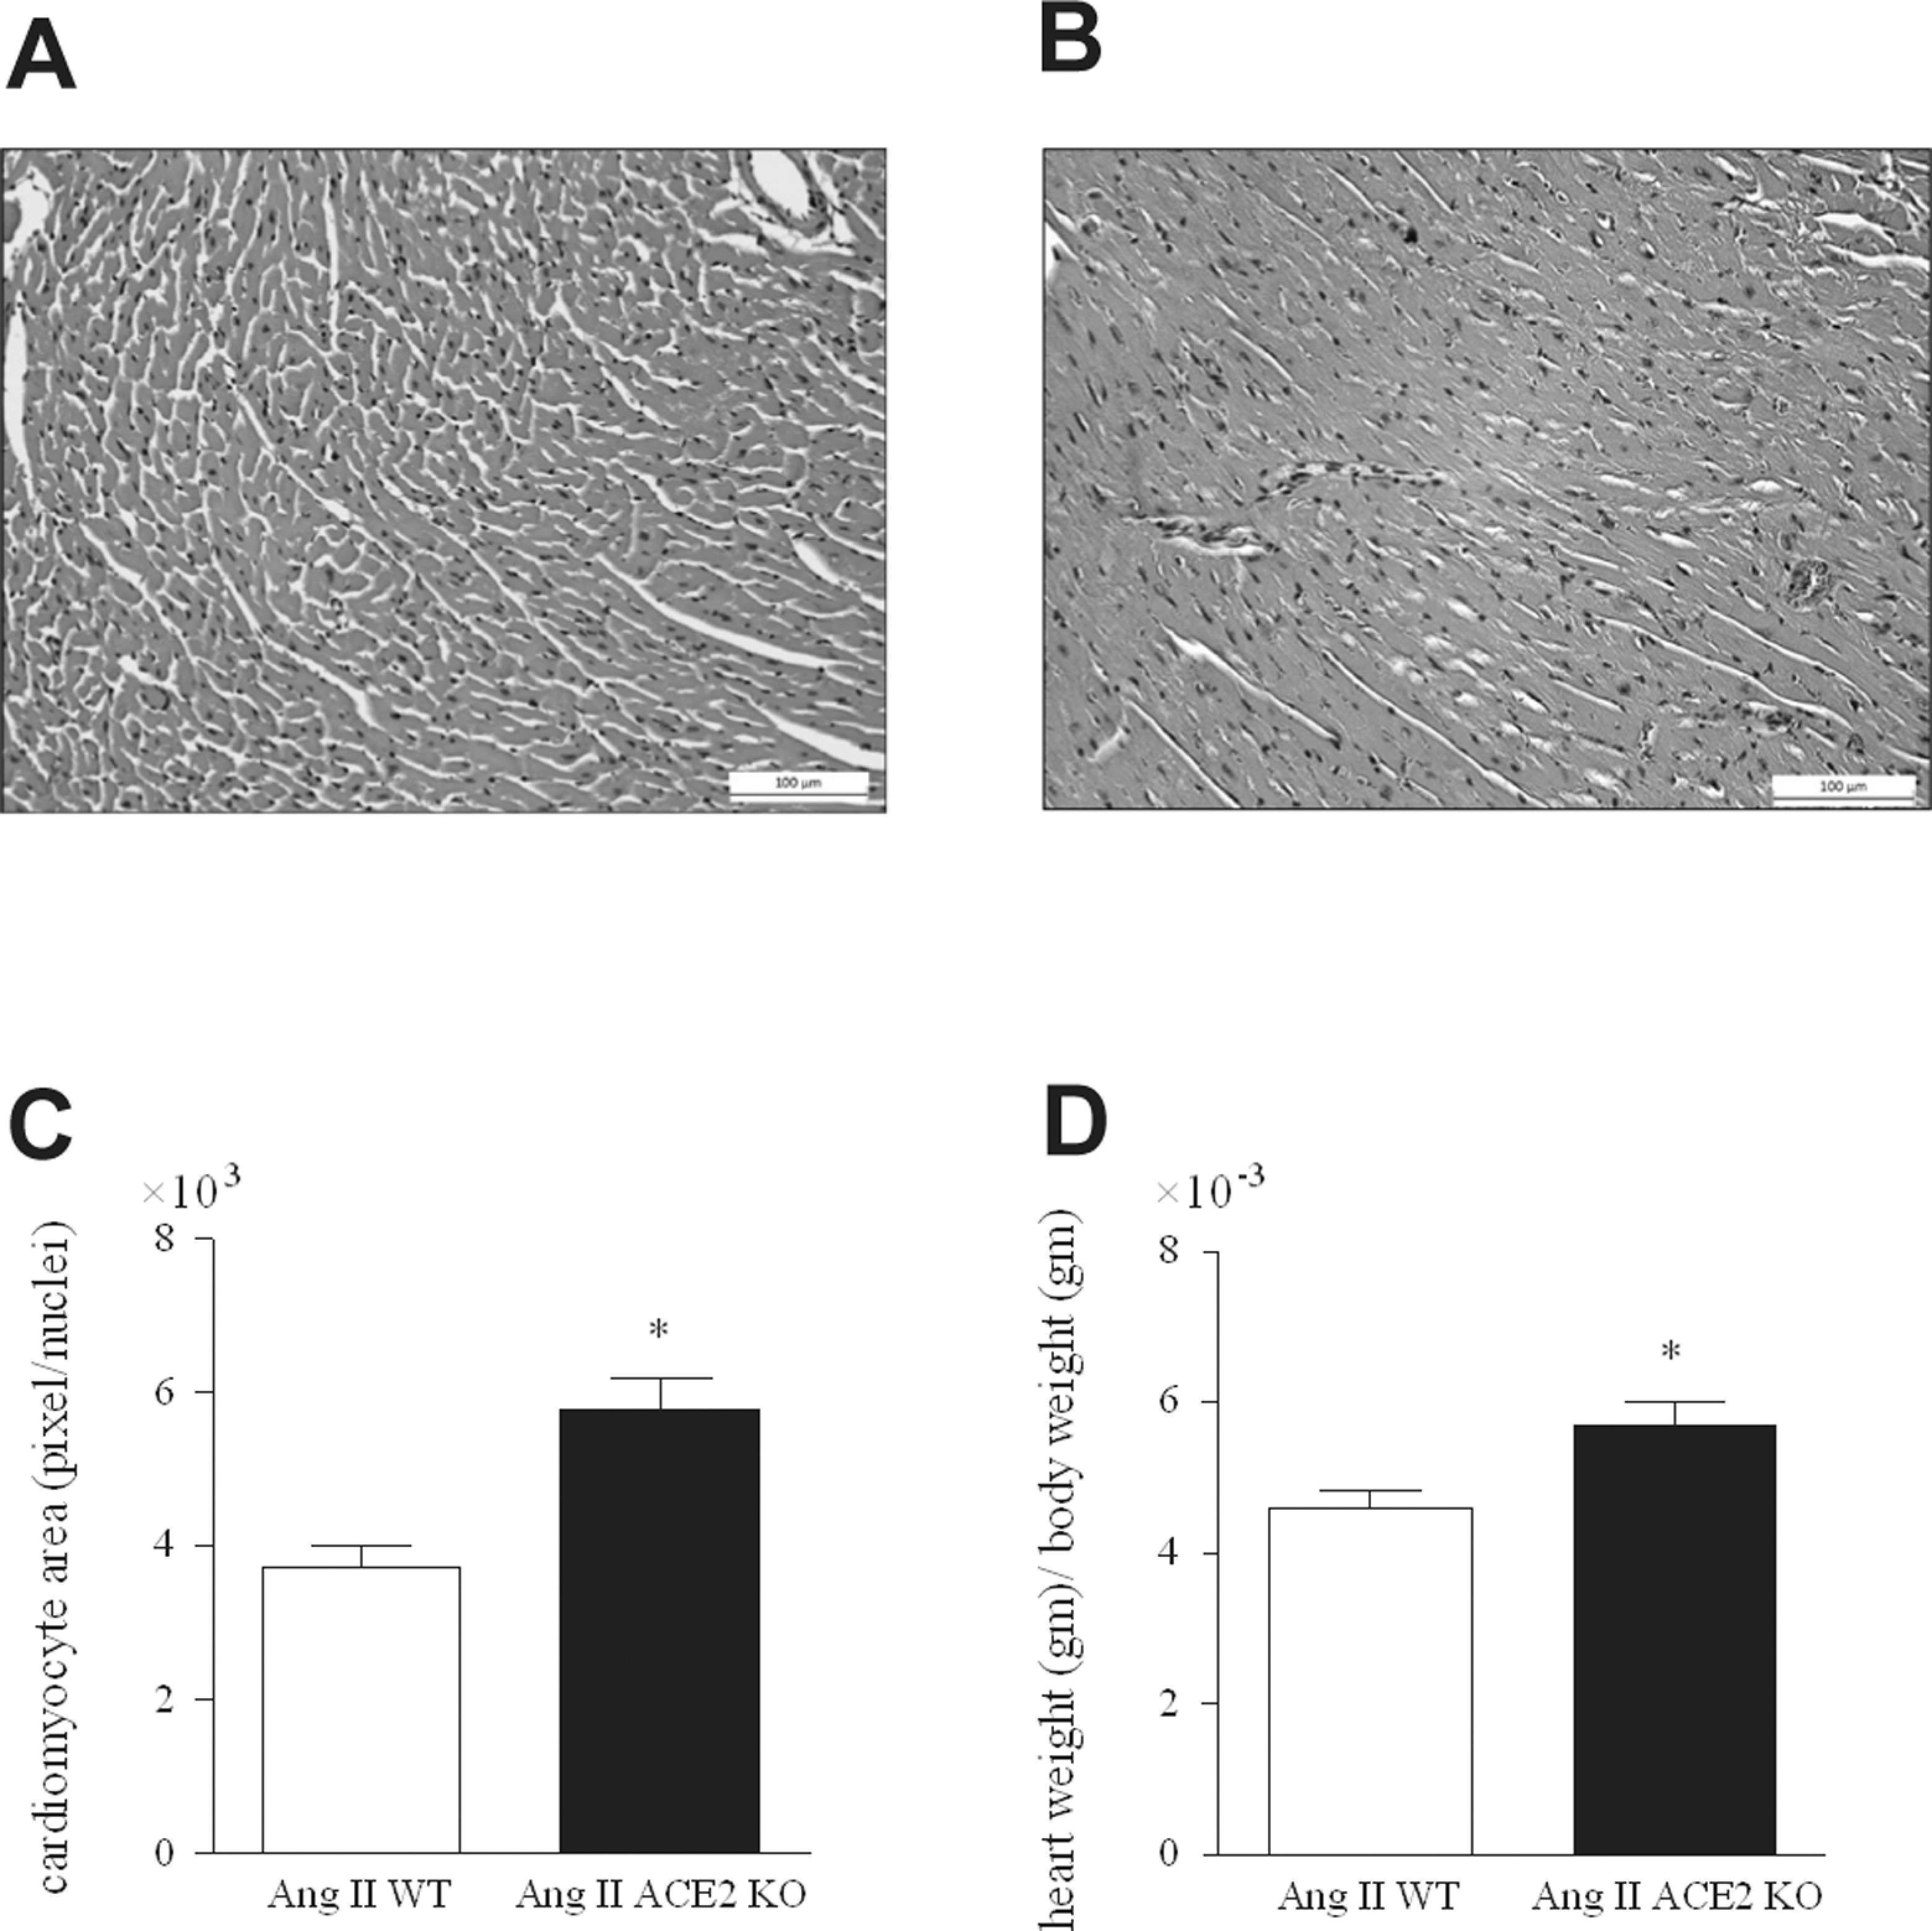
Hematoxylin and eosin (H&E) stained sections within LV wall of Ang WT (A) and Ang ACE2 KO (B). Gray scale images were taken at (×20) magnification. Image software was used to normalize and threshold the images as discussed in the methods section. Cardiomyocyte size was computed as (pixel/nuclei; C). Cell size quantitation shows larger cardiomyocytes in the LV in Ang ACE2 KO versus Ang WT. Heart weight /body weight for the WT and ACE2 KO mice after Ang II infusion (D). Unpaired student t test; *P < .05 versus Ang WT. LV indicates left ventricular; WT, wild type; ACE2 KO, angiotensin-converting enzyme 2 knockout.
Evidence for Cardiac and Aortic Fibrosis in Ang ACE2 KO
Masson’s Trichrome staining for collagen in heart
Replacement of myocytes with collagenous material is a major indicator of cardiac remodeling. Histological observation of trichrome-stained heart sections showed more myocardial collagen in Ang ACE2 KO than in Ang WT (Figure 5A and B). The greatest collagen density was localized in the LV wall.

Masson’s trichrome staining for collagen in myocardial sections in Ang WT (A) and Ang ACE2 KO (B). Collagen content (blue) was seen within the interstitial space of Ang ACE2 KO indicating myocardial fibrosis. WT indicates wild type; ACE2 KO, angiotensin-converting enzyme 2 knockout.
Picrosirius Red Staining for Collagen Fibers in Heart and Aorta
Collagen within the myocardium and aorta was visualized using polarized light imaging of Picrosirius Red–stained tissue sections. This type of staining is selective for collagen type I (yellow/orange fluorescence) and type III (green fluorescence). Advantages of the method are high sensitivity, ability to detect thin collagen fibers, and ability to quantify collagen content. Heart and aortic sections were stained and images were taken using external polarized light. Microscopic observation of myocardium showed higher LV collagen in Ang ACE2 KO than in Ang WT (Figure 6A and B). Analysis of collagen content revealed higher (CVF%) in Ang ACE2 KO than in Ang WT (Figure 6C). Results are consistent with those observed with Trichrome staining.
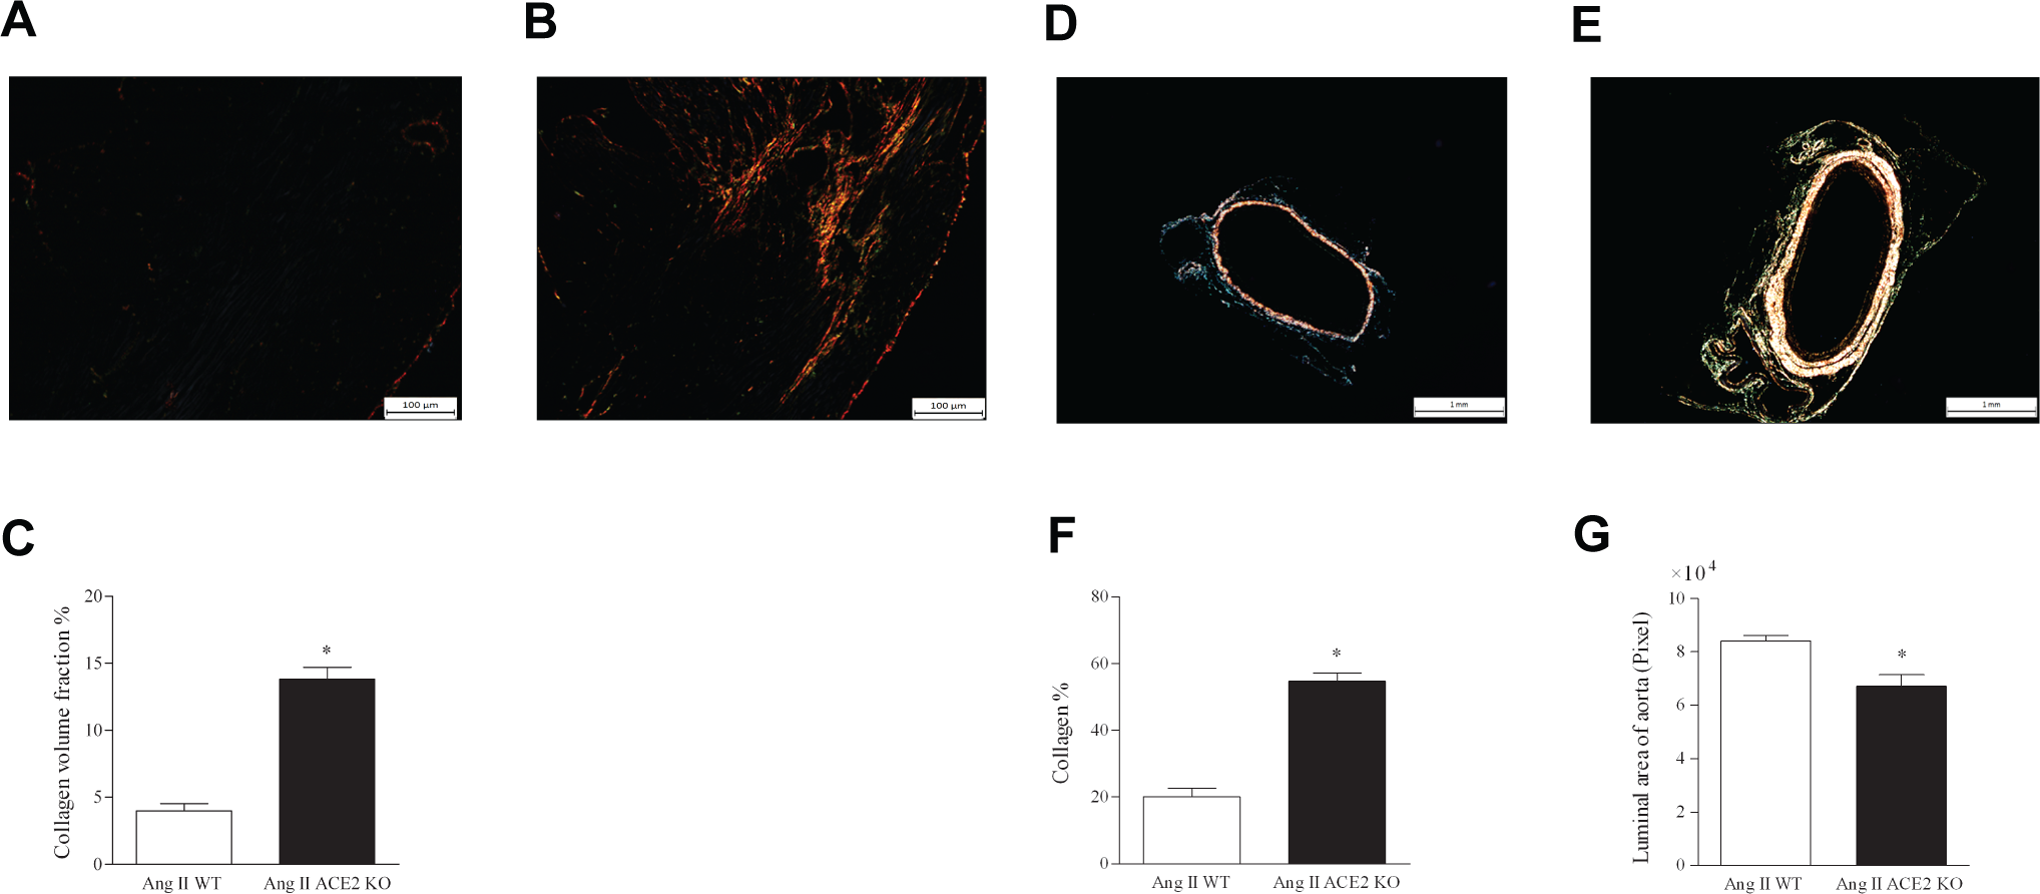
Myocardium sections stained for collagen using Picrosirius Red in Ang WT (A) and Ang ACE2 KO (B). Tissues were examined using light microscopy with polarized light. Type I collagen fibers are highly birefringent, yellow, or orange glow. Quantitation of myocardial collagen (C) showed higher collagen volume fraction (CVF%) in Ang ACE2 KO. Sections of aortas (×2.5) were stained with Picrosirius Red in Ang WT (D) and Ang ACE2 KO (E). Collagen fibers were quite dominant within the adventitia layer of Ang ACE2 KO. Quantitation shows that collagen percentage was more than 2-fold higher in Ang ACE2 KO as compared to Ang WT (F). Moreover, quantitation of the luminal area showed decreased surface area (pixels) in Ang ACE2 KO than in Ang WT (G). Unpaired student t test; *P < .05 versus Ang WT. WT indicates wild type; ACE2 KO, angiotensin-converting enzyme 2 knockout.
Examination of the upper ascending thoracic aorta showed a similar enhancement in aortic remodeling as seen in the heart (Figures 6 and 7). There were marked differences in aortic structure and collagen content in Ang ACE2 KO. Staining with Picrosirius Red revealed a dense concentration of collagen fibers in the aortic adventitia of Ang ACE2 KO (Figure 6D and E). Quantification showed a higher percentage collagen in Ang ACE2 KO (Figure 6F), associated with a narrowing in the luminal vessel area (Figure 6E). The high collagen content in the outermost layer along with the narrowing area of the aorta would promote vessel stiffness and loss of compliance and elasticity. These changes suggest that greater cardiac afterload in Ang ACE2 KO may compromise systolic function and negatively affect EF%.

Dihydroethidium (DHE) staining of heart and aorta of Ang II-infused mice: WT (A) and ACE2 KO (B). There was higher ROS% as indicated by DHE within the myocardium of Ang ACE2 KO (C). This suggests a protective role of ACE2 against Ang-II-induced myocardial oxidative stress. Moreover, higher ROS content was seen in the aorta of Ang ACE2 KO (E) as compared to Ang WT (D). Quantitation shows higher ROS% in aorta in Ang ACE2 KO (F). This suggests protective role of ACE2 in abrogating Ang-II-induced oxidative stress in the myocardium and aorta. Unpaired student t test; *P < .05 versus Ang WT. WT indicates wild type; Ang II, angiotensin II; ACE2 KO, angiotensin-converting enzyme 2 knockout; ROS, reactive oxygen species.
ACE2 Protects the Heart and Aorta From Ang II-Mediated Superoxide Production
Tests were performed to evaluate superoxide (O2 −) production in fresh frozen heart and aorta using DHE fluorescence staining as the marker. DHE allows the detection of in situ ROS formation 37 since it is selective for O2 −production. 38 Sodium diethyldithiocarbamate was added to inhibit intracellular and extracellular SOD activity. Results showed that Ang II produced a marked effect on O2 − production in hearts of ACE2 KO (Figure 7A and B). Results were quantified according to the intensity of ROS pixels expressed as ROS% to the total section pixels. Myocardial sections from Ang ACE2 KO exhibited higher ROS% compared to Ang WT (Figure 7C). Microscopic examination of aorta sections stained with DHE also revealed higher O2 − levels in Ang ACE2 KO as compared to Ang WT (Figure 7D and E). Aorta from Ang ACE2 KO showed higher ROS% than Ang WT (Figure 7F). Results allude to the idea that ACE2 may act as a scavenger against tissue superoxide production.
Deficiency of ACE2 Worsens Ang II-Mediated Aortic Inflammatory Cytokines
To evaluate inflammatory cytokines in aorta, we used a Bio-Plex 200 system that provides data on 23 markers. Aortas from nontreated mice (matched age and gender) were used to obtain baseline levels. Results showed a 3-fold elevation in MIP-1α concentration within aortas from Ang ACE2 KO mice compared to their corresponding baseline (Figure 8A). The MIP-1α is a protein produced by macrophages and/or T-cells 39 and its overexpression in the aorta has been associated with arterial wall inflammation. 40,41 In addition, interleukine 1a (IL-1a) level seems to be elevated upon Ang II treatment (NS) (Figure 8B). No differences were observed in the other cytokine markers (Table 3). Results showed local inflammatory response in aortas of ACE2 KO mice in response to Ang II stimulation.
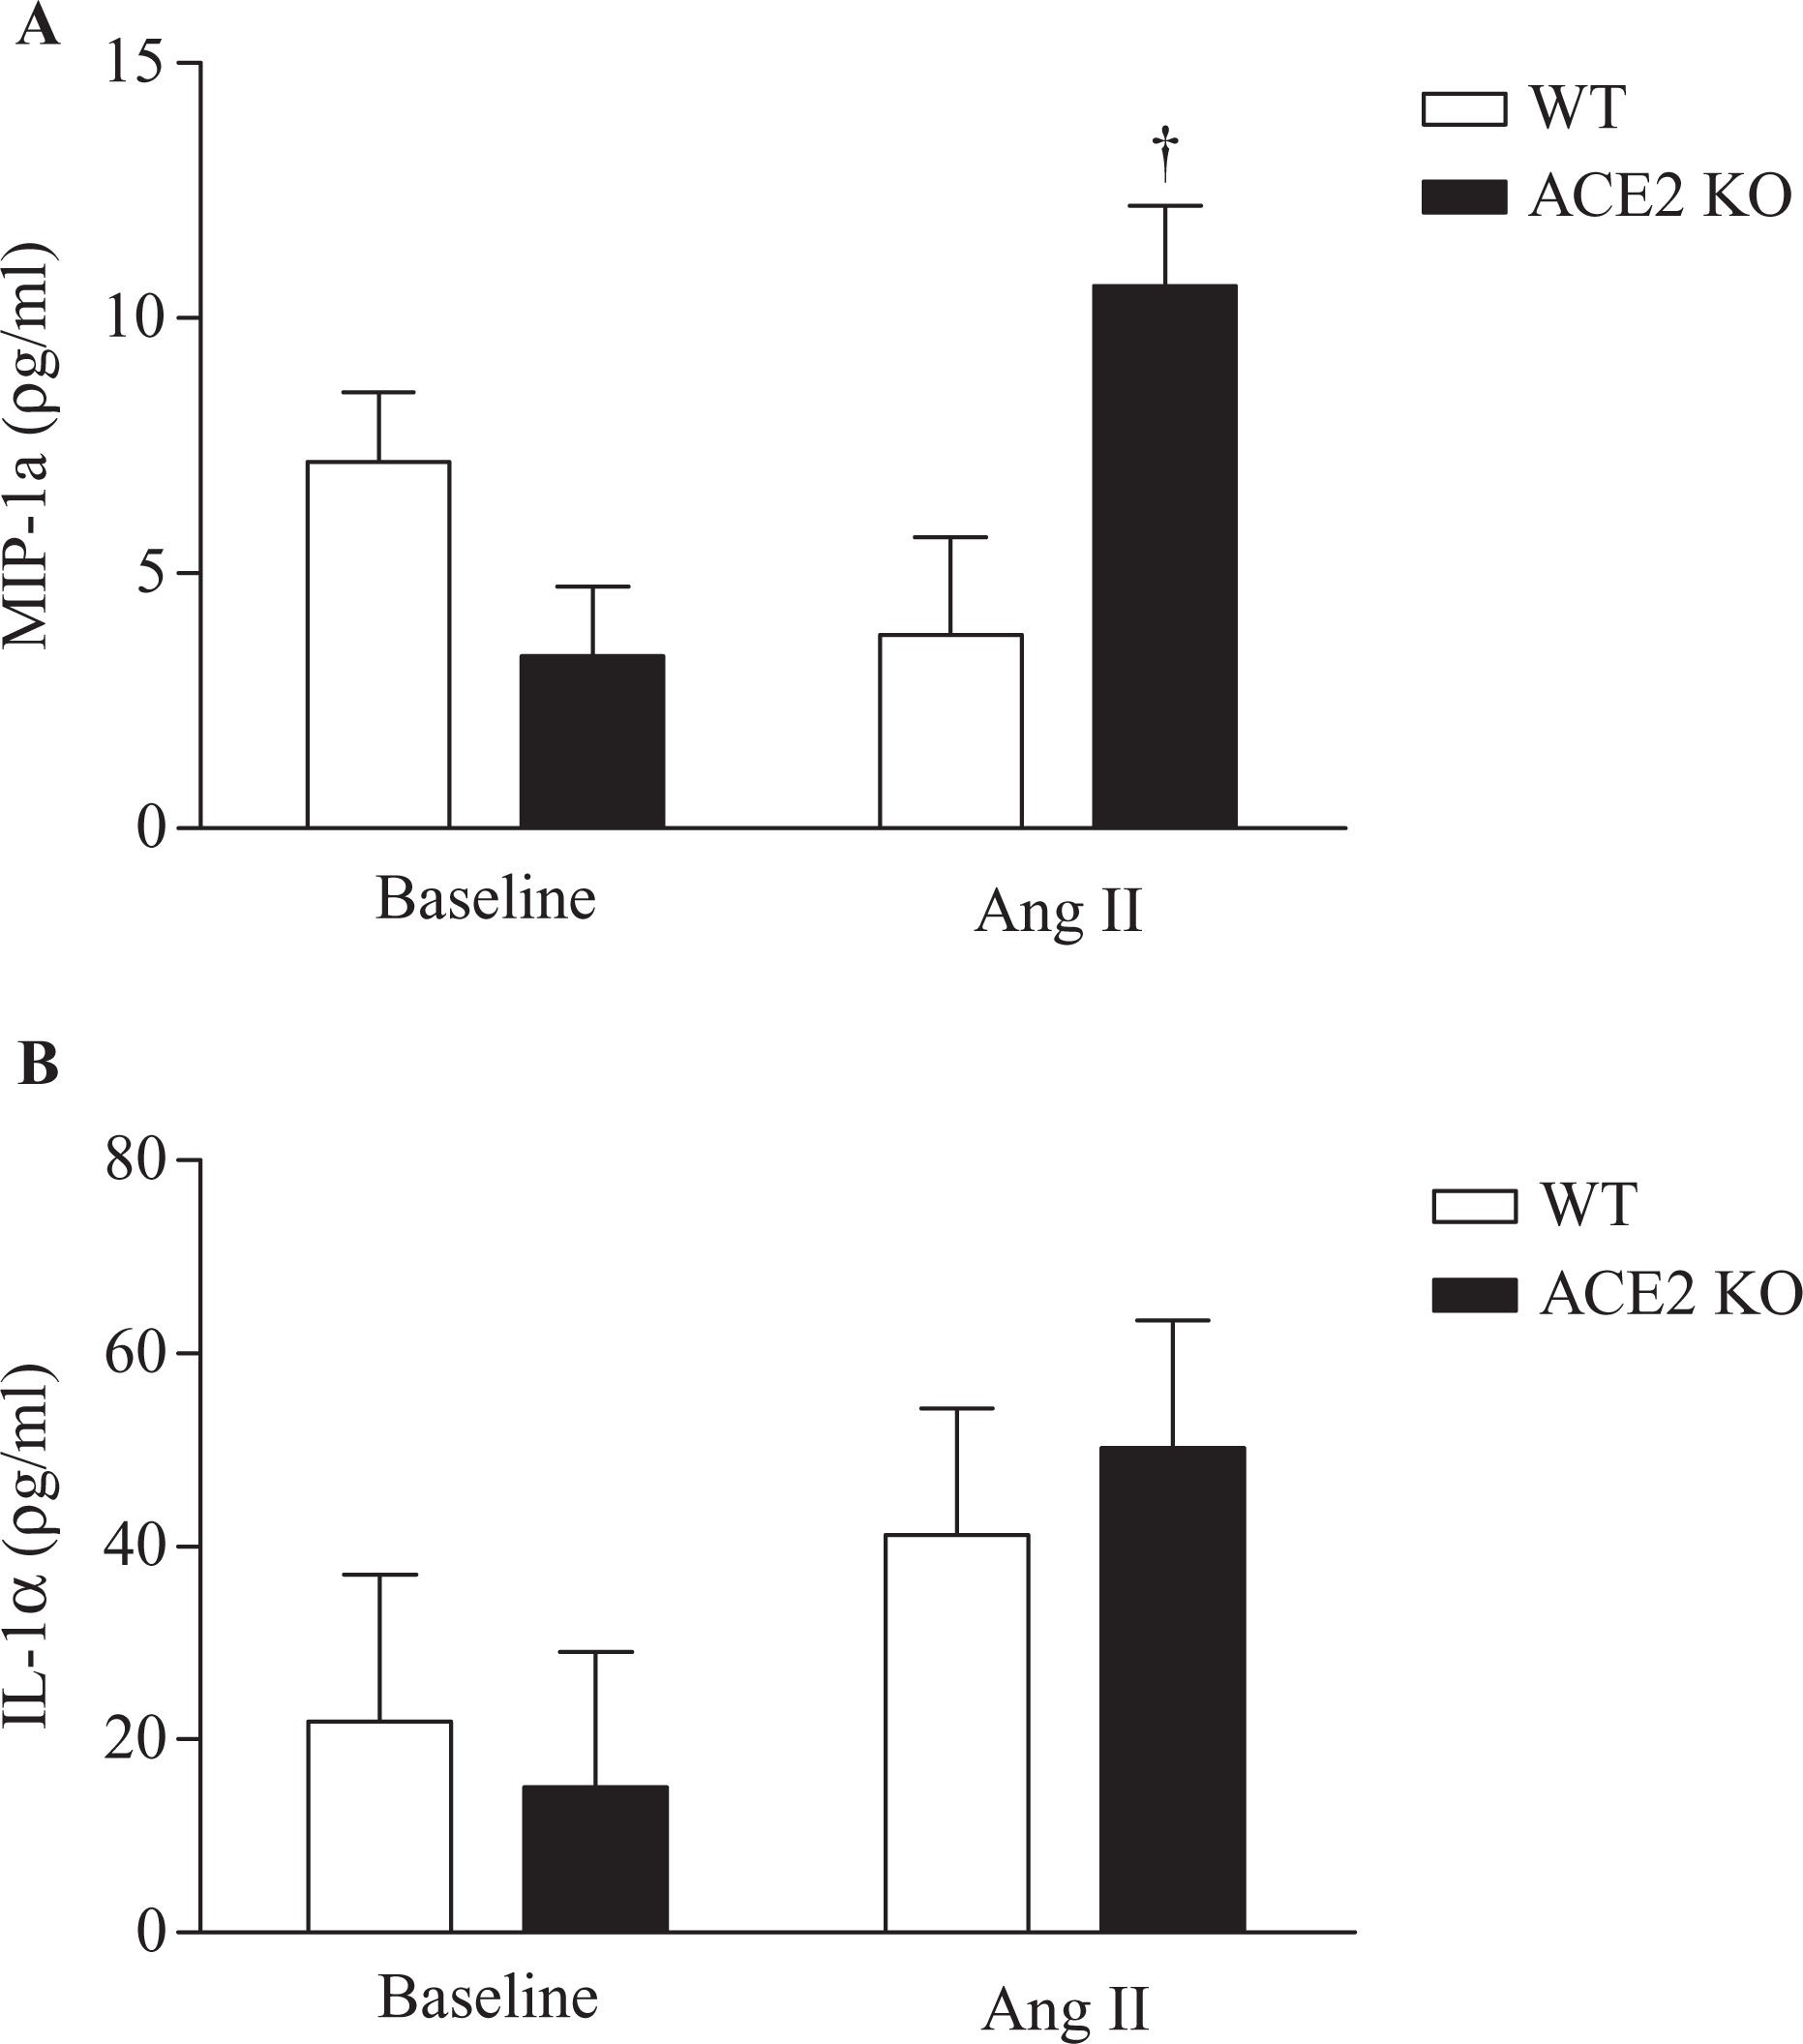
Assessment of inflammatory cytokines within aortas. Ang ACE2 KO mice exhibited elevated level of macrophage inflammatory protein 1α (MIP-1α) as compared to the corresponding baseline (A). Interleukin 1α (IL-1α) level seems to be increased with Ang II treatment (NS) (B). Aortas from mice with same age, gender, and strain were used to obtain baseline cytokine level. *P< .05 versus WT; †P < .05 versus baseline. WT indicates wild type; ACE2 KO, angiotensin-converting enzyme 2 knockout.
Discussion
ACE2 is carboxypeptidase that functions beneficially to reduce the deleterious effects of Ang II by metabolizing it to Ang (1-7).2,42,43 ACE2 has been detected in many organs 44 including high levels in the heart.1,2 The objective of our study was to establish the functional and structural outcomes in mice lacking ACE2 and to determine the effect of chronic Ang II infusion on BP (radiotelemetry), cardiac function (echo), cardiac/aortic structure (histology and morphometrics), and aortic inflammation. Even though previous studies in ACE2 KO showed that infusion of Ang II caused concentric remodeling of the LV associated with mild diastolic dysfunction, 19 this study provided direct evidence of the protective role of ACE2 against chronic infusion with pressor doses of Ang II. 8 Under baseline conditions ACE2 KO mice exhibit normal cardiac structure and function and unchanged BP. This is consistent with the results from a previous study that used ACE2 KO mice with the same genetic background, age, and gender. 8 Ang II infusion produced a cadre of pathological symptoms consistent with a cardioprotective role for ACE2. Damage in Ang ACE2 KO was documented by increased cardiac systolic dimensions, overt hypertrophic cardiomyopathy, and aortic remodeling. These changes were associated with enhanced oxidative stress in the heart and aorta. Collectively, findings point toward ACE2 as an essential modulator to the maladaptive CV response produced by high-dose Ang II stimulation.
ACE2 was first cloned from the left ventricle of patients with heart failure.1,2 Early studies suggested that ACE2 deletion in mice produced cardiac contractile dysfunction. 6 However, this did not prove to be a universal finding since other studies reported that ACE2 KO mice of mixed genetic backgrounds exhibit normal cardiac function.7,8 It is worth noting that the cardiac contractile dysfunction observed in some ACE2 KO models6,11,45 might be explained by the methods used for ACE2 gene disruption and/or the genetic background.8,15 The high dose of Ang II produced a maximal MAP increase of almost 40 mm Hg with similar changes in WT and ACE2 KO mice. The marked hypertension was associated with a deficit in cardiac function in ACE2 KO. In addition to diastolic dysfunction, which was seen by exacerbated E/A ratio, Ang ACE2 KO exhibited severe systolic dysfunction. This was shown by an increase in the LVESd which resulted in a decrease in FS% of ∼30% and a corresponding decrease in EF% of ∼32% in the Ang ACE2 KO. A variety of echo parameters indicate that ACE2 plays protective role in conserving myocardial contractile function against long-term Ang II stimulation.
Interestingly, Ang II infusion raised the BP to the same extent in both strains. These results could be explained by several theories:
Since exogenous Ang II is largely responsible for the increased BP, the absence of a BP effect associated with ACE2 deletion fits with the fact that ACE2 was not detected in the plasma of normal mice. 46 Consistent with that, studies have shown cardiac administration of a lentiviral vector coding for ACE2 47 or treatment with recombinant human ACE2 19 effectively decreased BP. In contrast, neither long-term infusion of Ang (1-7)4,5 nor its overexpression 48 accentuated Ang II’s pressor effects. This underscores a role for ACE2, but not plasma Ang (1-7), as an agent responsible for lowering BP.
Another idea is based on the fact that Ang II can be metabolized by ACE2 independent pathways, such as prolylcarboxypeptidase (PCP), prolylendopeptidase (PEP), and amino peptidase A (APA). 49,50 In the absence of ACE2, these enzymes might be upregulated to provide alternative pathways for Ang II metabolism.
The issue is whether the increase in Ang II or the combination of Ang II with the decrease in its metabolite, Ang (1-7), plays the key role in mediating cardiac dysfunction and hypertrophy. Support is greatest for the first theory, 6,11,51 however, there is still evidence that Ang (1-7) is essential for the maintenance of normal cardiac function by counteracting Ang II-induced hypertrophic effects. 4,15 Our results showed a protective action of ACE2 against Ang II-mediated hypertrophic cardiomyopathy. This was seen by the higher heart weight/ body weight ratio in Ang ACE2 KO as compared to the Ang WT. In addition, Echo data showed an increase in the posterior wall thickness in Ang ACE2 KO compared to Ang WT. Furthermore, the larger cardiomyocyte size measured within the LV of Ang ACE2 KO mice clearly indicates a role of ACE2 in ameliorating Ang II-mediated cardiomyocyte hypertrophy. Results signify myocardial adaptive effects of ACE2 against hypertrophic response resulted from Ang II stimulation.
Oxidative stress induced by Ang II is likely to be one of the main mechanisms for peptide-mediated cardiac damage, acting via Ang type I receptor (AT1R) overstimulation.52,53 Increased ROS can mediate myocardial hypertrophy and /or remodeling by varieties of mechanisms.54,55 It has been confirmed that O2 − is the dominant ROS species in the heart of ACE2 KO. 45 Interestingly, Nako et al reported that irbesartan (AT1R blocker) and tempol (free radical scavenger) display the same cardioprotective effects against Ang II-induced cardiac injury. 51 Our results showed that there was enhanced O2 − production in the myocardium and aorta of ACE2 KO infused with Ang II. These results are consistent with a previous study, which documented that myocardial damage in ACE2 KO is likely mediated by Ang-II-induced oxidative stress.45,56 Moreover, our results showed that the degree of ROS stimulation was especially evident in the aorta which showed high levels of DHE in the adventitia. The exact role of ACE2 in abrogating ROS formation is not fully understood. One theory is that the metabolism of Ang II to Ang (1-7) prevents Ang II-induced oxidative stress. Another explanation is that ACE2 acts as a scavenger against ROS formation. Collectively, these findings emphasize the importance of oxidative stress in Ang-II-induced cardiac and vascular injury.
Another crucial aspect of Ang–II-induced CV pathologies is the induction of myocardial fibrosis and remodeling.57,58 Chronic Ang II treatment stimulates a maladaptive response in cardiomyocytes that leads to differential gene expressions, ROS production, impaired calcium cycling, 59 and stimulation of myocardial and collagen deposition (sign of CV remodeling). 57 Using 2 different types of collagen stains, our results showed elevated myocardium collagen in Ang ACE2 KO. Consistent with that, Zhong et al reported that Ang II infusion resulted in greater expression of procollagen type Iα1 and procollagen type IIIα1 in the myocardium of ACE2 KO. 19 It is plausible that the high collagen and resultant fibrosis seen in ACE2 KO mice might result in cardiac stiffness and decreased compliance, which are markers for diastolic dysfunction.58,60 This is supported by the elevation in E/A ratio as well as the increased relaxation time in Ang ACE2 KO, again suggesting diastolic dysfunction. It is important that results from collagen staining in the aorta also suggest a protective effect of ACE2 in this large transport vessel. In fact, this is the first report to suggest that the aorta is an important part of the Ang II/ACE2 pathological cascade. Vascular fibrosis involves media accumulation of extracellular matrix, such as collagen, elastin, fibronectin, and proteoglycans. Aortas from Ang ACE2 KO showed higher collagen in the adventitia layer, which suggest a decreased compliance. This would result in aorta stiffness that can negatively affect cardiac afterload and further worsen EF%. There is no information on changes in the smaller resistance vessels in ACE2 KO. However, since BP is not different between groups, one might suspect that the vascular fibrotic changes would be similar.
It is well documented that Ang II causes vascular smooth muscle growth, arterial remodeling, and inflammation. 61,62 It is reasonable that the presence of ACE2 in the vascular endothelium and smooth muscle cells 1,63 could function protectively in those vessels from the hypertrophic effect of Ang II. 64,65 Moreover, it has been shown that ACE2 upregulation in the spontaneous hypertensive rats (SHR) aorta in response to treatment with an AT1R antagonist is associated with increased lumen size 66 similar to that seen in the Ang ACE2 KO. Adding to that, the elevation in MIP-1α concentration within the aorta of ACE2 KO suggests a possible anti-inflammatory role for ACE2 in this important transport vessel. The local inflammatory response in the ACE2 KO mice signifies the aortic remodeling and may contribute to the elevated O2 − production in the aorta. 67 These data suggest a specific protective role of ACE2 to the maladaptive CV remodeling in response to Ang II stimulation.
In summary, our findings support the hypothesis that ACE2 is a crucial enzyme that modulates Ang-II-induced myocardial and aortic maladaptive hypertrophic response. We present explanations for the protective effects of ACE2 against the deleterious effects of Ang II and its cardiac sequelae. To our knowledge, this is the first report that signifies the role of ACE2 as a cardioprotective agent against systolic dysfunction mediated by chronic Ang II infusion. Our work magnifies the role of ACE2 as a potential candidate targeting CVD progression and supports the hypothesis that ACE2 might be a promising avenue for developing CV therapeutic agents.
Footnotes
Authors’ Note
This work was conducted in the Department of Pharmacology and Toxicology, Wright State University Boonshoft School of Medicine, Dayton, OH 45435, USA. Mahmoud Alghamri is a master’s student in Pharmacology and Toxicology at Wright State University Boonshoft School of Medicine and supported by a Fulbright Foreign Student Scholarship from the US Department of State.
Acknowledgments
We would like to thank Thomas Coffman, Duke University, Durham, NC, for providing the ACE2 KO mice strain. We would like to acknowledge Nadja Grobe, Mary Key, Ahmad Alhajoj, and Naima Rodwan for excellent technical and editorial assistance.
Declaration of Conflicting Interests
The author(s) declared no potential conflicts of interest with respect to the research, authorship, and/or publication of this article.
Funding
The author(s) disclosed receipt of the following financial support for the research, authorship, and/or publication of this article: This work was supported by an Alaska Kidney Foundation-ASN Research Grant (SBG), and by National Institutes of Health Grant R01 HL093567, American Heart Association Grant SDG 0735112 N, and Fulbright Program for Foreign Students, US Department of State (M Alghamri).