
Abstract
Alzheimer’s disease (AD) is the most common cause of dementia and accounts for approximately 50% to 80% of all cases of dementia. The diagnosis of probable AD is based on clinical criteria and overlapping clinical features pose a challenge to accurate diagnosis. However, neuroimaging has been included as a biomarker in various published criteria for the diagnosis of probable AD, in the absence of a confirmatory diagnostic test during life. Advances in neuroimaging techniques and their inclusion in diagnostic and research criteria for the diagnosis of AD includes the use of positron emission tomography (PET) imaging as a biomarker in various therapeutic and prognostic studies in AD. The development and application of a range of PET tracers will allow more detailed assessment of people with AD and will improve diagnostic specificity and targeted therapy of AD. The aim of this review is to summarize current evidence on PET imaging using the non-specific tracer [18F]fluorodeoxyglucose and specific tracers that target amyloid and tau pathology in people with AD.
Introduction
Dementia can be defined as an acquired and progressive impairment of cognitive functioning including memory, language, thinking, and perception resulting in disruption of activities of daily living (Goodman and others 2017). A recent report from the World Health Organization estimated approximately 50 million people currently have dementia worldwide (World Health Organization, 2020), affecting 7% to 8% of individuals aged more than 65 years and approximately 30% individuals aged more than 80 years (Dormont and Seidenwurm 2008). Fifty percent to 80% of all causes of dementia comprise of Alzheimer’s disease (AD), which is the most common cause of dementia (Kanekar and Poot 2014) with the incidence doubling every 5 years after the age of 60 years (Corrada and others 2010). It has been found that it takes years for neurodegeneration in AD to manifest itself clinically (Villemagne and others 2013). The increase in the proportion of older people in the population worldwide, due to increase in life expectancy, harbors an epidemic of dementia in the coming years. It is imperative to take appropriate measures in advance to deal with a surge of dementia. Unfortunately, we are still struggling with accurate diagnosis and appropriate management of dementia subtypes. Accurate diagnosis is particularly important as management and prognosis vary significantly with dementia subtypes.
Neuroimaging has not only a supportive role in making the clinical diagnosis but also features in the diagnostic criteria for probable AD (Dubois and others 2007; McKhann and others 2011). Historically, brain imaging in people with dementia focused on ruling out treatable causes, such as mass lesions or subdural hematomas. Advancement in imaging modalities particularly magnetic resonance imaging (MRI), positron emission tomography (PET), and regional cerebral blood flow–single photon emission computed tomography (rCBF-SPECT) has broadened the horizons of imaging in diagnosis of AD (Table 1).
Comparison of Diagnostic Accuracies of Different Imaging Modalities in AD. a
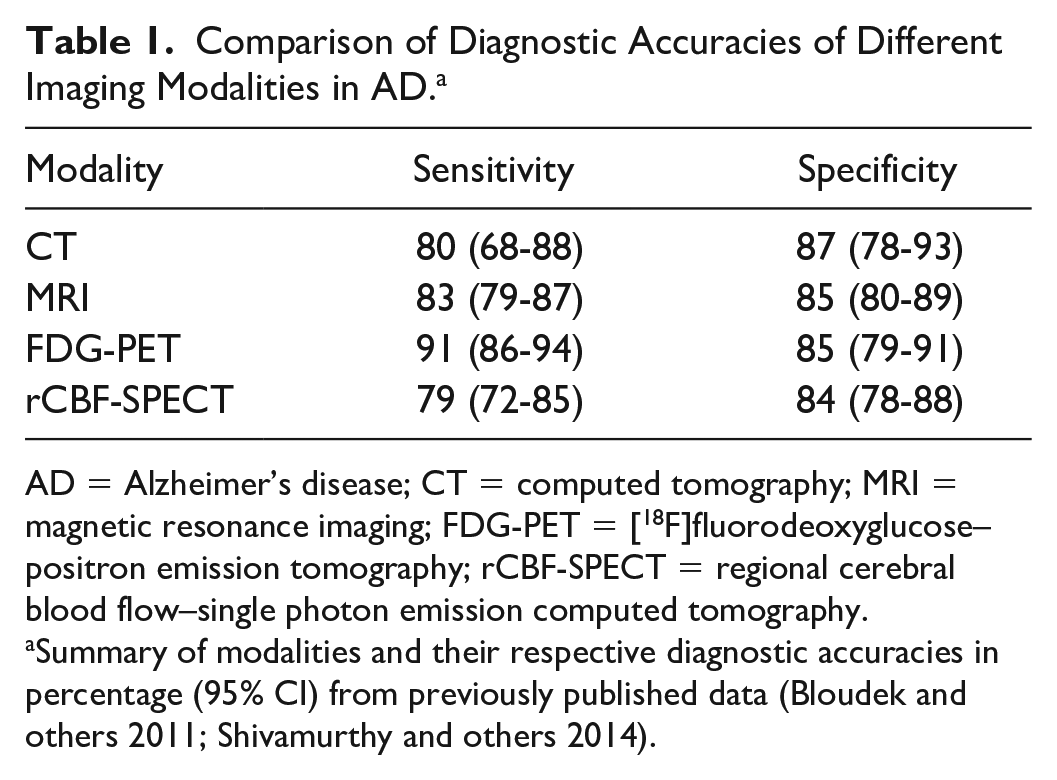
AD = Alzheimer’s disease; CT = computed tomography; MRI = magnetic resonance imaging; FDG-PET = [18F]fluorodeoxyglucose–positron emission tomography; rCBF-SPECT = regional cerebral blood flow–single photon emission computed tomography.
Summary of modalities and their respective diagnostic accuracies in percentage (95% CI) from previously published data (Bloudek and others 2011; Shivamurthy and others 2014).
The National Institute of Neurological and Communicative Disorders and Stroke (NINCDS) and the Alzheimer’s Disease and Related Disorders Association (ADRDA) established diagnostic criteria for AD in 1984 (McKhann and others 1984). Revised diagnostic criteria were proposed in 2007 by Dubois and colleagues, to include neuroimaging (Dubois and others 2007). Criteria were further revised by the National Institute on Aging (NIA) and the Alzheimer’s Association included five most commonly investigated biomarkers namely positive amyloid-β (Aβ) PET or reduced Aβ in cerebrospinal fluid (CSF) and markers of neuronal injury, including raised CSF tau, typical temporo-parietal deficits on [18F]fluorodeoxyglucose-positron emission tomography (FDG-PET), and hippocampal atrophy on structural MRI in diagnostic classification in 2011. The biomarkers were categorized into amyloid and tau-related neurodegeneration (McKhann and others 2011). In 2018, the tau and neurodegeneration/injury biomarkers were separated and placed in different categories. In this system each of the three biomarker groups consisted of CSF and an imaging biomarker namely, A—aggregated Aβ or associated pathologic state, which includes reduced CSF Aβ and positive amyloid PET; T—aggregated tau, which includes raised CSF phosphorylated tau and positive tau PET; and (N)—neurodegeneration or neuronal injury, which includes atrophy on structural MRI, deficits on FDG-PET and raised CSF total tau, collectively known as the AT(N) biomarker classification system (Jack and others 2018).
Higher diagnostic accuracy of PET imaging has led to its inclusion in diagnostic and research criteria for AD and it has also been used as a biomarker in various therapeutic and prognostic studies related to AD. PET imaging especially FDG-PET and amyloid PET, considering their diagnostic accuracy, their use in differential diagnosis of AD and evaluation of mild cognitive impairment conversion to AD and their clinical application, both meet criteria as suitable biomarkers for AD (Rice and Bisdas 2017). The aim of this review is to summarize current evidence on the PET imaging using the non-specific tracer FDG and specific tracers targeting amyloid and tau pathology and their effectiveness in the diagnosis and prognosis of people with AD (Table 2).
Summary of non-specific and specific PET tracer’s findings and uses in AD.
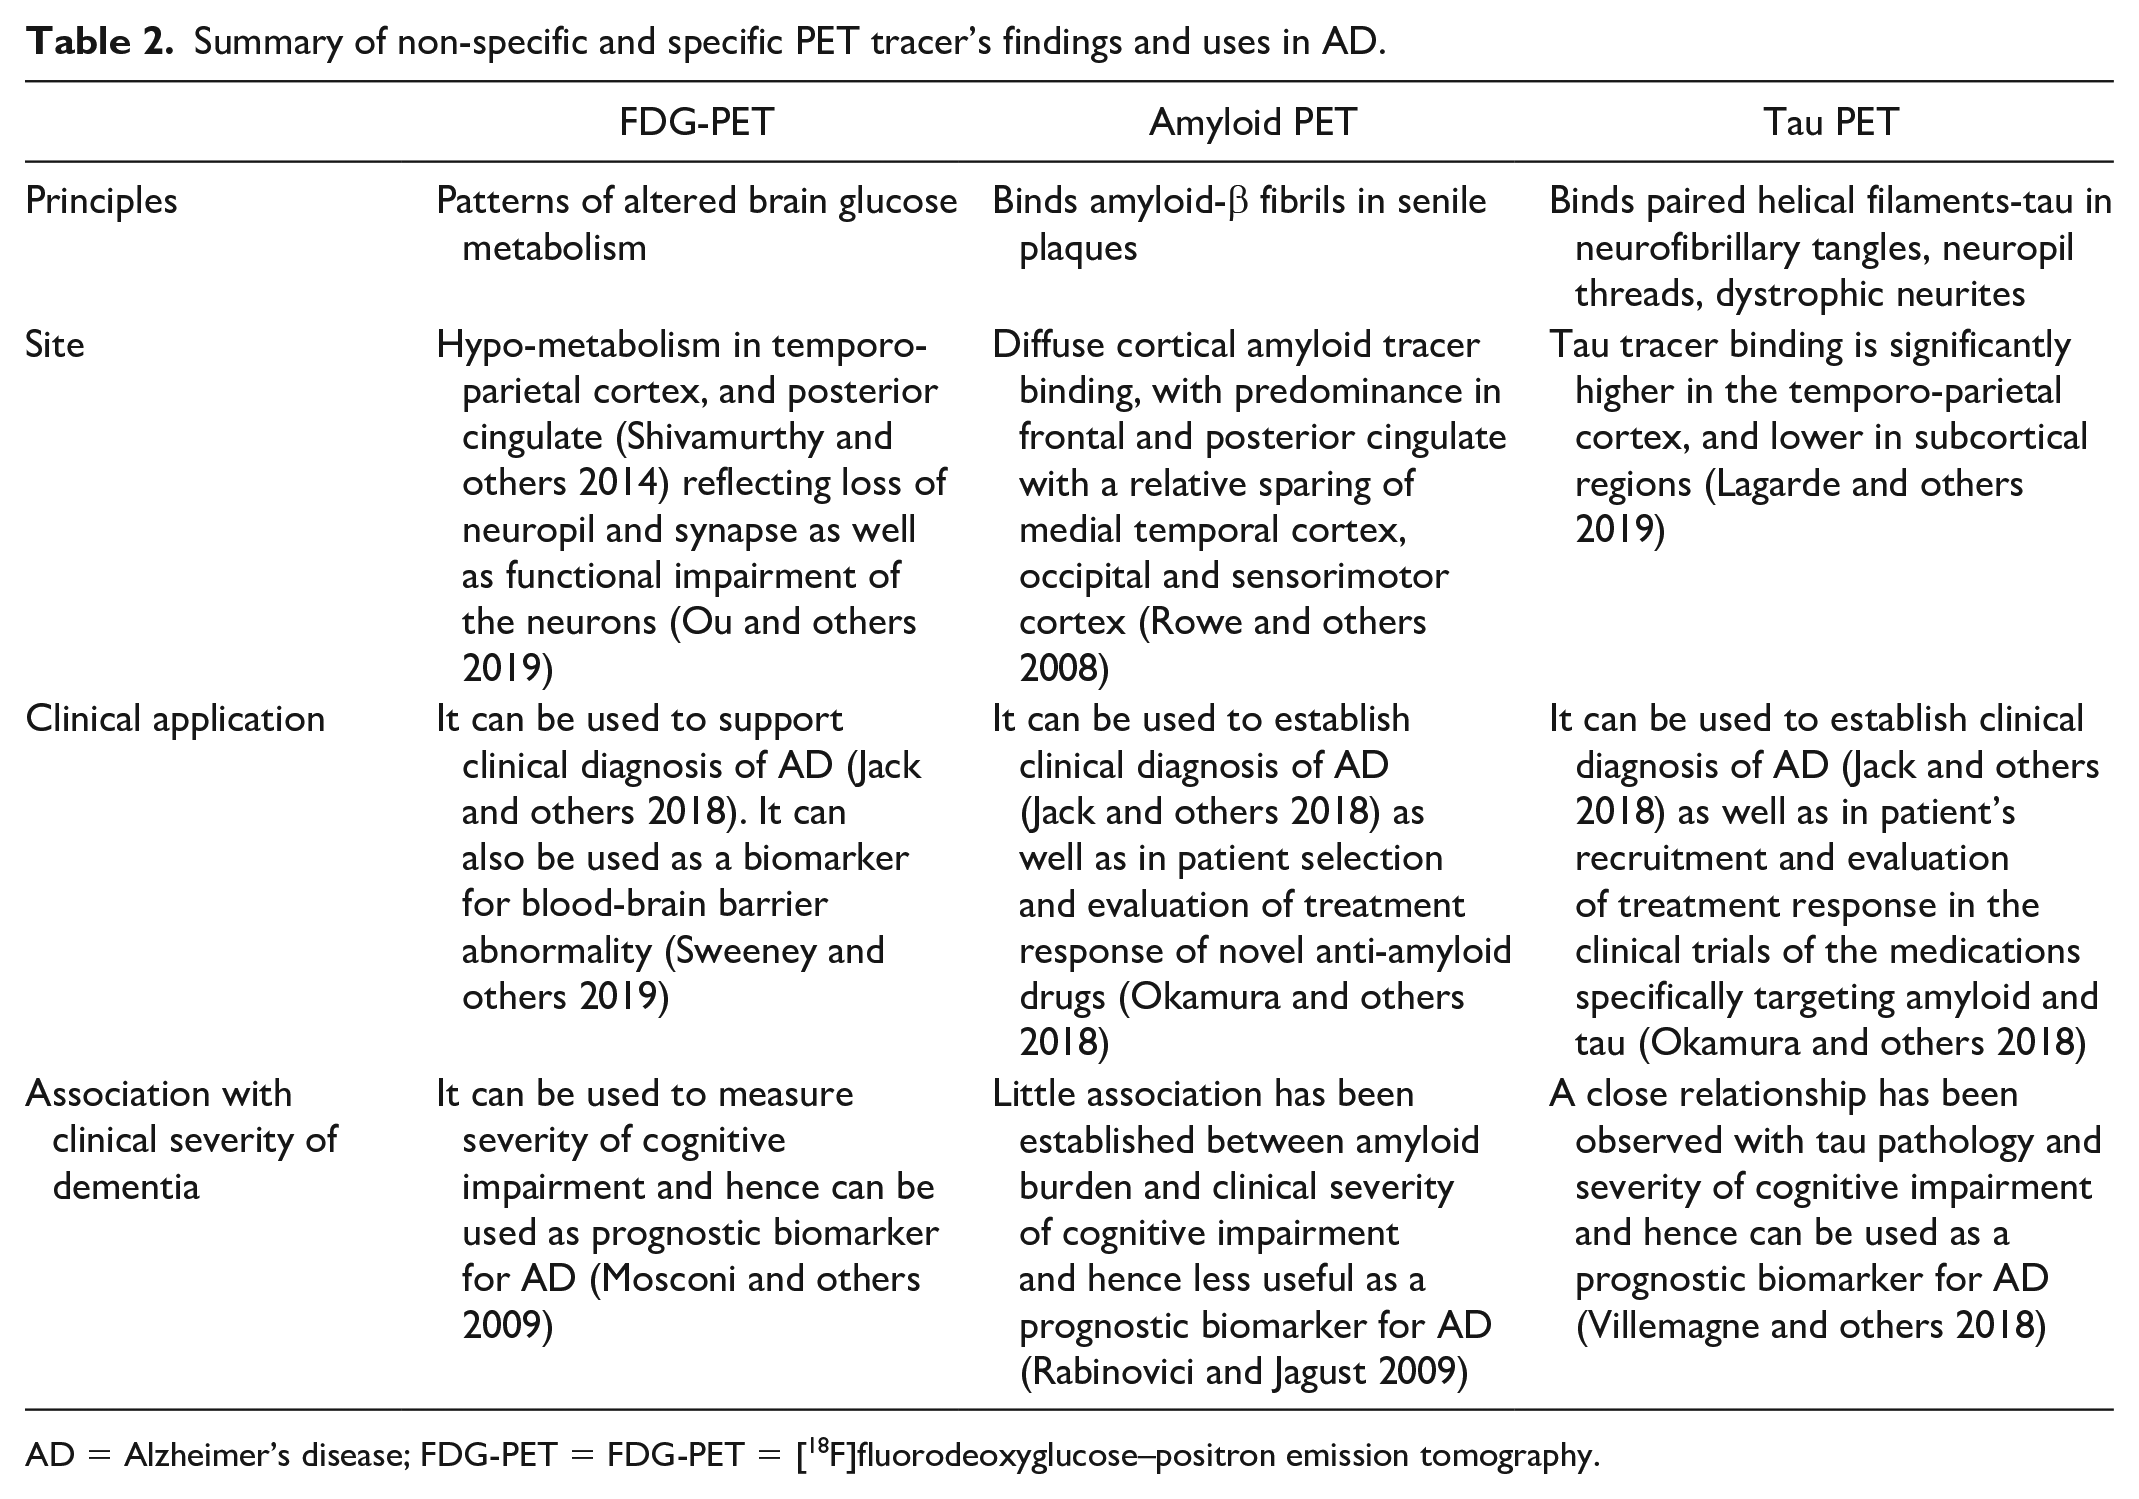
AD = Alzheimer’s disease; FDG-PET = FDG-PET = [18F]fluorodeoxyglucose–positron emission tomography.
FDG-PET Imaging in AD
[18F]fluorodeoxyglucose–positron emission tomography (FDG-PET) relies on the detection of the classic pattern of hypometabolism in the temporoparietal regions, corresponding to sites of neurodegeneration. The reliance of the brain on glucose for its activity allows FDG, a glucose analogue, to be used to measure glucose transporter mediated uptake, following which activity is trapped in the cells after phosphorylation. Thus, it can be used to measure neuronal dysfunction, which is inversely proportional to the glucose uptake (Hoffman and others 2000; Nasrallah and Dubroff 2013). A distinct pattern of hypo-metabolism (Figure 1) on FDG-PET can distinguish AD from other causes of dementia and it can distinguish people with AD from healthy controls with sensitivity and specificity of 93% to 97% and 86% (Mehta and Thomas 2012). However, to differentiate people with AD from people with dementia with Lewy bodies (DLB) and frontotemporal dementia (FTD) the sensitivity remains at 99% but specificity drops to 71% and 65%, respectively (Daniela and others 2014; Mosconi and others 2008). The United States Food and Drug Administration (FDA) has approved FDG-PET to distinguish between AD and FTD based on its improved accuracy over clinical criteria (Foster and others 2007). Moreover, use of FDG-PET has also been recommended by the European Association of Nuclear Medicine and the European Academy of Neurology (EANM-EAN) both in people with dementia (Nobili and others 2018) and in mild cognitive impairment (MCI) (Arbizu and others 2018; Nobili and others 2018). Recently, it has been observed that FDG-PET has significant clinical utility not only for early diagnosis but also helps in differential diagnosis of people with uncertain diagnosis of dementia (Perini and others 2020)
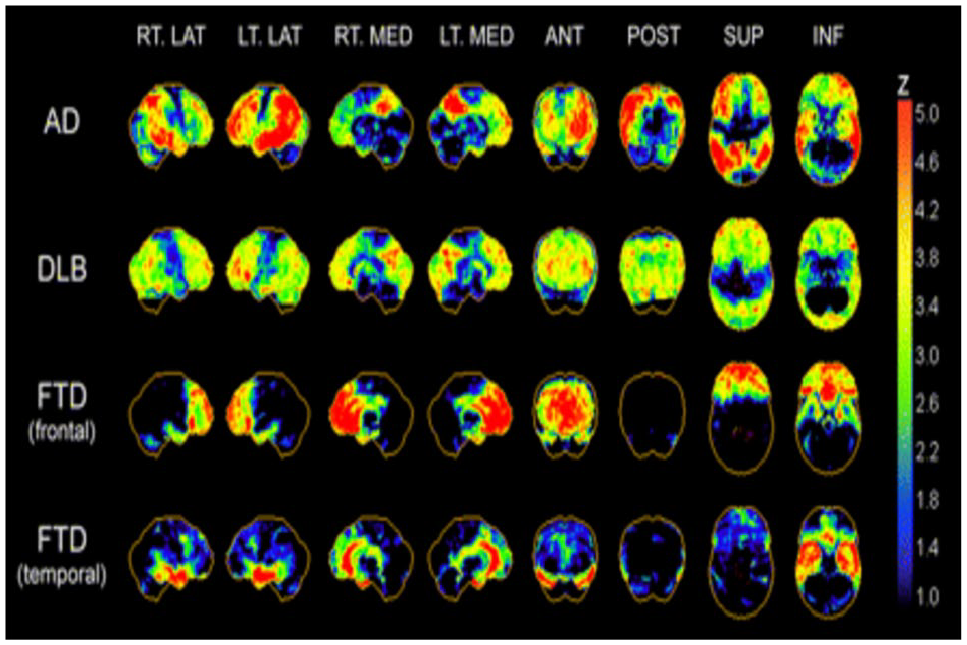
Typical regional cerebral [18F]fluorodeoxyglucose (18F-FDG) hypo-metabolism patterns in Alzheimer’s disease (AD), dementia with Lewy bodies (DLB), and frontotemporal dementia (FTD). Patterns are presented as z score maps based on significantly hypo-metabolic voxels relative to non-demented comparison population. AD pattern of glucose hypo-metabolism involves predominantly temporoparietal association cortices, posterior cingulate, and precuneus. In advanced disease, prefrontal association cortices show additional hypo-metabolism. Primary sensorimotor and visual neocortices are relatively spared. DLB has cortical hypo-metabolism similar to that of AD but with additional involvement of occipital cortex. FTD demonstrates frontal lobar or frontal and temporal polar cortical hypo-metabolism with relative sparing of parietal association cortex and preservation of primary somatomotor and visual cortices. ANT = anterior; INF = inferior; LAT = lateral; MED = medial; POST = posterior; SUP = superior. Reproduced with permission (Bohnen and others 2012).
Hypo-metabolism in the posterior cingulate cortex and precuneus are characteristics of early stages of AD on FDG-PET and the temporoparietal hypo-metabolism appears even before structural changes (Martin-Macintosh and others 2016). As AD pathology advances FDG-PET typically shows widely distributed cortical hypo-metabolism with extension into the frontal lobes, especially the prefrontal association cortex with sparing of anterior cingulate gyrus (Brown and others 2014). The typical AD pattern shows sparing of sensory cortex, motor cortex, visual cortex, cerebellum, basal ganglia, and thalamus (Hoffman and others 2000; Mosconi and others 2008). Mostly hypo-metabolism is bilateral; however, asymmetry is not uncommon (Landau and others 2011). Interestingly, hippocampal hypo-metabolism is an early disease feature and does not show progression from mild to moderate AD, corresponding with Braak stages of AD (Braak and Braak 1991). It is established that hippocampal hypo-metabolism occurs in the early stages of AD and that neocortical involvement occurs in later stages of the illness (Ishii and others 1998), with progression occurring in a stereotypical pattern via brain networks (Brown and others 2019). A sensitivity of 93% to 97% and specificity of 86% of FDG-PET for the diagnosis of AD has been reported in previous studies (Mehta and Thomas 2012) Recently, it has been concluded that FDG PET is independent from “N” biomarker proposed in AT(N) framework for AD diagnosis as consumption of glucose driven by astrocytes, rather than neurons (Ou and others 2019).
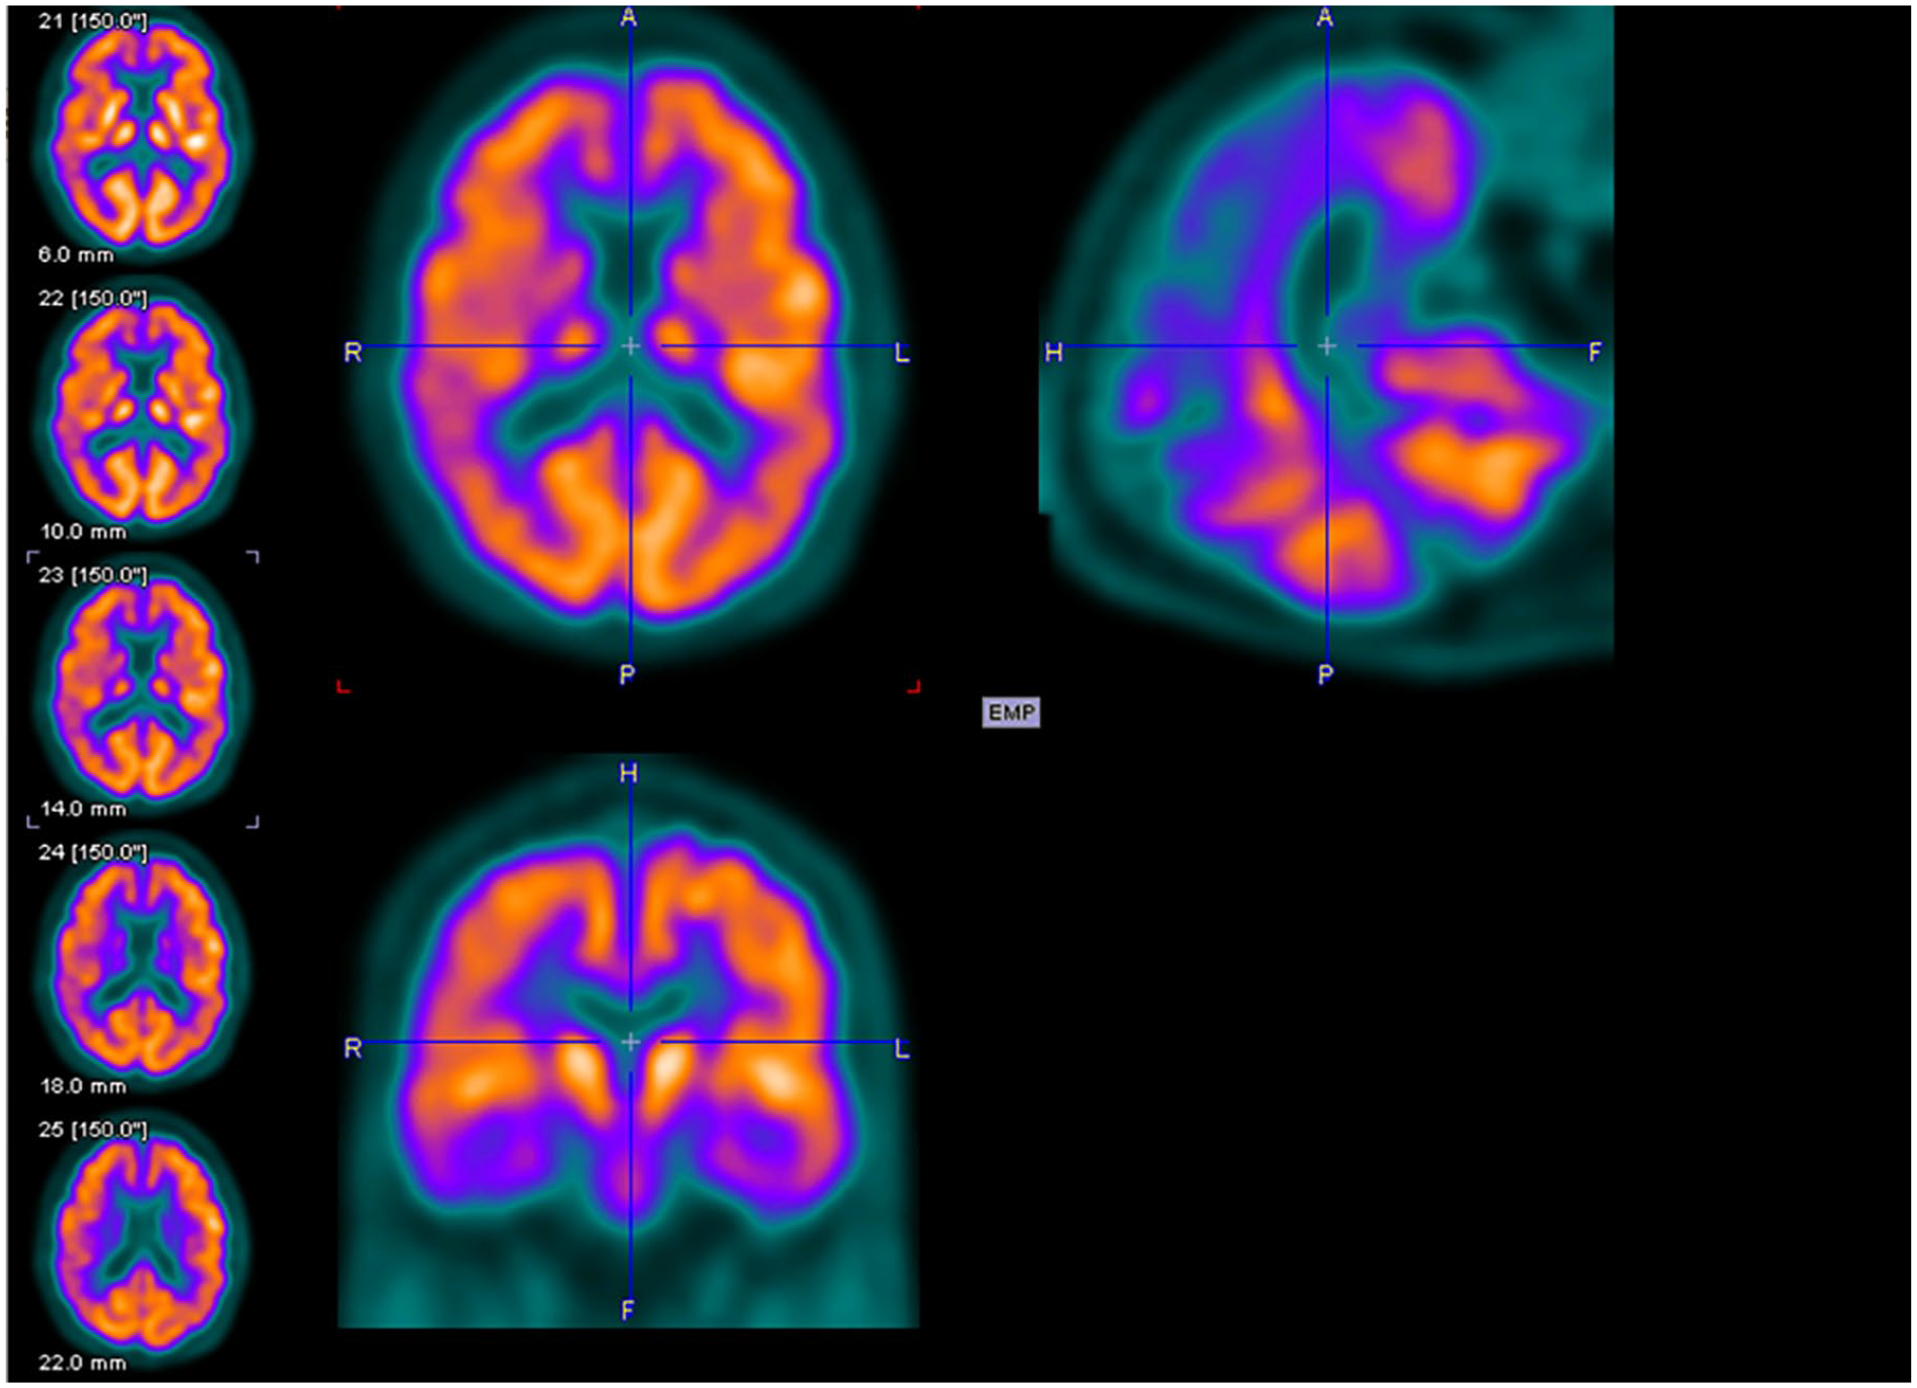
Figures 2 to 4 are examples of FDG-PET imaging corresponding to the Mini-Mental State Examination (MMSE) scores of the people with AD. The golden color represents normal metabolism, orange color indicates mild to moderate hypo-metabolism, and purple color represents moderate to severe hypo-metabolism.
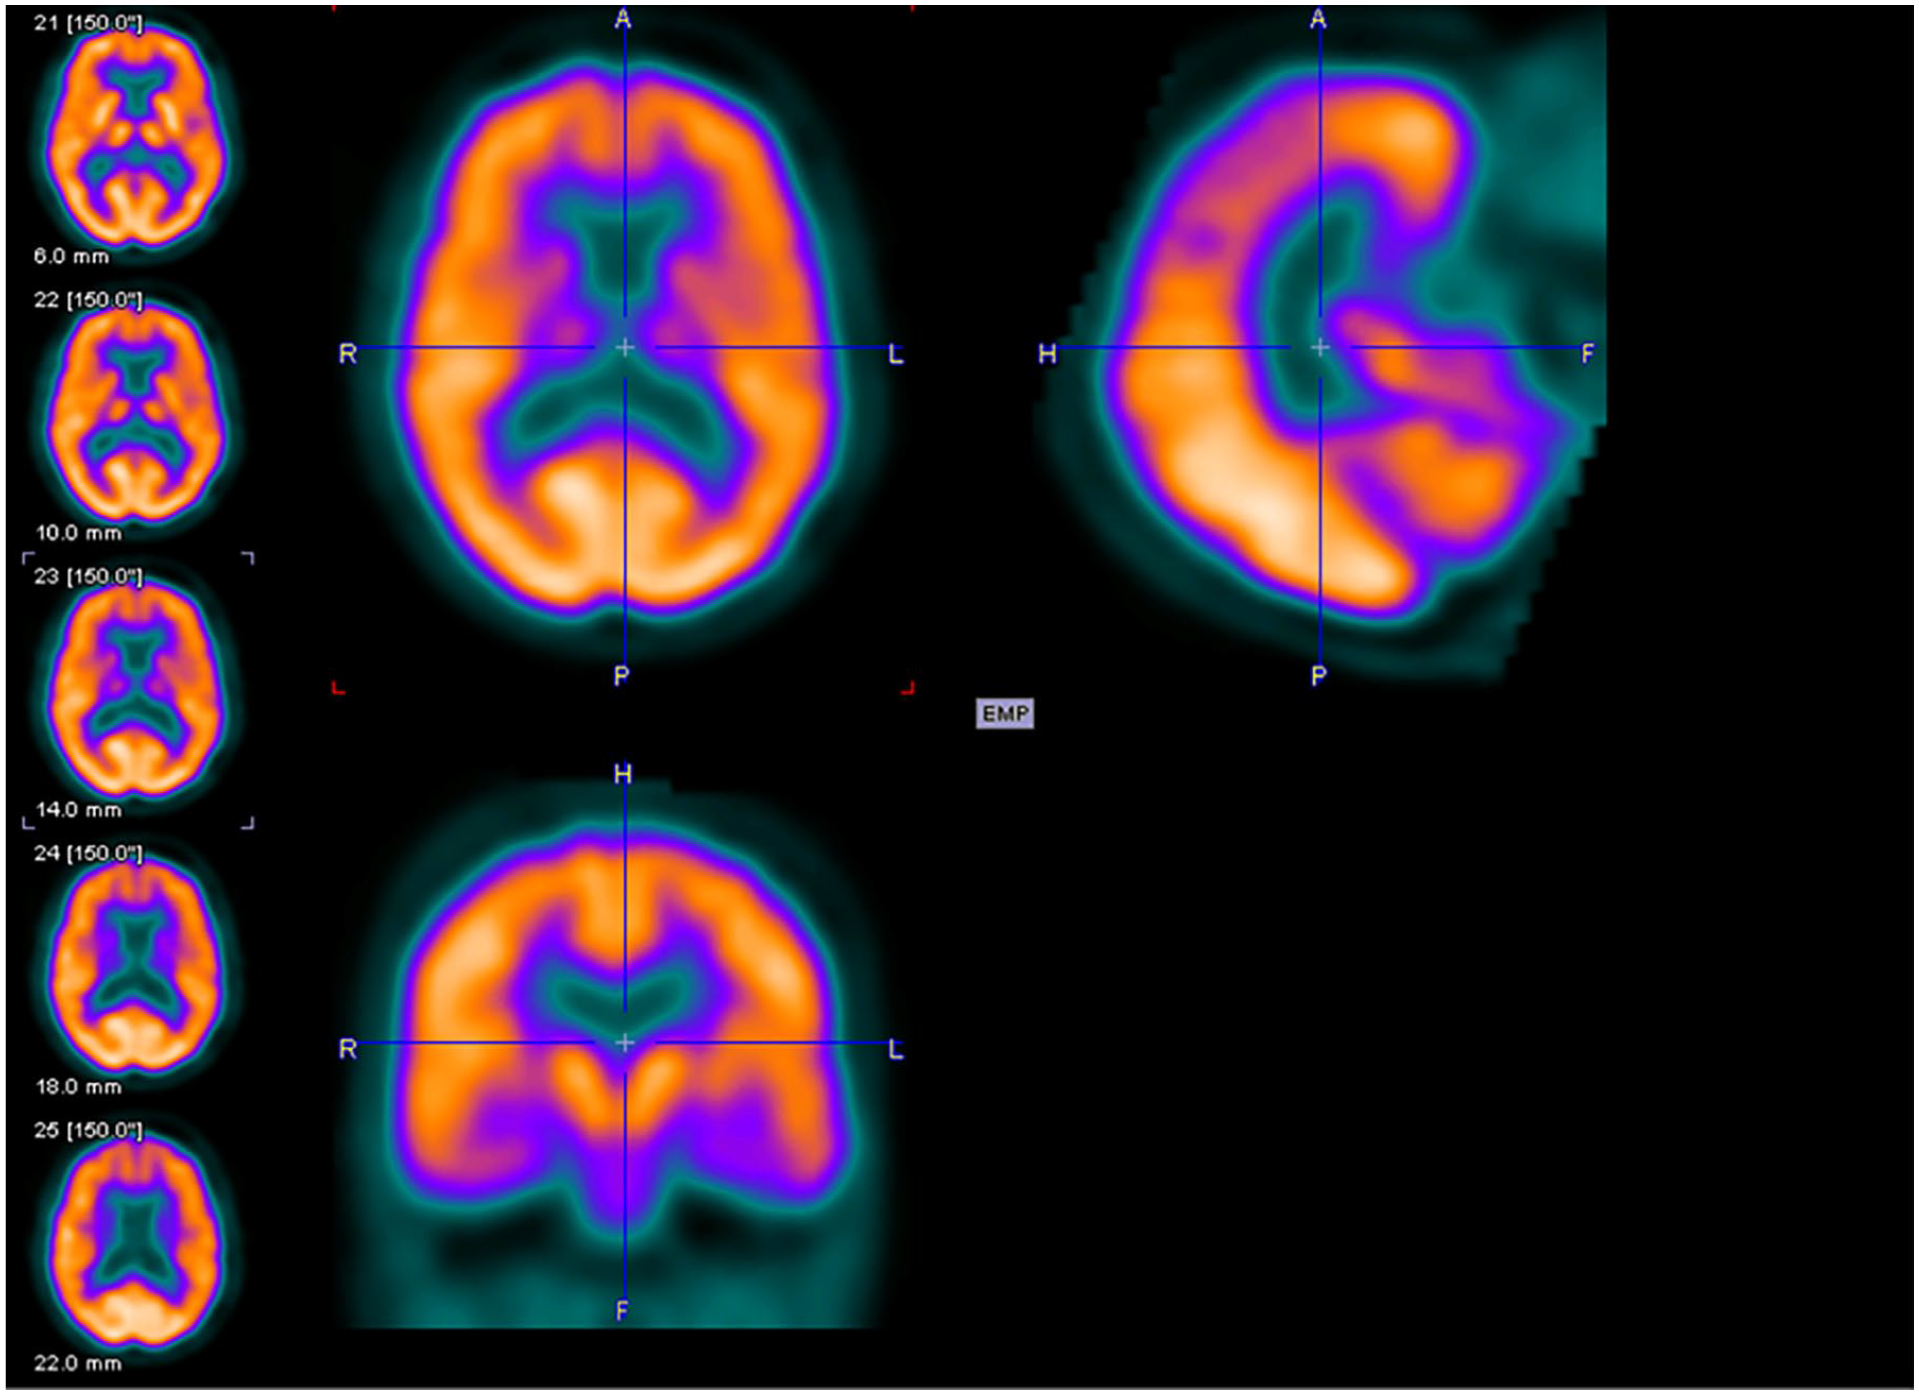
Axial (above left), sagittal (above right), and coronal planes (below left) of fluorodeoxyglucose–positron emission tomography (FDG-PET) imaging of an 81-year-old female with Mini-Mental State Examination (MMSE) score of 26.
Axial (above left), sagittal (above right), and coronal planes (below left) of fluorodeoxyglucose–positron emission tomography (FDG-PET) imaging of a 69-year-old male with Mini-Mental State Examination (MMSE) score of 20.
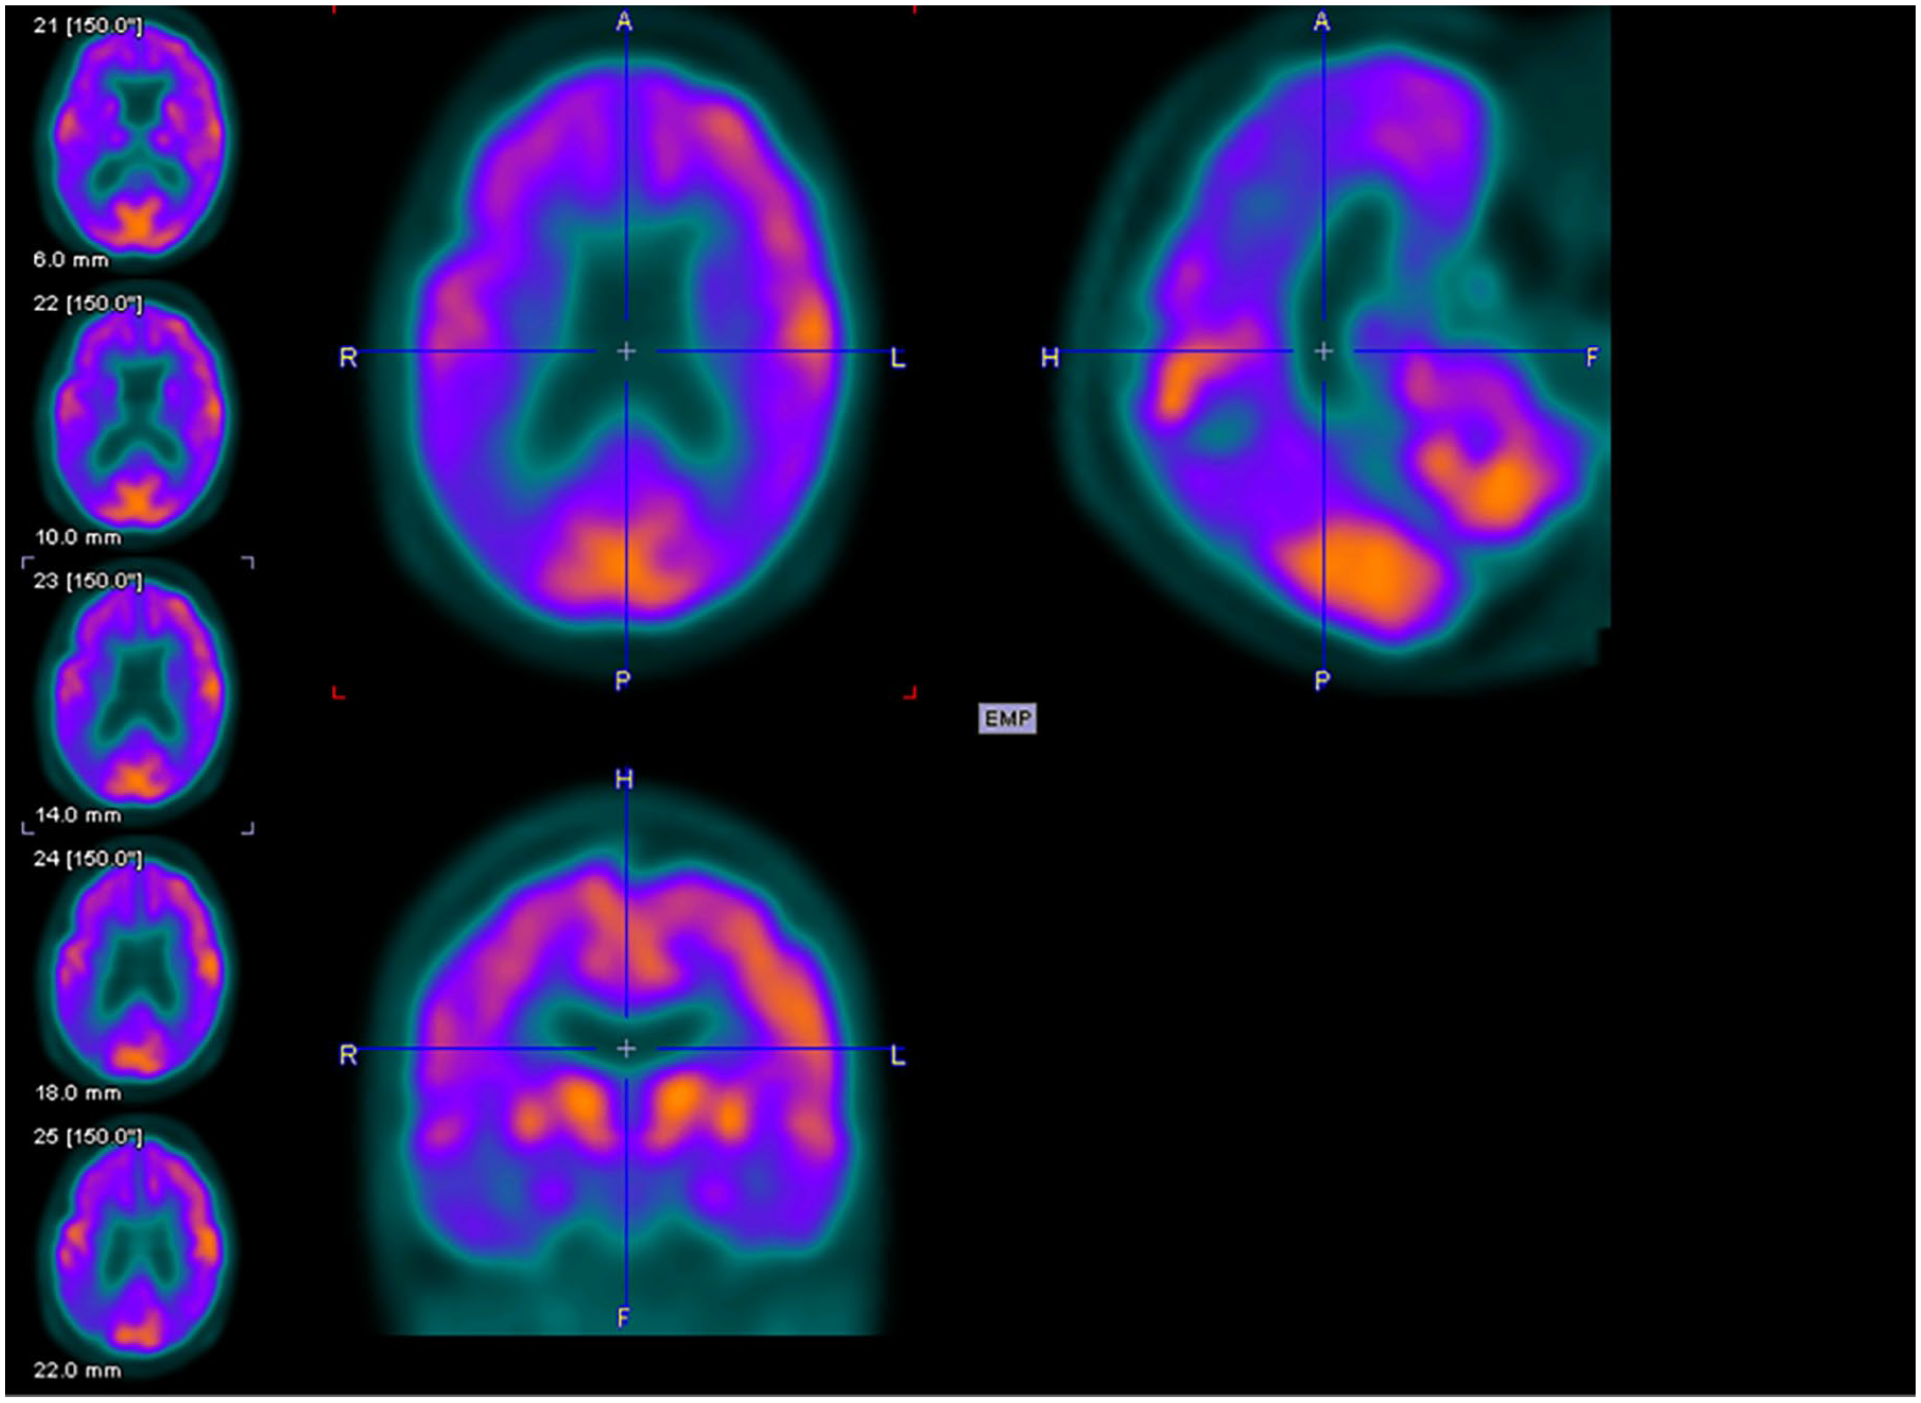
Axial (above left), sagittal (above right), and coronal planes (below left) of fluorodeoxyglucose–positron emission tomography (FDG-PET) imaging of an 81-year-old female with Mini-Mental State Examination (MMSE) score of 14.
There have been many studies evaluating the role of metabolic imaging in AD. The focus of research has shifted to early stages of AD especially in its prodromal phase of amnesic MCI and more recently to preclinical dementia (Bilgel and Resnick 2020). MCI is defined as cognitive decline, higher than expected for a particular age without interfering with activities of daily living (Gauthier and others 2006). It has been estimated that approximately 10% to 15% of patients with amnesic MCI progress to AD annually (Jack and others 2010; Jack and others 2012). A higher chance of conversion from MCI to AD, a greater brain atrophy and poorer cognition have been noted in amyloid- and tau-positive individuals with reduced FDG uptake on PET (Ou and others 2019).
Patients with MCI have a range of abnormalities, with hypo-metabolism ranging from a pattern of mild deficits to more extensive metabolic reduction and cognitive resilience mitigates the effect of neurodegenerative pathologies on the onset and severity of cognitive symptoms (Stern 2012). Analysis of glucose reduction pattern can have predictive value when considering conversion of MCI due to AD pathology to AD in the future. It has been suggested that FDG-PET generally has a higher accuracy than MRI for diagnosing early AD despite difficulty in detection of hypo-metabolic pattern on FDG-PET visually (Matsunari and others 2007). It has been noted that both more severe and progressive hypo-metabolism on FDG-PET in MCI patients are associated with a faster progression to AD (Landau and others 2011; Zhang and others 2012). A group of researchers have developed a hypo-metabolic convergence index (HCI) to denote the extent of cerebral glucose metabolism on FDG-PET corresponding to patients with AD. The HCI could discriminate people with AD from MCI and healthy controls and in turn can predict MCI to probable AD progression (Chen and others 2011). It has also been stated that FDG-PET can be used as a surrogate endpoint in the evaluation of treatment response in clinical trials of novel drugs in AD (Chen and others 2010). Effectiveness of FDG-PET in monitoring progression of AD and the close relationship with clinical symptoms, has resulted in its use in selection of participants and outcome assessment in AD and other dementia-related clinical trials (Chow and others 2013; Potkin and others 2001).
Amyloid PET Imaging in AD
The amyloid-β plaque deposition in patients with AD, lead researchers to develop experimental radiotracers, specific to amyloid such as Pittsburg compound B (PiB). It has been demonstrated using amyloid PET imaging that amyloid deposition starts around 15 years before the development of clinical manifestations of dementia or MCI (Jack and others 2013; Villemagne and others 2013). However, a recent study, demonstrated that subtle cognitive decline precedes amyloid accumulation (Elman and others 2020) thus paving the way for further research to gain better insight.
The currently used criteria from the Amyloid Imaging Task Force (Johnson and others 2013) stated that the use of amyloid PET should be restricted to situations with significant diagnostic ambiguity and its use has potential to alter management by increasing diagnostic certainty. However, amyloid positivity does not equate to cognitive decline or a clinical diagnosis of dementia and can be found in cognitively healthy people (Jansen and others 2015) making it difficult to define a clear role of amyloid PET in clinical practice.
For the purpose of amyloid imaging, 11-C labeled PET tracer PiB was used initially in human beings (Klunk and others 2004). However, the short half-life of 11-C of 20 minutes restricts its use in clinical practice, as it requires close proximity to a cyclotron and radiochemistry facilities. High-affinity binding of PiB specifically to insoluble fibrillary Aβ makes it suitable for in vivo detection of Aβ. Notably, specific binding of PiB to cortical areas has been noted in more than 90% of people with AD (Rabinovici and Jagust 2009). Furthermore, to overcome the limitations of 11-C, three [18F]-labeled tracers with relatively long half- life of 110 minutes have been investigated in clinical trials and they have been developed for commercial purposes. The 3′-fluoro-derivative, [18F]flutemetamol, stilbene derivative [18F]florbetaben, and styrylpyridine derivative [18F]florbetapir reveal high-affinity binding very similar to PiB for fibrillary amyloid (Hatashita and others 2014; Morris and others 2016). [18F]florbetapir exhibits high accuracy in detecting deposition of brain amyloid and has been approved by the U.S. FDA in 2012, to be used for investigating AD or other causes of cognitive impairment. Furthermore, [18F]flutemetamol and [18F]florbetaben have been approved by the U.S. FDA in 2013 and 2014, respectively (Clark and others 2011; Filippi and others 2018).
Clinical amyloid PET image interpretation is based on the presence of uptake in cortical gray matter (Figure 5). Moderate to frequent amyloid tracer deposition on visual analysis has been interpreted as positive for AD, with absent or minimal amyloid tracer deposition on PET interpreted as negative for AD. For research purposes, region-specific accumulation of the amyloid tracer is assessed, using the cerebellum for normalization (Schwarz and others 2017; van Berckel and others 2013). Other areas like the pons, centrum semiovale, or cerebellar white matter can also be used as reference regions. For the purpose of semiquantitative analysis, the ratio of the reference region and region of interest (ROI) is calculated. This is called the standardized up- take value ratio (SUVR). The value of SUVR depends on the ROI, radiotracer and the reference region chosen. A threshold is selected based on receiver operating characteristic (ROC) curve and SUVR of ROI greater than the threshold, is then regarded as positive for Aβ deposition (Thurfjell and others 2014). In an attempt to identify the neural basis of executive function in amnestic MCI subjects according to Aβ positivity, it was concluded that disease progression was associated with Aβ burden in different brain regions. The impairment of executive function in Aβ- was closely associated with anterior cingulate cortex (ACC), whereas Aβ+ were highly correlated to AD related brain regions. Interestingly, clinical progression in Aβ− and Aβ+, was associated with ACC and the posterior cingulate cortex (PCC), respectively (Yoon and others 2019).
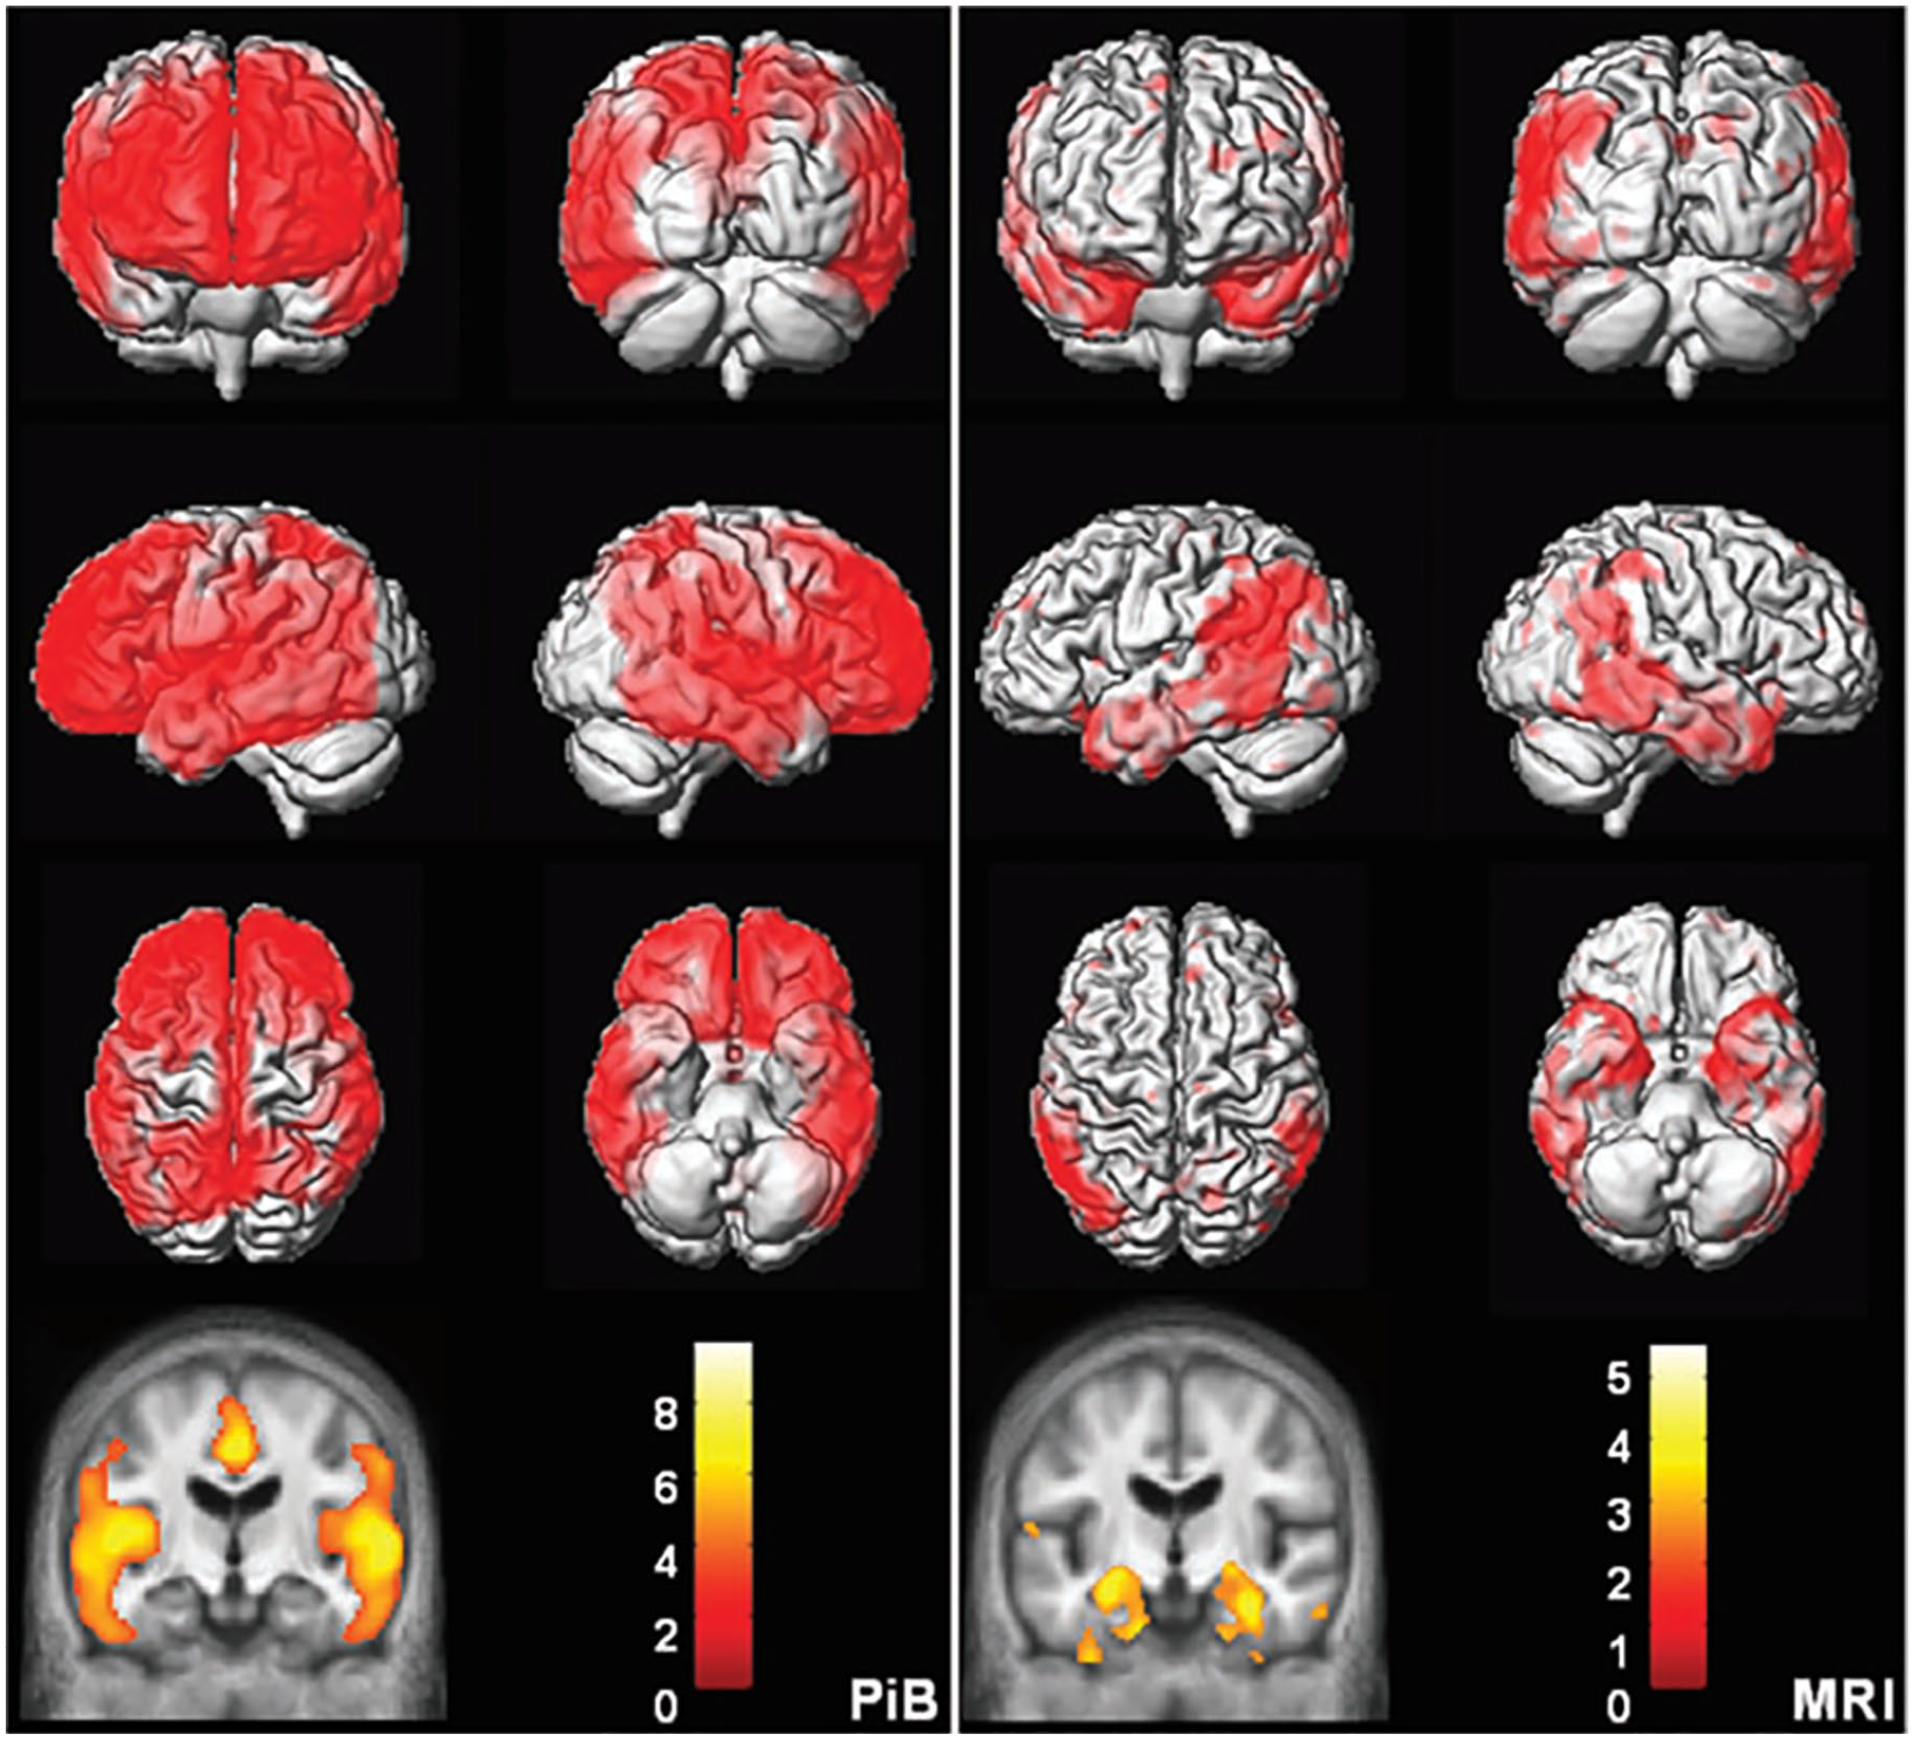
Topographic differences between amyloid and neurodegeneration. Alzheimer’s disease versus cognitively normal voxel mapping. Pittsburgh compound B (PiB) (left) statistical parametric mapping (SPM) of PiB retention ratio. MRI (right) voxel-based morphometry (VBM) of MRI gray matter density. Plaque deposition but not gray matter loss is seen in the prefrontal cortex while gray matter loss but not plaque deposition is seen in the medial and basal temporal lobes. Reproduced with permission (Jack and others 2008).
Quantitative analysis of amyloid tracer uptake on PET has been used to monitor the therapeutic response in clinical trials of novel drugs. Recently, 165 subjects with a diagnosis of prodromal or mild AD treated with a human monoclonal antibody, aducanumab, which target aggregated Aβ were included in the study and found a reduction in Aβ plaques on [18F]florbetapir PET using a regional analysis of SUVR change (Sevigny and others 2016). Moreover, another drug, Verubecestat is an oral β-site amyloid precursor protein–cleaving enzyme-1 (BACE-1) inhibitor that reduces the Aβ level, clinical trials of which have used amyloid PET to evaluate treatment response (Egan and others 2018). For the past 25 years, most of the clinical trials involving AD have focused on Aβ, based on the hypothesis that the progression of AD begins following Aβ accumulation, resulting in synapse loss and neuronal cell death. Clinical trials of novel drugs that help reduce the formation of Aβ or enhance clearance, have partly achieved this aim but remain unsuccessful in improving cognitive function or slowing cognitive decline (Oxford and others 2020).
Many people with AD may show cortical uptake on amyloid PET in the cingulum, precuneus and frontal, parietal, and lateral temporal cortices (Wolk and Klunk 2009). It is included in research criteria for the diagnosis of AD. However, the timing of amyloid deposition specific to AD is not clear as previously it was thought that deposition begins at a very preclinical stage (Jack and others 2013). Recently, contradictory evidence has emerged indicating that cognitive impairment may precede the amyloid deposition and can predict the amyloid positivity (Elman and others 2020). Furthermore, amyloid deposition is not pathognomonic for AD and it can be found in those who are cognitively normal (Jansen and others 2015) or those who have other neurodegenerative diseases. However, evidence suggests that MCI to AD conversion risk is higher in people having positive results on amyloid PET. Interestingly, negative amyloid PET has a high negative predictive value for conversion to AD in MCI subjects (Nordberg and others 2013; Okello and others 2009) and the conversion time is inversely correlated with Aβ deposition (Hatashita and Wakebe 2017). Although amyloid deposition on PET and hypo-metabolism FDG-PET are thought to be equally specific, it has been suggested that amyloid PET is more sensitive for the diagnosis of AD (Rabinovici and others 2011). A significant negative correlation between [18F]florbetaben and FDG-PET uptake in temporal and parietal lobes bilaterally was found recently suggesting amyloid burden corresponds to hypo-metabolism on FDG-PET (Chiaravalloti and others 2018). Amyloid PET was not considered to be useful in routine clinical practice in patients with AD previously, but recent studies have evaluated the role of amyloid PET especially [18F]flumetamol in clinical practice and reported that amyloid PET has clinical utility in ascertaining diagnosis of dementia, differential diagnosis, clinical decisions like change in diagnosis and influencing change in management plan (Leuzy and others 2019b; Zwan and others 2017) and long-term prediction of dementia (Hanseeuw et al., 2020). Moreover, clinical utility of amyloid PET has been investigated recently in distinguishing cerebral amyloid angiopathy (CAA) from cognitively healthy population and hence negative amyloid PET scan may help rule out the conditions with CAA including AD in future (Charidimou and others 2017).
Tau PET Imaging in AD
Recent reports on the role of PET in cognitive impairment and dementia have focused on the role of tracers that demonstrate cerebral tau burden (Figure 6). Tau proteins encompass six isoforms ranging from 352 to 441 amino acids and help stabilizing the microtubules which are responsible for intracellular transport and cytoskeletal support. Tau proteins are further subdivided into two groups consisting of number of repeats (3R, 4R) based on microtubule-binding domains (Buée and others 2000). In its pathological state, tau becomes hyper-phosphorylated and accumulates as intraneuronal neuro-fibrillary tangles (NFTs). The distribution of NFTs forms the basis of Braak’s pathologic staging of AD and this is correlated with cognitive impairment (Braak and Braak 1991). Moreover, in comparison to amyloid plaques, NFT density has been found to be strongly associated with brain atrophy, impairment in higher mental functions and synaptic dysfunction in people with AD (Guillozet and others 2003). In a recent study in younger people with AD related pathology, tau was found to be present much earlier than amyloid pathology and, contrary to most of the previous studies, it seems that tau may be responsible for initiation of the disease process in AD (Yoshida and others 2019).
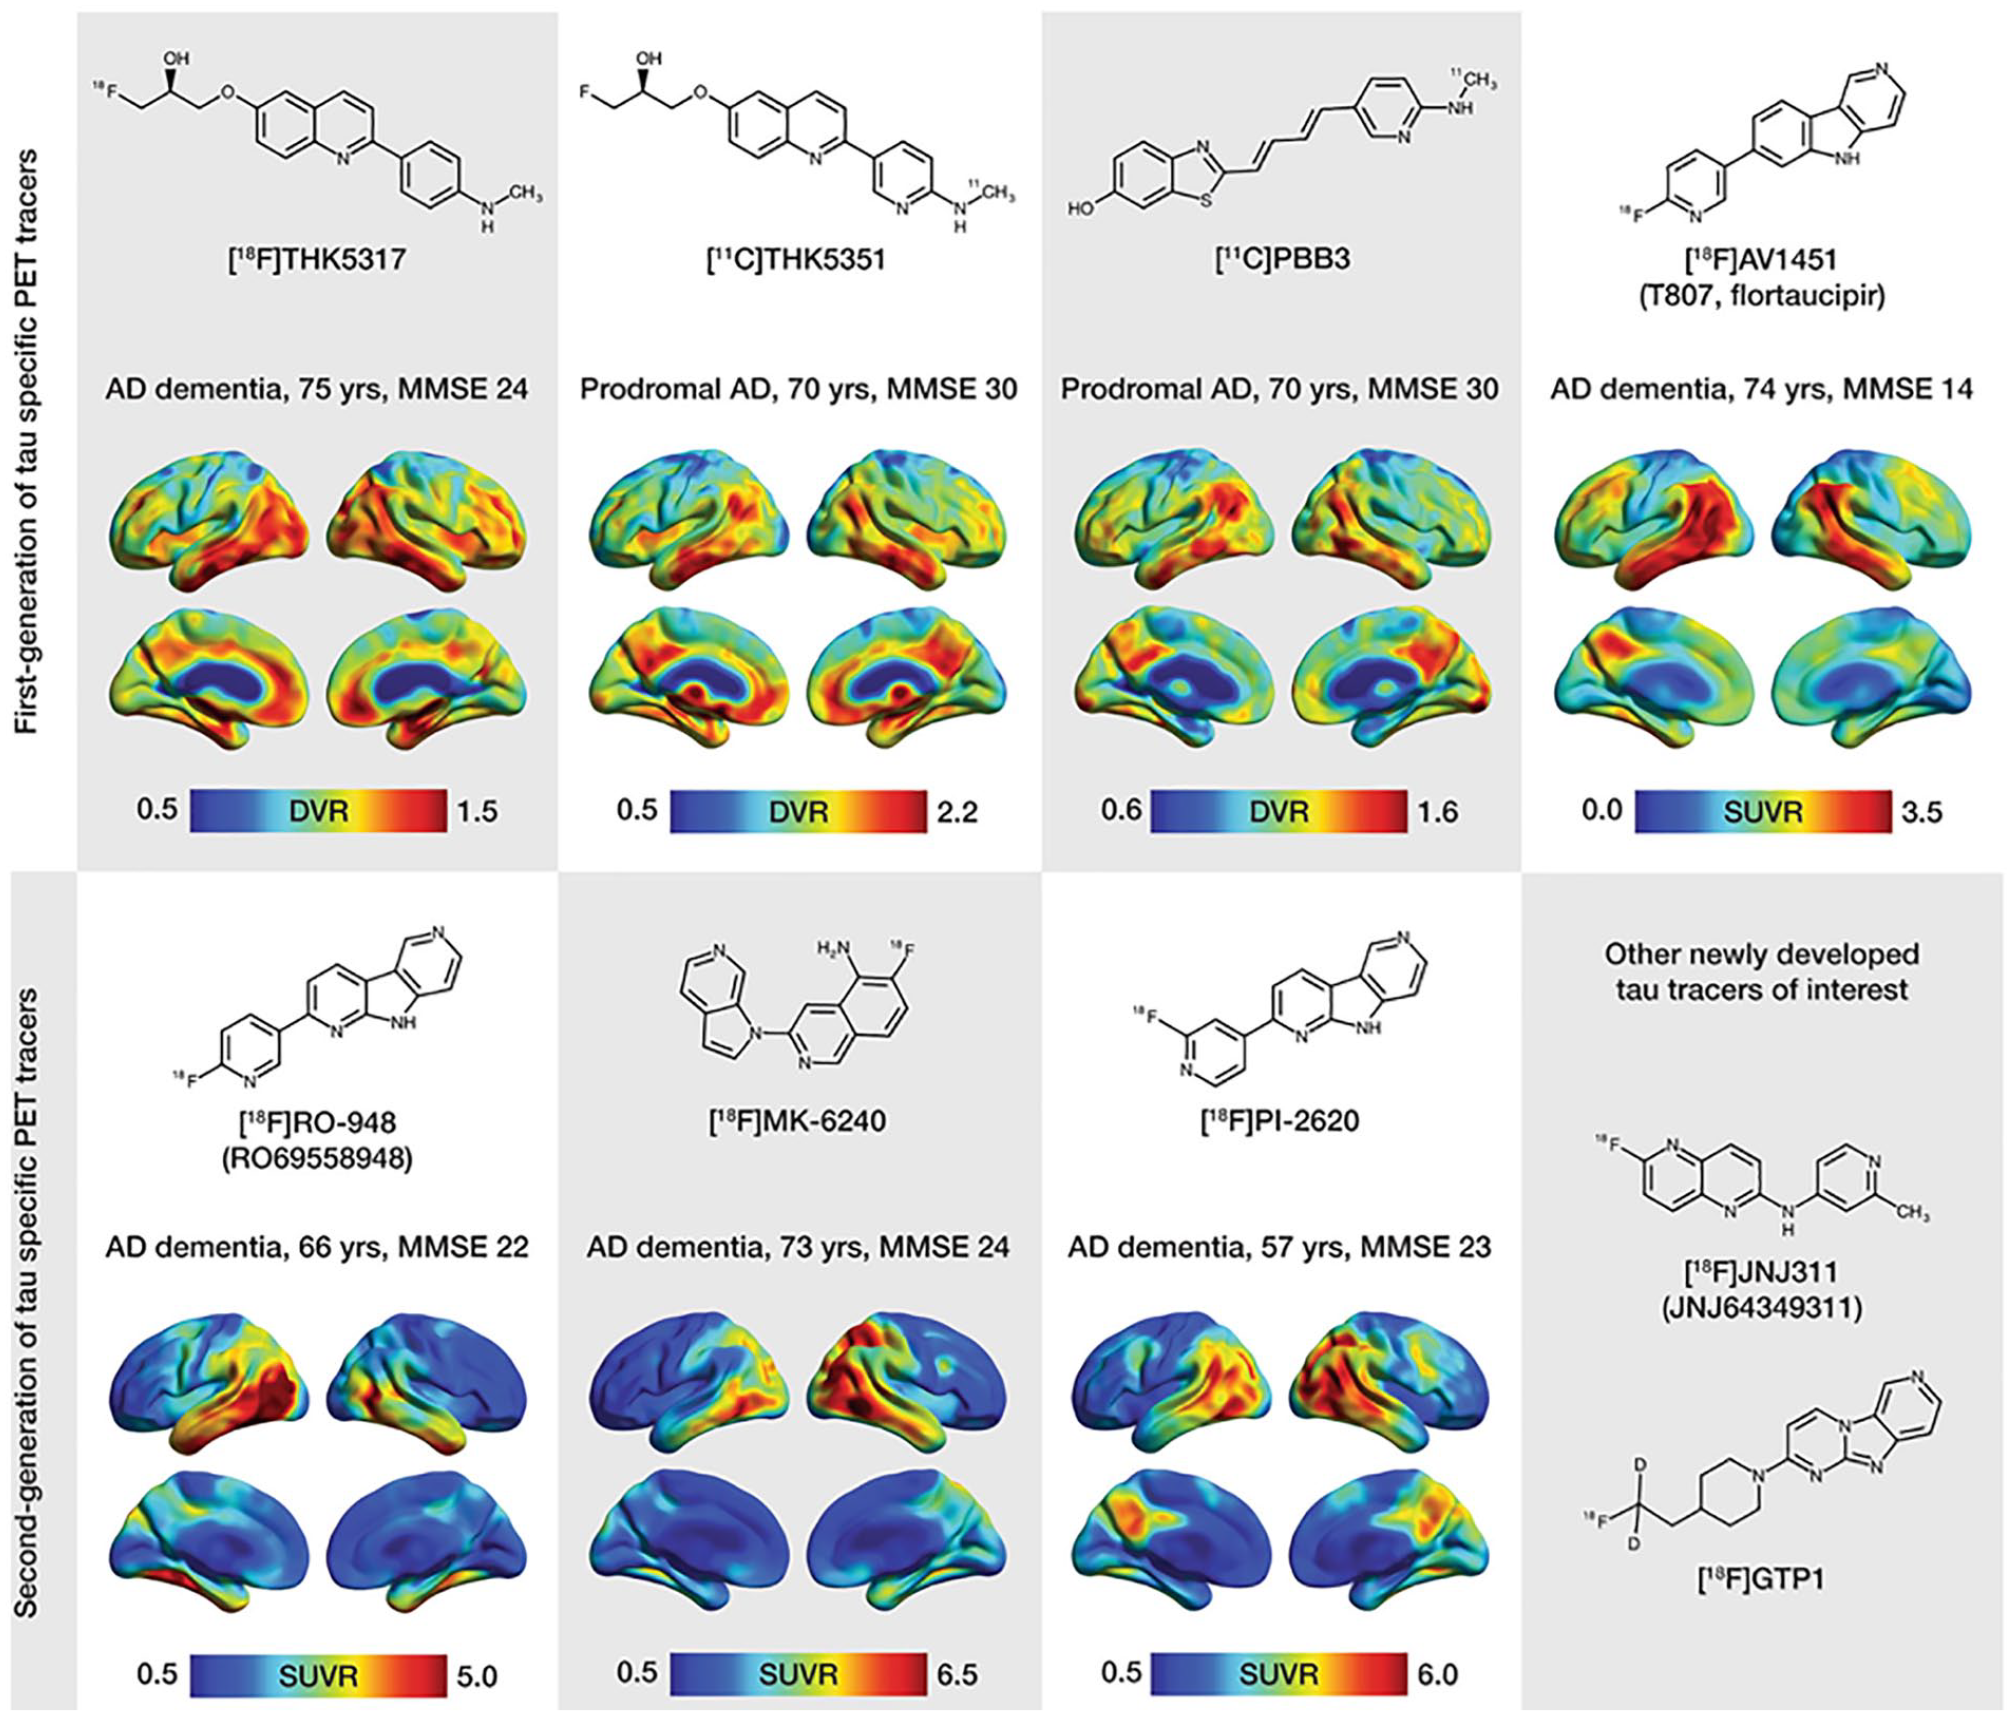
Chemical structures and representative uptake images in amyloid-β-positive Alzheimer’s disease (AD) patients using selected first-generation (upper portion of the figure) and second-generation (lower portion of the figure) tau positron emission tomography (PET) tracers. The characteristics in terms of clinical research diagnosis, age, and Mini-Mental State Examination (MMSE) scores are presented for each patient above the respective image. For the creation of parametric images for all tracers, areas of the cerebellar cortex were used as reference. Reproduced with permission (Leuzy and others 2019a).
Following the failure of anti-amyloid therapies for AD, various radiotracers have been developed recently to target tau pathology, lead to paradigm shift toward tau as a therapeutic target (Giacobini and Gold 2013). The earliest radiotracer to target tau in vivo was [18F]-labeled THK-523 or ([18F]-6-(2-fluoroethoxy)-2-(4-aminophenyl)quinoline) but unfortunately, a very high retention in white matter precludes its use in research or clinical trials (Fodero-Tavoletti and others 2011; Villemagne and others 2014). Furthermore, several [18F]-labeled arylquinoline derivatives were developed as candidate tau PET radiotracers such as [18F]THK-5105 and [18F]-THK-5117 (Harada and others 2015; Okamura and others 2014). [18F]THK-5351, a recent radiotracer, has shown to improve tau binding affinity with better imaging characteristics and lower white matter retention than other THK radio-ligands from the series (Harada and others 2016). Furthermore, benzimidazole pyrimidine derivatives a different type of radiotracers namely, [18F]AV-1451 (T807) and [18F]AV-680 (T808) have been developed (Chien and others 2013; Zhang and others 2012). Interestingly, these tracers have low retention in white matter and evident high affinity for paired helical tau aggregates. Furthermore, [18F]AV-1451 showed distribution of tau pathology according to Braak staging (Cho and others 2016; Marquié and others 2017). Other radiotracers, namely pyridinyl-butadienyl-benzothiazole derivative 11-C-PBB3 and pyrrolo-pyridine-isoquinolone amine derivative MK-6240 have shown a noticeable promise for detection of tau pathology (Hostetler and others 2016; Maruyama and others 2013). Notably, MK-6240 has shown minimal radiotracer uptake in normal brain tissue (Hostetler and others 2016). There are a few newer radiotracers such as [18F]RO-948 (previously referred to as [18F]RO69558948), [18F] PI-2620, [18F]GTP1, and [18F]JNJ64349311 (Declercq and others 2017; Gobbi and others 2017; Leuzy and others 2019a; Sanabria Bohórquez and others 2019) have been used for tau imaging. Moreover, accumulation of tau in the medial temporal lobe is independent of Aβ deposition and is related to age, whereas outside the medial temporal lobe, it is correlated with Aβ deposition (Lockhart and others 2017; Pontecorvo and others 2017). Of note, AD patients demonstrated higher ligand retention in the key brain areas affected by AD pathology, namely medial frontal, temporal, inferior parietal cortices in comparison to normal healthy controls (Wong and others 2018). Hence, it has been suggested that tau imaging may be suitable for the accurate staging of AD (Schwarz and others 2018) and could be useful in assessing its prognosis.
Conclusion
FDG-PET continues to have a role in diagnosis, prognosis, and monitoring the effects of therapeutic interventions in AD. Amyloid PET has been used in the clinical trials of novel drugs that help reduce formation of Aβ or enhance clearance but in the absence of favorable outcome, the role of amyloid PET tracers is unclear. However, usefulness of amyloid PET in the diagnosis of CAA, can justify its clinical utility in future. Failure of anti-amyloid therapies for AD, lead to paradigm shift toward tau as a therapeutic target and it can be predicted that development and application of tau PET tracers will allow more specific assessment of patients with AD and related taupathies. Despite these differences, it is hoped that PET imaging will improve diagnostic specificity and targeted therapy of AD.
Footnotes
Declaration of Conflicting Interests
The author(s) declared no potential conflicts of interest with respect to the research, authorship, and/or publication of this article.
Funding
The author(s) received no financial support for the research, authorship, and/or publication of this article.