
Abstract
The study of complex systems deals with emergent behavior that arises as a result of nonlinear spatiotemporal interactions between a large number of components both within the system, as well as between the system and its environment. There is a strong case to be made that neural systems as well as their emergent behavior and disorders can be studied within the framework of complexity science. In particular, the field of neuroimaging has begun to apply both theoretical and experimental procedures originating in complexity science—usually in parallel with traditional methodologies. Here, we illustrate the basic properties that characterize complex systems and evaluate how they relate to what we have learned about brain structure and function from neuroimaging experiments. We then argue in favor of adopting a complex systems-based methodology in the study of neuroimaging, alongside appropriate experimental paradigms, and with minimal influences from noncomplex system approaches. Our exposition includes a review of the fundamental mathematical concepts, combined with practical examples and a compilation of results from the literature.
Introduction
One of the central aims of contemporary neuroimaging is to unify the models of neural structure and function in order to shed light, not just on the evolutionary organization of the brain, but also on its output, emergent behavior, as well as on its disorders. Intuitively, one would expect the etiology of brain disorders to be mainly driven by a few dominant anatomical regions. However, evidence accumulated in recent years has unraveled a different picture. In fact, most studies indicate that the functional and structural variance in the human brain—during normal functioning, development, ageing, and disease—tends to be widely distributed and can hardly be attributed to a set of specific regions (Ecker and others 2010; Thompson and others 2001; Zhuo and others 2019). These findings have influenced the paradigms used to interpret neuroimaging data, which are gradually evolving from phrenological perspectives—that aimed to find associations between the variance in the data and parsimonious sets of regions (see Donaldson 2004; Uttal 2001, for two contrasting views on the subject)—to embrace distributed analyses (Sporns 2011a) that map the data into regional regulatory networks. This latter approach has been borrowed from the rich literature of complexity science whose main aim is to progress our understanding of the essential features of complex systems. These two perspectives currently coexist in neuroimaging analyses, and their tools are used, sometimes interchangeably, on similar datasets or within the same study (Brauchli and others 2019; Hebart and Baker 2018; Pillet and others 2019).
In this work, we combine a number of mathematical concepts with practical examples and observations from the literature to build a case in favor of the use of complexity science analytics to study the brain through neuroimaging techniques. We aim to demonstrate that if the brain is a complex system, and there is strong evidence that it is, then the use of traditional models may not fully describe the outcomes of imaging experiments. This issue, we believe, is one of the key drivers behind the lack of robustness, replicability, and, ultimately, poor interpretability of a significant portion of contemporary neuroimaging studies. As a solution, we suggest that when a model of complexity is adopted, the choice of concepts and tools should be embraced together with appropriate experimental designs
The Brain as a Complex System
While the exact definition of a complex system is still under debate (Ladyman and others 2013), there is consensus on four properties that all systems characterized as “complex” necessarily share. These properties are as follows (Jensen 1998):
Multiplicity. A complex system is made up of a large number of components, each of which interacts with its neighboring components in relatively simple ways.
Nonlinearity. The interactions between components are nonlinear, for example, changes in the output are not always proportional to the corresponding changes of the input.
Self-organization. The system self-organizes spontaneously in the absence of any form of centralized control.
Emergence. The system exhibits emergent behavior, that is, the macroscopic behavior cannot be understood purely in terms of the microscopic interactions (Turkheimer and others 2019). Rather, the emergent behavior may result from (a) multiscale 1 organization; (b) information processing capability; (c) dynamical spatiotemporal patterns; and (d) evolution.
Of these four properties, multiplicity and nonlinearity can be seen as the fundamental enablers that—in the right circumstances—allow self-organization and emergence to happen.
This article analyses the idea of the brain as a complex system, exploring each of these four properties under the light of recent evidence provided by contemporary neuroscience. It is to be noted that these properties have been studied in depth in the neuroscience literature (Bassett and Gazzaniga 2011; Bullmore and others 2009; Deco and others 2011; Friston 2009; Kelso 1995; Sporns 2011b; Telesford and others 2011); of these references, the ones that are of practical use (Bassett and Gazzaniga 2011; Kelso 1995; Sporns 2011a) do not have general but rather specific content, while those with more ambitious and general scope (Friston 2009; Tononi and others 1994; Wolfram 2002) still have limited practical value. Here we wish to present a unified and simplified account that looks at the four properties above with their interrelationships and consequences in experimental neuroimaging. An introductory brief for each of the four properties is presented in Boxes 1 to 4.
Box 1. Multiplicity
A dynamical system that consists of a large number of interacting components can arrange itself in a variety of configurations—so-called “microstates”—and the total number of these microstates is known as its “multiplicity.” We can, for instance, consider a simple dynamical system that consists of only three components that can each take two states: blue or red. One possible state of this system is shown on the right. In general, the multiplicity Ω of any system is given by the following relationship:

or in words: the multiplicity is the number of possible states each element is able to take, to the power of the number of components comprising the system. For our three-component toy model, the multiplicity is

 Given the simplicity of this system, we can show all of the possible combinations on the left. However, for any real system composed of millions of interacting components this would not be feasible, which is when one needs to treat the system in question via statistical tools. One of the central quantities in statistical physics is the Boltzmann entropy S:

or in words: the entropy of a system is proportional to the logarithm of its multiplicity. Thanks to the properties of logarithms, one can find that the Boltzmann entropy satisfies the following property:

which implies that the entropy of a system grows linearly (see Box 2) with the number of its constituent components.
Here we provide evidence that (A) brain activity, even during simple functional tasks, is associated with very large and distributed networks that (B) dynamically interact and form transient states.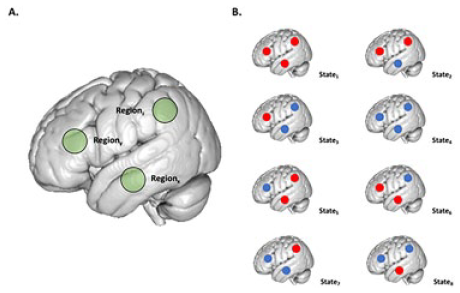
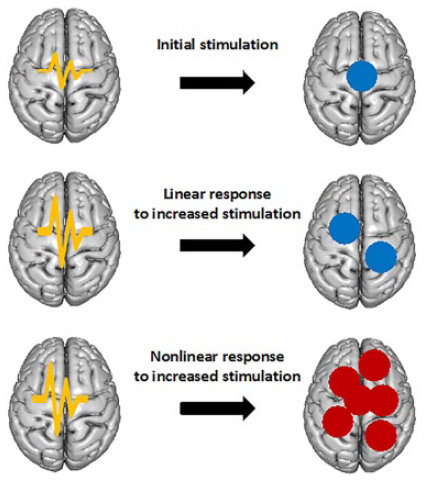
Box 2. Nonlinearity
A good way to describe a nonlinear system is to describe what it is not—that is, linear. Linearity means that whatever a system receives as input, it will return in proportional amounts as an output, see top two rows of the figure below.
Linear systems are easy to deal with due to their mathematical simplicity and associated computational expediency when used in numerical applications. In contrast, a nonlinear system does not respond in such a simple way, in that it will produce an output that is not directly proportional to its input. Using a similar example as above, the now nonlinear system in the bottom row of the figure below receives the same input as the linear response in the middle row, but its output is not proportional to the magnitude of the input anymore.
Most natural phenomena are nonlinear and are therefore better described by similarly nonlinear equations. However, we pay the price for the complexity in these expressions by the associated increase in computation time.
In the case of neural systems, the couplings between stimuli and measurements are generally nonlinear, where these measurements are taken from the small-scale electrophysiological recordings to the large-scale functional imaging data. For |computational feasibility, linear analytical models are at times used as an approximation of the underlying nonlinear dynamics.
Box 3. Self-Organization
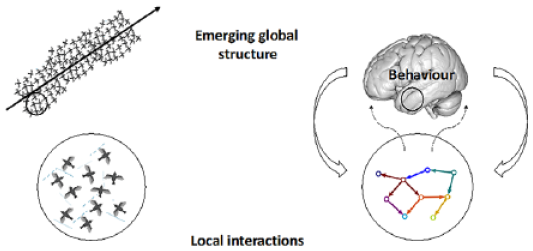
It is sometimes possible for a coherent organization to emerge within a dynamical system that is initially in a disordered state. This organization manifests itself at large spatial scales by virtue of local interactions among the system’s constituent components. This phenomenon is known as self-organization and it relies upon the dynamical system in question possessing four essential attributes:
1. There must be a balance between exploitation and exploration. This feature of any self-organizing system means that its interacting elements are able to strike an equilibrium between their tendency to (a) remain within their current region and exchange energy with their environment (exploitation) and (b) venture into new territories within the system (exploration).  As seen in the diagram on the left, these two attributes can balance to allow the system to form an ordered state.
2. The system must be nonlinear (see Box 2). Briefly, this means that the strength of an input into the system is not proportional to the strength of its output.
3. There must be a large number of small-scale (local) interactions. The contribution of each of these interactions is vanishingly small (right diagram), but together they are able to form a large-scale system with the appearance of organization. 
4. The system must be able to resist the tendency toward disorder (via the second law of thermodynamics) by the availability of sufficient energy to maintain self-organization.
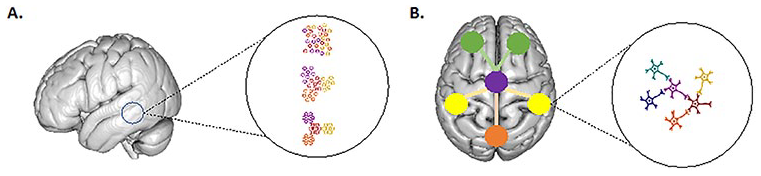
Brain tissue is currently thought to present self-organization at every scale from the local cortical unit (A) to the larger integration of cortical areas (B) and its organization principles are similar at every scale.
Box 4. Emergence
During the process of self-organization, the interaction among elements generates an organized system with properties referred to as being “emergent.” These properties are unique to complex systems and can be summarized by the following three points:
1. Emergent properties cannot be explained solely by the physical attributes of the components which comprise the system.
2. Once generated via interactions between constituent components, the emergent properties operate and interact with the environment via laws that are not reducible to those of the interacting elements.
3. The emergent properties supersede previously dominant properties of the system and may become the most important factor in determining the behavior of the interacting elements—as indicated by the large downward-pointing arrows on the right of the diagram below.
The brain is organized in a hierarchy of spatial scales from the cellular milieu (e.g., blood vessels, neurons, and glia) to brain tissues, nuclei, and cortical layers (Box 3), which, ultimately, are then further arranged into cyto-architectonic regions. Within this hierarchy, each layer exhibits a function that seems to “emerge” from the function of layers at smaller scales. It follows that the top level of this hierarchy, human behavior, emerges from interactions within and between these different spatial scales.
From Phrenology to AN Extended View of Neuroimaging Models
Let us start by considering the nature of the various parts that make the brain, which is related to the first property of complex systems. One of the longest-standing challenges in neuroscience is to decipher how variation in neural systems—both structural and functional—maps onto variation in behavioral phenotypes. The initial approach used in the analysis of imaging data was heavily influenced by a highly localized perspective relating neural and phenotypic variability (Uttal 2001). Its use stemmed from the success of neurology/neuropsychology at making differential diagnoses, relating dissociable cognitive/perceptual disorders to apparent localized damage. Even though the localized damage was just a partial view of the underlying pathology, it facilitated the easy intuition that there is a clear mapping between form and function. As a consequence, it focused on the use of mass univariate testing to map brain correlates of such phenotypic variation (Friston and others 1991; Worsley and others 1996). This paradigm triggered a long and enduring controversy, facing those with the view that it is paramount to protect results from false positives by using stringent significance thresholds (Eklund and others 2016), against those concerned about the loss of information due to high rates of false negatives (Lieberman and Cunningham 2009). To a large extent, this discussion stems from conceptual differences in the a priori expectation of the distribution of the brain’s signals associated with a certain phenotype. Whereas the former position assumes that variability is highly concentrated in very few brain loci, the latter expects wider associations across brain networks.
Interestingly, this debate is reminiscent of a similar discussion that took place in the early 1900s among geneticists, who were divided between the Mendelians—those inspired by Mendel’s work on pea genetics and saw phenotypes as the result of discrete, monogenic variants—and the biometricians—who did not accept that the inheritance of a continuous distribution of traits (e.g., height, intelligence, etc.) could be related to individual genes. At the time, R. A. Fisher resolved the issue by presenting his seminal work on the infinitesimal model (Fisher 1918), in which the inheritance of continuous traits could be explained by large numbers of variants, each of infinitesimal effect. In this theoretical work, Fisher conjectured that a large number of loci should be associated with what, at the time, were termed “complex traits.” Only about 50 years have passed since the first genetic markers allowed for the detection of variants that have major effects, and only 20 years since single-nucleotide polymorphism technology provided dense markers throughout the genome. The combination of technological advancements, cost reductions, and increased sample sizes has allowed for the gradual expansion of models describing the genetic foundations of complex traits. It is now generally accepted that common single-nucleotide polymorphisms with small individual effect sizes—generally below the statistical significance levels of experimental designs—account for most of the variability of common genetic traits (Goldstein 2009; Shi and others 2016; Yang and others 2010). Equally, complex disorders that are defined over a clinical spectrum demonstrate similarly broad genomic patterns (Smoller and others 2019). For example, recent work on the genetic architectures of schizophrenia has revealed that more than 70% of 1-Mb genomic regions contain variants influencing the risk of the disorder (Loh and others 2015). In fact, a more general “omnigenic” view of complex traits and their heritability and evolution is now driving most of the genetic contemporary discourse (Boyle and others 2017; Sella and Barton 2019).
Moving from the genotype to the intermediate phenotype, there is increasing evidence that some of the remarkable computational capabilities of the brain, such as object recognition, depend on the ability of neural systems to encode simple inputs into redundant widespread representations (DiCarlo and others 2012) and that this distributed architecture supports executive function (Steinmetz and others 2019). The conceptual models used in neuroimaging studies have evolved in the same direction. The field has been gradually shifting its focus from the analysis of variance to the analysis of covariance, for example, moving from localized effects to distributed networks (Bullmore and Sporns 2009; Friston and others 1993; Greicius 2008; McIntosh and others 1996; McKeown and others 1998). However, a conscious, argumentative debate between these approaches has been lacking, and the two methods still coexist. In particular, there remains the unanswered question of whether complex behavior is supported by activity concentrated in few loci or by widely distributed networks. The latter view is supported by substantial evidence: Gonzalez-Castillo and colleagues used very large sample sizes or very extended single subject designs to reveal brain-wide functional support for simple tasks in functional magnetic resonance imaging (fMRI) studies (Gonzalez-Castillo and others 2012; Gonzalez-Castillo and others 2015). Similarly, Haxby and colleagues (Haxby and others 2001) demonstrated that the representations of faces and objects in ventral temporal cortex are widely distributed and overlapping; moreover Chu and colleagues (Chu and others 2012), using structural data, demonstrated that feature selection (e.g., regional variation) was as effective as total brain volume at predicting the progression from minimally cognitively impaired cohorts to Alzheimer’s disease.
A complex system perspective on neural function results in predictions for the distribution of measured neural activity across the brain, which differs from predictions due to the localized perspective. For discussing some of these predictions, here we consider fMRI data from the Individual Brain Charting (IBC) project (Pinho and others 2018), which consists of a curated fMRI dataset, acquired in a fixed environment from a permanent cohort of the same 12 participants during the performance of a dozen tasks, encompassing a wide range of motor and psychological domains. The results are presented in Figure 1, following the format in Boyle and others (2017) where the z-scores obtained from the testing of each task-versus-control contrast were sorted in descending order and plotted versus the log of their rank (only positive z-scores were considered). Figure 1A and B depicts simpler (mostly motor) and higher mental processing tasks, respectively.
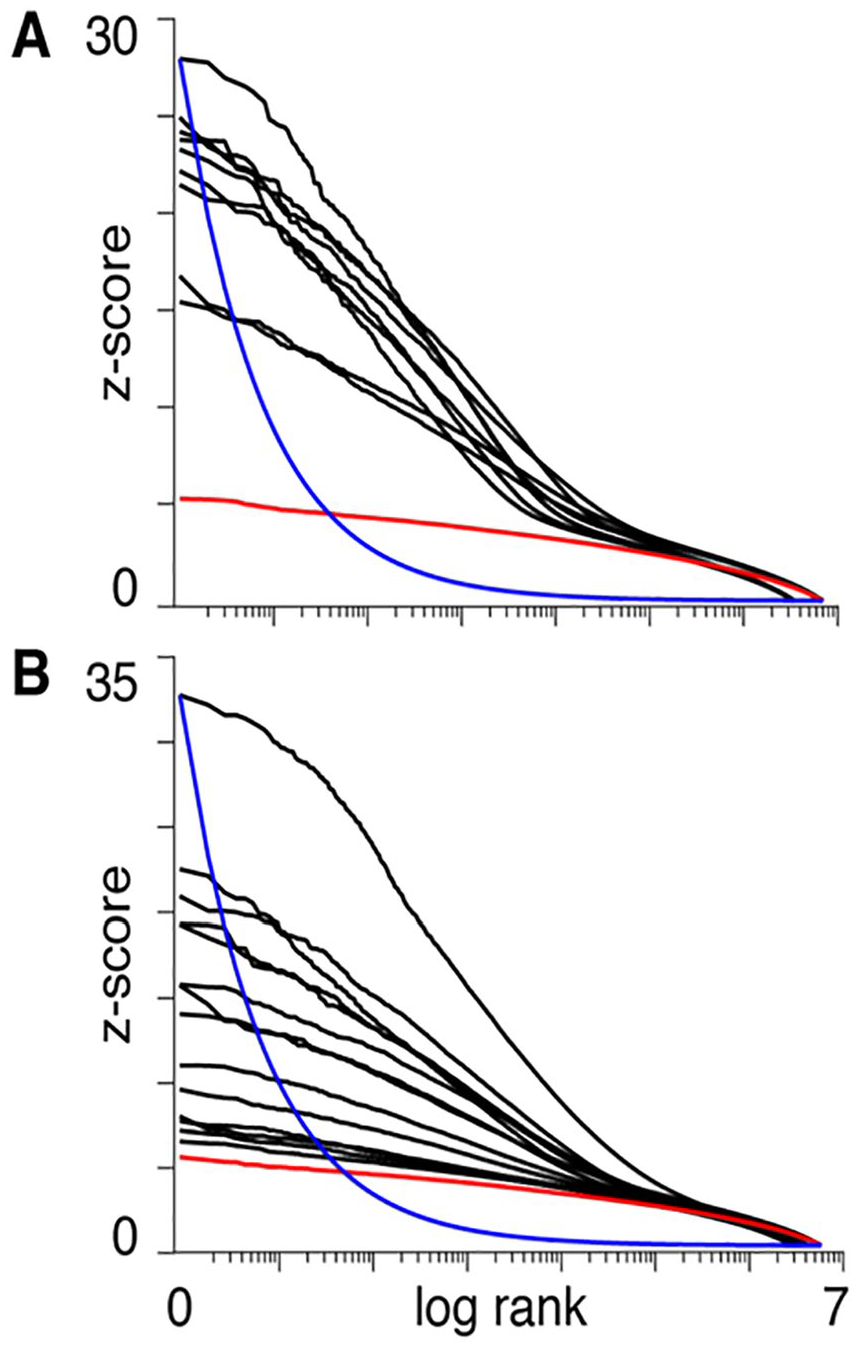
The panels illustrate the vectors of z-scores calculated for each voxel by contrasting the activity of task-versus-baseline (positive values only). Maps were obtained from fMRI studies of simple/motor tasks (A) or more complex activities such as calculation, language comprehension and social cognition (B). The x-axis represents the logarithm of the z-score ranks. The red lines represent the same z-scores for the normal null distribution. The blue lines represent the James-Stein boundaries, that is, the minimal decay of a z-score distribution that would justify the use of statistical thresholds for the estimation of the z-scored vector for each contrast (see Equation 1). The boundary curve has been arbitrarily scaled to the maximum z-score value for the group of tasks for which the theory suggests the use of shrinkage estimators for all vectors with smoother decays.
These plots are to be contrasted with the expected null distribution (red) and the decay (blue):

where
It may be seen that the curves in Figure 1 decay in a smooth manner—even in the simpler tasks, in which one would expect the signals to be described by a small number of coefficients with steeper decay rates—and do not satisfy the minimum requirement for the use of thresholding. In other words, the boundary in Equation (1) is a way of formally stating that the use of thresholds to separate signal from noise in a multivariate vector is unwarranted when no such clear separation exists. In fact, any small change in experimental setting, imaging technology, preprocessing, as well as interindividual variability (both neural activation, morphological, or nonneural) could easily swap the ranks of the z-scores, thus limiting the reproducibility of the results (Turkheimer and others 2003). Furthermore, these plots confirm that the activity supporting the execution of a very large variety of tasks is distributed across much if not the entire neural system and that the brain therefore satisfies the first requirement in being classified as a complex system. Note that, as each voxel is itself the numerical reflection of the compounded activity of the unit volume, the observations made for the time-space scales of fMRI studies may well be valid for measurements at higher resolutions made with other technologies.
Interaction and Nonlinearity
Let us consider now nonlinearity, the second key aspect of complexity. Nonlinearities within a complex system arise as a result of interactions between its elements. The brain offers several examples of nonlinear relationships between its physiological parameters. For example, there is the way in which V1 neurons respond to inputs (Williams and Shapley 2007)—where object recognition is performed by nonlinear operations on distributed, largely redundant representations (Williams and Shapley 2007), or the response of evoked deep tissue pain (Loggia and others 2012)—where the response is linearly related to pain intensity in certain regions, but is nonlinear in others.
However, the point we want to make in this section is that nonlinearities in any system can be generated by the interactions among elements when changes are applied to the organic whole. To illustrate this perspective, let us start with a simple theoretical illustration which, although applied to a small number of elements, is quite effective to show how—in biological scenarios—simple environmental constraints create nonlinear interactions among the elements of a group. 2 We will then show how these inferences might apply to a real scenario. The simple example considers a population of rabbits that reproduce regularly with a certain birth-rate R. The relationship between the number of rabbits at time t, denoted by Nt, and the corresponding quantity at time t + 1 can be expressed as

In particular, if one considers the case R = 2 and runs three iterations of the model, starting from one rabbit at t = 0 we obtain eight rabbits at t = 3, while if we start with two rabbits the final total is 16. This confirms that this system is linear and that the totality of the system is equal to the sum of the parts, as two rabbits produce twice the offspring of a single one.
The linear model above can be readily turned into a nonlinear complex system with interacting elements if we introduce a constraint wherein offspring need to compete for resources. Then, the model in (2) turns into the simple, but effective Verhulst model (Verhulst 1838):

where
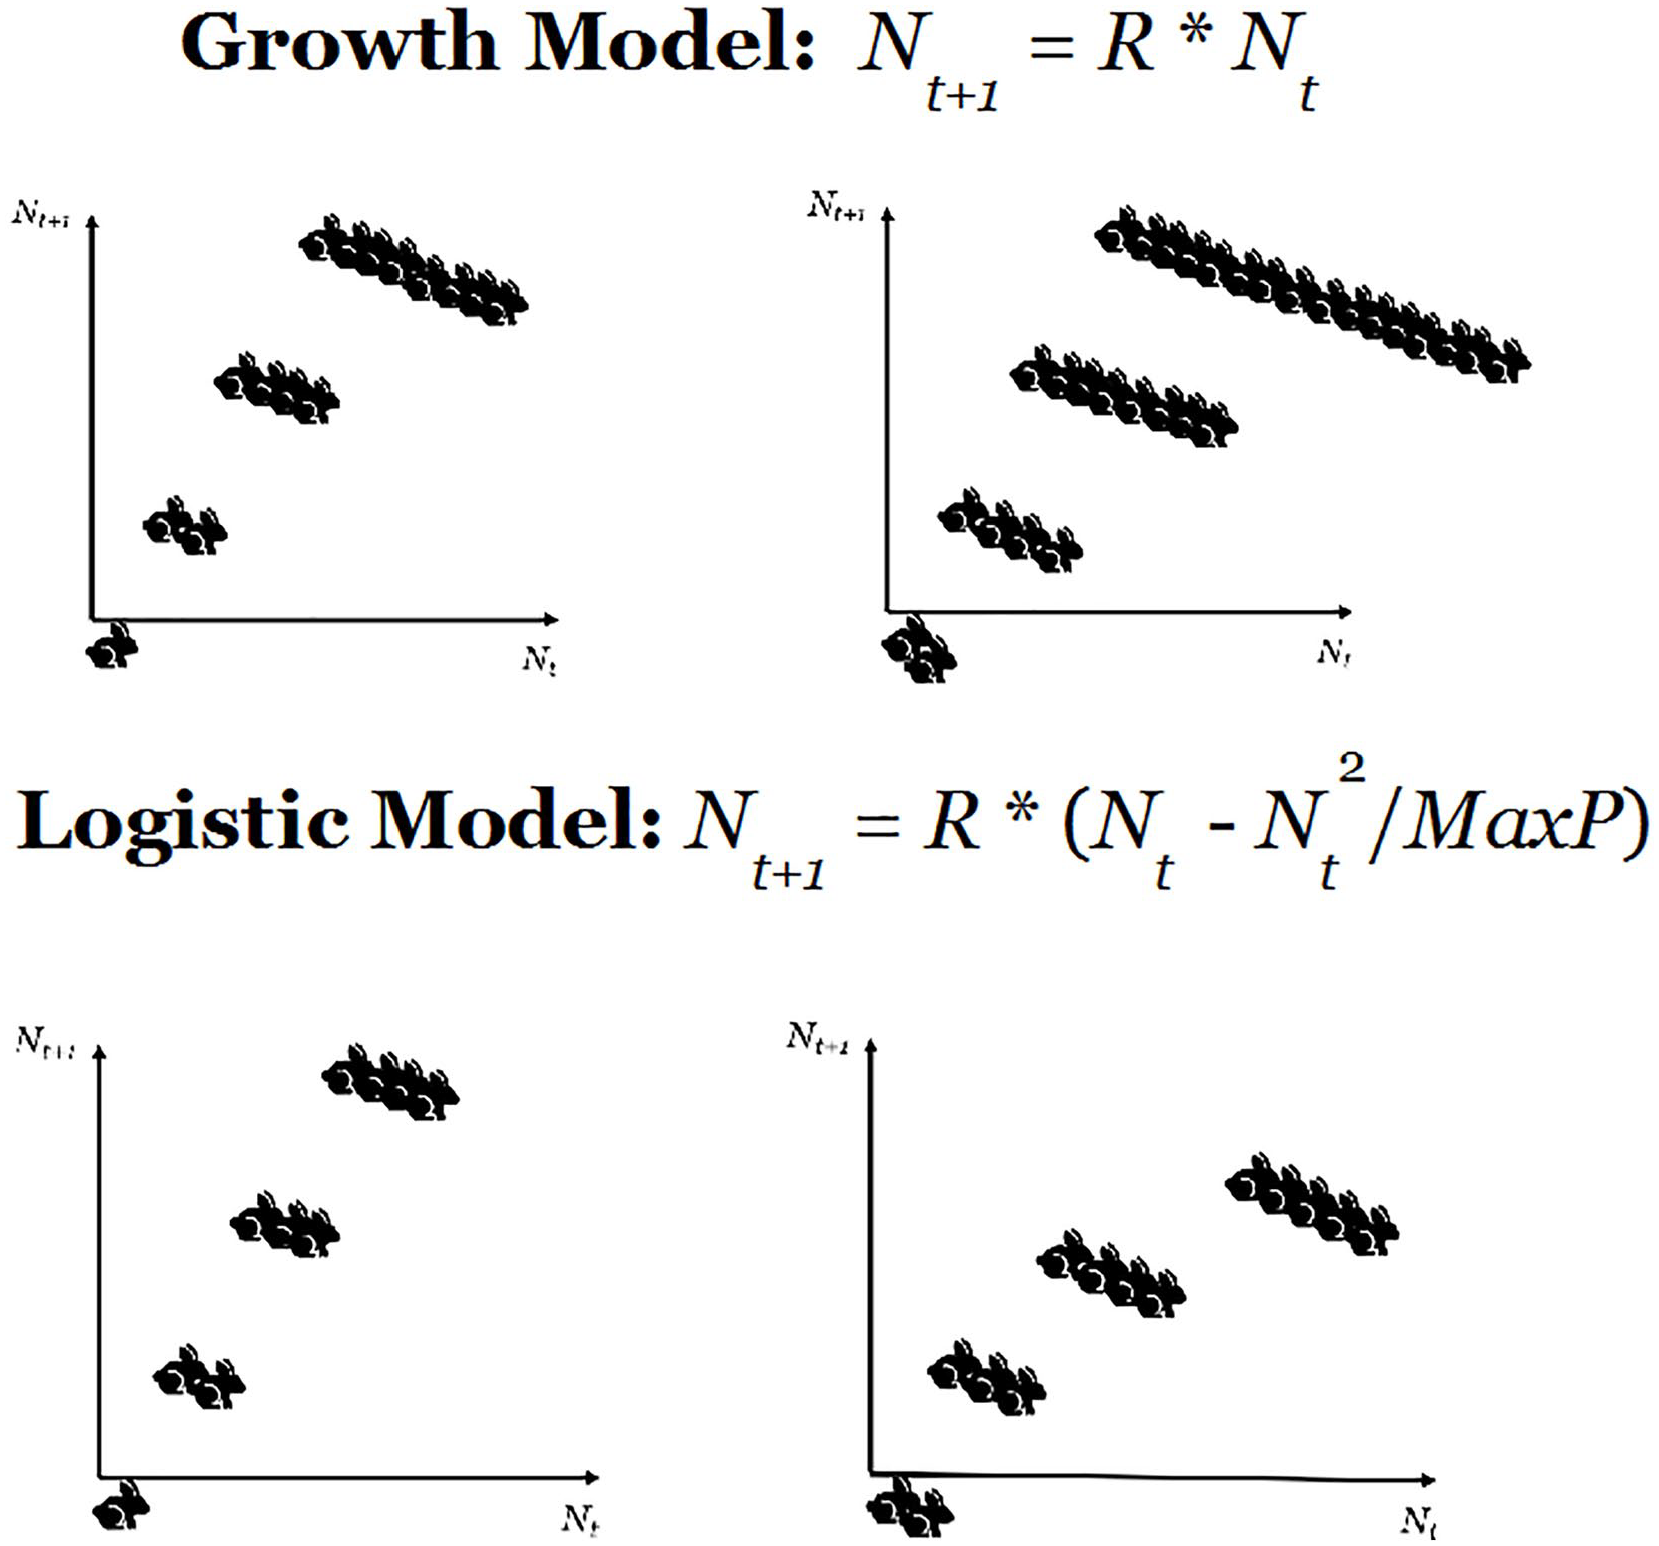
The panel above illustrates a simple linear growth model whereby the offspring of two rabbits is always twice the number of offspring of a single rabbit, whatever the number of iterations. In the logistic model below, a resource constraint makes the rabbits compete for resources and, this time, the offspring of two rabbits is not twice the offspring of one.
The example in Figure 2 demonstrates three important phenomena. First, a simple resource constraint on the system introduces a highly nontrivial interaction between elements, so that the totality is not anymore equal to the sum of the parts. Second, this interaction translates into a nonlinear behavior observed within the system. Third, the reproduction rate in (3) depends on the initial number of rabbits Nt.
The insights developed over the simple example can be used to understand more complicated issues related to brain development, brain ageing, and their disorders. For example, it has proven difficult for neuroimaging studies in autism to replicate both structural and functional results (He and others 2020; Lotspeich and others 2004), whereas the most consistent finding is the heterogeneity of imaging results (Lenroot and Yeung 2013). One particularly interesting finding is related to brain development of subjects within the autistic spectrum: these populations exhibit increased brain volumes in young children, whereas the rate of growth decreases subsequently during adolescence to meet the normal developmental curve between 10 and 15 years of age, with the volume of many structures finally declining atypically into adulthood (Ha and others 2015; Lange and others 2015; Wolff and others 2018). These findings are paradoxical from the perspective of a linear system; however, it is likely that a suitable nonlinear model of growth could explain why a more numerous initial state would experience a strong bias downwards in its developmental rate, especially when the whole system is placed under exogenous pressure.
More generally, it is often noticeable in neuroimaging that individual developmental trajectories seem to provide much better resolution to categorize psychiatric disorders than cross-sectional data (Liberg and others 2016). This phenomenon is known in the literature of complexity science and dynamical systems as nonergodicity, which characterizes dynamical systems in which the statistics computed over single trajectories are not necessarily equal to the statistics across the population (Griffith 1963). This is equivalent to saying that trajectories that start from different initial conditions may exhibit different dynamics. Nonergodicity has dramatic consequences in the context of ageing and age-related disorders, where imaging studies have shown that cross-sectional analyses produce findings that are often in discrepancy with longitudinal analyses on the same subjects (Nyberg and others 2010). In particular, longitudinal analyses unveil complex nonlinear trajectories of structural and functional data of anatomically parcellated regions, which can have radically different dynamics challenging most available explanatory models (Fjell and others 2013; Fox and Schott 2004; Good and others 2001; Vinke and others 2018). Notably, during normal ageing, some brain areas may exhibit little age effects on regional cerebral volume, while others show a complex, nonlinear relationship with age. This is mirrored by the significant intrasubject variability of cognitive decline—see, for example, the findings of the Nun Study (Snowdon and Nun 2003), in which cognitive domains within the same individual deteriorate at very different rates (Salthouse 2019).
When it comes to connecting the intermediate phenotype (i.e., the brain) with environmental modifiers on the one hand and genetic factors on the other, recent analysis of very large datasets have demonstrated that individual variability of MRI measures across ageing is spread across a large number of regional networks, or modes—each associated with overlapping environmental factors and genes (Smith and others 2020). Interestingly, the biological and genetic factors involved in ageing accrue over three fundamental processes: metabolism, stress (particularly its effects on cellular senescence), and immunity. However, each of these processes is in itself a complex outcome of interactions among multiple genes and environmental factors, such as nutrition, environmental/psychosocial stress, and infections (Kim 2007; Shmookler and others 2009).
Motivated by the aforementioned evidence, we propose here that the complex developmental and neurodegenerative patterns observed in structural and functional data are the result of nonlinear interactions generated by systemic pressures, which stem from metabolic and immune challenges punctuated across time (Amad and others 2020; Lord and others 2012; Turkheimer and others 2020). For example, metabolism is a fundamental determinant of neural function, as the brain accounts for ~2% of total body mass, yet burns ~20% of its energy, which is obtained through oxidative glucose metabolism, thus rendering the brain in constant demand of oxygen supply from cerebral blood flow (Clarke and Sokoloff 1999). In fact, the human brain is, from a metabolic perspective, a scalable version of a primate brain, as the energy budget of the whole brain per neuron is approximately fixed across species and brain sizes (Herculano-Houzel 2011) and hence its development has been strictly controlled by metabolic constraints (Fonseca-Azevedo and Herculano-Houzel 2012). Brain metabolism is mostly devoted to sustaining synaptic activity (Sibson and others 1998) and metabolic rates influence neural circuitry and activity patterns by exerting selective pressure toward metabolically efficient wiring patterns (Chen and others 2006), gray/white matter segregation (Wen and Chklovskii 2005), neuronal morphology (Wen and Chklovskii 2008), and neural codes (Balasubramanian and others 2001; Levy and Baxter 1996). The metabolic demands of neural circuitry render the system highly susceptible to mitochondrial impairments, oxidative stress, and deficits in glucose metabolism and perfusion. Therefore, the resulting global metabolic pressure stemming from noxious metabolic events translates into complex, nonlinear interactions among the system’s constituent parts.
Following the same principles, we propose that immunity-based secondary processes, that are recurrently associated to either developmental or neurodegenerative disorders, may generate system-wide pressures that then translate into complex outcomes. In fact, either maternal infections during gestation, or activation of the innate or adaptive immune system caused by stressful events, trauma, or infections across a lifespan, have demonstrated to be the cause of psychiatric or degenerative conditions (Gate and others 2020; Labzin and others 2018; Meltzer and Van de Water 2017; Meyer 2019; Miller and Raison 2016; Richetto and others 2017).
Self-Organization and Criticality
The third key property of complex systems is self-organization. Self-organization takes place where some form of global order arises as a consequence of the local nonlinear interactions between parts of an initially disordered system (Bak 1996). Importantly, the organization should emerge in a spontaneous manner, provided energy is available, and not as a result of the actions of a centralized controller or an external guidance. Therefore, the self-structuring events are often triggered by seemingly random fluctuations, which are dynamically amplified by some form of feedback enabled by the underlying nonlinearities. The resulting organization is wholly decentralized, being distributed over all the components of the system, making it robust and able to endure (i.e., self-repair) or recover from substantial perturbations (Kelso 1995). The process of self-organization of a dynamical system such as the brain can be visualized as a trajectory in n-dimensional phase space (where n is the number of its elements) that moves across states that can be described in terms of steady states. The evolution of the system is constrained to remain on these states and this constraint implies some form of coordination between its constituent elements (Ashby 1947; Rosas and others 2018). A substantial amount of evidence, based on both human and animal experiments, indicates the important role of neural plasticity in the maturation of perceptual and cognitive processes. In other words, neural structures underlying these functions require sensory input for their maturation, and genetic instructions are not sufficient to specify neuronal connections with significant precision (Singer 1986; Tetzlaff and others 2010).
Importantly, the brain (as many natural complex systems) displays macroscopic patterns of activity with spatial and/or temporal scale invariance. The latter is a property which results in dynamical systems, for example, those exhibiting turbulent flow (Bohr 1998; Deco and Kringelbach 2020), evolving in such a way that (except at the spatial or temporal extremes) it is not possible to distinguish the scale at which the system is being observed. This self-similar (or “fractal”) character suggests that the self-organizing process that is ongoing during the development of the central nervous system (CNS) drives the system toward a state called self-organized criticality (SOC; Bak 1996; Jensen 1998). SOC was originally proposed as an explanatory mechanism for the origin of complexity; systems displaying SOC possess long-range correlations both in time and space (Expert and others 2011). The philosophy underlying the SOC paradigm can be intuitively summarized as follows: the current state of a system is a result of all its past states. Per Bak used the sand pile model as an exploration of SOC (Bak and Paczuski 1995). A sand pile can be organized by a simple rule that sees the grains falling randomly on a grid and accumulating until they topple sideways once they have reached a certain height (Pruessner 2012). Once the grid starts filling up, avalanches of various sizes start cascading with an overall size-probability distribution which demonstrates the characteristic power law behavior observed in self-similar dynamical systems (Fig. 3).
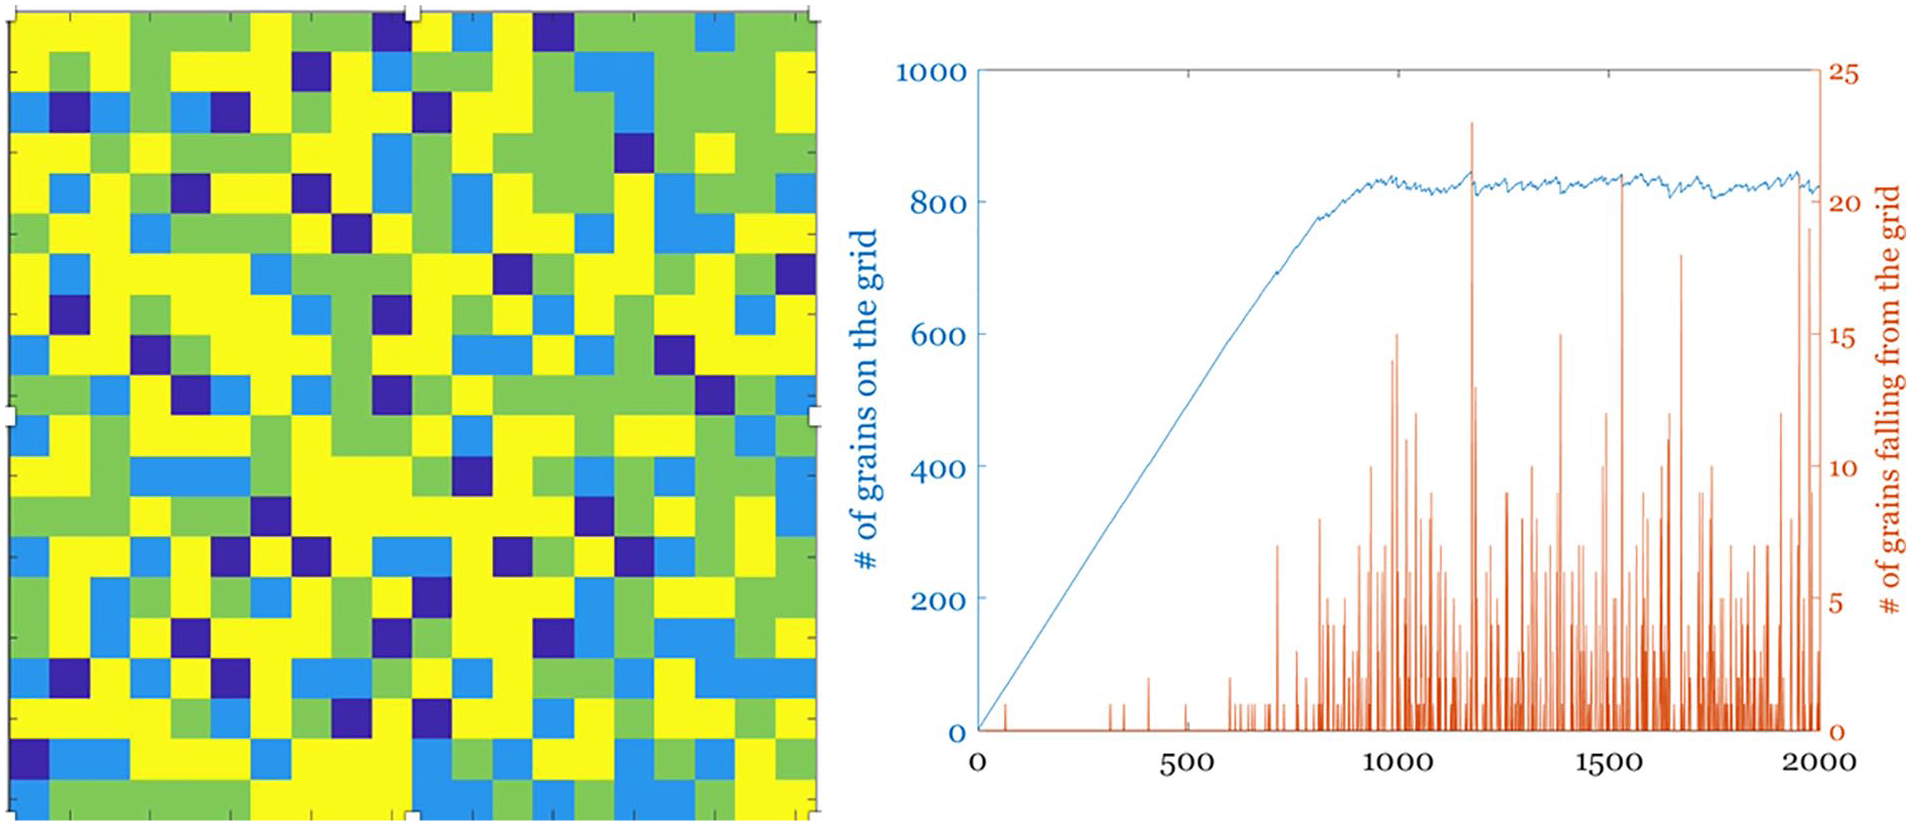
A simple sand-pile experiment simulated on a 20 × 20 grid (left); each pixel represents a column where sand piles up and colors indicate the number of grains (blue = 0 to yellow = max number of grains = 4). Sand is dropped randomly on the grid, and it topples sideways, as well off the grid, when the set limit for the height of a sand column is reached. The right panel shows the total sand in the grid through time, as well as the size of the avalanches falling off it.
Many natural systems tend toward such power law distributions, as these distributions allow for maximal adaptivity and other functional benefits (Shew and Plenz 2013). As in the case of the sand pile model, any perturbation to the system can be passed across scales and dissipated quickly—this endows the system with stability (Bak 1987). Another example of this phenomenon is the energy cascade in turbulent hydrodynamic systems, in which kinetic energy is passed between eddies of decreasing size until it is distributed, at the smallest scales, to the viscosity of the liquid (Kolmogorov 1941).
One important requirement for self-organization is the abundance of available energy. In the same way that the sand pile needs a constant supply of grains to sustain itself in a critical state, the brain devotes up to 80% of its energy budget to maintaining its intrinsic activity (i.e., brain activity in the absence of an overt motor, perceptual or cognitive task), whereas evoked activity in the brain does not use more than 1% of its metabolic reservoir (Raichle 2015; Raichle and Mintun 2006). This feature has been dubbed the Brain’s Dark Energy (Raichle 2006).
Self-organization rests upon four basic requirements (NBonabeau and others 1999): (1) interactions between multiple constituent elements; (2) strong nonlinearity, possibly involving positive and negative feedback; (3) a dynamic behavior striking a balance between exploitation and exploration; and (4) availability of energy, which allows to overcome the natural tendency to increase entropy (e.g., disorder).
The above-mentioned requirements can be readily observed in the organization of cortical structures. As summarized in Turkheimer and others (2015), the brain (primarily the cortex) is made up of a multitude of elementary units, each of which consists of two neurons—a pyramidal excitatory unit coupled with a gamma aminobutyric acid (GABA) interneuron that, via a delayed negative feedback, transforms the firing of the unit into an oscillation in the gamma frequency (Borgers and Kopell 2003), the so-called pyramidal interneuronal network gamma (PING) network. These elementary units are weakly connected via further GABA interneuron projections into and across the individual neural columns (Helmstaedter and others 2009). Therefore, local oscillations in the gamma frequency are the binding force that generates rapid metastable dynamics, moving between synchronization and de-synchronization, which spread across the cortex. These elementary computational motifs have been observed across various brain regions, as well as across scales (Turkheimer and others 2015), reaching the long-range synchrony of neural activity (Agrawal and others 2019; Fagerholm and others 2020; Meshulam and others 2019). This supports the view of the brain as exhibiting SOC (Cabral and others 2011; Cabral and others 2014; Roberts and others 2019; Tognoli and Kelso 2014), with a distinctive fractal signature both in its structure and function (Expert and others 2011; Squarcina and others 2015; Turkheimer and others 2015). The fractal distribution of neural output, also known as the 1/f noise, can also be observed in the behavioral repertoire, from the motor regions to the higher cognitive areas, capturing the range between basic physiological responses and creative abilities in the human brain (Levitin and others 2012; Palva and others 2013). Conversely, evidence suggests that this scale-invariance in brain output may be lost during anesthesia-induced loss of consciousness (Scott and others 2014). Interestingly, self-organized systems may produce top-down control, or at least the illusion of it: for example, once started by bottom-up synchronization, the oscillation of large neuronal masses may take control of the activity of smaller primary cortices and generate those phenomena related to attention or vigilance (Turkheimer and others 2015); these will be shaped by environmental interactions and, ultimately, by evolution. This is different from all those proposals where top-down controls are somehow hard-wired in the brain (see Grossi [2017] for a general discussion on the topic). These ideas lead straight to another fundamental property of complex systems—that of emergence.
Emergence
The fourth property of complex systems is that they are characterized by emergent behaviors. Complex systems, that is, organisms or environments made up of very large numbers of elementary agents (e.g., ants in colonies, birds in a flock, or arrays of molecules or weather elements), can produce an impressive array of sophisticated behaviors that cannot readily be explained solely by the physical properties of their constituent components. As a matter of fact, emergence—although still lacking a precise definition—has come to be recognized as a key ingredient of any system studied under the umbrella of complexity science (Turkheimer and others 2019).
The concept of emergence is credited to the physiologist and philosopher George H. Lewes in his book Problems of Life and Mind (Lewes 1879). At the time, Lewes was concerned with reductionism, that is, why all science does ultimately reduce to physics. Victorian England in times of Lewes saw important advances in mechanics; however, chemical reactions (e.g., the production of water from oxygen and hydrogen) seemed to require explanations that were qualitatively different from those that contemporary physics could provide. Building on this idea, Lewes drew a difference between mechanical effects and chemical effects—which he called “emergents.” In his words, The emergent is unlike its components in so far as these are incommensurable, and it cannot be reduced to their sum or their difference. (Lewes 1879, p. 413)
The notion of emergence was first brought into the neurosciences by Roger W Perry, the 1981 Nobel laureate for physiology and medicine, in the context of the mind-body problem. According to Perry, emergence is the idea, in brief, that conscious phenomena as emergent functional properties of brain processing exert an active control role as causal detents in shaping the flow patterns of cerebral excitation. Once generated from neural events, the higher order mental patterns and programs have their own subjective qualities and progress, operate and interact by their own causal laws and principles which are different from and cannot be reduced to those of neurophysiology. (Sperry 1980, p. 201)
In other words, the behavior of the whole cannot be explained purely by focusing only on local spatiotemporal interactions between its elements in isolation—new theories are needed to explain these phenomena. Similarly, higher order cognitive function operates via laws that cannot be reduced to those of neurophysiology—instead they operate in the domain of psychology.
Despite their popularity, strong emergent approaches have been the source of numerous controversies. From a philosophical perspective, strong emergence has been accused of being logically inconsistent (Bedau 2002) and sustained on illegitimate metaphysics (Bedau 1997). Additionally, diverse concerns with respect to strongly emergent approaches in neuroscience have been raised, including arguments related to their plausibility in regard to empirical evidence (Turner 2019), or to potential limits of their falsifiability (Colombo and Wright 2018). Finally, the fact that consciousness is usually the only proposed example of strong emergence in the natural world (see, e.g., Chalmers 2006) presumes an exceptionalism of consciousness that could be hard to justify.
These difficulties are avoided by “weak emergent” approaches, which rely on computational models that start from biologically plausible elementary units and build higher order outputs, using tools and concepts borrowed by complexity science (Turkheimer and others 2019). These models are defined as “weakly” emergent, are not limited by ontological faults, have been proven to be scalable, and able to realistically simulate the hierarchies of brain output and have now reached a level of maturity that enables predictions in the clinical realm (Deco and Kringelbach 2014; Fagerholm and others 2015; Lord and others 2017; Proix and others 2017; Turkheimer and others 2015; Turner 2019; Zimmermann and others 2018).
More technically, weak emergence can be broadly categorized into computational irreducible and causal emergence approaches. The former, introduced by Bedau (1997) based on ideas from Wolfram (2002), posits that emergence relates to limitations that hold in practice but not in principle; specifically, emergent properties would be generated by elements at microscopic levels in such complicated ways that they cannot be derived via explanatory shortcuts, but only by exhaustive simulation. While theoretically attractive, these approaches currently lack ways of operationalizing their definitions, and hence their practical value is limited. In contrast, causal emergent approaches identify formal methods to assess the causal power exerted by macroscopic properties of a system. Causal emergence has been operationalized using Granger Causality (Seth 2010), Pearl’s do() calculus and effective information (Chicharro and Panzeri 2014), and most recently by Integrated Information Decomposition (Oizumi and others 2014).
The Tools
Having examined neural function in terms of the four main properties associated with complex systems, we now address the question of how the obtained insights can be operationalized through the following scheme.
From the Analysis of Variance to the Analysis of Covariance
Realizing the large number of degrees of freedom that characterize the brain, one suggested approach is to shift the focus from the analysis of variance to the analysis of covariance. In other words, inference should be driven by the way the elements of the systems interact, and less so on how much they vary individually. The statistical literature provides numerous multivariate methods to study data covariance, which have been already been adapted for use in neuroimaging. A first approach involves using standard linear methods such as principal component analysis (PCA; Friston and others 1993), independent component analysis (ICA; McKeown and others 1998), and partial least squares (McIntosh and others 1996). Although not aimed at complexity analysis per se, these tools can be used to explore patterns in the data, as well as to derive approximate measures of complexity. For example, the Morgera Information Complexity is a measure of the extent to which covariance is distributed across principal components (Morgera 1985).
Capturing Covariance through Networks
A further approach is to represent covariance as networks, which are a popular tool to capture and explore covariance structures (Sporns 2011a). Networks can be built on multiple metrics, ranging from standard correlation coefficients to mutual information or model-based indices that are generally better suited to capture nonlinear interactions (Song and others 2012). Nonlinear metrics are sometimes preferred, as they may avoid spurious patterns that can be caused by unjustified linear assumptions (Bright and Murphy 2015).
Exploring the Macro- and Meso-Scale of Brain Networks
Once the web of interactions has been modelled as vertices and edges, the topology of the structure can be further explored, both at the macro-scale level—using graph theoretical measures that summarize the network properties (Bullmore and Sporns 2009)—and at the meso-scale level where the topological stability of the structure can be further quantified (Expert and others 2019; Petri and others 2014).
Toward High-Order Statistical Properties via Multivariate Correlation
A third approach to analyze covariant structures is to explore multivariate correlations, which capture high-order statistical properties that go beyond pairwise phenomena (Baudot and others 2019; Mediano and others 2019; Rosas and others 2019; Tononi and others 1994). High-order interactions can also be used to build hypergraphs, which are networks were links can connect more than two nodes (Bretto 2013). Hypergraph analysis is an active area of ongoing research, which is opening novel avenues for neuroimaging research (see, e.g., Gatica and others 2020).
Designs: From Cross-Sectional to Longitudinal and Life-Trajectories
Importantly, the brain is a nonlinear and nonergodic system. The discussions above have clarified the importance of experimental designs that move beyond stationary cross-sectional data paradigms and instead attempt, whenever practical, the acquisition of individual trajectories. This also enables the analysis of initial conditions; we have already shown how the artificial splitting of life-trajectories in development and ageing may result in faulted inferences. The consideration of trajectories is also relevant at smaller timescales, including the duration of a BOLD MRI study where, for example, higher resting-state functional activity before a stimulus can result in less activation or more deactivation (He 2013).
Using Dynamics to Extract Brain States
It is often useful to characterize dynamics in terms of “states” or attractors, that is, regional patterns of activity between which the system oscillates (Kelso 1995). The number of these states and their stability fully define such dynamics and can be quantified using standard analytics (Calhoun and others 2014; Gonzalez-Castillo and Bandettini 2018; Gu and others 2017; Hutchison and others 2013; Lord and others 2019; see Fig. 4), which have been used successfully in recent work on a broad spectrum of psychiatric disorders (de Lacy and Calhoun 2019; de Lacy and others 2017; Jin and others 2017; Kaiser and others 2016; Lurie and others 2020; Rabany and others 2019; Sakoglu and others 2010).
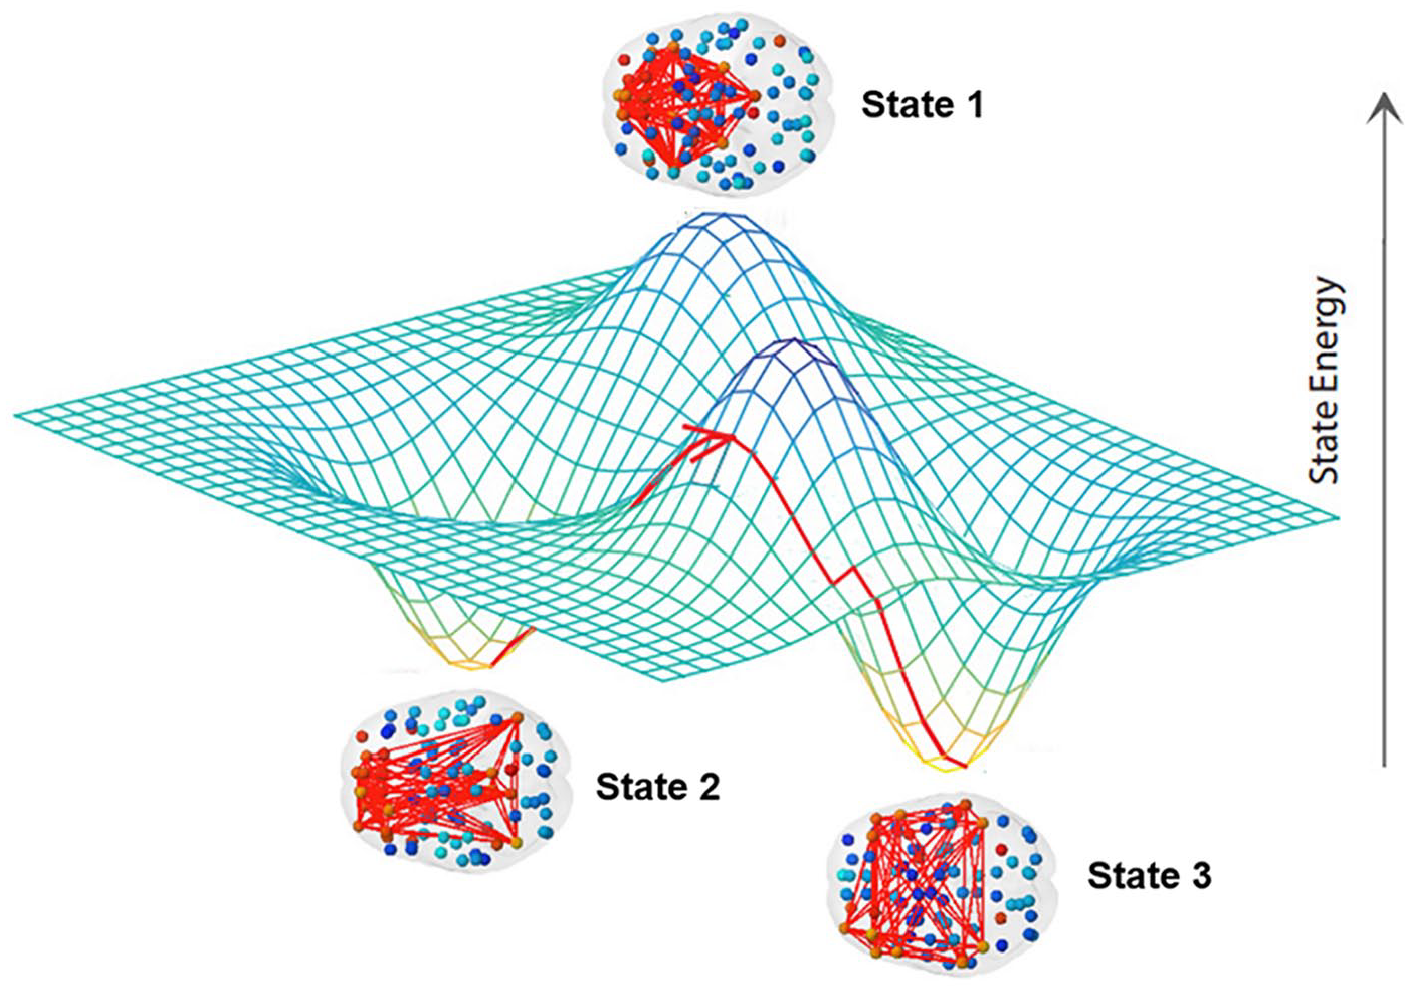
A brain state consists in a set of regions with synchronized activity during a time interval. The three-dimensional plot represents the energy levels of each state and the red line with arrow on the energy landscape the dynamic trajectory of the brain moving from state to state, whereas “energy” here is a term derived from information criteria and not calculated from metabolic expenditure. Brain states are more or less likely to be visited by the dynamics over time based on their relative energy/stability (adapted from Gu and others 2018).
From Euclidean to Fractal Geometry
Furthermore, if one accepts SOC as a model for the brain, then the use of fractal geometry can be justified in studying brain structural data (Expert and others 2011; Squarcina and others 2015) and its deviations from the SOC model. Fractal principles enable parsimonious methods to explain rich structures, holding great potential to explain brain structure and function. SOC approaches, however, face a number of important challenges (Beggs and Timme 2012), including the analysis of applicability of principles developed to study homogeneous systems (made, e.g., by equivalent spins) over heterogeneous systems such as the brain. Also, there is a need to operationalize the beneficial properties of criticality, such as efficiency and robustness, so that they can render verifiable predictions. It must be clarified that these challenges do not put in question the core contribution of SOC into neuroscience, namely, that by neglecting the right details, neuroscience might be capable of finding general underlying principles (Chialvo 2018; Cofré and others 2019).
Diversity and Emergence
Finally, the study of complex systems requires the quantification of two key properties: diversity and emergence. The first one can be described by a measure of entropy, for example, Shannon’s entropy (e.g.,
Conclusions
We reviewed neural systems from the perspective of complexity science and matched the required properties of complex systems with evidence from contemporary neuroscience. The use of complexity science is not new to studies of the brain. However, its use has often been intertwined with standard analytical approaches that stem from older conceptual frameworks. What is now required is the acceptance of these new frameworks both in terms of experimentation and analysis. Complexity science is itself experiencing ongoing progress, and some of the required tools are perhaps yet to be discovered. Nonetheless, the potential insights to be gained by this paradigm are sufficiently promising to render this a very worthwhile endeavor.
Footnotes
Acknowledgements
We would like to thank the three anonymous reviewers for their critical appraisal and very helpful comments.
Declaration of Conflicting Interests
The author(s) declared no potential conflicts of interest with respect to the research, authorship, and/or publication of this article.
Funding
The author(s) received no financial support for the research, authorship, and/or publication of this article.