
Abstract
Aim
Headaches are a common complaint among children and adolescents, with prevalence rising over the past decades. This study aimed to retrospectively analyze all emergency consultations presenting with headache as the primary symptom at a Level 1 Pediatric Emergency Department (PED) over 7 years, encompassing the COVID-19 pandemic.
Methods
All electronic health records (EHR) of patients aged 2 to 18 years who presented to the PED with non-traumatic headache between January 2018 and December 2024 were retrospectively reviewed. In addition to primary headache diagnoses, conditions commonly associated with headaches were included to identify relevant emergency department cases. Statistical analyses included the chi-square test or Fishers exact test, calculation of Odds Ratios and ANOVA, significant at p < 0.05.
Results
A total of 1278 children and adolescents (564 males, 44.1%; 714 females, 55.9%) with acute headaches visited our PED 1447 times. Of those patients, 668 (46.2%) were diagnosed with primary headaches, 677 (46.8%) with secondary headaches, five (0.3%) with cranial neuropathies and facial pain, and 97 (6.7%) had headaches that could not be clearly classified. Acute headache cases accounted for 3.6% of all PED visits. The largest relative increase compared to the baseline year (2018) was observed in 2023 (+36.2%). Immediate neuroimaging was performed in 19.1% of cases. Red flag symptoms, including systemic symptoms with fever, neoplasm in history, progressive headache, headache associated with severe vomiting and papilledema, were significantly associated with abnormal brain MRI findings. Pharmacological analgesic therapy was administered in 31.9% of cases, and pain assessment was recorded in 46.1% of cases.
Conclusion
Visits to the PED for headaches are increasing, particularly following the COVID-19 pandemic. The high prevalence of primary headache diagnoses, combined with still insufficient pain management, highlights the need for enhanced education for both pediatricians and parents. For secondary headaches, a thorough headache history focusing on all red flag symptoms, along with a detailed neurological examination assessing clinical features, should form the basis for deciding whether immediate neuroimaging is necessary.
Trial registration
The study has also been officially registered on the public webpage of the German Clinical Trials Registry (GermanCTR) at https://drks.de/search/en/trial/DRKS00036917 (Clinical Trial Number/ DRKS-ID: DRKS00036917, Date of Registration: 2025-05-16, last update: 2025-07-28, registration type: retrospective, status: recruiting complete, study complete).
This is a visual representation of the abstract.
Keywords
Introduction
The prevalence of headaches in childhood is notably high and associated with significant impairment in daily functioning. 1 Headaches are also a common reason for admission to PED. Globally, the overall prevalence of headaches is approximately 52%. 2 Despite regional variations, children and adolescents appear to be particularly affected, with the global average prevalence of primary headaches in this age group reaching 62%. 3 Migraine tends to become more prevalent with age among children and adolescents. A Finnish study reported a fivefold increase in headache prevalence at school entry. 4 A recent KIGGS health monitoring study on pain disorders in children and adolescents revealed headache prevalence rates of 20.1% in girls aged 3–10 and 45.2% in girls aged 11–17. For boys, the respective prevalence rates are 16.4% and 28.7%. 5 Furthermore, long-term data from the KIGGS study comparing the periods 2003-2006 and 2014–2017 revealed a significant increase in the three-month prevalence of recurrent headaches among children aged 7–13 in Germany. 5
The International Classification of Headache Disorders (ICHD-III) provides diagnostic criteria to accurately distinguish between primary and secondary headaches in adults and children. 6 The most common primary headaches in the pediatric population are migraine (with and without aura) and tension-type headaches. Secondary headaches are attributed to underlying clinical conditions, such as infections, vascular or nonvascular intracranial disorders, or brain tumors.
Epidemiological studies report that acute headaches account for 0.7% to 3.8% of presentations in PED.7–9 Conicella et al. studied 432 children presenting with acute headache symptoms and found that upper respiratory infections were the most common cause (19.2%), followed by primary headache disorders such as migraine (18.5%), post-traumatic headaches (5.5%), and tension-type headaches (4.6%). 7 In the emergency department setting, healthcare providers face the ongoing challenge of excluding serious underlying conditions while ensuring adequate pain management for headache symptoms. Rossi et al.10 conducted a retrospective analysis involving 1833 patients who made 2086 visits to the PED with headaches as the presenting complaint. Their study showed that 62.1% of cases were primary headaches, 30% were secondary headaches—caused by infections, neurological disorders, psychiatric conditions, intoxications, hypertension, or other serious illnesses—and 7.8% represented with inconsistent diagnoses. Among patients with secondary headaches, 1.1% (24 patients) were diagnosed with serious conditions such as brain tumors, intracranial infections, vascular malformations, hemorrhages, strokes, or idiopathic intracranial hypertension. Clinically relevant red flags included cranial nerve deficits, newly developed strabism, and dizziness. 10
The primary goals of the PED are to determine whether a headache is caused by a serious or life-threatening condition and to provide safe, effective pain relief. Currently, there are no evidence-based recommendations for treating primary headaches in children and adolescents in emergency settings. The absence of these guidelines may result in inadequate treatment of headaches. For instance, a nationwide Italian study found that only 32% of children presenting with headaches received analgesia in the emergency department. 11
This study aimed to identify the characteristics of acute headaches and their associated symptoms in a PED at a maximum care center. Additionally, we aimed to identify red flag symptoms and their association with serious underlying conditions. Finally, we evaluated the appropriateness of diagnostic tests and treatment protocols for headaches in the PED.
Methods
Study design
From January 2018 to December 2024, EHR of all patients aged 2 to 18 years who presented to the PED of the Children's Hospital at the Dresden University Clinic with primary and secondary headaches were reviewed retrospectively. Cases were selected from the EHR in three steps: case identification; screening for emergencies; and examination of data suitability, using predefined inclusion and exclusion criteria (Online Supplemental Figure 8).
Case identification was performed using: 1) a list of International Classification of Diseases (ICD) codes for primary and secondary non-traumatic headaches in pediatrics (Online Supplemental Table 1); and 2) the MTS protocol (triage system for clinical assessment), in which headache was given as the main reason for attending the PED. Patients were excluded if they were scheduled for inpatient admission, had traumatic or post-traumatic headaches, had previously received treatment with a ventriculo-peritoneal shunt, or were younger than 2 or older than 18 years. The study protocol was approved by the Ethics Board of TU Dresden (protocol number BO-EK-337082024). The study has also been officially registered on the public webpage of the German Clinical Trials Registry (GermanCTR). This study followed the STROBE guidelines for retrospective observational studies.
Data collection
Data for each patient was collected based on a standard data abstraction protocol, 12 using existing emergency protocols from the EHR of physicians and nurses (Online Supplemental Table 7). The data were entered into a SPSS database for analysis. One investigator and a supervisor extracted the following variables: age, sex, MTS, year of admission, month of admission, time of headache onset, main diagnosis, headache category, Covid infection, accompanying symptoms (including red flags 13 [Online Supplemental Tables 2 and 7]), prehospital medication, diagnostic tools in the PED, acute neuroimaging (divided in immediate and subacute (within 2 days) for inpatient admissions), previous neuroimaging (as outpatient or in the primary hospitals), pharmacological treatment during admission, pain scores, and headache recommendations. Information that could not be obtained from the emergency protocol or the physicians’ letters was considered missing and was not included in the calculations. For pharmacological treatment, the PED of the Children's Hospital at the Dresden University Clinic uses standard dosages of ibuprofen 10 mg/kg, dipyrone 15 mg/kg and acetaminophen 15 mg/kg not exceeding the maximum dosage. Furthermore, MRI findings were classified according to the radiologist's evaluation. Only clinically relevant headache related findings that demonstrated a notable correlation with red flags, were listed. (Online Supplemental Table 6).
To evaluate changes during the pandemic, the study period was divided into three periods: pre-pandemic (January 2018–March 2020), pandemic (April 2020–February 2023), and post-pandemic (March 2023–December 2024). These periods were defined according to public health measures implemented in Germany during the pandemic. 14
Data analysis
Data extraction took place between January and May 2025. The statistical analysis was conducted through IBM SPSS Statistics Version 30.0.0.0 (172). A p-value < 0.05 was considered to be statistically significant. The metric variables were analyzed for normal distribution using the Shapiro-Wilk test. For normal distributed data ANOVA was used to compare differences between more than two groups and two-sample t-test for two groups and to compare differences for not normal distributed data Friedman test and Mann-WhitneyU test (MWU) were used equally. The analysis of relationships between categorical variables was realized using the chi-square test of independence and homogeneity for contingency tables with ≥1 degrees of freedom. For contingency tables that contained expected frequencies smaller than 5, the exact Fisher test was used instead of the chi-squaretest. Furthermore, Odds Ratios were calculated for 2 × 2 contingency tables to quantify the strength of the associations and Cramer's V was calculated for the interpretation of effect sizes. Additionally, post-hoc analyses of residuals were performed to further evaluate the meaning of significant p-values in multiple comparisons.
To assess the reliability of the abstracted data, an intrarater reliability test was performed for a random sample of 58 cases (4%). The sample size falls short of the generally considered adequate sample size of 10%. 15 However, the proclaimed minimal sample size of 30 was met. 16 Accordingly, intrarater reliability was measured with Cohen's kappa and as percent agreement between the two time points of data entry. 16 Moderate to perfect matches were achieved (Online Supplemental Table 3).
Results
The study population included 1278 children and adolescents (564 males [44.1%] and 714 females [55.9%]) who visited our PED 1447 times. Of these visits, 1359 (93.9%) were primary consultations, and 88 (6.1%) were transfers from other hospitals. Of the children, 1149 had one visit, 102 had two visits, and 27 had more than two visits, with a maximum of seven consultations for one patient. The mean age was 11.84 years +/- 4.11 (11.17 +/- 4.15 for males and 12.35 +/- 4.00 for females; MWU: U = 211,883.5; z = -5.68; p < 0.00; Figure 1). Table 1 shows the demographic characteristics of the study population. From January 2018 to December 2024, the relative frequency of all PED visits for headache was 3.6%. For headache visits, the greatest relative increase compared to the 2018 baseline occurred in 2023 (+36.2%) (Figure 2). The strongest decrease occurred in 2020 (−12.9%) (Table 2, Figure 3).
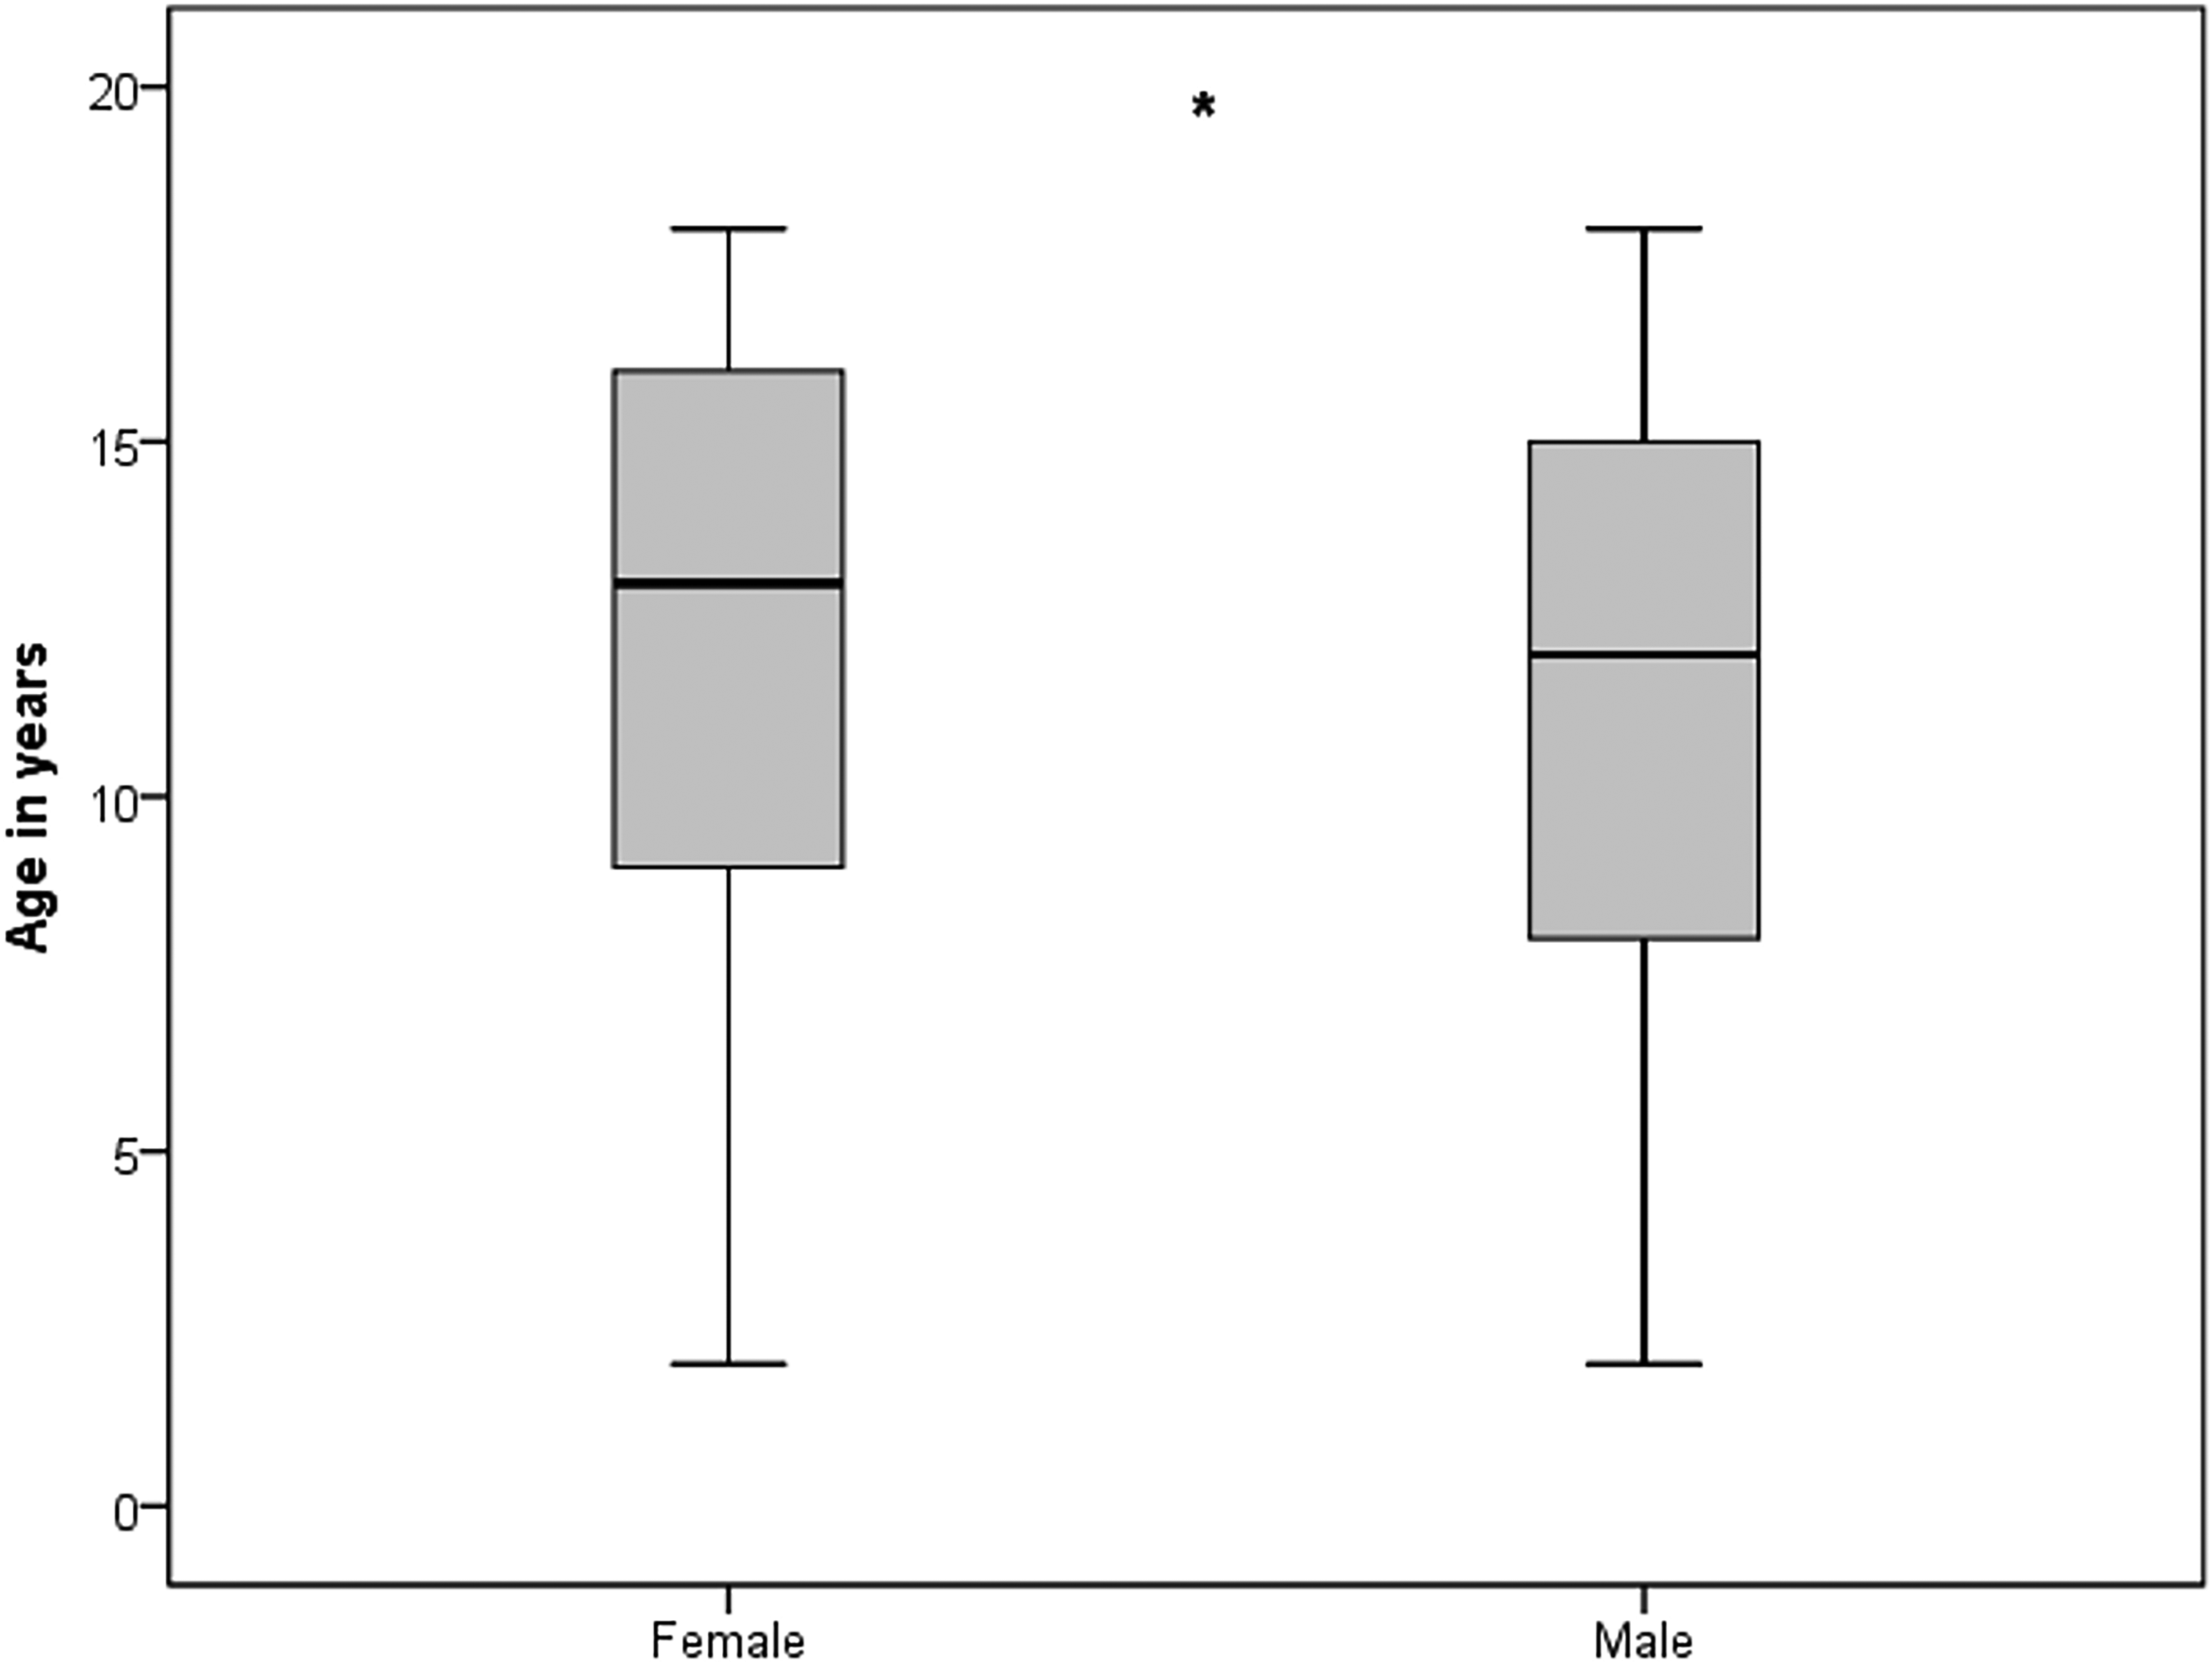
Age and sex of acute PED visits.

Headache visits and total PED visits per year.

Relative changes in headache and total PED visits over time.
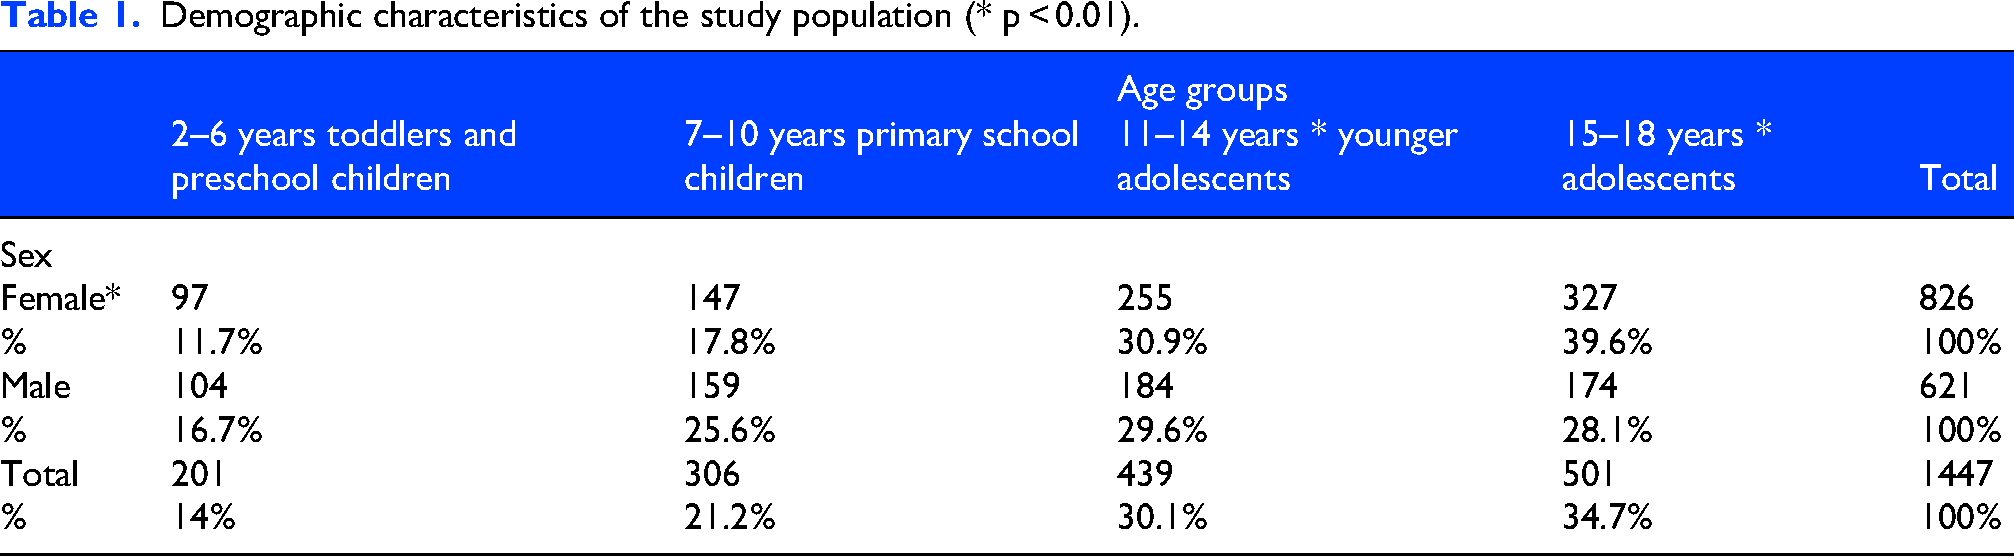
Demographic characteristics of the study population (* p < 0.01).
Total headache visits and total PED visits.

While average headache visits were 15.07 times per month during the pre-pandemic period and 14 times per month during the pandemic period, Figure 4 reveals an increase to 21 times per month during the post-pandemic period. Significant differences in mean headache visits per month during the three periods were revealed (F (1,21):20.1; p:0.014) with a significant difference between pandemic and post-pandemic period (t (55): −4.98; p < 0.001) and pre-pandemic and post-pandemic period (t (47): −4,16; p < 0.001).

Increase in acute headache cases in the post-pandemic period.
PED visits due to headaches showed seasonal variability. The months with the most PED visits due to headaches were January, March, and November, while the months with the fewest visits were February, July, and October (Figure 5). Friedman test revealed a significant difference between the number of cases and the months (Chi-square (1): 1398.9; p < 0.001; n: 1447). Significant differences between the individual months were shown for January and February (MWU: z: −2.39; p:0.016), February and March (MWU: z: −2.60; p:0.009), July and August (MWU: z: −2.01; p:0.044), October and November (MWU: z: −1.97; p:0.048).
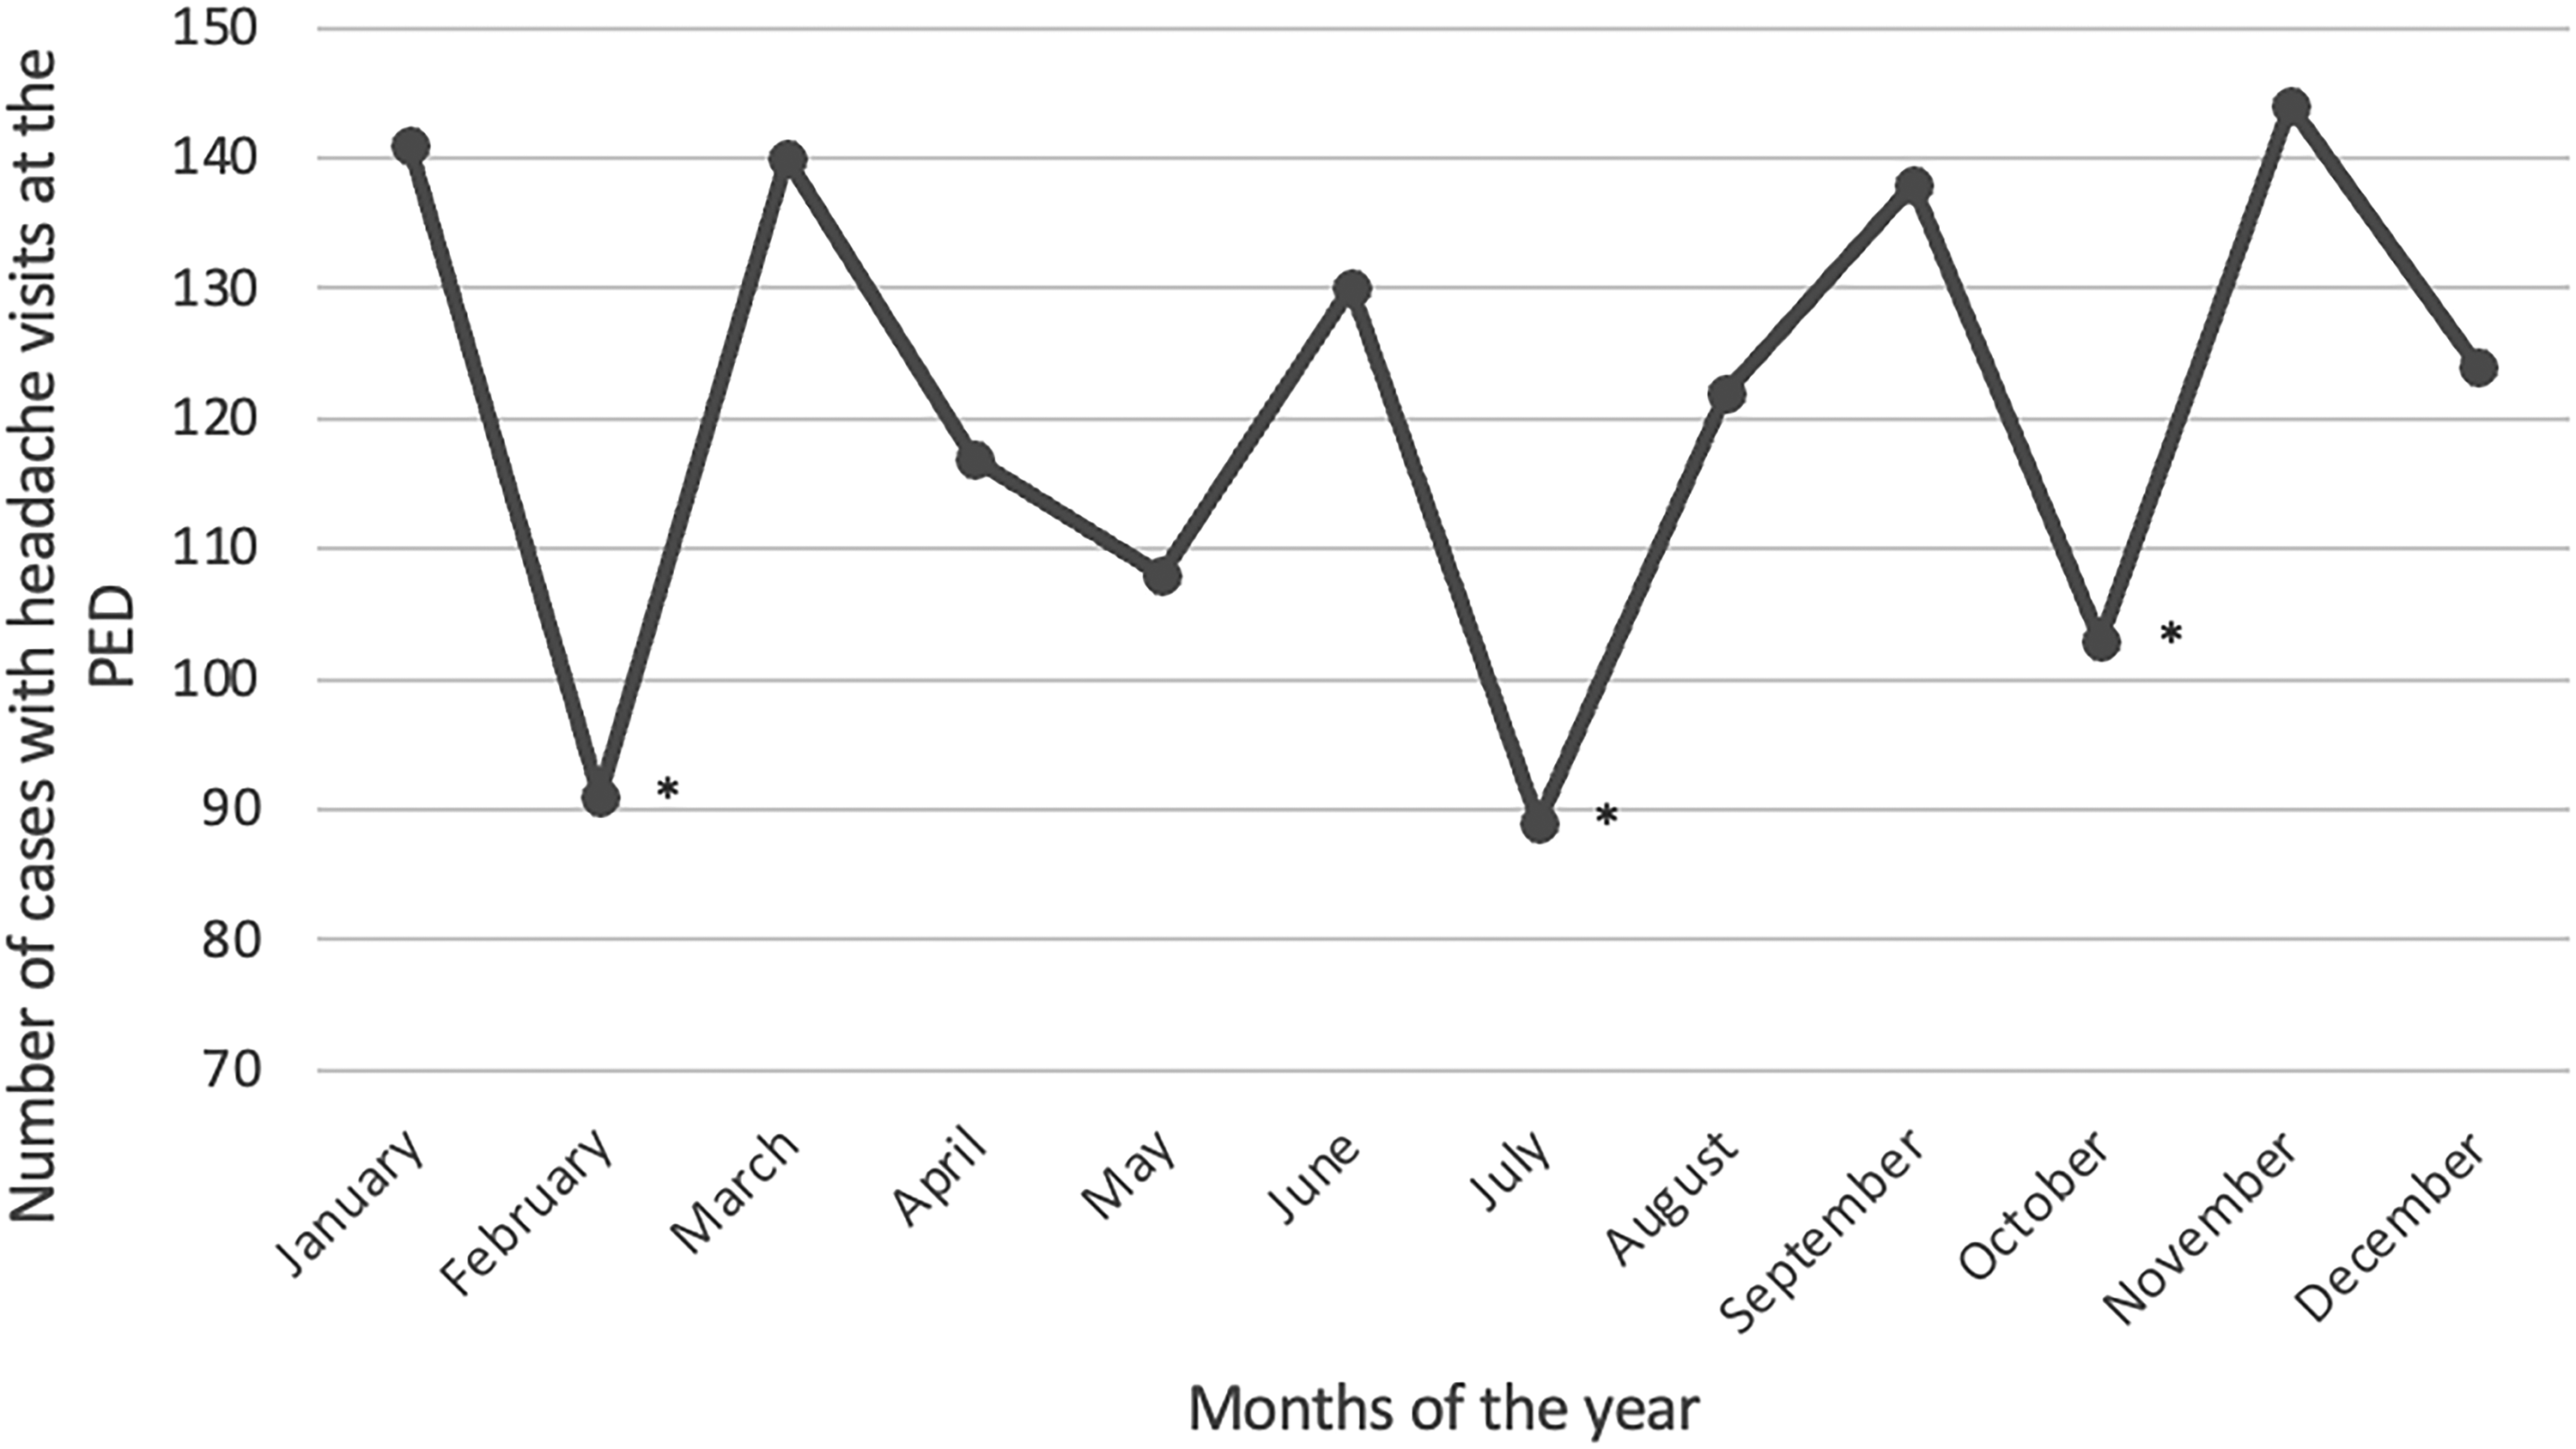
Seasonal variability of PED visits because of acute headaches (between January 2018-December 2024).
Types of headaches and diagnoses
Of all visits, 668 patients (46.2%) had primary headaches, 677 patients (46.8%) had secondary headaches, five patients (0.3%) had cranial neuropathies and facial pain, and 97 patients (6.7%) had headaches that were not clearly classifiable with the existing emergency protocol (Figure 6). Of the 88 patients transferred from other hospitals to the PED, 71 (80.7%) had secondary headaches. Of the patients with primary headaches, 476 (71.3%) had a migraine diagnosis or suspected migraine diagnosis, 117 (17.5%) had a tension-type headache diagnosis, three had trigeminal-autonomic headaches (cluster headacheor hemicrania continua) (0.4%) and 72 (10.8%) had other primary headache diagnoses which could not be classified. In the secondary headache group, infections were the main cause of headaches (405 visits, or 59.8%), especially upper respiratory tract infections (254 visits, or 37.8%). Neurological disorders, such as brain tumors, intracranial vascular diseases, and hemorrhages, were the second most common cause of headaches (134 cases; 19.8%) (Figure 7). Psychiatric disorders accounted for 5.6% (n:38) of secondary headache causes and were associated with acute panic attacks, acute somatic symptom disorders, adjustment disorders and dissociative disorders and intoxications with alcohol and drugs. Cardiovascular disorders (n: 31, 4.6% of secondary headache causes) summarizes acute hypertension, hypertensive crisis and circulatory dysregulations and the category “others” implicated oncological and hematological diseases (leukemia, anemia), rheumatological diseases, endocrinological diseases (diabetes, acute ketoacidosis) nephrological diseases (nephritis, cystitis) and other pain and skeletal diseases (n: 69, 10.2% of secondary headache cases). Table 3 shows the diagnoses for secondary headache causes divided by age groups. The analysis of the distribution for primary and secondary headaches over the years revealed that there was an increase in secondary headaches in 2022, whereas in the years 2018–2021 there were significantly more consultations due to primary headache disorders. Chi-square test revealed an unequal distribution of primary and secondary headaches over the years (Chi-square (12):22.12, p:0.036; Cramer`s-V: 0.087) (Figure 8).
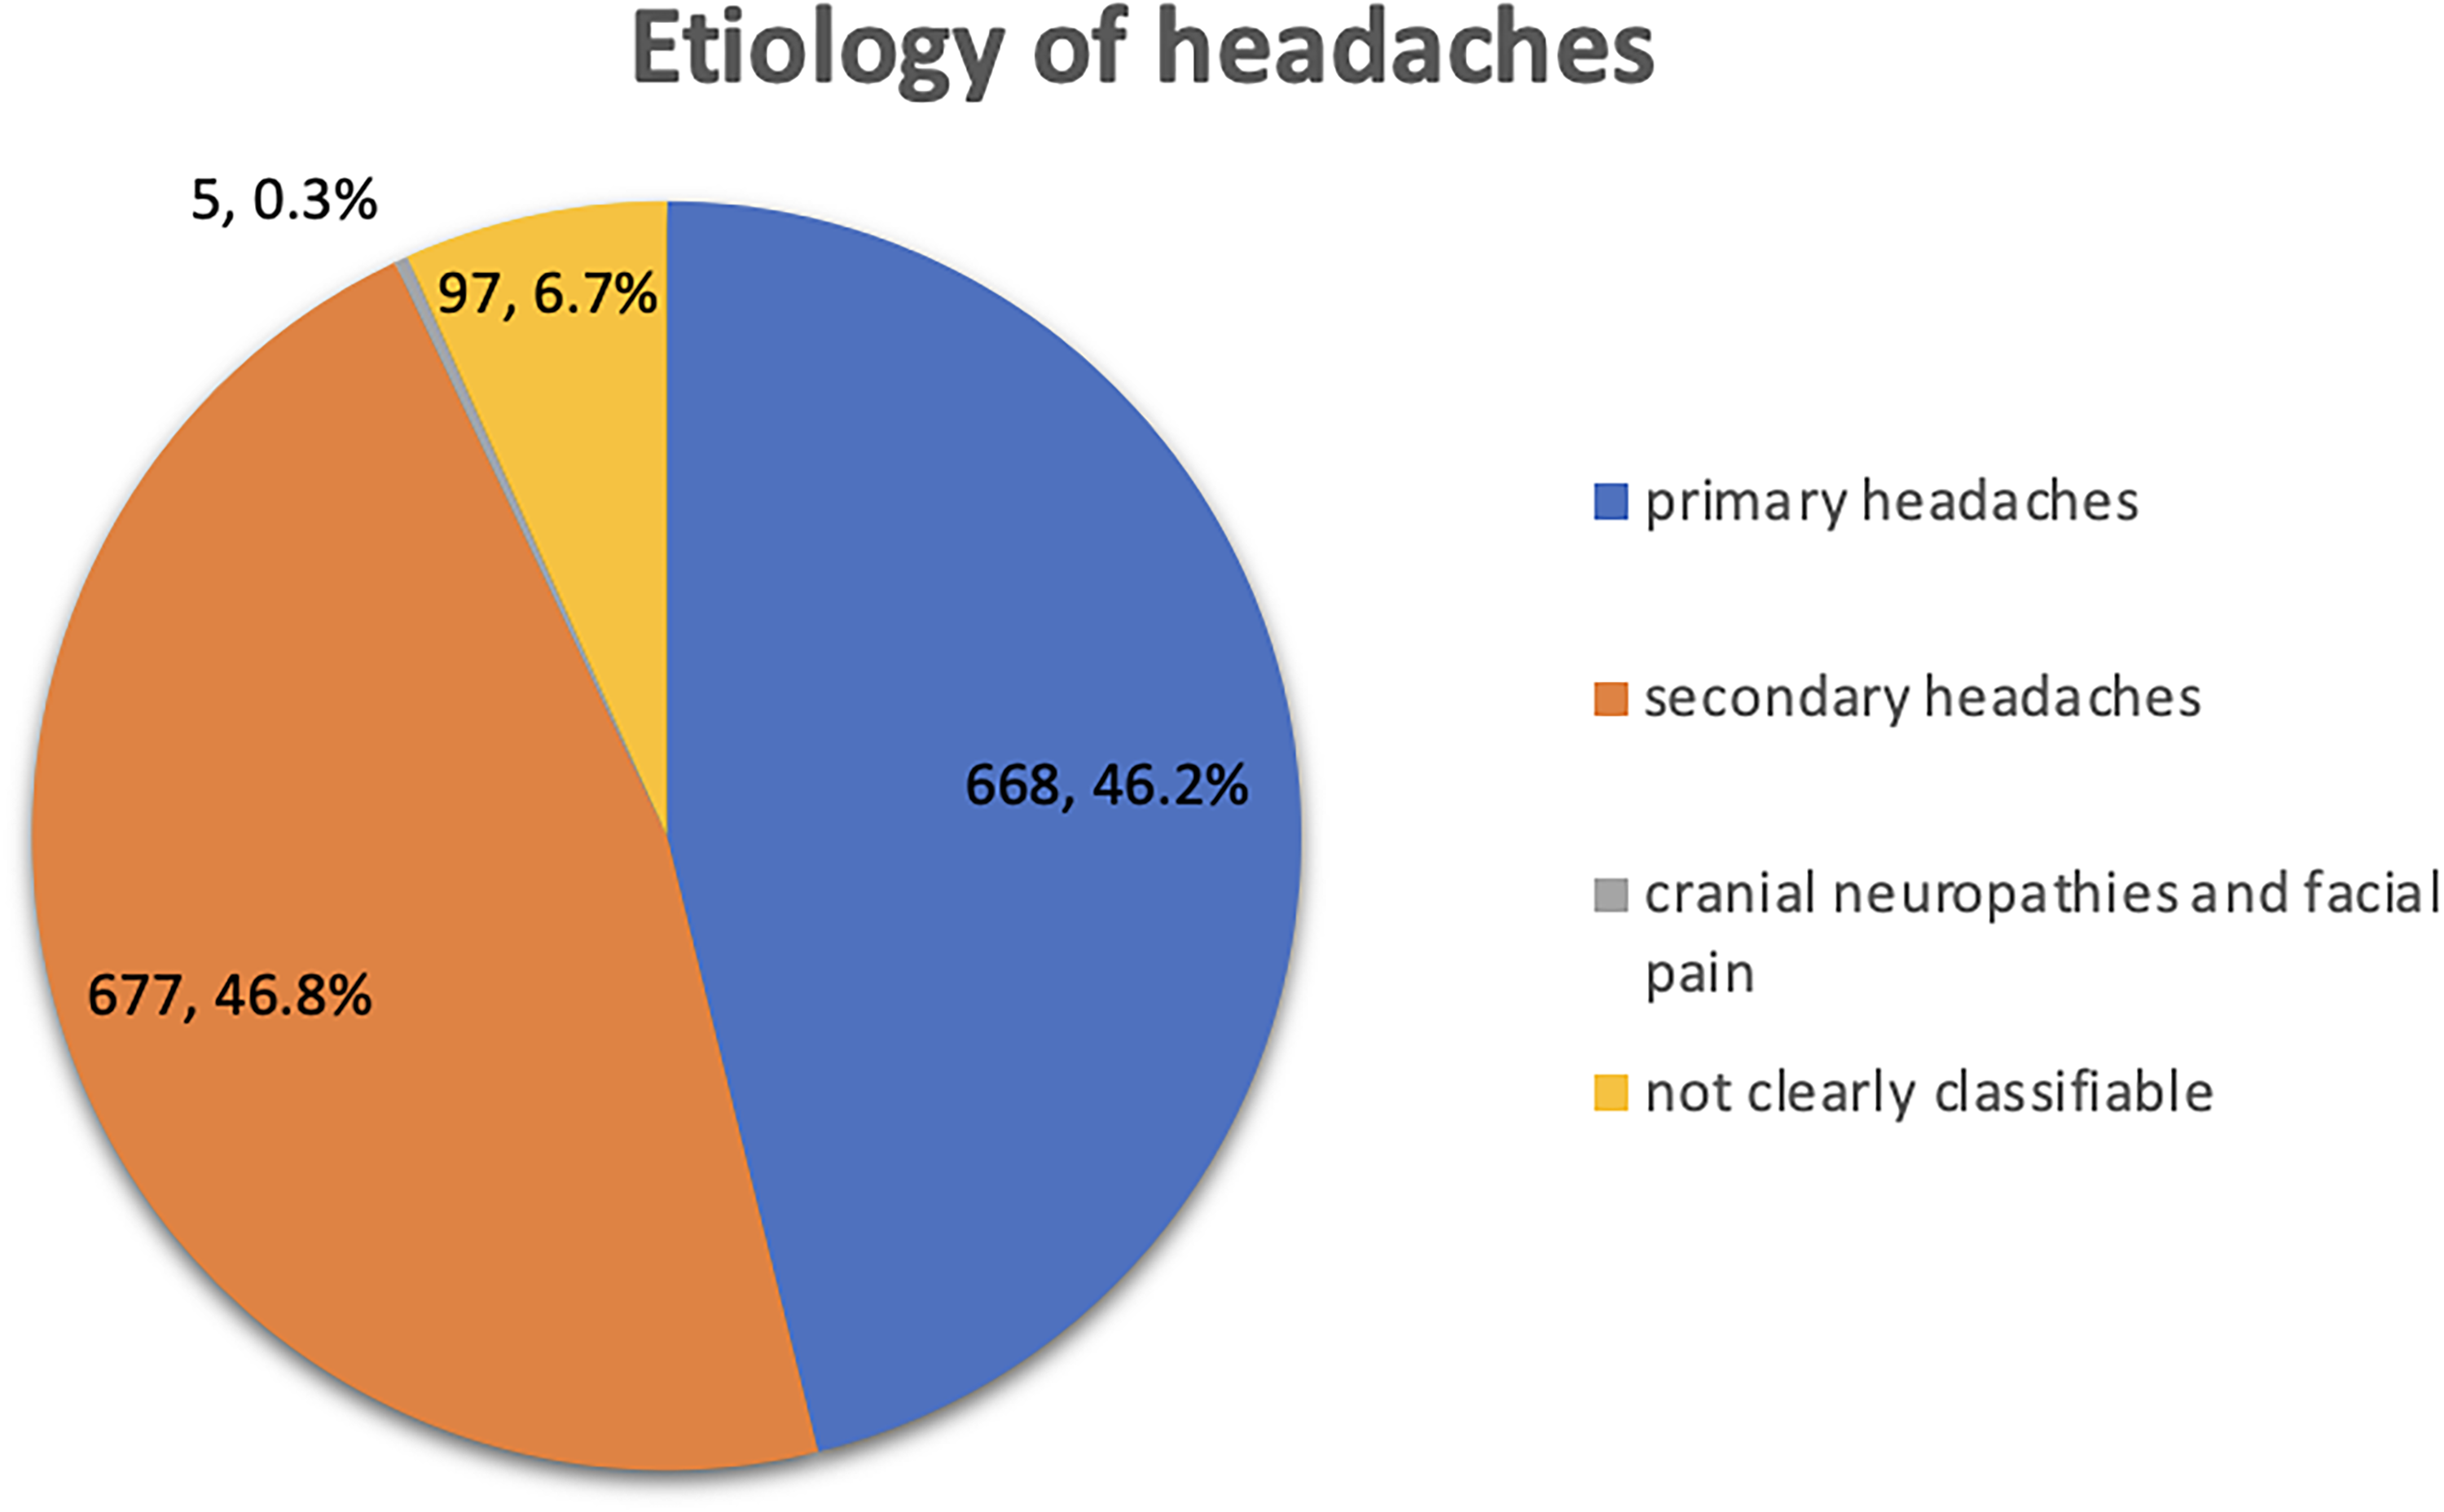
Etiology of headaches.

Causes of secondary headaches.

Relative frequency of headache groups for the years 2018–2024.
Distribution of secondary headaches divided by age group; *other neurological disorders implicated epilepsies, intracranial hypertension, hydrocephalus, other brain nerve diseases and ophthalmological disorders;**others implicated oncological and hematological diseases, rheumatological diseases, endocrinological diseases, nephrological diseases and other pain and skeletal diseases.

Red flag symptoms and diagnostics at the emergency department
In 1347 headache cases presenting at the PED, an MTS category was available. The MTS triage categories were as follows: 11 cases (0.8%) required immediate consultation, 208 visits (15.4%) were classified as very urgent, 662 cases (49.1%) as urgent, 452 cases (33.6%) as standard, and 14 cases (1%) as non-urgent (Table 8). All patients underwent a full physical examination, including a neurological examination, except for two patients who left the PED early. Blood samples were collected in 788 cases (54.5%), urine diagnostics were performed in 157 cases (10.9%), an ECG was performed in 117 cases (8.1%), and a lumbar puncture was performed in 64 cases (4.4%). Specialist consulting visits were requested for 383 cases: Of these, 324 were ophthalmological visits (22.5%), and 59 were otorhinolaryngological visits (4.1%). An external ophthalmological report existed in 59 cases. Of the ophthalmological visits, 321 (83.8%) had no pathological findings, 34 (8.9%) had papilledema, in one case (0.3%) papilledema could not be excluded, and 27 (7.0%) had other ophthalmological fundus findings. An EEG was performed in 46 cases (3.2%). Immediate neuroimaging was performed in 278 (19.1%) cases. Of those, 272 (97.8%) had a brain MRI scan and six (2.2%) had a brain CT scan. Furthermore, an additional 221 (15.3%) inpatient patients underwent a brain MRI scan within two days. Of the 1447 visits, 150 (10.4%) involved patients who already had a brain MRI report from an external radiologist. A recommendation for an outpatient brain MRI scan was made in 66 cases. Abnormal findings were detected in 27% (187 out of 692 brain MRIs (immediate/subacute/outpatient/primary hospital) and four out of the six brain CTs) of brain neuroimages. Five hundred and five (73%) brain MRIs were without abnormal findings. In 427 of the 505 cases (84.5%) without abnormal brain MRI findings, at least one clinical red flag symptom was present. Online Supplemental Table 6 provides a table of abnormal MRI findings.
The clinical red flag symptoms “neurological deficit or dysfunction” (p < 0.001; OR: 5.31; 95% CI:3.84–6.87), “pattern change of headache” (p < 0.001; OR: 4.05; 95% CI: 2.80–5.86), “positional headache” (p:0.012; OR:3.93; 95% CI: 1.29–1192) and “papilledema” (p < 0.001; OR: 5.15; 95% CI: 2.49–10.67) were significantly associated with moderate effects for the clinical indication for acute brain MRI scans. Small effects were detected for “sudden or abrupt onset” (p < 0.001; OR:2.02; 95% CI: 1.41–2.91), “progressive headache” (p < 0.001; OR: 2.03; 95% CI: 1.47–2.79) and “severe vomiting” (p < 0.001; OR: 2.51; 95% CI: 1.88–3.35). A small effect was found for the orange flag symptom “isolated fever” and the decision, not to initiate an acute brain MRI scan (p < 0.001; OR: 0.17; 95% CI: 0.17–0.35) (Online Supplemental Table 4).
All red flag symptoms were analyzed for abnormal brain MRI findings. The analysis revealed significant associations with a moderate effect for “systemic symptoms including fever” (p < 0.001, OR: 6.05; 95% CI: 2.96–12.38), “progressive headache” (p < 0.001, OR: 3.6; 95% CI: 2.42–5.35) and “papilledema in ophthalmologic consultation” (p < 0.001, OR: 4.61; 95% CI: 2.19–9.64). Significant associations with small effects were detected for the red flags “Neoplasm in personal history” (p:0.002; OR: 2.72; 95% CI: 1.39–5.31) and “severe vomiting” (p < 0.001; OR: 2.48; 95% CI: 1.73–3.55). The red flag symptom “sudden or abrupt onset” was significantly associated with a small association for not having a pathological finding in brain MRI (p:0.03; OR: 0.53; 95% CI: 0.20–0.95) (Table 4).
Association between abnormal brain MRI and red flag symptoms.
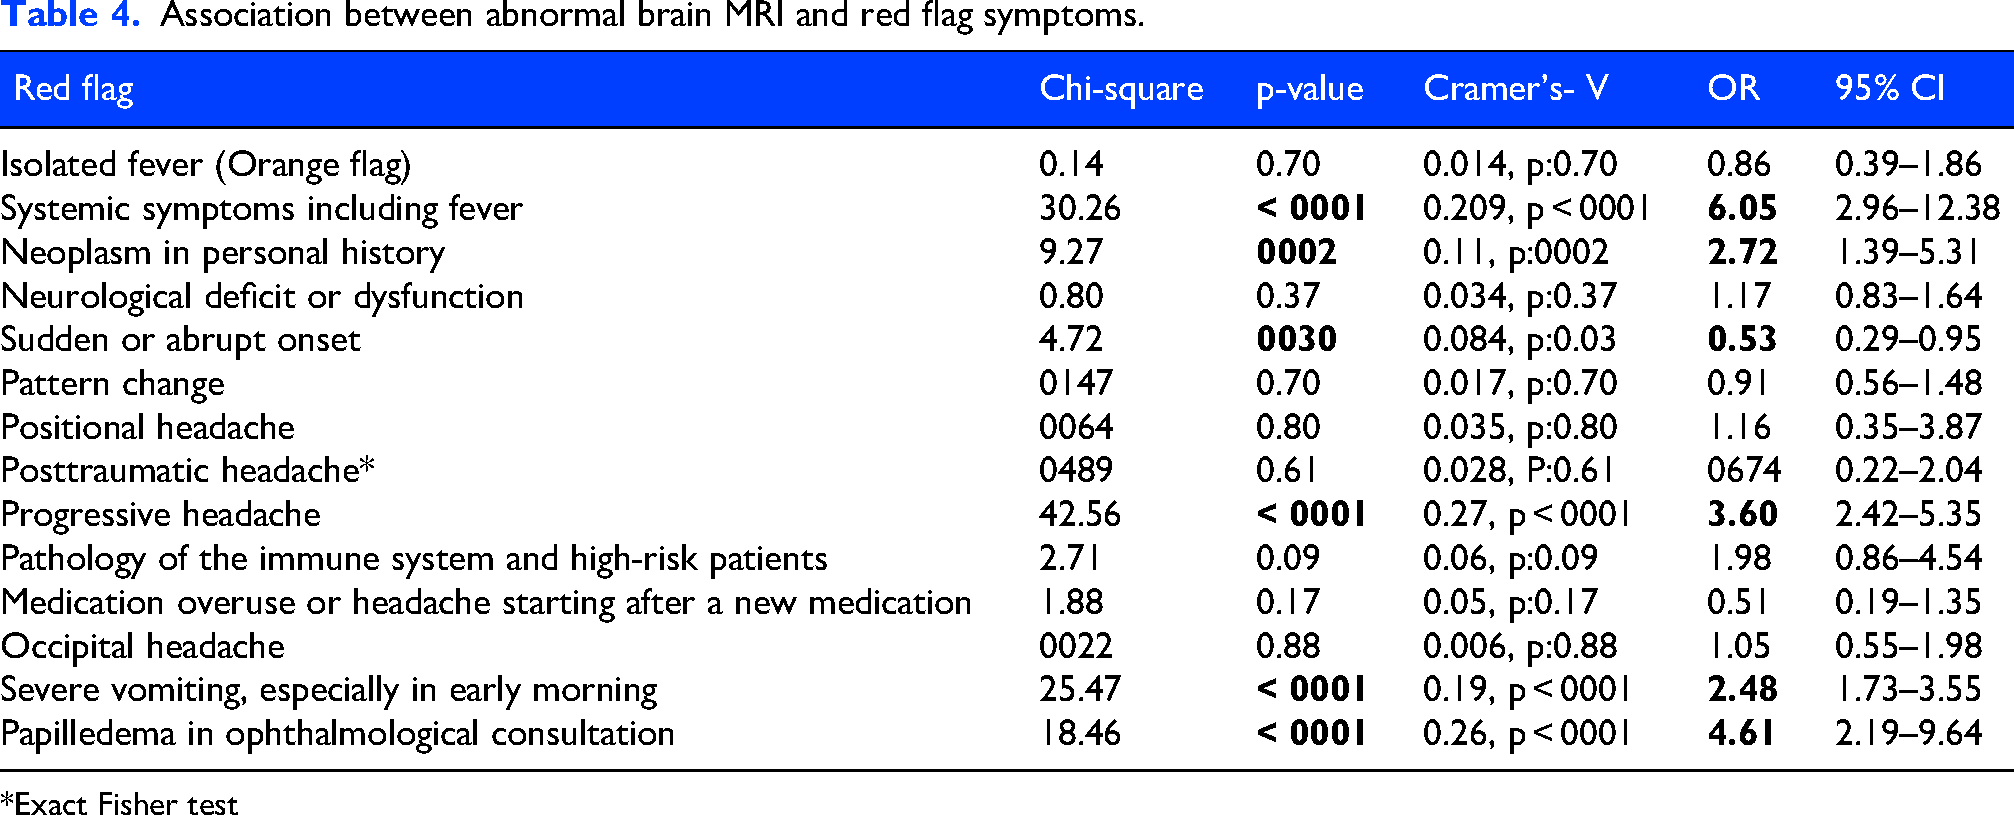
*Exact Fisher test
The presence of red flag neurological deficits or dysfunctions can be caused by various symptoms and clinical signs. The following clinical signs were analyzed for significant association to the clinical decision for an immediate brain MRI examination: “visual disturbances,” “paresthesia,” “pupillary difference,” “ataxia,” “paralysis or weakness,” “drowsiness, confusion, or change in character,” and “meningism.” For the clinical signs “visual disturbances” (p:0.002; OR: 1,56; 95% CI: 1.17–2.08), “paresthesia” (p < 0.001; OR: 2.08; 95% CI: 1.51–2.86), “ataxia” (p < 0.001; OR: 5.65; 95% CI: 3.07–10.37) and “meningism” (p:0.009; OR: 2.43; 95% CI: 1.22–4.83) small, but significant associations were revealed. The clinical signs “paralysis or weakness” (p < 0.001; OR: 4.49; 95% CI: 3.03–6.66) and “drowsiness, confusion or change in character” (p < 0.001; OR: 3.54; 95% CI: 2.52–4.97) revealed moderate significant associations to the clinical decision for immediate brain MRI scans (Online Supplemental Table 5).
The analysis for associations of clinical signs and new abnormal brain MRI findings showed significant, but small associations for the presence of a “pupillary difference” (p:0.048; OR: 3.31; 95% CI: 0.99–10.99), “ataxia” (p < 0.001; OR: 3.06; 95% CI: 1.59–5.88) and “meningism” (p:0.010; OR: 2.81; 95% CI: 1.24–6.38).
There was a small association for “paresthesia” and “no new abnormal findings” in the brain MRI (p < 0.001; OR: 0.26; 95% CI: 0.15–0.45) (Table 5).
Association between abnormal brain MRI and neurological clinical signs.

*Exact Fisher test.
Recorded pain scores and pharmacological therapy
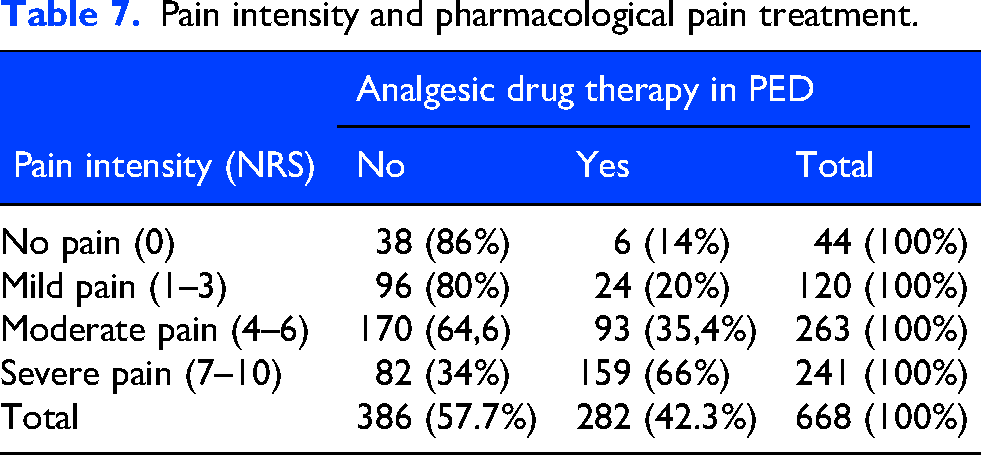
Of all visits (n:1447), 461 patients (31.9%) received pharmacological analgesic therapy, and 49 patients (3.4%) received a combination of two analgesic drugs. Five hundred and twenty four patients (36.2%) visited the PED due to headaches after receiving drug therapy at home. The two most commonly administered drugs in the PED were ibuprofen (n:154, 33.7%) and metamizole (dipyrone). Metamizole was administered intravenously in 97 cases (21.2%) and orally in 90 cases (19.7%). Opioids were administered in six cases (1.3%) of severe secondary headaches (dissection of a vertebral artery, cerebral infarction, meningism with brain abscess and pain exacerbation with brain tumor) and Gabapentin was administered in one case (0.2%) of a pain exacerbation in trigeminal-autonomic facial pain (Table 6). A pain scale was recorded in 668 cases (46.1%) to identify the severity of headaches before receiving analgesic drug therapy. In 541 cases (81%), pain intensity was assessed using a numeric rating scale (NRS). The Facial Pain Scale (FPS) was applied in 58 cases (8.7%), while 42 patients (6.3%) were evaluated with both instruments. In 27 cases (4%), the specific pain assessment was not documented. When distributing into age groups, only 42 pain assessments were made for children 2–6 years and 36 of these cases received a NRS assessment. Age distribution of pain assessment is shown in Online Supplemental Table 10. In 56 cases (3.8%), a pain assessment was recorded after receiving analgesic drug therapy. The mean pain intensity on NRS/FPC was 5.24 (SD: ±2.57). There was an association between pain intensity and pharmacological pain treatment (Chi-square (3): 99.84, p < 0,001, Cramer's-V: 0.38). In post-hoc analysis, the observed values for the categories “no pain”, “mild pain” and “moderate pain” were associated with not receiving a pharmacological pain treatment, and “severe pain” was significantly associated with receiving a pharmacological pain treatment (Table 7).
Analgesic headache treatment at the PED distributed by age group (type of analgesia was not documented in four cases).

Pain intensity and pharmacological pain treatment.
Additionally, the relationships between pharmacological pain treatment and other determinants like sex, age groups, language barrier and the triage category according to MTS were investigated. There was an association between age groups and analgesic drug therapy (Chi-square (3): 9,77, p: 0.021, Cramer's-V: 0.08). The post hoc analysis only revealed an association among the 15- to 18-year-old age group, receiving pharmacological pain treatment. Furthermore, an association between MTS and analgesic drug therapy (Chi-square (4): 47.41, p < 0.001, Cramer's-V: 0.18) was found. The post-hoc analysis showed for the triage group “very urgent” an association towards receiving pharmacological pain treatment and for the triage group “standard” an association for not receiving a pharmacological pain treatment (Table 8).
Association between sex, age group, language barrier, MTS category and pharmacological pain treatment. (p < 0.05), * significant association in post hoc analysis

Of the 1359 cases that were primary consultations in our PED, 629 (43.5%) received outpatient treatment, 807 (55.8%) were admitted as inpatients, and 11 (0.7%) left the PED against the recommendation of the physicians.
Discussion
Headaches are a common reason for admission to a PED in children and adolescents.8,10 There are only a few older studies that address this topic. In our retrospective analysis, we describe a large population of children and adolescents with headaches from the longest study period in Germany so far, including the time during the Covid-19 pandemic with multiple lockdowns.
The relative frequency with which children presented to the PED with an acute headache was 3.63% in our cohort. This is at the higher end of the range reported in previous studies, which documented headache-related visits ranging from 0.7% to 3.8%.8,17–19 One possible reason for this difference is the varying observation periods across these studies. Only Güngör et al. 19 (2016–2020; 0.19% headache visits) and Raucci et al. 20 (2017–2018; 0.12% headache visits) included data after 2015 and reported considerably lower relative frequencies of headache visits. In a retrospective analysis examining the most common reasons for PED visits between 2019–2022, headache visits accounted for 2.34% of presentations to the PED. Compared to that, in central emergency departments the relative frequency of headache visits in children and adolescents was at 3.23%, similar to our study. 21 The age distribution also significantly influences case numbers. We only considered children over two years of age and compared that patient group to the total number of PED visits for children in the same age range. This is because the ability to identify and communicate pain verbally or non-verbally usually develops between the ages of 18 months and three years. 22 A large-scale epidemiological study in the United States found that visits to PED due to headaches increased by 166% over ten years, rising from 18,041 cases in 2003 to 48,020 cases in 2013. During the same period, the total number of PED visits increased by 57.6%. Perry et al. referred to this increase as a “modern epidemic”. 23 Our 7-year retrospective analysis reveals a significant relative increase for PED visits with headache as the leading symptom of 34.1% during the observation period from 2018 to 2024 in relation to 13% increase in all PED visits.
As in previous studies,8,10 school-aged children and adolescents represented most of the visits for headaches. There was an increasing sex shift toward female consultations among adolescent girls, consistent with previous data showing a sex shift in that age group.5,24 In our study population, the amount of primary headache diagnoses was almost equal to the amount of secondary headache diagnoses, inconsistent to other studies, where secondary headaches were more prevalent.6,16,24 There has been an increasing prevalence of primary headache diagnoses reported in different studies, particularly among adolescents.5,25 Reasons such as social distancing during the pandemic and increased smartphone and social media use26,27 could be new risk factors for precipitation of primary headaches and chronification, in addition to dysfunctional family situations, alcohol and caffeine consumption, smoking, low physical activity levels, physical or emotional abuse, bullying or insufficient leisure time as suggested by Straube et al. 25 Therefore, a collaboration with outpatient headache centers should be encouraged. The increase in the appearance of headaches, especially in 2022 and 2023 after the pandemic, in the secondary headache group could be associated with higher infection rates in general after social distancing, as well as an increase in secondary complications after ENT (Ear, Nose, Throat) infections.28,29 For instance, a survey by the European Society for Pediatric Neurosurgery (ESPN) revealed a substantial rise in pediatric neurosurgical cases, with 28.3 cases per year occurring in the pre-Covid period and 86 cases per year in the post-Covid period. The most common intracranial complications of sinusitis and otitis were extradural and subdural empyema, as well as brain abscesses (17% pre-Covid and 73% post-Covid). 30 One reason could be immunity debt as an indirect effect of pandemic conditions. Additionally, the increase in invasive Streptococcus A infections in children, who often experience headaches as a symptom, which peaked in the second and third quarters of 2023 -a year after the pandemic. This may have contributed to the higher number of secondary headache cases.31,32
The seasonal variability of monthly headache visits at the PED revealed the lowest case numbers in February, July and October. The Summer, Autumn, and Winter holidays in Saxony between 2018 and 2024 were commonly during those months. 33 This result is similar to those from previous studies on seasonal variability, which discussed the organization of the school year as the main influencing factor.10,34 The peak of headache cases during school periods might be associated with academic stressors. 35
In our study, immediate neuroimaging was performed in 19.1% of all acute headache cases, which is similar to previous studies. In a Turkish study, 558 pediatric patients who attended the emergency department between 2016 and 2020 were analyzed retrospectively. Of the Turkish cohort, 11.3% had a brain MRI, and a pathological finding was made in 1.25% of those. 19 Tsze et al.37 enrolled 224 pediatric patients with headaches who were attending the PED. Of these patients, 33% received a brain neuroimaging when at least one red flag symptom was present. 36 An Italian study found that 173 of 890 children (19.4%) received neuroimaging with abnormalities in 15.6%. 37 An overview and comparison of previous studies on acute neuroimaging for headache in PED is shown in Online Supplemental Table 9. Methodological differences, study time point and infrastructural conditions need to be considered when comparing the different results. In a Swiss emergency department, neuroimaging in adults with acute nontraumatic headaches showed a prevalence of 26.7% (303 out of 1132 patients), with abnormal findings in 23.1% of the neuroimagings. 38 A study in Australia found that 38% of adult patients presenting with an acute headache received neuroimaging. The majority of cases were benign headaches, and life-threatening events made up only 3% of diagnoses. 39 Abnormal neuroimagings were detected in 27% (187 of 692 brain MRIs and four of six brain CTs) in this study. This is a higher percentage than reported in the literature. In the presented analysis, all MRI findings, including those from transfers from primary hospitals, outpatient and subacute MRI results were included. This may represent a bias towards higher numbers of abnormal MRI findings compared to previous studies, which did not include referrals from other hospitals or MRI findings outside the PED.
In our analysis, the red flag symptoms “systemic symptoms including fever”, “progressive headache”, “severe vomiting”, “neoplasm in personal history” and “papilledema” showed effects of having an abnormal finding in brain MRI. The red flag “neurological deficit” was associated with undergoing an immediate MRI scan at the PED, but no association was made with pathological findings. Rossi et al. showed in an Italian analysis, that the clinical symptoms cranial nerves palsy, ataxia, drowsiness and strabism were significantly associated with abnormal findings in a brain MRI scan. 10 In our analysis the clinical signs “pupillary difference”, “ataxia” and “meningism” showed a significant correlation for new abnormal MRI findings. Interestingly, the red flag symptom “sudden or abrupt onset of headache” and the clinical sign “paresthesia” were significantly associated with “no new abnormal finding in brain MRI”. Symptoms of migraine with aura can involve paresthesia in different areas of the body and can also manifest as moving paresthesia. A detailed medical history with regards to previous history of migraine or recurrent headaches is important. Adolescent migraine patients often present with comorbid psychiatric disorders like anxiety, 40 including panic attacks. In addition, hyperventilation due to pain and panic may also lead to paresthesia and could have been misinterpreted in the PED. In summary, a detailed inquiry regarding the localization, spread, length of time and regression of this symptom could help to avoid immediate MRIs in migraine with aura presenting in PED. In approximately three out of four cases, brain MRI showed no pathological findings. This underlines the need for immediate neuroimaging decisions to be based on a comprehensive headache history—including a thorough assessment of red flag symptoms—and a detailed neurological examination focused on relevant clinical signs. However, a first presentation of migraine aura symptoms requires a diagnostic MRI since rare cases of secondary headaches can mimic a migraine with aura. 41 Our study includes a high number of acute brain MRI scans (97.8% brain MRI vs. 2.2% brain CT), whereas most other international studies used CT scans for acute neuroimaging due to easier access and faster examination. The advantage of an MRI scan is that it provides more information without radiation. However, the cost of an MRI and potential sedation or general anesthesia for some patients need to be considered.
Only 31.9% of patients who visited our PED due to an acute headache received pharmacological pain treatment, and only 46.1% of patients had a pain assessment. Unfortunately, undertreatment of pain is still common in PED. Rossi et al. demonstrated comparable pain treatment rates of 37.2%. 10 In an Australian survey, pain scales were used for less than half of admissions, 42 and in a nationwide Italian study of pediatric headaches, 41.5% of patients received a pain assessment during triage. 11 Pain assessment can be especially difficult for younger children of preschool age, and age adapted pain scales should be used, such as the Face Pain Scale. 43 Headache-specific guidelines that recommend acute treatment for primary headaches exist in Germany. However, there are currently no guidelines for the treatment of pediatric headaches in PED, which may lead to inadequate medical care with analgesics in the PED. Additionally, the lack of a standardized protocol and different levels of staff training may have led to difficulties in providing accurate pain treatment. To address this problem, the PED team recently developed a nurse-based protocol for acute pain treatment. The algorithm foresees a pain assessment during the triage using a pain score appropriate for age and cognitive function. Depending on the pain score, pharmacological and/or non-pharmacological pain treatment will be applied. Nurses inform the physician on administered pharmacological pain treatment. A re-evaluation of the pain score takes place 15 to 30 minutes after the initial pain treatment. During the implementation phase, nurses and physicians receive training on acute pain management in the PED. The nurse-based protocol aims to establish a higher rate of accurate pain assessments, a higher rate of acute pain treatment, a shorter time to analgesia administration and ultimately a better treatment for children and adolescents with headache or pain.
Limitations
The retrospective and monocentric study design and the lack of complete medical records limit the study. To determine the relative frequency of headache cases, the total number of PED visits from 2018 to 2024 was extracted from the hospital's administrative data. Due to the large volume of cases, individual review of each case to verify inclusion criteria was not feasible, which may have led to some headache cases being missed. Also, blinding of the abstractor was not implemented, what might be a reason for abstractor bias. Including transfers from other primary or secondary hospitals may reveal a selection bias for secondary headaches.
To assess the pain intensity in the PED, NRS and FPS were the only applied pain scores. Children need a numerical understanding to accurately score their pain level on a scale of 0–10, which is why the FPS or, depending on the cognitive function, the FLACC-R (Face, Legs, Activity, Cry, Consolability – revised score) is suitable for children below the age of seven. However, as Online Supplemental Table 10 shows, the NRS was applied in 36 cases in the 2–6 age group as proxy or observer-based assessment. In retrospect, it is not possible to determine whether the child's pain intensity was assessed by caregivers or by the medical team.
Conclusion
Visits to the pediatrician for headaches have increased, especially since the Covid pandemic. The high rates of primary headache diagnoses and insufficient use of pain scales and pain treatment rates indicate the need for more education for pediatricians and parents, as well as collaboration with outpatient headache centers. A detailed headache history and description of accompanying symptoms for migraine with aura could help to avoid immediate neuroimaging in migraine patients. For secondary headaches, basic for the decision to undergo acute neuroimaging is a detailed headache history and a detailed neurological examination that checks for red flag symptoms and clinical features.
Clinical implications
A high prevalence of primary headaches and insufficient use of pain scales and pain treatment indicates the need for more education for pediatricians and parents.
Collaborations with outpatient headache centers need to be further expanded.
A detailed headache history, description of accompanying symptoms and neurological examination that checks for red flag symptoms implicate the decision to undergo immediate neuroimaging.
Supplemental Material
sj-docx-1-cep-10.1177_03331024261431339 - Supplemental material for A 7-year retrospective analysis of the management of children with acute headache presenting in a pediatric emergency department
Supplemental material, sj-docx-1-cep-10.1177_03331024261431339 for A 7-year retrospective analysis of the management of children with acute headache presenting in a pediatric emergency department by Laura Zaranek, Peter Zsoldos, Matthias Richter, David Brandt, Sarah Lampe, Gudrun Gossrau and Sebastian Brenner in Cephalalgia
Supplemental Material
sj-png-2-cep-10.1177_03331024261431339 - Supplemental material for A 7-year retrospective analysis of the management of children with acute headache presenting in a pediatric emergency department
Supplemental material, sj-png-2-cep-10.1177_03331024261431339 for A 7-year retrospective analysis of the management of children with acute headache presenting in a pediatric emergency department by Laura Zaranek, Peter Zsoldos, Matthias Richter, David Brandt, Sarah Lampe, Gudrun Gossrau and Sebastian Brenner in Cephalalgia
Footnotes
Ethical considerations
The study protocol was approved by the Ethics Board of TU Dresden (protocol number BO-EK-337082024).
The study has also been officially registered on the public webpage of the German Clinical Trials Register (GermanCTR) at ![]() (Clinical Trial Number/ DRKS-ID: DRKS00036917, Date of Registration: 2025–05-16, last update: 2025-07-28, registration type: retrospective, status: recruiting complete, study complete).
(Clinical Trial Number/ DRKS-ID: DRKS00036917, Date of Registration: 2025–05-16, last update: 2025-07-28, registration type: retrospective, status: recruiting complete, study complete).
Author contributions
L.Z., G.G. and S.B. study concept; L.Z. study design, drafting the main manuscript text, prepared all figures and tables; L.Z. and P.Z. acquisition of data, statistical analysis; M.R. and D.B. reviewed the manuscript; S.L. reviewed the statistical analysis; G.G. and S.B. finalization of the manuscript; S.B. supervised the project.
Funding
The authors received no financial support for the research, authorship, and/or publication of this article.
Declaration of conflicting interests
The authors declared no potential conflicts of interest with respect to the research, authorship, and/or publication of this article.
Data availability statement
The data supporting the findings of this study are available upon request to the corresponding authors.
Supplemental material
Supplemental material for this article is available online.