
Abstract
Functional magnetic resonance imaging has proved to be a powerful tool to characterize spatiotemporal patterns of human brain activity. Analysis methods broadly fall into two camps: those summarizing properties of a region and those measuring interactions among regions. Here we pose an unappreciated question in the field: What are the strengths and limitations of each approach to study fundamental neural processes? We explore the relative utility of region- and connection-based measures in the context of three topics of interest: neurobiological relevance, brain-behavior relationships, and individual differences in brain organization. In each section, we offer illustrative examples. We hope that this discussion offers a novel and useful framework to support efforts to better understand the macroscale functional organization of the brain and how it relates to behavior.
Keywords
Introduction
Human neuroscience research continues to reveal the neural processes underlying high-level cognitive functions (Turk-Browne 2013). Functional magnetic resonance imaging (fMRI)-based analyses, by capturing patterns of brain activity that may be local or widespread in space, are uniquely suited to study such neural representations and, by extension, brain organization.
Fundamentally, fMRI analyses all seek to identify spatiotemporal patterns of fluctuations in the blood-oxygen level dependent (BOLD) signal (Fig. 1), but various methods exist to summarize these patterns. These methods broadly fall into two camps (Fig. 2). The first, which we will term “region-based analysis,” focuses on the features of a discrete, clearly demarcated brain area. Such areas could be very small (e.g., a single voxel or region of interest; Fig. 3a and b) or large and relatively heterogeneous (e.g., a lobe or other macroscale region; Fig. 3c), and they may be defined by any number of characteristics, including myeloarchitecture (Fig. 3a), patterns of activity (Fig. 4a), and even interactions with the rest of the brain (see the discussion of connectivity hyperalignment [Guntupalli and others 2018] in section “Regional and Connection-Based Approaches to Individualization”); in practice, the regions studied tend to consist of many voxels selected based on some anatomical (Fig. 3a and Fig. 4b) or functional (Fig. 3c and Fig. 4) principle. Regardless of their size, these regions have clear boundaries that can be drawn on the brain; in other words, they are physical entities that can be interrogated as such (e.g., Fig. 5a). The second approach, which we will call “connection-based analysis,” summarizes spatiotemporal patterns in the brain by explicitly comparing time courses of paired sources (e.g., voxels or multi-voxel nodes). Rather than focusing on an isolated region, this approach characterizes the interactions between regions, yielding metrics that, unlike region-based measures, do not necessarily represent physical brain entities (Fig. 5b; for examples, see Box 1). In graph theory terms, region-based analyses focus on nodes and connection-based analyses on edges.
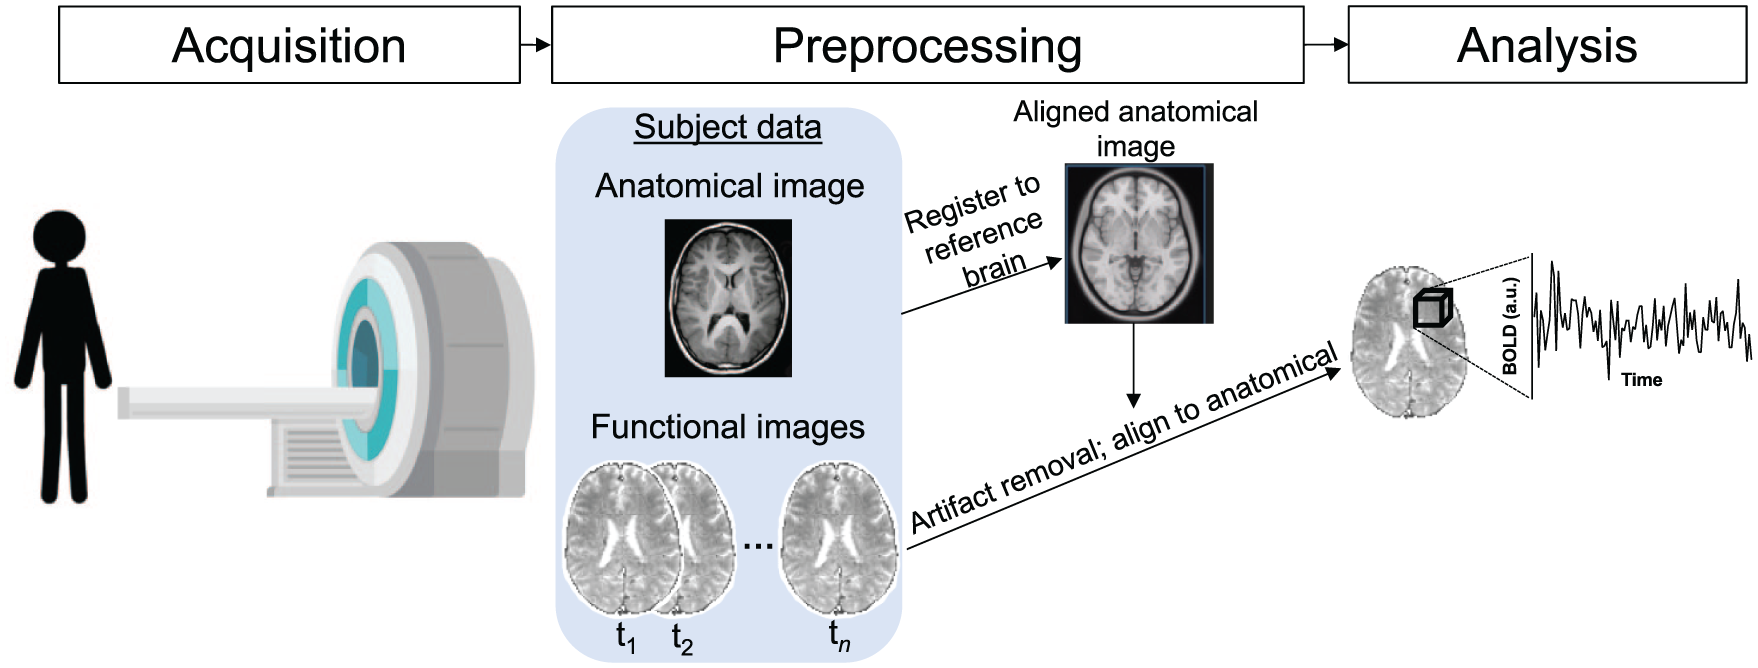
Schematic depiction of functional magnetic resonance imaging (fMRI) data acquisition and processing. The basis of fMRI is the blood-oxygen level dependent (BOLD) signal, which relies on the premise that active neurons consume oxygen, changing the ratio of oxygenated to deoxygenated blood in active brain regions; because oxygenation affects the magnetic susceptibility of hemoglobin, this change can be detected via magnetic resonance imaging. In this figure, we schematically depict the scanning environment in which images are acquired. Images are acquired in two dimensions, with a full brain volume acquired over the course of one to several seconds. After image acquisition, data are preprocessed to remove sources of artefactual signal, align the structural image to a common reference space, and align the functional images to the common-space anatomical image, allowing comparison across subjects. The fundamental spatial unit of fMRI measurements is the voxel, which is a three-dimensional pixel (depicted schematically as a cube), each face of which is typically on the order of several millimeters.
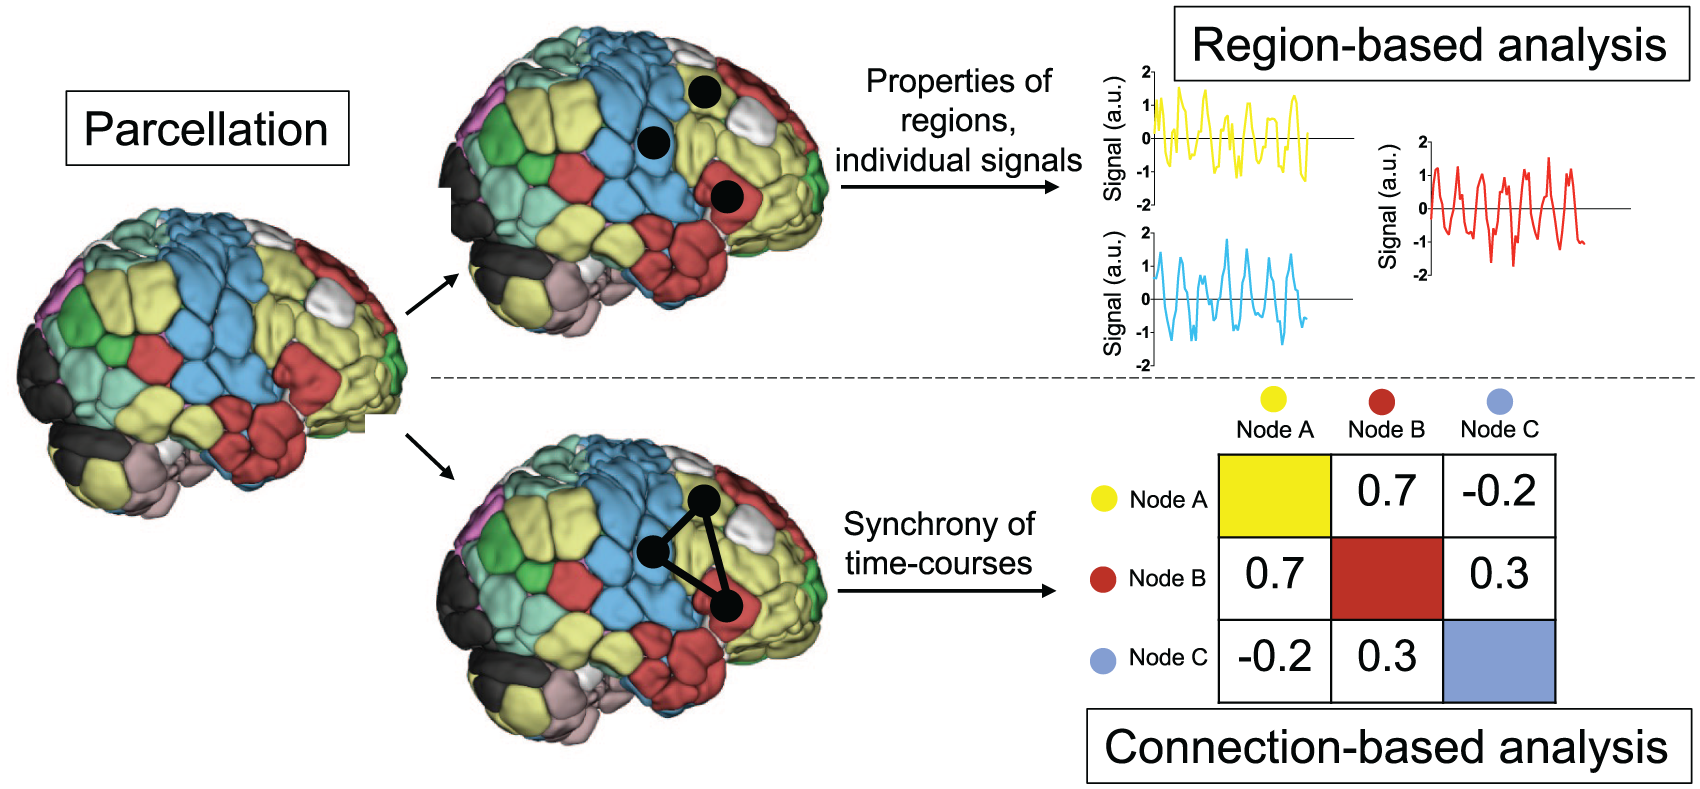
Schematic depiction of functional magnetic resonance imaging (fMRI) region- and connection-based analysis. After preprocessing, researchers may choose to study focal regions and/or the interactions among them. In this schematic depiction of such analyses, every voxel is assigned to a region, as defined a priori by a parcellation. All time courses for voxels in a given region are averaged to yield a mean time course of activity for each region. These regions can then be further characterized, and/or the synchrony between pairs of such regions can be quantified to yield connection-based measures.
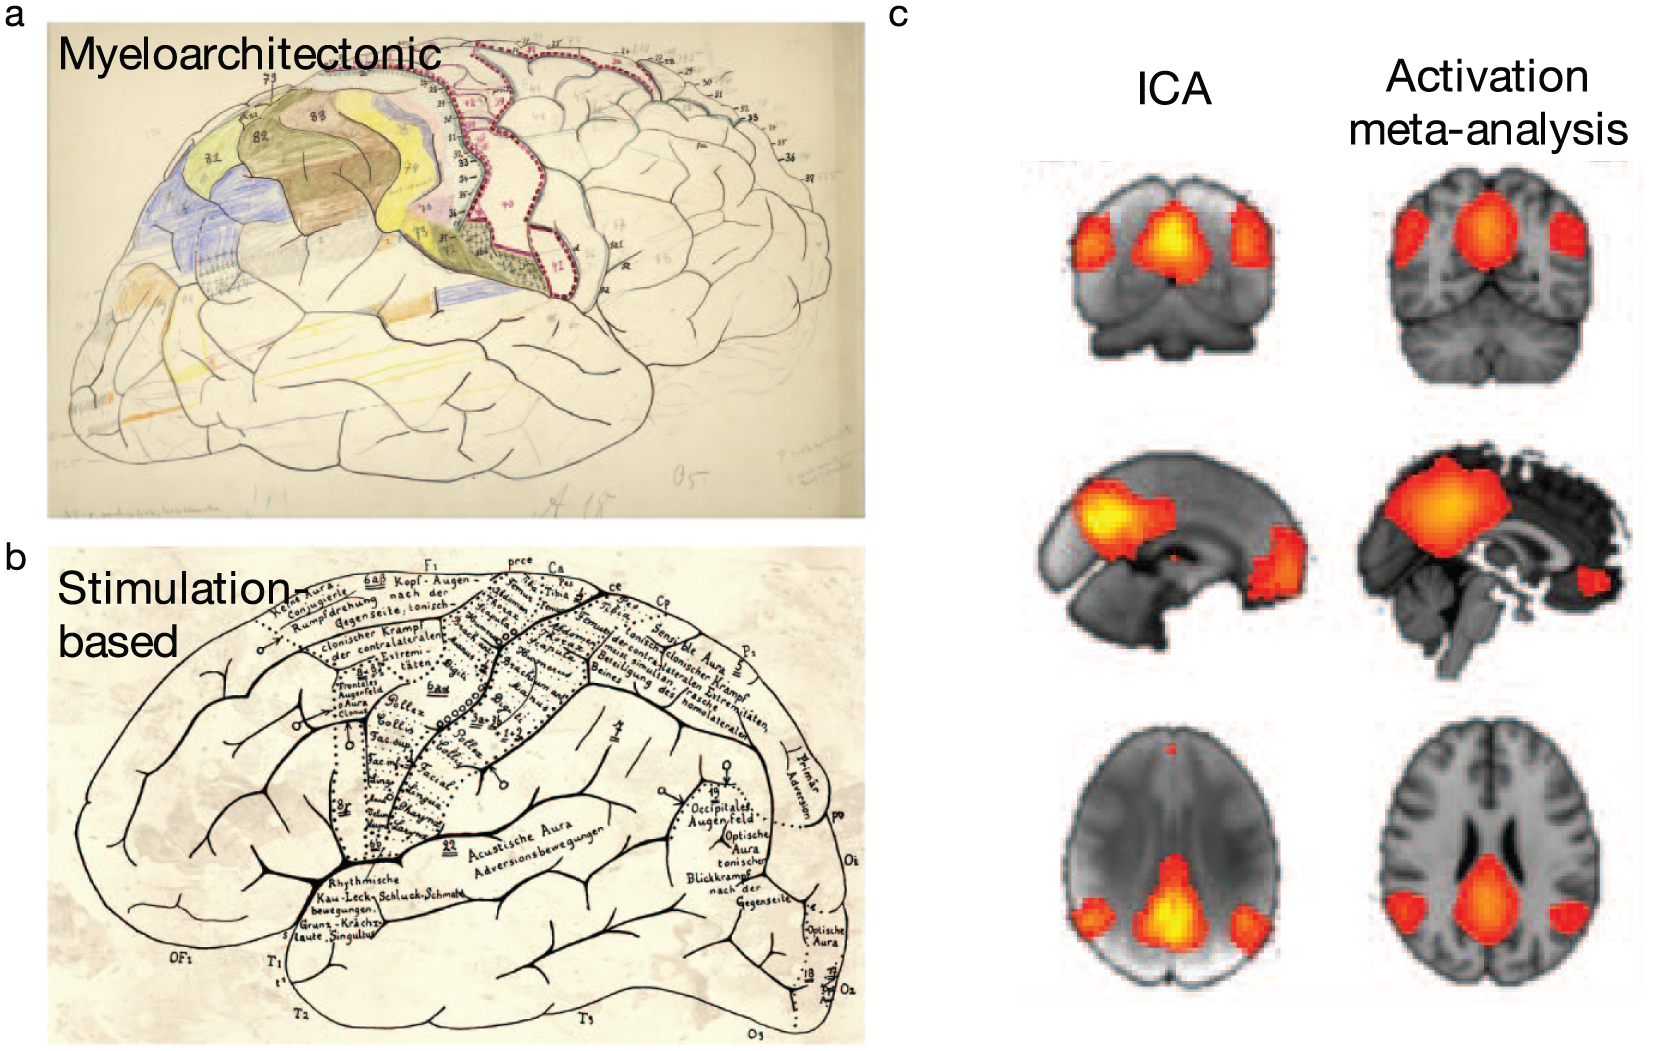
Example methods to define brain regions. Region boundaries may be based on anatomical features (e.g., myeloarchitecture [a]) or functional features (as in electrophysiological stimulation-based maps [b] or independent component analysis [ICA]-based maps [c]). Adapted with permission from: “a and b”: Amunts and Zilles (2015); “c”: Smith and others 2009).
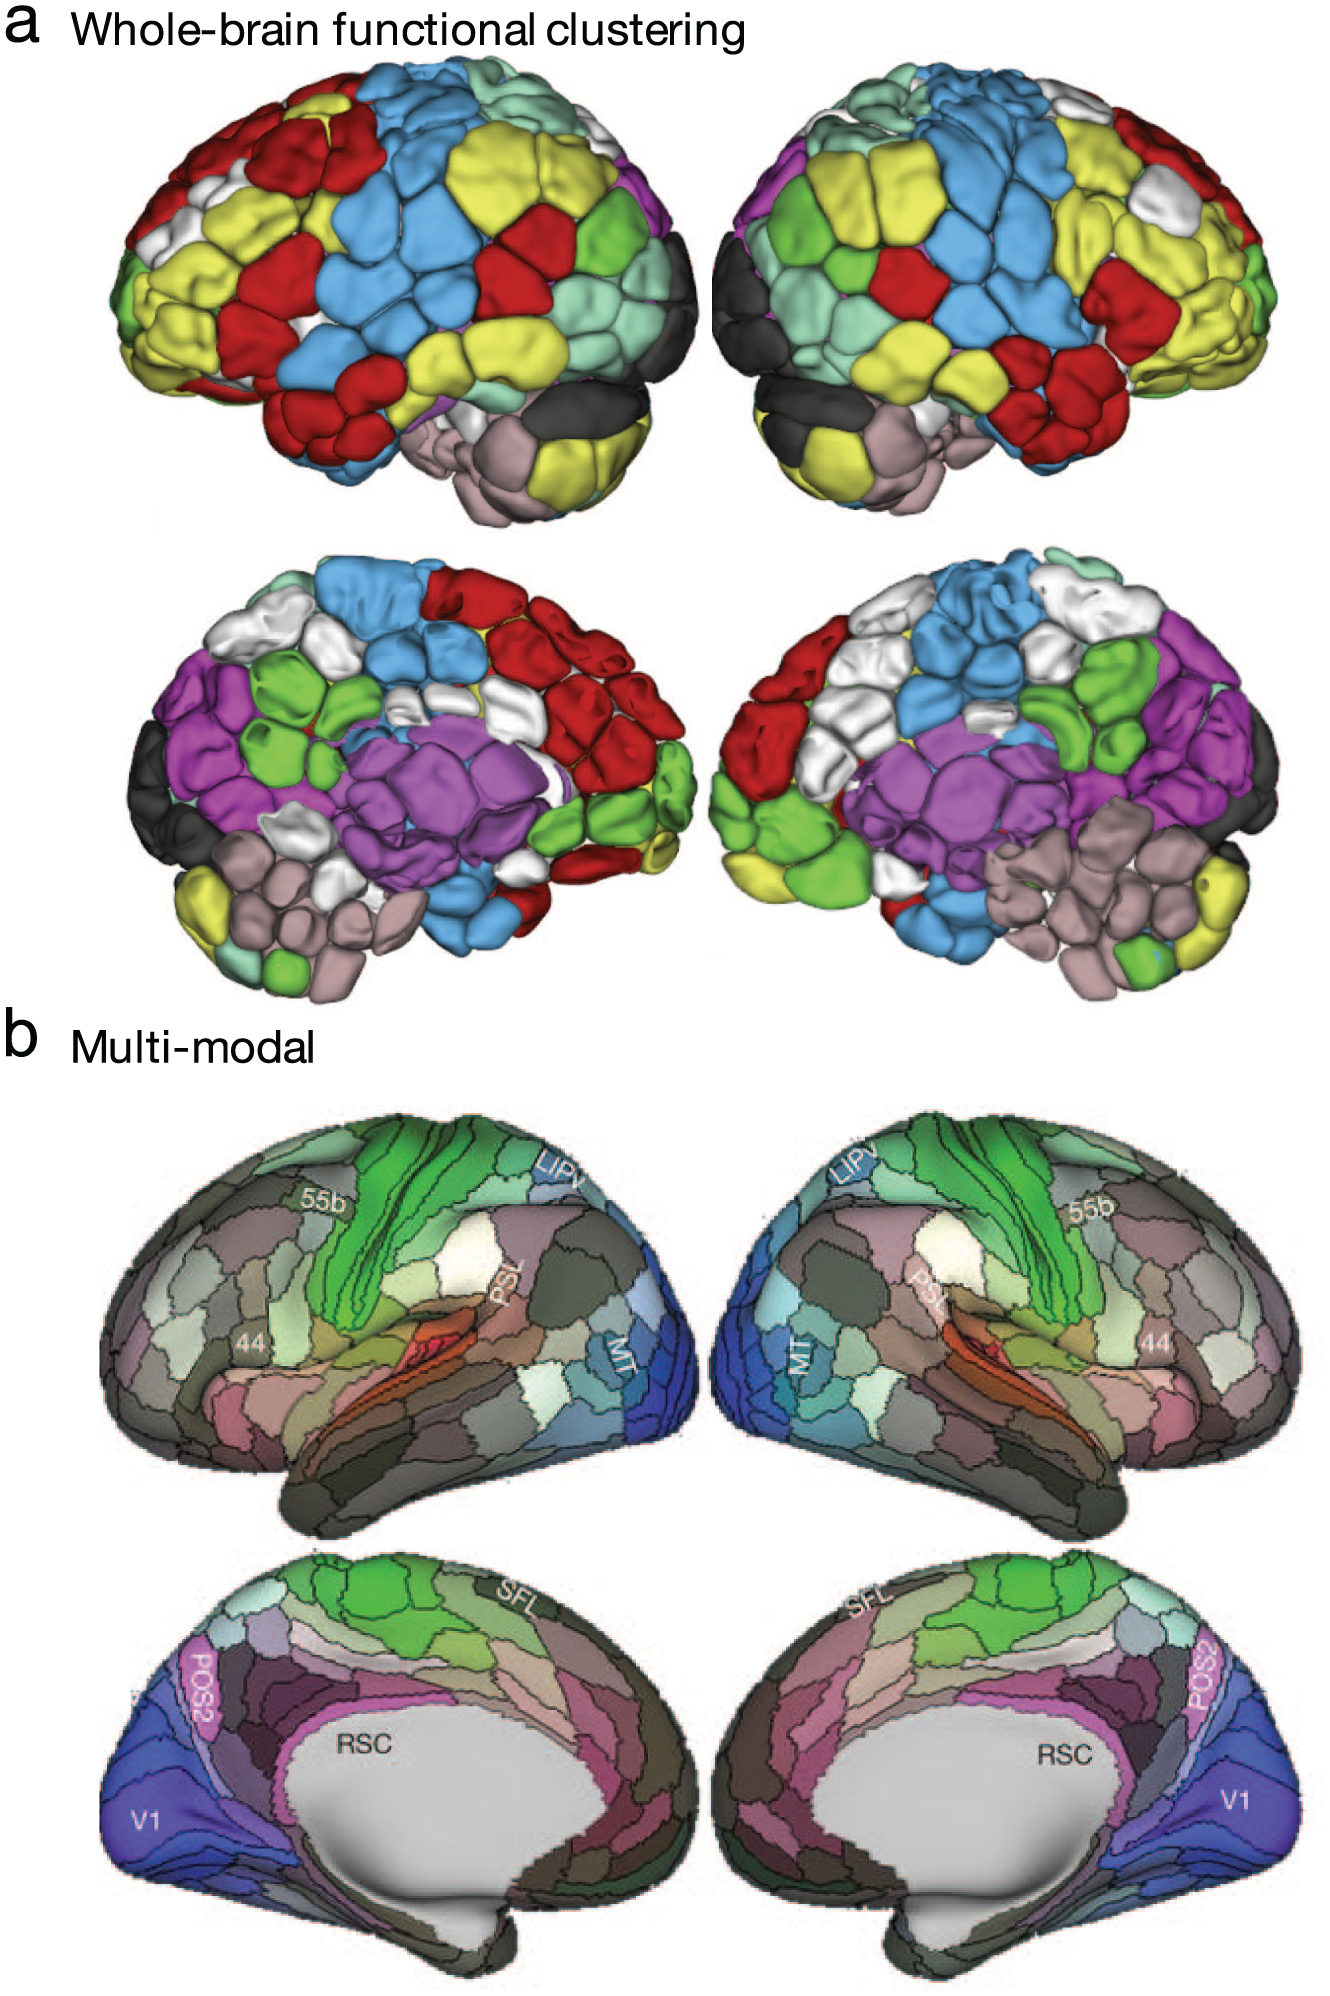
Functional and multiple modality-based methods to define brain regions. Region boundaries may be based on whole-brain time course clustering-based maps (a) or a multimodal combination of anatomical and functional features (b). Adapted with permission from: “a”: Greene and others (2018); parcellation as described in Finn and others (2015) and Shen and others (2013); “b”: Glasser and others (2016).
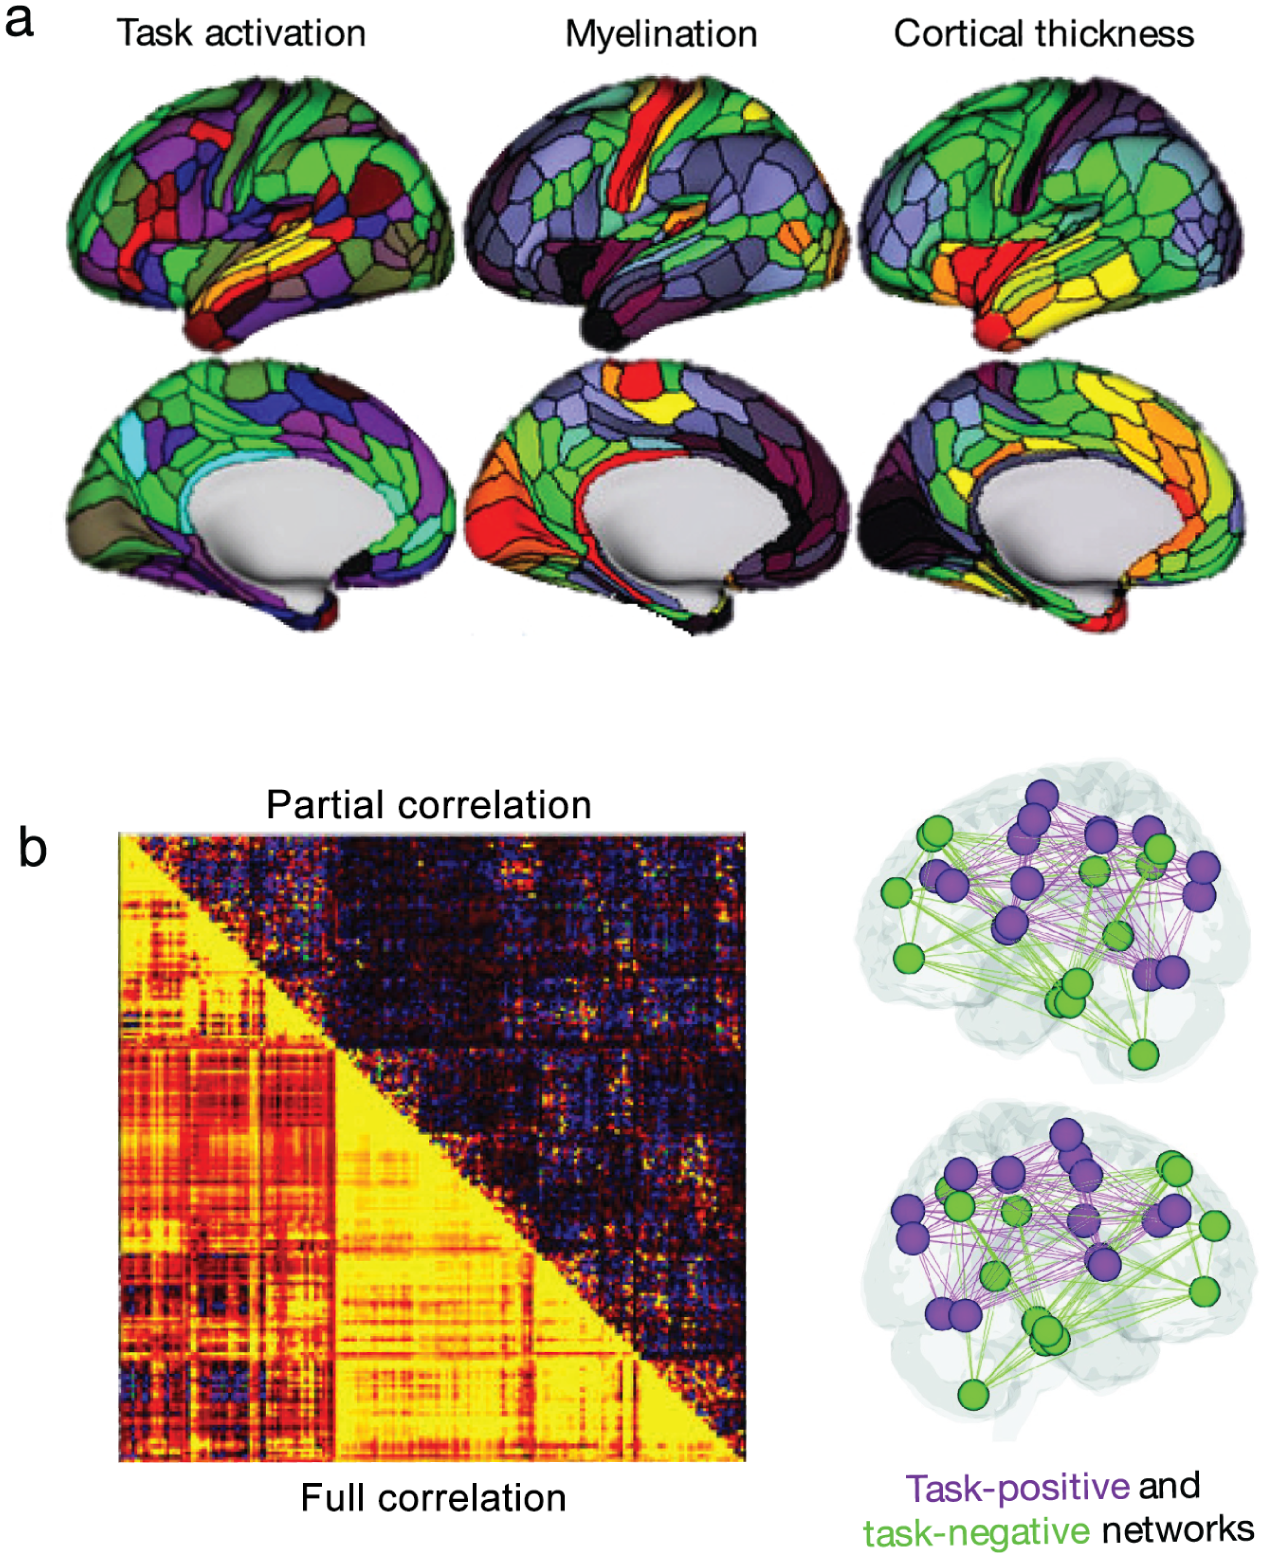
Example of region and connection-based measures using parcellation approaches described in Figure 4. (a) Examples of regional measures include, within each region, average task activation (colors indicate Z statistic values during a language task), average intracortical myelin (range 4% to 96%; hot colors indicate increased myelination), and average cortical thickness (range 2.1–3.3 mm; hot colors indicate increased thickness). (b) Connection-based measures are concisely summarized in connectivity matrices, and relevant connections can then be projected onto the brain. Connection strengths may be quantified using a variety of measures, including correlation and partial correlation. Adapted with permission from: “a”: Glasser and others (2016); “b”: left panel—Glasser and others (2016); right panel—Rosenberg and others (2017).
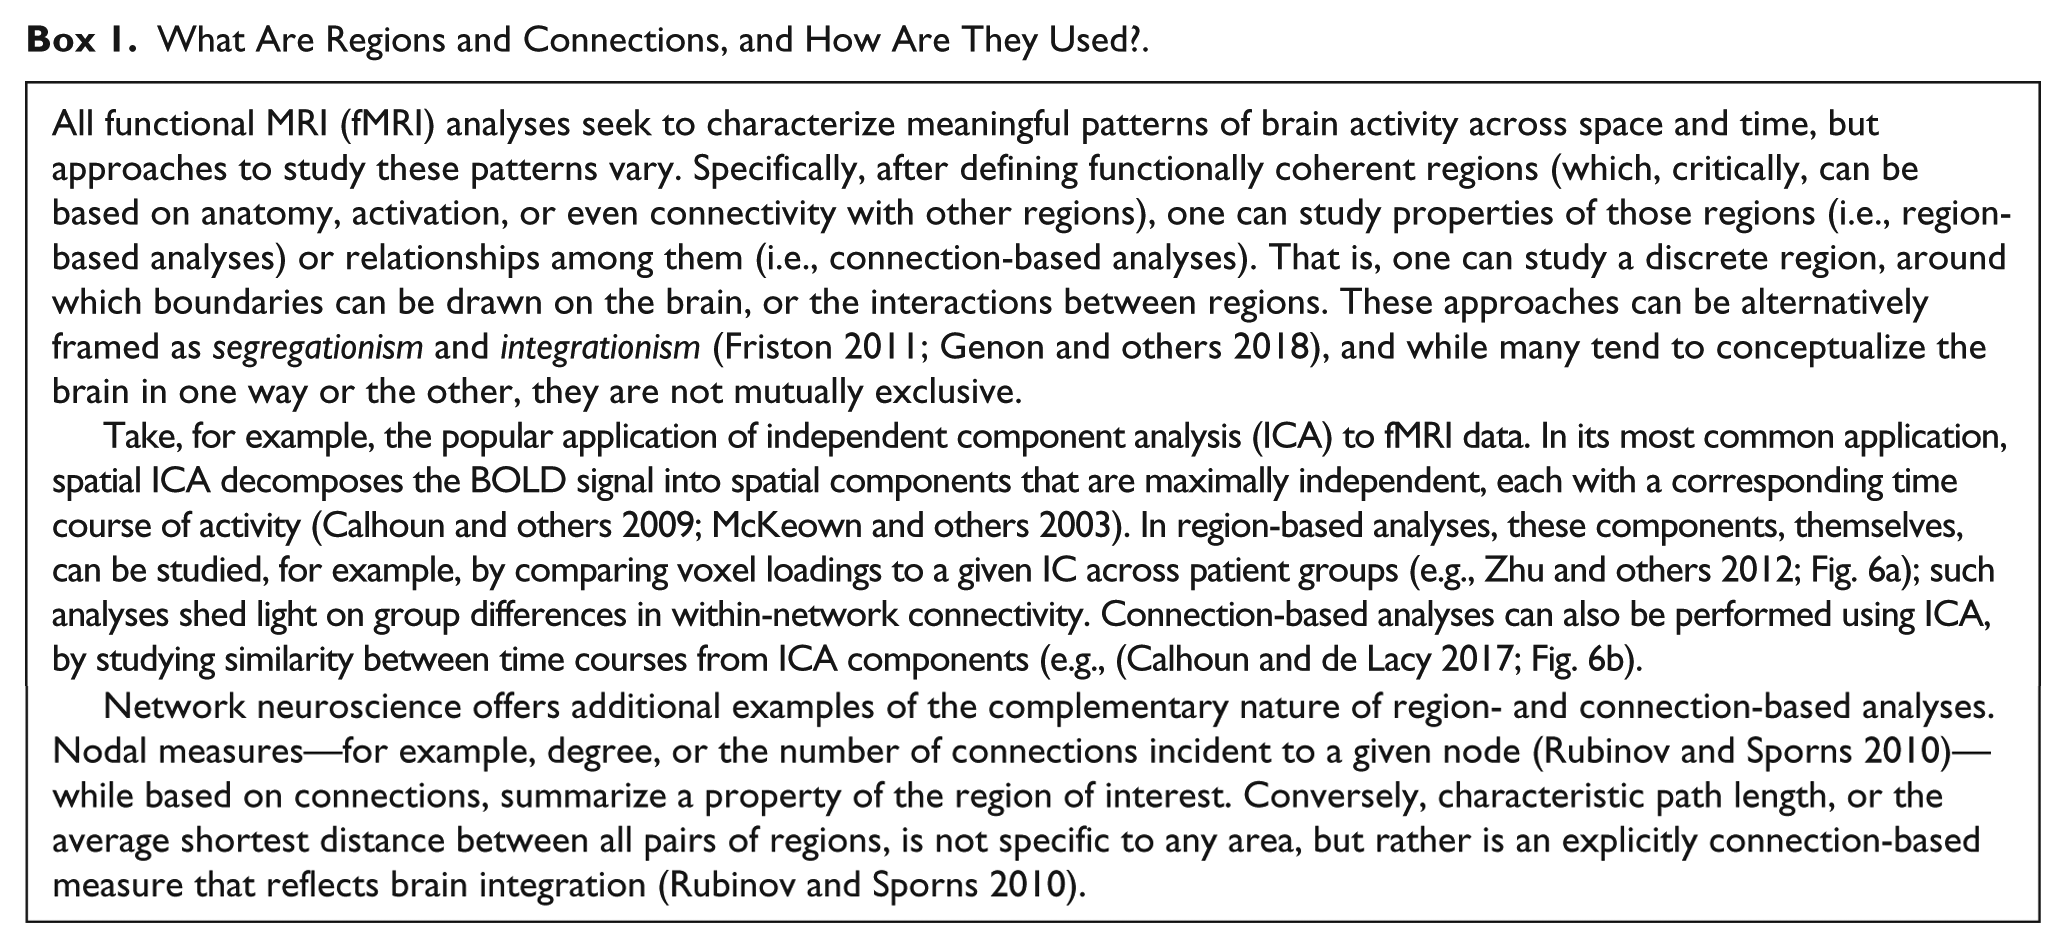
What Are Regions and Connections, and How Are They Used?.
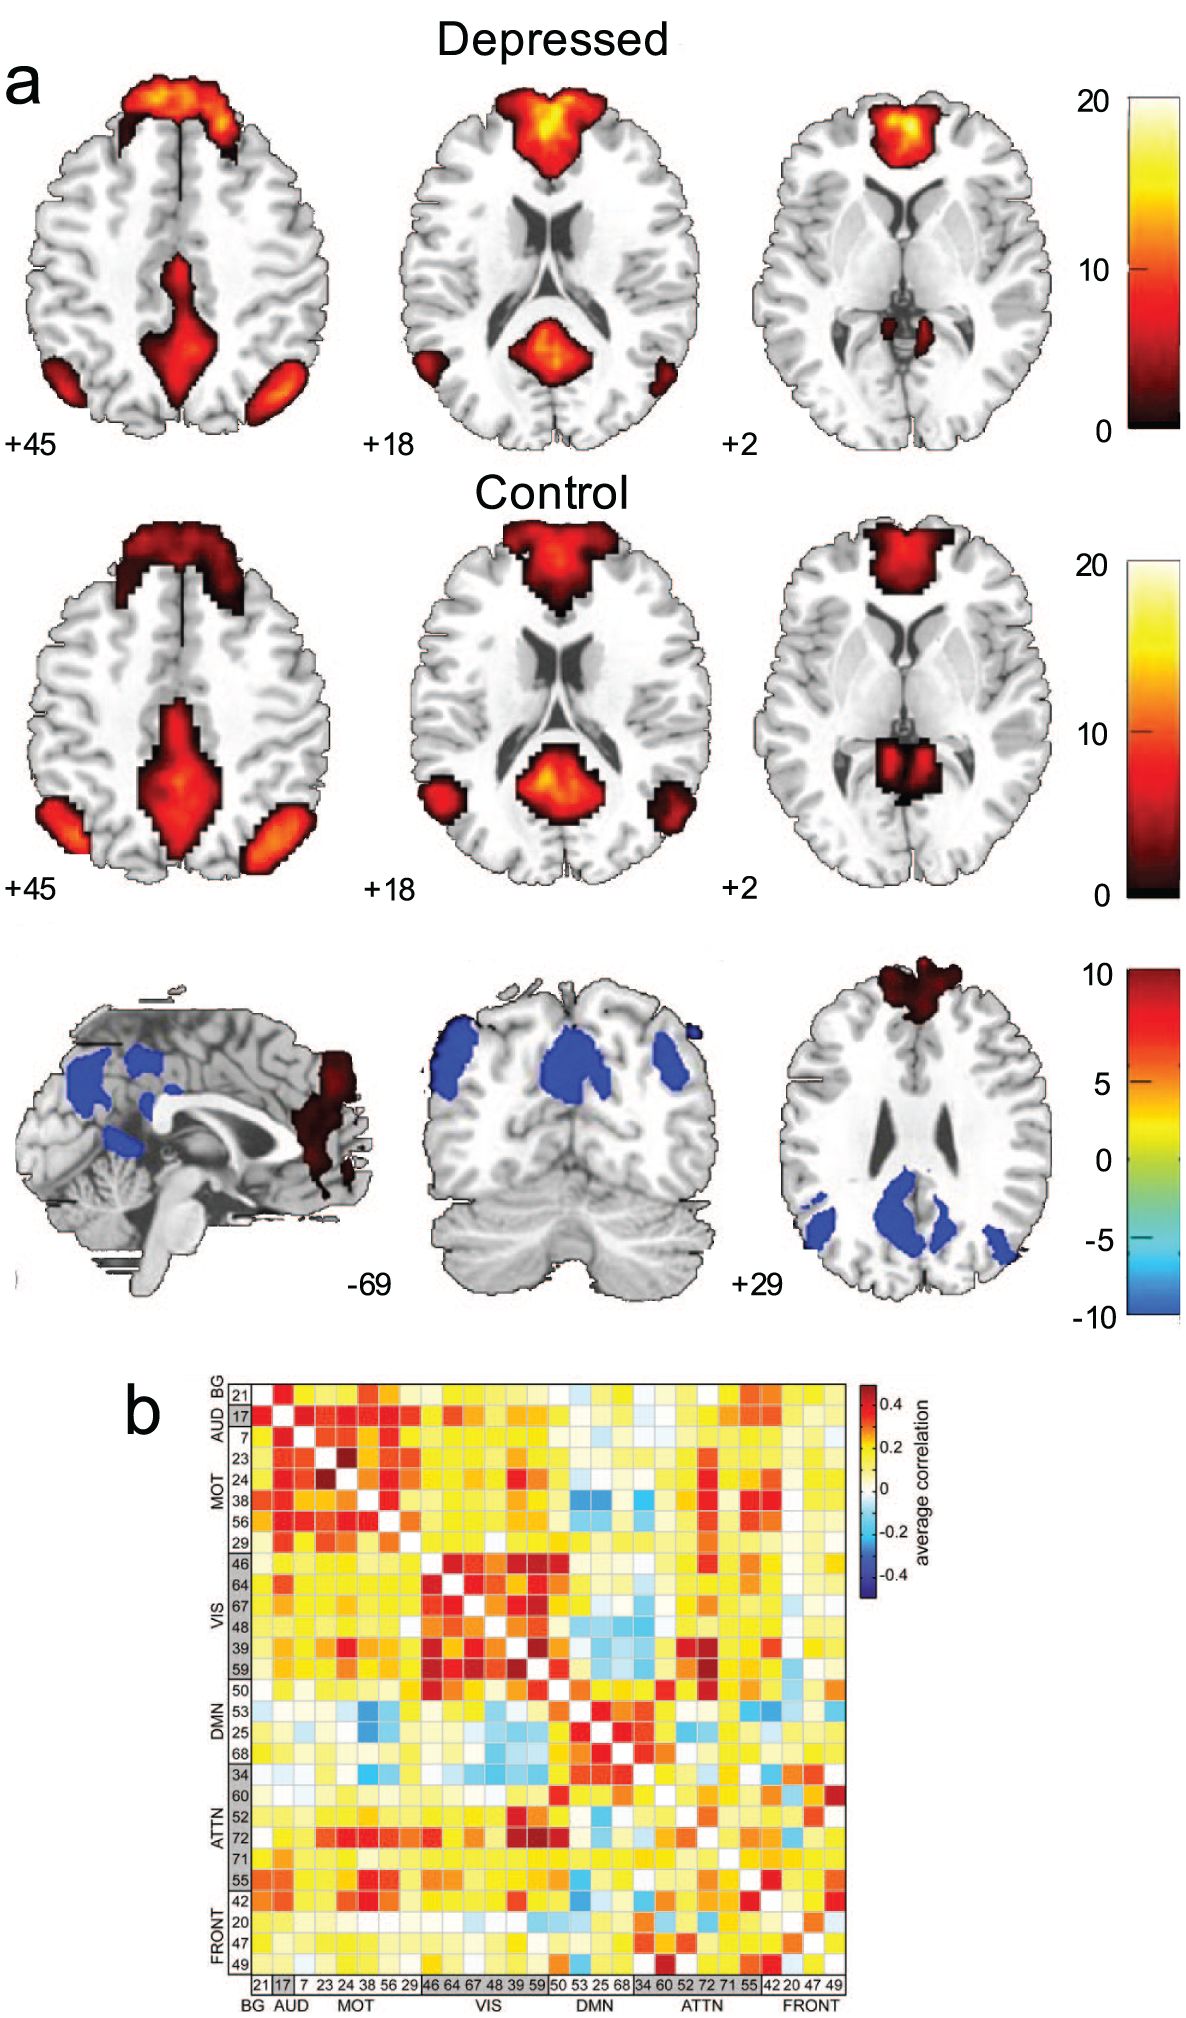
Some approaches (e.g., ICA) can yield both region- (a) and connection-based (b) measures, which can be used to study group and individual differences in both health and disease. That is, ICA defines regions that can, themselves, be studied, or that can be used to calculate connection-based measures. For example, in (a), default mode network FC differences between patients with depression and healthy controls are displayed. In (b), regions similarly defined using ICA are used to characterize communication between these regions, rather than characteristics of the regions, themselves. Adapted with permission from: “a”: Zhu and others (2012); “b”: Allen and others (2011).
While not mutually exclusive, this simple dichotomy (Friston 2011) facilitates the exploration of two fundamentally different ways of thinking about brain function. In what follows, we discuss the strengths and limitations of each, focusing primarily on the application of this framework to measures of functional connectivity (FC; Fig. 2). Given the complementary nature of these approaches, we will not advocate for one method over the other. Rather, we will consider how each method reveals distinct information about the organization of the brain. We review the advantages and disadvantages of region- and connection-based measures in three domains: neurobiological relevance, brain-behavior relationships, and individual differences in brain organization.
Using Regions and Connections to Reveal Neurobiological Insights
The utility of region- and connection-based approaches depends in large part on the extent to which they reflect underlying neurobiological properties—that is, the degree to which each approach represents physical processes in the brain, and the sensitivity of each approach to neurobiological perturbation (Eickhoff and others 2018). We turn next to a consideration of each of these questions.
Neurobiological Bases of Region- and Connection-Based Measures
Dating back to the work of Brodmann (1909), many have mapped discrete regions of the brain and assigned them specific functions (Broca 1861; Scoville and Milner 1957). More recent results support the idea that the brain can be divided into regions based on structural or functional features (a map often referred to as a “parcellation”; e.g., Amunts and Zilles 2015; Bludau and others 2014; Cohen and others 2008; Glasser and others 2016; González de San Román and others 2018; Lorenz and others 2017; Shen and others 2013). Parcellations defined by connectivity patterns generally conform to task-activation maps and other neurobiological boundaries (Gordon and others 2016; Wig and others 2014), further evidence of regional homogeneity—and convergence—of structure and function. Even large regions spanning the cortex have been found to exhibit similarities in gene transcription (Hawrylycz and others 2015; Richiardi and others 2015), supporting the notion that regions have meaningful molecular bases. For example, Richiardi and others (2015) demonstrated that, in human subjects, regions defined by independent component analysis (see Box 1) have correlated transcriptional profiles in a set of key genes linked to synaptic function. Other work similarly supports the idea that functional networks have a meaningful structural basis (Mišić and others 2016; van den Heuvel and others 2009), though it should be noted that structural and functional networks do not always show a one-to-one correspondence (Mišić and others 2016; Rodriguez-Vazquez and others 2019). In general, these studies all have leveraged an important aspect of region-based measures: they are physical structures in the brain that can be studied at multiple levels of analysis.
There is also evidence to suggest that connection-based measures are structurally meaningful. While not all functional connections correspond to monosynaptic structural connections, data do exist showing that this assumption holds for certain parts of the brain. For example, work from the mouse has revealed that, particularly for cortical and hippocampal areas, functional connections observed at rest conform to known monosynaptic structural connections (Grandjean and others 2017). For subcortical networks, polysynaptic connections were shown to be responsible for functional connections (Grandjean and others 2017). Other findings from the animal literature suggest that functional connections generally show good correspondence to structural connections (Mills and others 2018; Stafford and others 2014). Correspondence between structural and functional features has been observed in humans, as well, in comparisons of functional connections and tracts defined by diffusion tensor imaging (Hermundstad and others 2013; Jarbo and Verstynen 2015; Liang and Wang 2017). In addition, knowledge of structural connections allows prediction of functional connections (Goñi and others 2014; Honey and others 2009), though there are also cases, as for region-based measures, where structure-function relationships diverge (Honey and others 2009; Park and Friston 2013).
Sensitivity of Regions and Connections to Biological Disturbances
While there is evidence to support the neurobiological basis of both regions and connections, a separate consideration is whether a particular measure is better suited to capture changes in underlying biology. That is, if a measure is more sensitive to underlying disturbances in brain function but lacks a precise neuronal correlate in human subjects, it arguably might be more valuable than a measure that is less sensitive but more biophysically realistic. Inspired by modelling (Achard and others 2006; Alstott and others 2009; Váša and others 2015) and clinical studies (Eldaief and others 2016; Henson and others 2016; Siegel and others 2016a), we provide toy scenarios of the effect of lesions on FC measures to illustrate this potential trade-off. We note that these scenarios are kept intentionally simple to illustrate our points, though we include references to relevant work as appropriate.
First, consider the case in which a lesion affects connection-based measures, but not regional measures. In this scenario, two areas of the brain may initially have similar time courses of activity and thus a strong functional connection (Fig. 7a). One could imagine a disturbance that introduces a lag in the BOLD signal in one of these regions, perhaps reflecting a delay between neuronal activity and the hemodynamic response (e.g., Amemiya and others 2014; Lv and others 2013; Siegel and others 2016b). If the two signals are now significantly lagged (Fig. 7b), the correlation between the two regions might be decreased relative to their pre-lesion correlation, and the pathology would be evident in connection-based measures, as described previously (Lv and others 2013; Siegel and others 2016b).
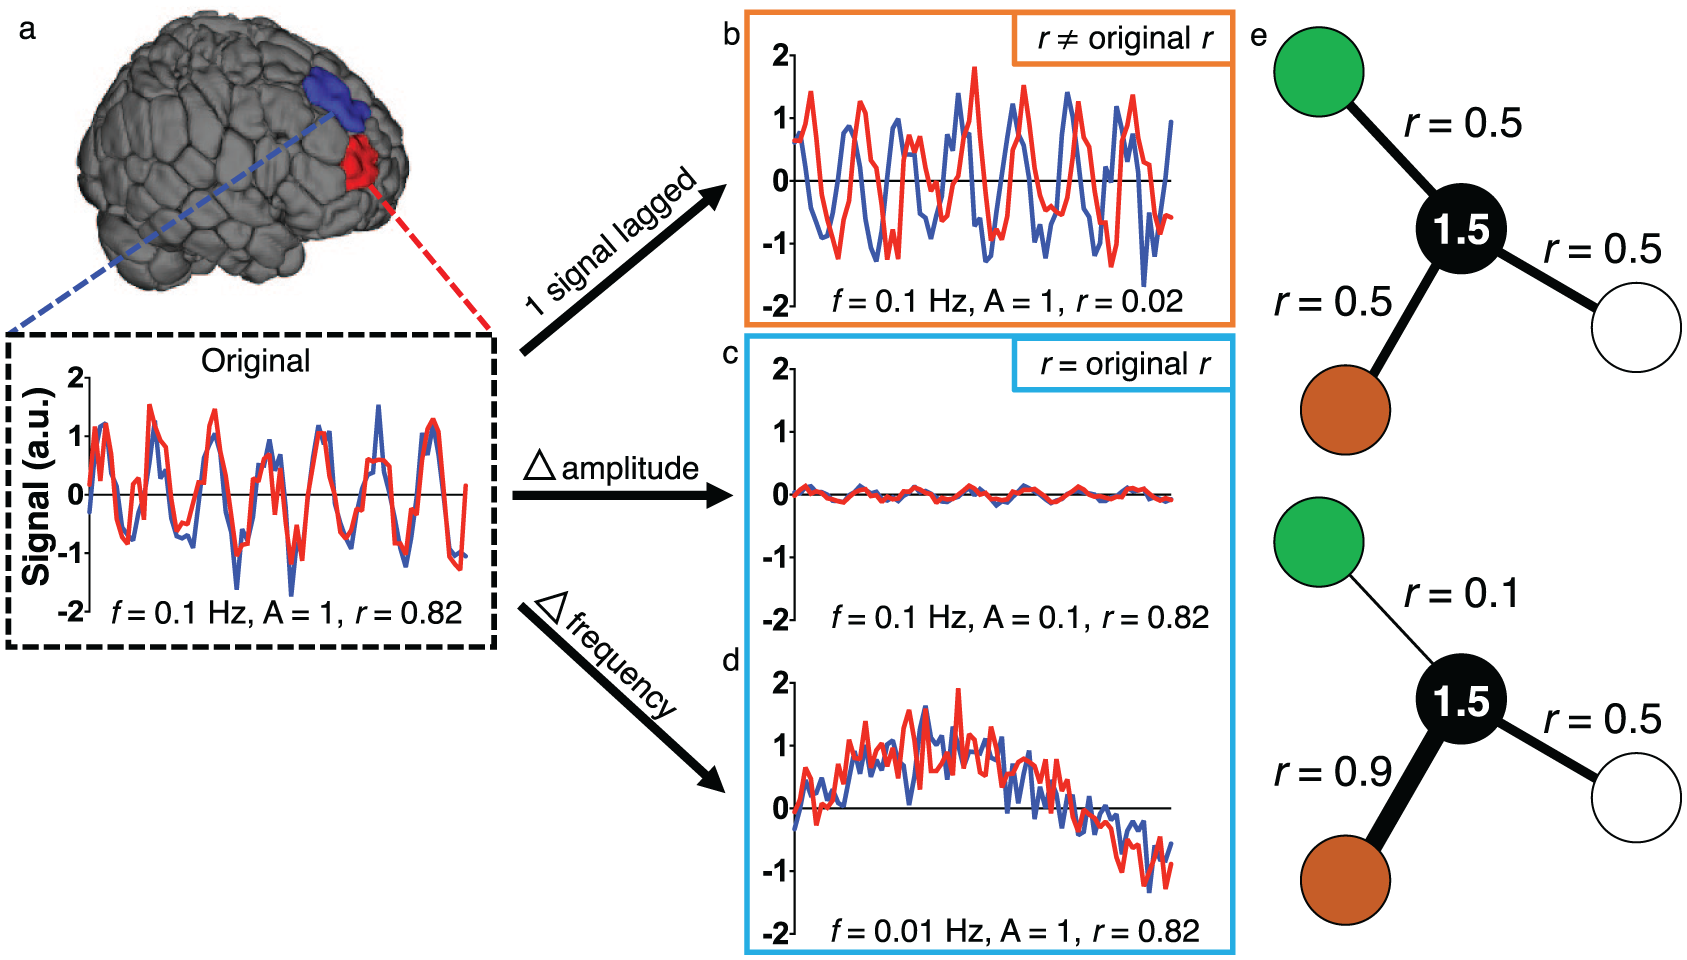
Using region- or connection-based approaches in isolation potentially obscures changes due to a lesion. (a) Consider the two colored regions for which the BOLD signal is measured over time. The original signals have similar characteristics (amplitude of 1, frequency of 0.1 Hz) and are synchronized, resulting in a Pearson correlation coefficient of 0.82. (b) A disturbance results in one signal exhibiting a delay. Because the signals are now lagged, they have a correlation of approximately 0, despite having the same amplitudes and frequencies as before the disturbance—regional measures, like the amplitude of low frequency fluctuations (ALFF) or fractional ALFF (f/ALFF) would be unaffected in this example. In (c) and (d), disturbances affect the amplitude (c) or frequency (d) of the signals. Because the two signals are still synchronized in both cases, the correlation remains high, but differences in the signal are clearly observed. In (e), the black node has the same overall weighted degree in the top and bottom panels, despite differences in connectivity between specific region pairs. a.u. = arbitrary units; f = frequency; A = amplitude; r = Pearson correlation coefficient.
However, as we demonstrate in Figure 7b, certain regional characteristics, such as the amplitude of low frequency fluctuations (ALFF; Zang and others 2007) or fractional ALFF (f/ALFF; Zou and others 2008), might not be affected by the disturbance. Indeed, this has been noted in previous work at certain frequencies (Siegel and others 2016b). If regional characteristics are used to define parcellation boundaries, as is often the case, it is possible that such boundaries in and near the affected area would not change. Thus, if only region-based measures were used, a pathological change with clear neurobiological importance might be missed.
As another example, consider a case in which the underlying neurobiology affects regional measures, but not connection-based measures. In this example, as before, the two regions have highly correlated signals initially (Fig. 7a), but now a disturbance affects both signals’ amplitudes (Fig. 7c) or frequencies (Fig. 7d), as can happen after loss of blood (Hudetz and others 1992; Kannurpatti and others 2008), administration of anesthesia (Kiviniemi and others 2000), or differences in brain state (Yuan and others 2014). Because the synchrony of these regions’ time courses remains unchanged, the areas would retain their high correlation, as has been suggested previously (Paasonen and others 2018). Furthermore, if the effect on connectivity between the lesioned regions and the rest of the brain were small, subtle differences in whole-brain connectivity might be missed (Cremers and others 2017). Thus, relying only on connection-based analyses in this scenario might miss important information about pathological changes to the regions in question.
In a final scenario, it is possible to imagine situations in which incoming connection strengths might change for a given region, but the overall weighted degree of the region, or summed strength of connections incident to it, remains the same (Fig. 7e). Hence, even in these relatively straightforward examples, neither a region- nor a connection-based approach, by itself, is sufficient to capture all biologically meaningful features of the system. Recent work suggests that these issues might not be merely theoretical and reinforces that signal changes in one region of the brain can affect estimates of FC to other regions of the brain (Duff and others 2018). Given the differential utility of these approaches for the study of neurobiology and the evidence supporting the biological basis of both, the choice of one approach and/or the other requires that investigators carefully consider their question of interest. That is, the best approach must be chosen to detect relevant, underlying neurobiological properties and—ultimately—their relationship to observable behavior. We turn next to the study of such brain-behavior relationships.
Relating Regions and Connections to Phenotypes
The neural bases of human behavior—from our relationships, to our career choices, to what we eat for breakfast—have long captured the imagination of neuroscientists, yielding an extensive literature on brain-behavior relationships. Given this, it is worth considering whether region- or connection-based measures better reveal individual differences in brain functional organization that underlie individual differences in behavior and cognition.
Predictive modeling offers a useful framework to explore this question and generate specific neural hypotheses, as prediction depends on robust, behavior-relevant individual differences in brain data. It should be noted that predictive modeling approaches are not without limitations—namely, the data-driven nature of the analyses may render interpretation of results difficult, especially in cases where mechanism is sought. However, predictive modeling mitigates the common problem of “overfitting” in human neuroimaging research. That is, given that the number of predictors (e.g., voxels, connections) is usually far greater than the number of observations (e.g., individuals), models often mistakenly fit sample idiosyncrasies and noise, yielding promising results that fail to generalize to novel individuals (Yarkoni and Westfall 2017). Because predictive models are trained in one sample and tested on another, previously unseen sample, they offer a rigorous test of the generalizability of brain-behavior relationships (Box 2; Fig. 8a). FMRI-based predictive modeling has already begun to yield important insights into the neural bases—and potentially clinically useful predictions (Woo and others 2017)—of many phenotypic measures, including brain maturity (Dosenbach and others 2010), attention (Rosenberg and others 2015), fluid intelligence (Finn and others 2015), empathic care and distress (Ashar and others 2017), and depression subtypes and treatment response (Drysdale and others 2016), but whether region- or connection-based measures are better suited to reveal brain-behavior relationships remains an open question.
Overview of Predictive Modeling.
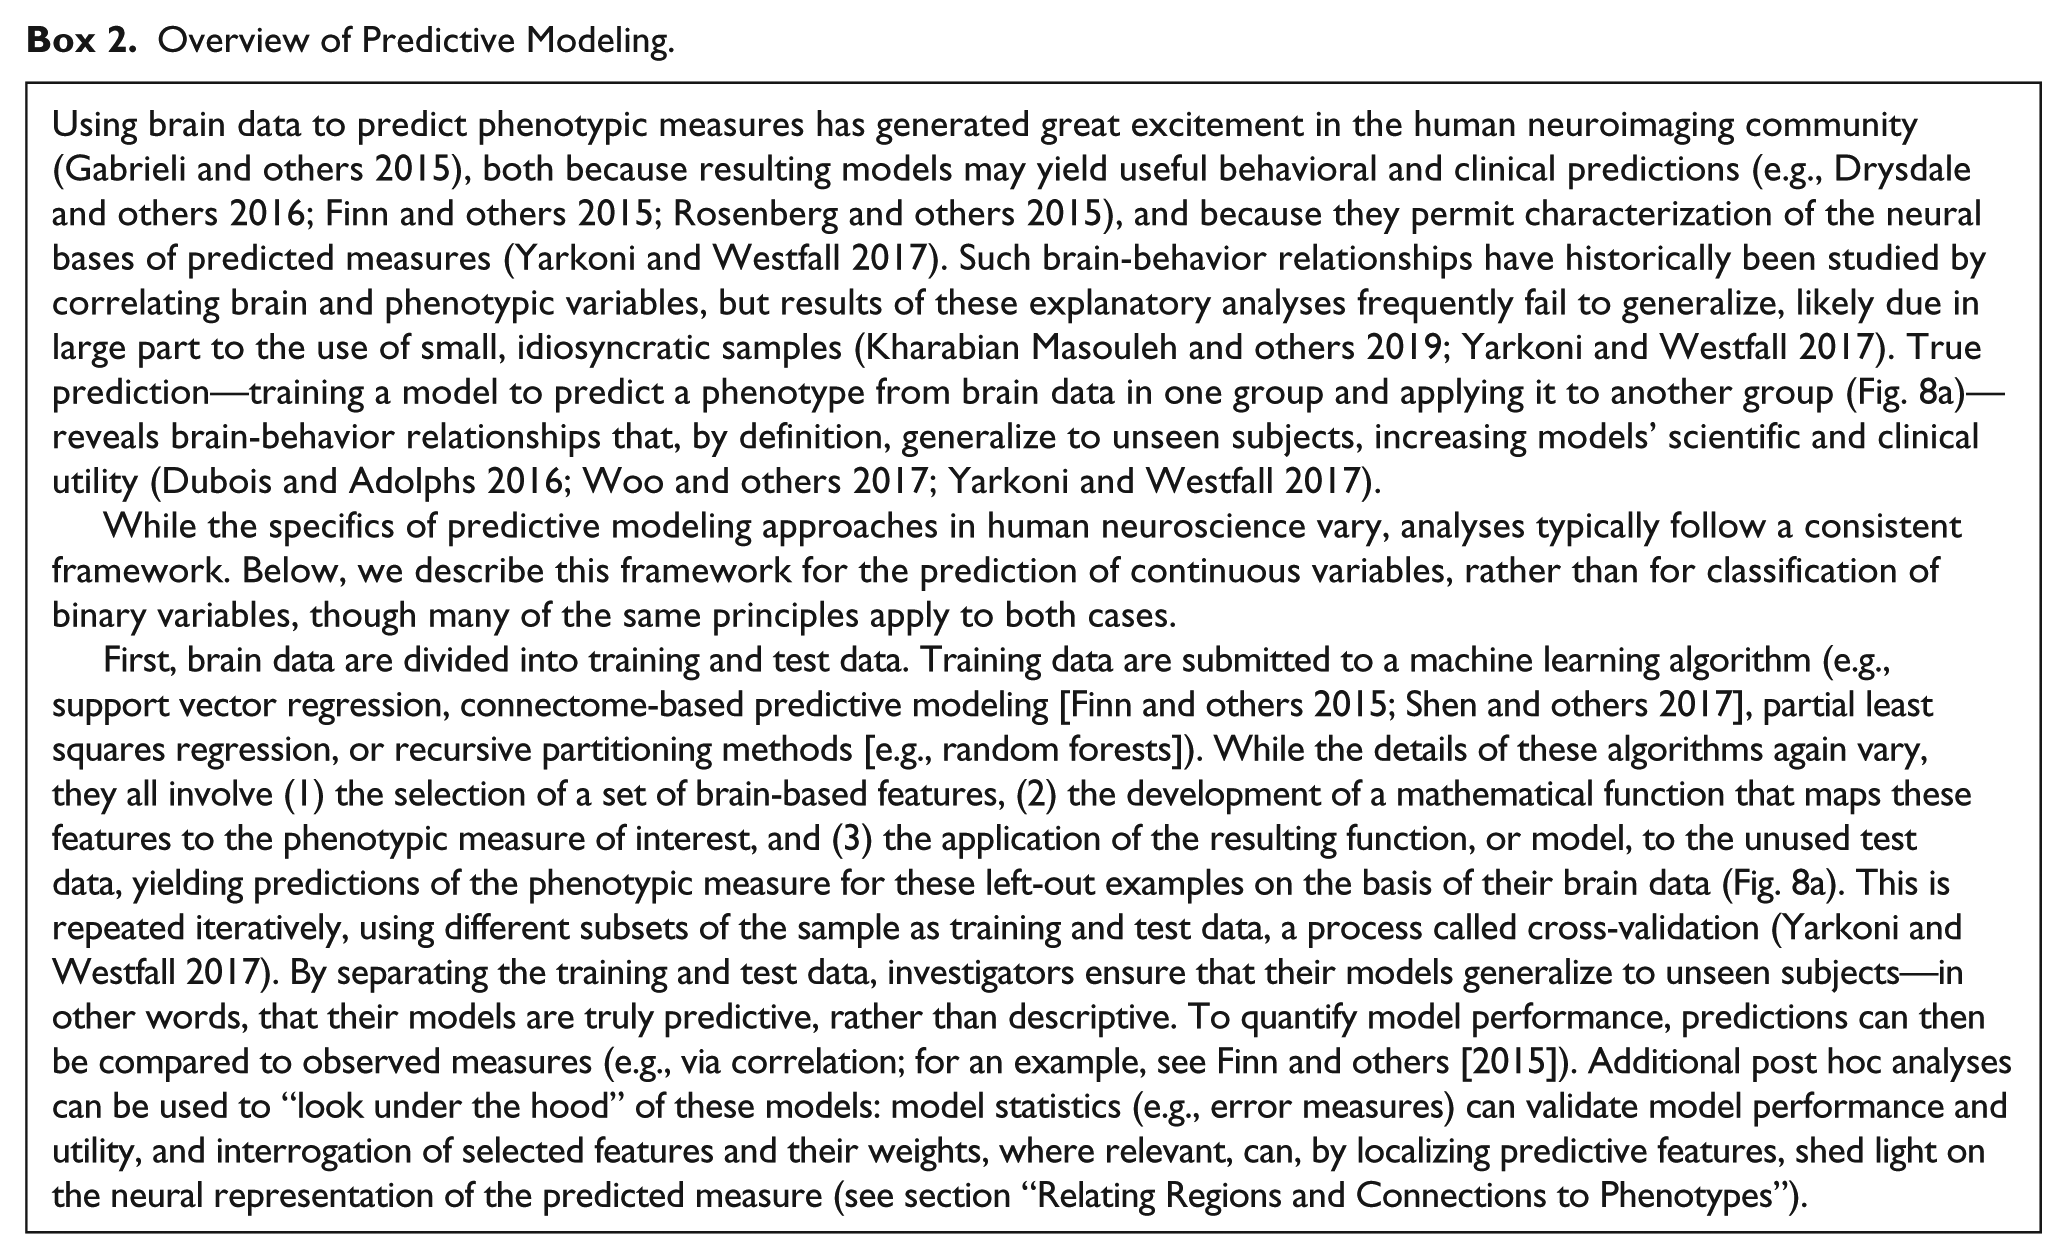
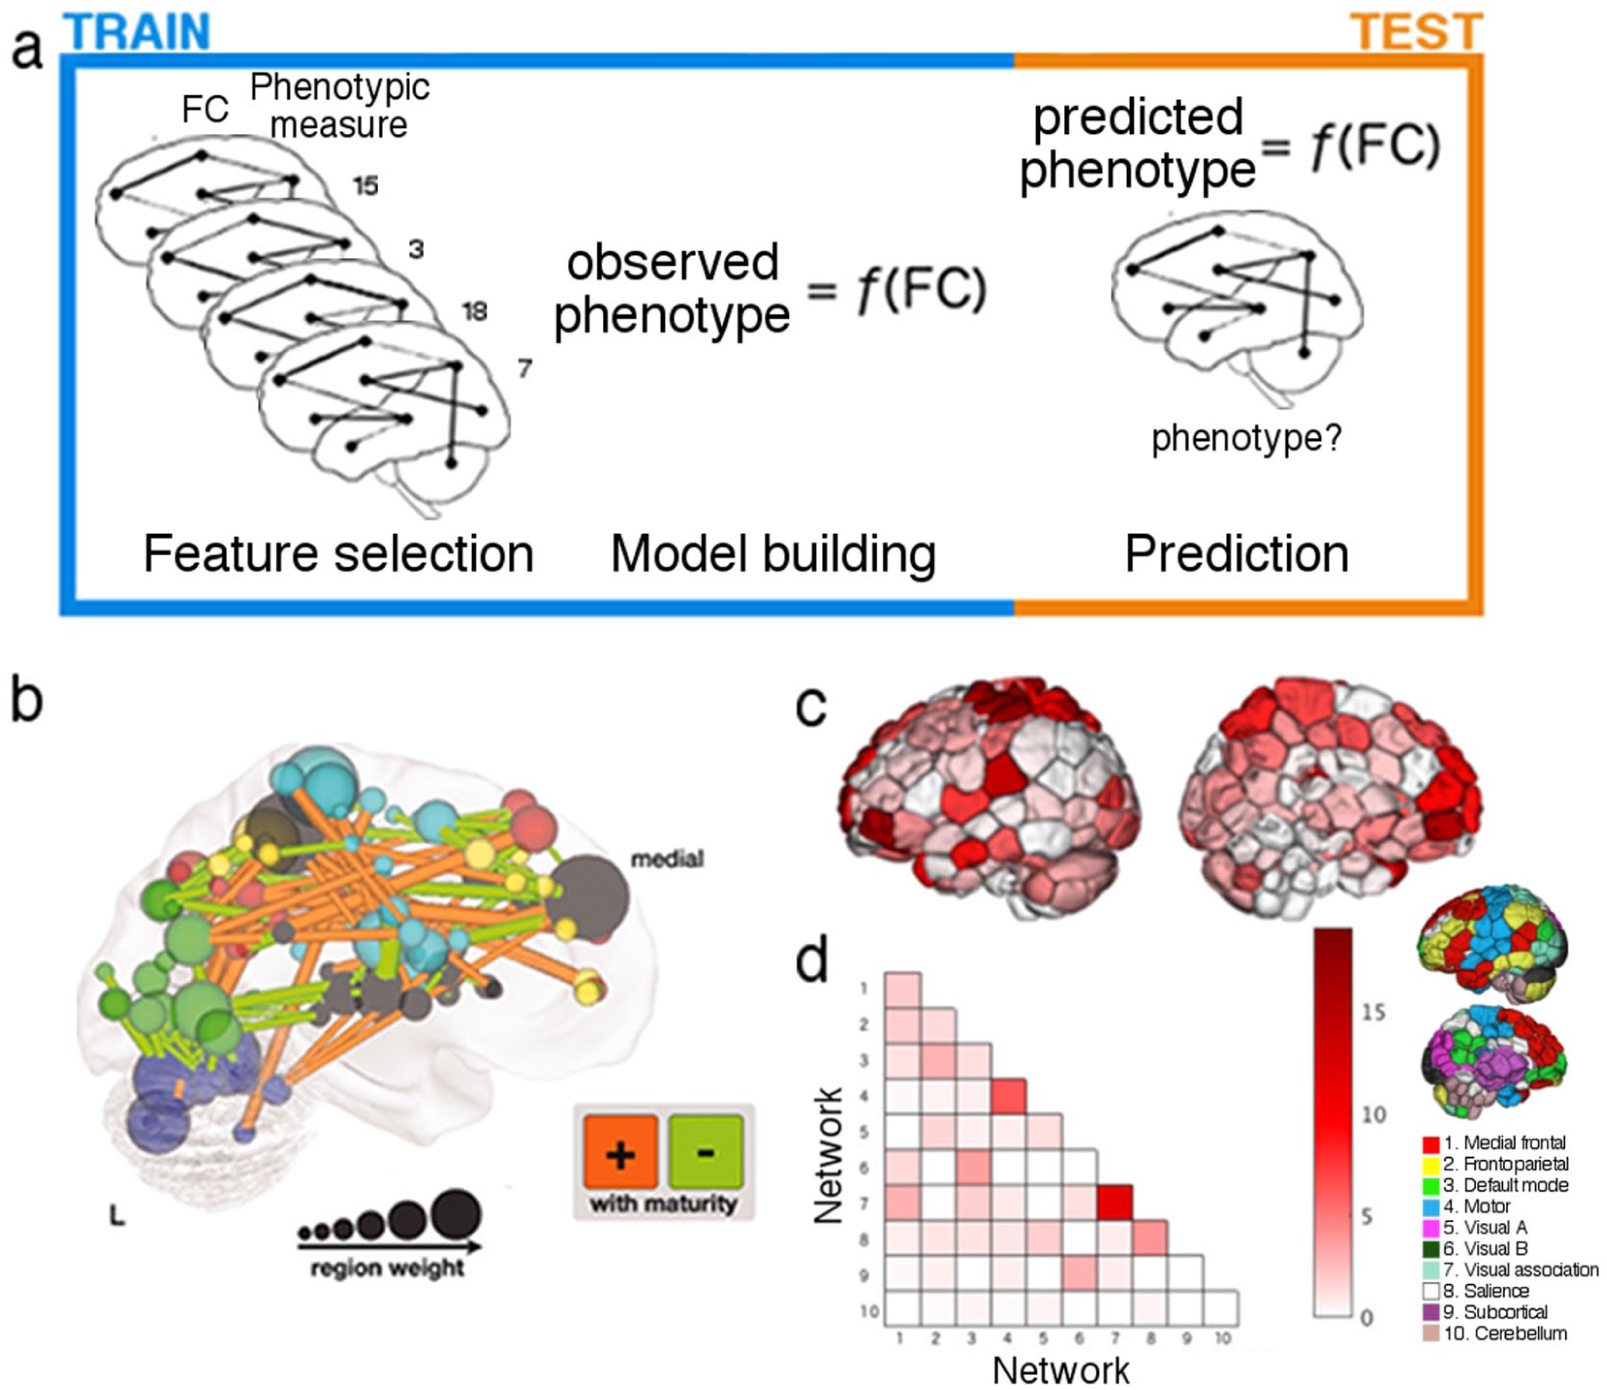
Predictive modeling follows a standard framework, and models are most effectively trained and summarized by using combinations of region- and connection-based measures. (a) Predictive modeling involves three general steps: feature selection, in which a subset of all features is selected from the training data; model building, in which those features are submitted to an algorithm that fits them to a set of observed measures; and prediction, in which feature selection is performed on previously unseen test data, and resulting features are submitted to the models to yield a prediction of the measure of interest (indicated in the figure by “phenotype?”). This process is repeated iteratively, with different divisions of data into training and test sets on each iteration. (b) While projecting connection-based features used for prediction onto the brain can become difficult to interpret due to the sheer number of features, using both region- (e.g., region weight [as indicated by node size] or network membership [as indicated by node color]) and connection-based measures (as indicated by lines between nodes) can aid model summarization and interpretation. Alternative visualization methods focus on one measure at a time to aid interpretation. In (c), nodes are colored according to their binary degree (total number of connections incident to that node in the given model), while in (d), each connection in the given model is assigned to a pair of networks (see inset for a visualization of the 10 networks used in this example). Together, such depictions provide complementary insights into the locations of overrepresented regions (c) and connections (d), while avoiding the difficulty of interpreting individual connections or model weights. Adapted with permission from: “b”: Dosenbach and others (2010) and “c-d”: Greene and others (2018).
More specifically, prediction has two components: the predictions, themselves, and the brain-based models that yield these predictions, which can in turn be interrogated to shed light on neural representation. The former is constrained by model input (i.e., predictions can only be as good as the measures on which they are based), and the latter reflects the interpretability of model output. The choice of how to represent fMRI data—based on regional features or on relationships among regions—affects both prediction accuracy and model interpretability; in what follows, we offer a framework to guide this choice for both model input and interpretation in order to best reveal brain-behavior relationships.
Model Input
The choice of features used as model input will in most cases depend on the measure being predicted: while region-based measures may yield accurate predictions of measures associated with low-level cognitive processes (e.g., sensory processes), connection-based measures will likely prove more useful for the prediction of (more frequently modeled) higher level cognitive processes (Woo and others 2017). The study of visual processing offers an illustrative example. In work performed by Haxby and others (2001), multi-voxel pattern analysis (Norman and others 2006) was used to classify the object category being viewed on the basis of patterns of activity in ventral temporal (VT) cortex. Similarly, Kamitani and Tong (2005) demonstrated that patterns of activity in early visual cortex, alone, can be used to predict the orientation of a viewed stimulus. Models built using region-based features (which may be activation-based, as in these examples, anatomy-based [e.g., intracortical myelination, cortical thickness; Glasser and others 2016], or FC-based [e.g., node degree; Rubinov and Sporns 2010]) are thus likely to yield accurate predictions of measures or functions associated with circumscribed brain regions (e.g., perception). In many such cases, given the lower dimensionality (see section “The Trade-Off between Information and Complexity”) and increased interpretability (see section “Model Output”) of region-based measures, their use for predictive modeling should be favored over connection-based measures.
In the case of more complex cognitive measures or behaviors, however, a region-based approach may prove less fruitful. VT cortex again demonstrates this point: while patterns of activation in this region alone can predict low-level visual processing (Haxby and others 2001), it is also involved in distributed neural circuitry underlying more complex, context-dependent processes. In a study by Chadick and Gazzaley (2011), participants were shown images of faces and scenes simultaneously, but were told that only one image class would be task relevant while the other would be task irrelevant. During blocks when faces were task relevant, the fusiform face area demonstrated increased FC with frontoparietal areas, while the parahippocampal place area demonstrated increased FC with the default mode network; these patterns were reversed during blocks when scenes were task relevant. These distinct connection patterns, dependent on current task goals, would be overlooked if VT cortex were considered in isolation. Similarly, predictions of emotion intensity have been shown to be most accurate when features are drawn from a distributed “neural signature” rather than from isolated regions associated with emotion processing (Chang and others 2015). Such work is consistent with the growing consensus that, in most cases, brain regions do not work in isolation (Turk-Browne 2013), and underscores the utility of connection-based measures for prediction of high-level cognitive processes and behaviors. This preference is of course not absolute, and we close this section with a discussion of two additional considerations that may guide the selection of measures as model input.
Getting the Regions Right
When using region-based measures to relate individual differences in brain organization to phenotypic measures, one important consideration is how to draw region boundaries. Regions that are too large may fail to capture the processes unfolding within them (for discussion of an example in visual cortex, see Turk-Browne 2013). Furthermore, one must consider the degree of region homology across subjects. Of note, Haxby and colleagues performed the image classification analysis within-subject (i.e., patterns of activity during the first half of the experiment in a given subject were used to classify patterns of activity for that subject in the second half of the experiment) due to individual differences in VT cortex response patterns (Haxby and others 2001). This reflects the important concern, and growing consensus, that functionally homologous regions may not have the same size, shape, or location across individuals (Bijsterbosch and others 2018; Braga and Buckner 2017; Dubois and Adolphs 2016) or even within a given individual across brain states (Salehi and others 2018a), and suggests the utility of individualized parcellations (e.g., Salehi and others 2018b; see section “Individualizing Regions and Connections”) and function-based (Guntupalli and others 2018) or multimodal (Robinson and others 2014) alignment strategies; such advances may, in turn, improve the precision and utility of measures of individual differences in functional brain organization (Braga and Buckner 2017; Guntupalli and others 2018), though connections, as a second-order measure, are likely more robust to minor adjustments in region boundaries than are region-based measures (Finn and others 2015; Greene and others 2018).
The Trade-Off between Information and Complexity
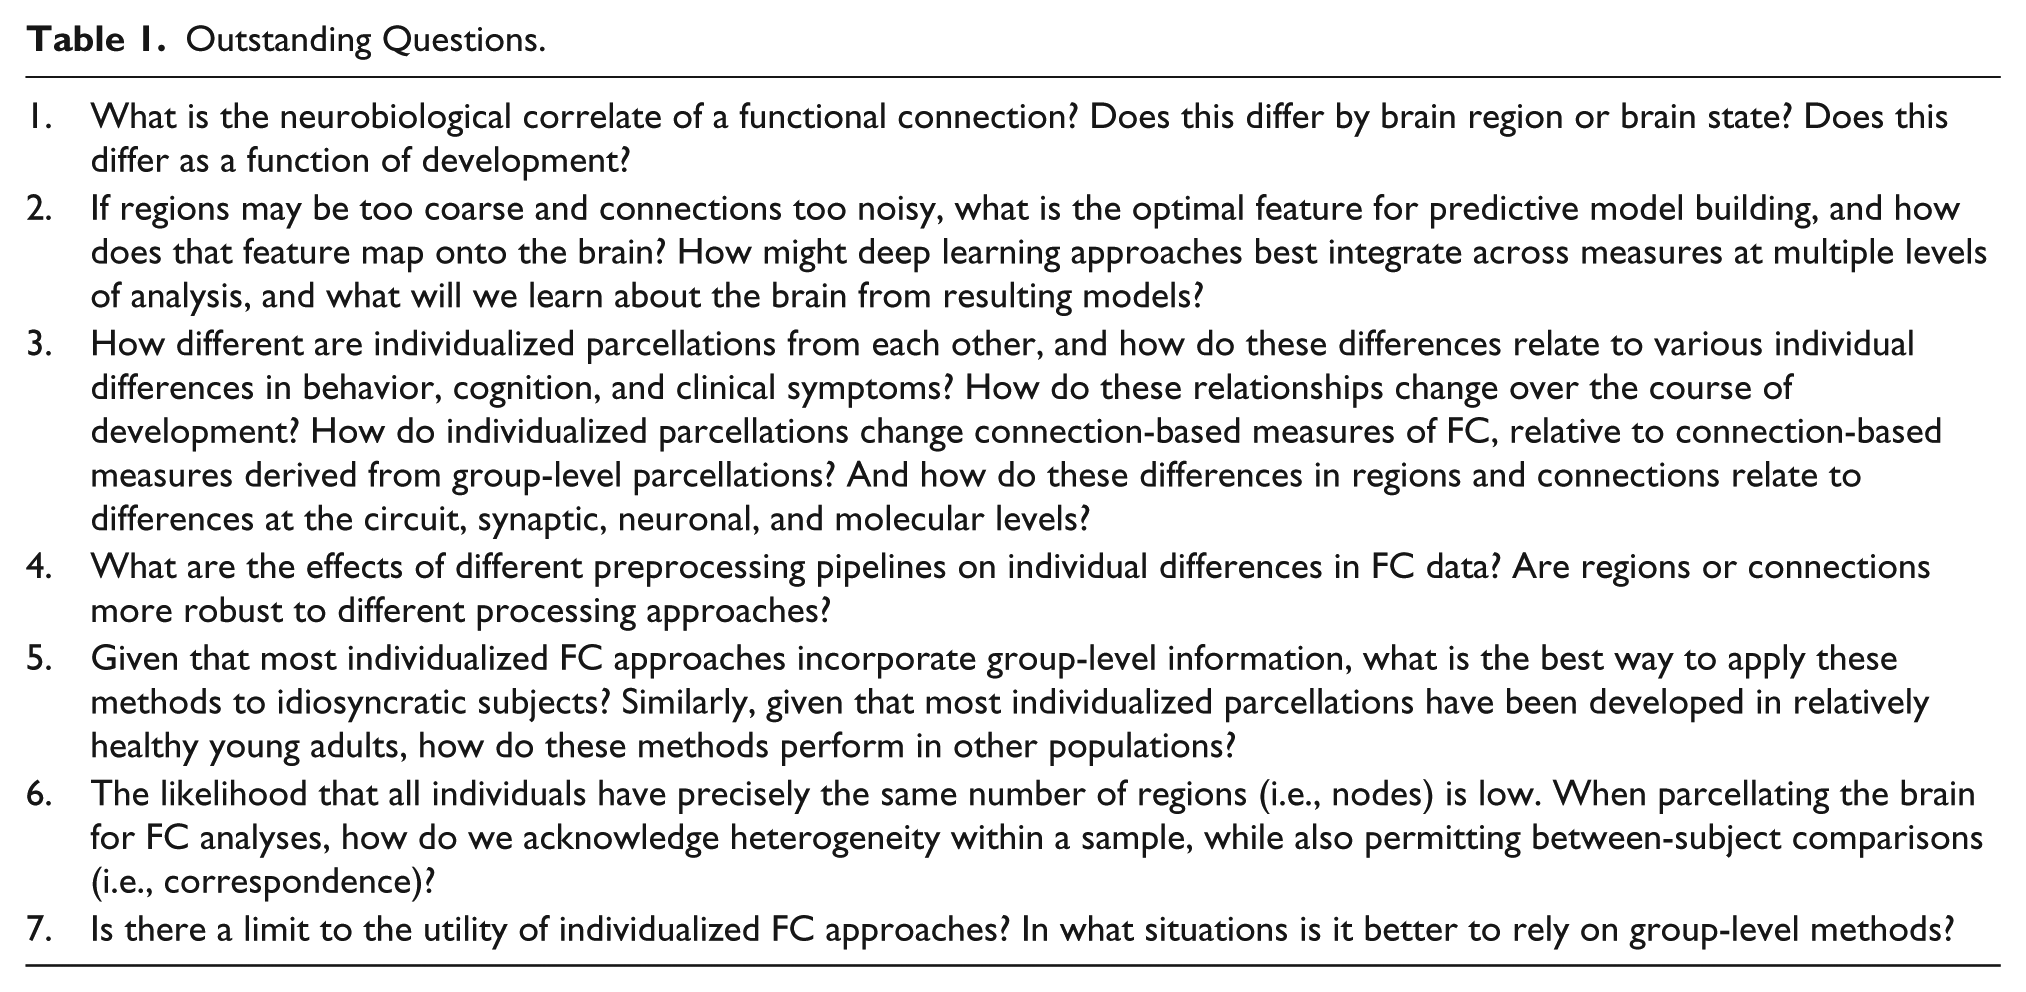
While region-based measures may obscure information, connections may yield the opposite problem: the sheer number of connections offers richness, but also redundancy and noise, and because connections usually far outnumber subjects, connection-based models are particularly vulnerable to overfitting (Yarkoni and Westfall 2017). Connection (i.e., feature) selection (Orrù and others 2012; Smith and others 2013) and summary (e.g., Shen and others 2017) may increase analysis sensitivity, but care must be taken to address redundant connections (Orrù and others 2012), and to test the significance of results generated via nonindependent analysis iterations that often involve many comparisons (e.g., via permutation testing and appropriate correction for multiple comparisons; Benjamini and Hochberg 1995; Kriegeskorte and others 2009; Smith and Nichols 2018). Dimensionality reduction, while usually considered at the region level (e.g., node-to-network assignments, spatial ICA), can also be performed at the connection level (e.g., Kessler and others 2016), and may further mitigate these concerns, suggesting that the optimal feature for predictive model building may lie somewhere between region- and connection-based measures. As the increasing accessibility of big data continues to increase study sample sizes, and as rapidly evolving tools—such as deep learning approaches—reveal complex, nonlinear features in such datasets, opportunities to bridge this gap between regions and connections will likely develop, further improve predictive model accuracy, and correspondingly reveal brain-behavior relationships (see Table 1).
Outstanding Questions.
Model Output
Once predictive models are built and validated, the next step is to ask how they map onto the brain (Scheinost and others 2019); that is, which connections or regions contribute the most to the prediction of the given measure? Methods to determine the contributions of individual features to a given model and to the representation of the measure of interest—as well as results of and confidence in these methods—vary by modeling approach (Kamitani and Tong 2005; Michel and others 2012; Norman and others 2006), but regardless of the method used, such post hoc analysis is critical, as it enables inference of the neural representation of the predicted measure.
Once features are identified, they must be summarized and situated within existing literature to facilitate interpretation. Because networks underlying high-level cognitive processes are distributed across the brain, successful connection-based models of related measures are similarly broadly distributed (e.g., Finn and others 2015). Thus, while connections may be more useful than region-based measures for building models to predict high-level cognition and behavior, the sprawling nature of the resulting models makes them difficult to interpret at the connection level. The physical mapping of regions to the brain, taken with the extensive literature on localization of function, renders model summary at the region level logical and productive.
To validate and enrich these interpretations, models should be summarized at multiple levels of analysis, leveraging both region- and connection-based measures; for example, both individual connections and node degree can be projected onto the brain (e.g., Fig. 8b; Dosenbach and others 2010); or edge counts can be summarized and visualized by coloring parcellation nodes according to their degree (e.g., Fig. 8c; Greene and others 2018), while the importance of interregional communication can be visualized at the network level by assigning parcellation nodes to networks and counting connections within and between networks (e.g., Fig. 8d; Greene and others 2018). By considering regions at various scales as well as interactions among them, one avoids the likely oversimplified assumption that a given region has a single identity or that a given function can be assigned to a single region (Genon and others 2018), promotes reproducibility by requiring analyses to produce convergent results, and offers multi-scale, nuanced contributions to characterizations of neural representation.
Individualizing Regions and Connections
The development and deployment of predictive models depend on the existence of robust individual differences in fMRI patterns, and on the relationship of these differences to behavior and cognition (Barch and others 2013). Numerous groups have shown that individuals exhibit significant, stable differences in functional brain organization and that region- and connection-based measures can be used to capture and leverage these differences (Finn and others 2015; Gratton and others 2018; Horien and others 2019; Salehi and others 2018b; Tavor and others 2016; Wang and others 2015). However, individual differences in fMRI data based on group-defined parcellations—and the relationship of these measures to phenotypes—may be confounded by individual differences in the spatial configuration of brain regions (Bijsterbosch and others 2018). Such findings have motivated the development of individualized analysis techniques, which, as before, may adopt one of two approaches: the personalization of region boundaries or of connections among regions. We note that these approaches are interrelated—an individualized parcellation yields, in a sense, individualized connections, and by choosing to individualize connections, one ultimately ends up with regions that are individual-specific as well. And while both approaches are motivated by the desire to capture measures of brain organization that are more neurobiologically meaningful, they reflect fundamentally different assumptions about the source of individual variability in organization. In this final section, we highlight examples of individualization using each approach and discuss the use of these techniques to reveal brain-behavior relationships.
Regional and Connection-Based Approaches to Individualization
A common way to individualize the study of brain functional organization is to obtain individual-specific region boundaries (e.g., Gordon and others 2017b; Kong and others 2018; Salehi and others 2018b). By identifying functionally specialized regions that are more homogeneous in each person, such individualization of region boundaries would be expected to yield measures of brain activity that are more precise and neurobiologically meaningful. Indeed, these studies have shown that group-level networks tend to obscure aspects of network organization that are apparent at the individual level (Gordon and others 2017a; Gordon and others 2017b; Laumann and others 2015; Wang and others 2015), and these individualized network boundaries tend to follow individualized neuroanatomical boundaries, such as those defined by intracortical myelin maps (Gordon and others 2017b). In addition to changing across individuals, region boundaries have also been found to reconfigure across task states within a given individual, and these changes are themselves functionally meaningful, serving as a region-based signature of task state and predicting task performance (Salehi and others 2018a).
A variant of this approach is connectivity hyperalignment (Guntupalli and others 2018), which aligns regions based on their whole-brain patterns of connectivity. This approach underlines the synergy between region- and connection-based approaches to studying the brain; even functional connectivity can be used to characterize a given region, and one can then study the hyperaligned regions or the connections among them. These connections are not, themselves, individualized, but their derivation from regions that may be more precise and functionally relevant will likely increase the precision, behavioral relevance, and interindividual correspondence of connection weights. Indeed, Guntupalli and colleagues found that FC measures after hyperalignment demonstrated both increased intersubject correlation and a preservation of individual differences, supporting the idea that using connectivity patterns to individualize alignment reveals shared structure in connections across subjects. Others have similarly used cortex-wide patterns of connectivity to draw—and in some cases individualize—node boundaries (for a review, see Eickhoff and others 2018). These methods, by identifying both shared and individual-specific structure in brain functional organization, offer insights that may be obscured by group-level, areal parcellation-based analyses.
Methods that directly individualize connections are less common, but worthy of consideration; as with individualized regions, individualized connections may be expected to be more meaningful, both statistically and biologically (Bijsterbosch and others 2018). For example, in a study conducted by Ball and others (2014), a random parcellation was used to separate the brain into regions, which were thresholded by degree to identify a core network of structural connections in each individual. Resulting connectivity matrices were submitted to network analyses to yield metrics such as rich-club organization, which in turn revealed important insights into development of structural organization. While this example is drawn from the structural connectivity literature, comparable FC analyses are possible; by randomizing region boundaries—a relatively common approach to brain parcellation (Behrens and Sporns 2012)—and instead individualizing connections, such work is in contrast to region-based individualization approaches, which assume that these boundaries are themselves meaningful and subject specific.
Whether individualizing regions or connections, a key question is how best to compare resulting measures across subjects. The majority of individualized analysis approaches maintain the correspondence of region labels across subjects (e.g., by using a group-level parcellation as a prior; for additional considerations required by this approach, see Table 1); this facilitates intersubject analyses, such as between-subject classification and predictive modeling. In cases in which correspondence is not ensured (e.g., when total region or connection number varies across individuals), measures must be rendered comparable (e.g., by imposing sparsity thresholds) and summarized (e.g., via measures such as clustering coefficient and rich-club organization; Ball and others 2014). Whether correspondence is necessary remains an important question for future work (see Table 1).
Using Individualized Measures to Reveal Biological Phenotypes
By potentially revealing more neurobiologically meaningful regions and connections (see section “Using Regions and Connections to Reveal Neurobiological Insights”), individualized approaches may help reveal the neural bases of various phenotypic features. This is a critical test of the utility of individualized techniques; should subject-specific measures fail to more robustly predict phenotypic measures than group-level measures, one could argue that the costs of individualization—namely, the increased quantity of data that the approaches often require (Braga and Buckner 2017; Gordon and others 2017b; Laumann and others 2015)—outweigh the benefits and should prevent the widespread adoption of individualized approaches in research and clinical contexts (see Table 1).
In fact, clues are beginning to emerge that individualized fMRI measures can be linked in meaningful ways to phenotypic and behavioral information. For instance, Salehi and others (2018a) determined that it is possible to predict in-scanner task performance using individualized node sizes as the predictive feature. Wang and others (2015) created individualized parcellations for a group of neurosurgical patients and showed that sensorimotor networks could be reliably located with higher accuracy than they could by using conventional task-fMRI methods, suggesting one potential clinical application and reinforcing that precision medicine could benefit from individualized analysis approaches. Finally, Kong and others (2018) recently generated individualized parcellations for subjects and used the spatial topography of networks to predict various measures of cognition, emotion, and personality. This work demonstrates that the additional neuroscientific insights to be gained from individualized measures are not simply theoretical, promising a future of improved understanding of brain functional organization and individual differences in this organization. While it remains to be seen if region- or connection-based methods will be more affected by individualized connectomics, it is certain that both approaches will continue to benefit from the acknowledgment of individual differences in functional organization.
Concluding Remarks
Over the past 20 years, fMRI has emerged as a critical tool to study macroscale neural circuitry. In the process, many have explored specific methods to characterize and quantify brain functional organization (Smith and others 2011), but far less attention has been paid to a fundamental dichotomy in the field: Is the brain best studied as a compendium of discrete units (i.e., regions), or as a busy system of crisscrossed wiring among those units? In this work, we have juxtaposed these approaches to explore the different—and complementary—applications of region- and connection-based measures. Our hope is that this piece has encouraged the reader to carefully consider the best ways to interrogate macroscale neural circuitry. Whether using region- or connection-based metrics, thoughtful selection of fMRI measures to best suit the question of interest presents the exciting opportunity to probe neural representation; to predict behaviors, traits, and clinical outcomes; and, most fundamentally, to come ever closer to understanding how our brains make us who we are.
Footnotes
Declaration of Conflicting Interests
The author(s) declared no potential conflicts of interest with respect to the research, authorship, and/or publication of this article.
Funding
The author(s) disclosed receipt of the following financial support for the research, authorship, and/or publication of this article: CH and AG are both supported by a Medical Scientist Training Program training grant (T32GM007205).