
Abstract
Introduction
Cancer screening programs are pivotal in facilitating early tumor detection and reducing cancer-related mortality. However, the reliance on individual performance indicators may not offer a fully integrated perspective of screening effectiveness. This study aimed to develop a composite indicator that consolidates key screening metrics using Principal Component Analysis (PCA) to derive objective weights.
Methods
Data were drawn from the annual collection of breast and colorectal cancer screening activities conducted in 2023 by the eight regional health authorities (ATSs) of Lombardy, Italy. Indicators spanning structural, organizational, clinical-diagnostic, and impact dimensions were standardized and analyzed using PCA. The resulting factor loadings informed weights for computing a weighted arithmetic mean of the z-scored indicators. Robustness was evaluated through sensitivity analyses involving alternative normalization techniques. Additionally, comparisons were made against an equally weighted arithmetic mean of the same indicators.
Results
The composite indicator identified marked geographical variations in screening performance across Lombardy’s ATSs. Structural and organizational factors, particularly examination coverage and participation rates, exerted the greatest influence on overall effectiveness in both breast and colorectal screening programs. In contrast, clinical-diagnostic and impact measures, as well as invitation coverage, contributed less substantially. High correlations in the sensitivity analyses affirmed the reliability of the proposed methodology.
Conclusions
Adopting a composite indicator can substantially improve the evaluation of cancer screening initiatives by integrating diverse metrics into a cohesive, objective framework. In doing so, it enables more effective resource allocation, enhances adherence strategies, and guides targeted interventions aimed at bolstering screening success.
Plain Language Summary
Why was the study done? Organized screening helps find cancers early, when treatment works best. In practice, performance is usually judged with many separate measures—such as participation, coverage, recalls, or detection rates—making it difficult to get a clear overall picture of how programs are doing. This study set out to create a single, easy-to-read measure that brings those indicators together. What did the researchers do? They used 2023 data from the eight health authorities (ATS) in Lombardy for breast and colorectal screening and combined multiple indicators into a single composite score. To decide how much each indicator should count, they applied Principal Component Analysis (PCA), a statistical technique that assigns objective weights, then calculated a weighted average of the standardized indicators. They also checked that results stayed consistent when using different, reasonable ways to prepare the data and when comparing against a simple equal-weights score. What did the researchers find? Performance varied across areas. Organizational factors mattered most: examination coverage and participation rates had the largest influence on the overall score. By contrast, invitation coverage and several diagnostic or early-impact measures contributed less. The composite score was stable across sensitivity checks, indicating the method is robust. What do the findings mean? A single composite indicator gives a clearer, more balanced view of screening performance. It can help decision-makers identify where to focus efforts, allocate resources more effectively, and design actions to raise participation. The approach is transferable and can be extended to other screening programs and future years to track progress over time.
Introduction
Cancer screening programs for the early diagnosis of breast and colorectal cancers are a central component of the Italian Essential Levels of Care (LEA). These programs play a pivotal role in detecting tumors at an early stage, thereby significantly improving the likelihood of successful treatment and recovery.1,2 They have also been shown to reduce cancer-related mortality,3,4 and enable a more efficient allocation of healthcare resources. 5
In Italy, the impact of organized screening programs is well documented. For example, breast cancer screening has been associated with up to a 25% reduction in breast cancer mortality in regions where it is offered, accompanied by an additional 45% reduction among women who consistently undergo screening. 6 As compared to not-yet-invited cases, the probability of mastectomy was reduced by more than one-third in screening detected cases at first test and almost halved in those screening detected at subsequent tests, whereas participation in screening in the past reduced the risk of mastectomy by 12%. 7 Equally noteworthy, colorectal cancer screening has led to an approximately 20% reduction in mortality in covered areas,8,9 as well as a 10-28% decline in incidence among those who adhere to screening protocols. 10
In the Lombardy Region (LR), organized cancer screening initiatives were launched in the early 2000s and became fully operational by 2007. These programs in Lombardy consistently surpass national benchmarks, achieving an average 75% adherence rate for mammography and exceeding 90% coverage for colorectal cancer screening.11–13
To monitor cancer prevention activities, the LR defined a set of indicators in 2014 that encompass structural and organizational elements (eg, adherence, coverage, waiting times), clinical-diagnostic metrics (eg, recall rate, positive predictive value), and early impact measures (eg, cancer detection rate). Although each indicator offers valuable insights, relying on them in isolation can obscure the broader view of screening effectiveness. To address this gap, there is growing recognition of the need to develop composite indicators that integrate multiple metrics, delivering a clear and immediate depiction of screening performance.
Despite the recognized value of such summarized measures, composite indicators in oncology screening are relatively scarce. Notably, the new guaranteed system has introduced the “P15 C” indicator, which enable regional-level comparisons by averaging the participation rates in cancer screening programs among those invited (breast, colorectal and cervical cancer screenings). 14 This underscores an emerging trend toward more holistic approaches to performance measurement. Another example of prioritizing performance and outcome indicators for use in screening data evaluation systems is provided by Sheridan and colleagues, 15 who initially identified 58 indicators through a systematic review and, using a Delphi process, selected a final list of 23 indicators covering 10 predefined categories for breast, colorectal and cervical cancer screening programs. Their findings highlighted detection rate, examination coverage, and interval cancer rate as the most important indicators across all types of cancer screening programs, without distinction between program types. Similarly, in the study by Muratov et al, 16 a group of expert rated and ranked a set of performance indicators on breast cancer screening program against preagreed criteria, including relevance, measurability, accuracy, ethics, and understandability. Their aim was to identify a set of indicators fundamental for describing the breast cancer screening pathway, rather than to rank the indicators against each other or to calculate an overall composite score. The final list comprised 13 indicators covering key steps along the screening pathway: screening coverage, participation rate, recall rate, breast cancer detection rate, invasive breast cancer detection rate, cancers >20 mm, cancers ≤10 mm, lymph node status, interval cancer rate, episode sensitivity, time interval between screening and first treatment, benign open surgical biopsy rate, and mastectomy rate.
However, literature on composite indices calculated for measuring the performance of cancer screening programs is scarce and even null. Building on this gap, the present study proposes a novel composite indicator based on breast and colorectal cancer screening data, integrating all stages of cancer prevention — from structural and organizational aspects to diagnostic processes and outcome measures. In doing so, the indicator supports more robust geographic comparisons across the health authorities (ATSs) in the LR, allowing both high- and low-performing areas to be identified swiftly. Additionally, it isolates the specific metrics most responsible for driving overall performance, helping decision-makers pinpoint strategic targets for improvement.
Beyond performance tracking, such a composite indicator can serve as a strategic lever for resource optimization, improved adherence strategies, and the timely identification of critical issues requiring targeted interventions. Ultimately, by providing a more integrated and accurate measurement of program effectiveness, it holds the potential to bolster the broader impact of cancer prevention efforts in LR and beyond.
Methods
The Italian and Lombardy Screening Programs
In Italy, population-based screening programs for the early detection of breast and colorectal cancers are guaranteed to all residents by the National Health Service and implemented by the Regional Health Authorities, offering free-of-charge examinations to all eligible individuals in accordance with national and European quality assurance guidelines. The National Prevention Plan 2020-2025 17 identifies organized breast and colorectal cancer screening as key strategies for the early identification and timely management of individuals at risk. Screening performance indicators are routinely monitored and used both for quality assurance and for benchmarking the effectiveness of regional health systems within the Network of Italian Regions.
In the Lombardy Region, located in Northern Italy and the most populous region of the country (about 10 million inhabitants), organized screening programs for breast and colorectal cancers were progressively implemented in the early 2000s and achieved full regional coverage by 2007.
The breast cancer screening program offers biennial mammography to women aged 50-69 years, with the upper age limit extended to 74 years since 2017. 18 In addition, women aged 45-49 are currently invited to undergo an annual bilateral mammography. All eligible women receive a personal invitation letter specifying the appointment time and location at accredited radiology units. Screening mammography consists of 2 views and independent double reading, as recommended by the European guidelines for quality assurance in breast cancer screening and diagnosis. 19 Women with negative results are reinvited after 2 years, while those with positive or uncertain findings are directly contacted by the screening center and referred for second-level diagnostic assessment, which may include additional mammographic views, breast ultrasound, clinical examination, and, when required, cytological or histological verification. Confirmed malignant cases are referred to multidisciplinary breast units for staging and treatment planning, whereas those with benign findings return to the routine screening cycle.
The colorectal cancer screening program invites men and women aged 50-74 years (initially 50-69 years) to perform a fecal immunochemical test (FIT) every 2 years. 18 Invitation letters are mailed to all eligible residents, who can collect the test kit at participating pharmacies or health centers. Pharmacies assist participants with kit registration and barcode linkage to the regional screening database, ensuring traceability. The test is performed at home and returned to the collection point within the validity period indicated in the invitation (usually 60-90 days).
Individuals with a negative FIT result are reinvited after 2 years, whereas those with a positive result are actively contacted and referred for a diagnostic colonoscopy at accredited endoscopy units. Participants with confirmed pathology (ie, adenomas, serrated lesions, or hyperplastic polyps) are referred for specialist gastroenterology or oncology management, whereas those with benign findings or a negative colonoscopy result are re-invited for FIT screening after 5 years, in accordance with the Lombardy regional guidelines. 20 Throughout the process, each ATS screening center (Centro Screening) oversees scheduling, diagnostic follow-up, and reintegration into the next invitation round.
Data Sources
This study describes the breast and colorectal cancer screening activities carried out in Lombardy, as reported by the eight ATSs through the annual survey forms submitted to the Ministry of Health (via the National Screening Observatory – ONS) for monitoring the Essential Levels of Care (Livelli Essenziali di Assistenza, LEA). The eight ATSs included in the analysis are Brescia, Brianza, Bergamo, Insubria, Milan, Montagna, Pavia, and Val Padana, hereafter referred to as ATS 1-8 in random order for privacy reasons.
The analysis focuses on screening activities conducted in 2023. The LR authorized the ATS of Milan to use these data for the purpose of this study. Data, owned by the LR, were provided to the ATS of Milan in aggregated form at the ATS level, with each indicator reported as a value for the corresponding ATS. No individual-level data were accessed or managed by the ATS of Milan. Ethical approval and informed consent statements were not required as the data were provided, directly from the LR to the ATS of Milan, in an aggregated form, ensuring no individual-level information was included.
As the data were provided in aggregated form directly by the LR (the data holder) to the ATS of Milan, no individual-level information was included. According to the regulations of the LR and in agreement with its institutional policies, ethical approval was not required for the use of these data. Therefore, no submission to an ethics committee was necessary.
Detailed information on each indicator, including local,21,22 national12,23,24 and European benchmarks, 19 categorized by screening type, can be found in the supplementary materials (Table S1). This analysis considered indicators that reflect the entire screening process (ie, without distinguishing between first attendance and re-attendance). The target population for breast cancer screening includes women aged 50-74, while colorectal cancer screening targets both men and women within the same age range.
To ensure all indicators were measured on a uniform scale and interpreted consistently, the following transformations were applied. • Conversion to percentages: Indicators originally expressed as rates per 1000 were converted into percentages. • Reversed polarity adjustment: Indicators such as “Cancer Detection Rate,” whose higher raw values would imply poorer performance, were transformed by taking their complementary value so that scores closer to 100 indicate optimal performance, and values approaching 0 reflect poor performance.
Indicators pertaining to waiting times were excluded, as they mainly reflect organizational efficiency rather than the actual quality, accuracy, or effectiveness of cancer screening activities. In addition, adherence and coverage indicators were adjusted to account for only those individuals who were truly eligible, ensuring that calculations excluded people who should not have been invited.
Finally, invitation coverage may exceed 100% if invitations are unevenly distributed across years or when the invited population was larger than the target group for that year.13,22
Statistical Analysis
All indicators were summarized using mean and standard deviation. A correlation matrix was then generated to identify any highly redundant measures (correlation >0.9), which were excluded from further analysis.
To derive a weighting system for the composite indicator, a Principal Component Analysis (PCA) was performed. 25
PCA is a dimensionality-reduction technique that consolidates the original variables into principal components (PCs) - linear combinations of the original indicators - thereby capturing most of the dataset’s variability. Because the selected indicators were heterogeneous, the z-score transformation was applied to standardize them prior to PCA. For both breast and colorectal screening, the PCs cumulatively explaining at least 80% of the total variance were retained, and varimax rotation was employed to facilitate interpretation.
The loadings obtained after varimax rotation were used to establish an objective weighting scheme for each indicator, thus reflecting their relative importance in explaining the overall variability.26,27
Specific formulations can be found in the supplementary materials. Finally, the composite indicator was computed as the weighted arithmetic mean of the z-scores, leveraging these PCA-derived weights. This approach ensures compensability (ie, lower values in some indicators can be offset by higher values in others), which aligns with the goal of assessing an overall level of screening performance across different territorial units.
Sensitivity Analysis
To test the robustness of this composite indicator, alternative normalization methods—namely min-max scaling and distance from a reference (the regional mean)—were applied. Results were also compared to a simpler composite measure obtained by taking the arithmetic mean of the z-scores with equal weights. Pearson correlations between the proposed indicator and these alternatives were computed to assess consistency.
All analyses were performed using R version 4.4.2 (2024-10-31 ucrt). In particular, the prcomp function was used for PCA, the principal function from the psych package for varimax rotation, and the COINr package for both constructing the composite indicator and running the alternative normalization procedures in the sensitivity analysis.
Results
Target Population of the Eight Regional ATSs of Lombardy

Breast Cancer Screening
For breast cancer screening, 11 indicators were initially examined (see Supplemental Materials, Table S1). The overall invitation coverage reached a regional average of 99%, with values ranging from 78% to 121% across ATSs, indicating substantial variability. Similarly, adherence to breast screening averaged 70% region-wide but again showed noteworthy geographic variation.
Given the inherent heterogeneity of these indicators (Table S1), standardization was essential prior to conducting PCA. Specifically, “Recall Rate,” “Invasive Follow-ups,” and “Cancer Detection Rate” required transformation by taking their complementary values so that all indicators would share the same direction of interpretation. Moreover, “Cancer Detection Rate” was converted from a rate per 1000 to a percentage to maintain consistency. Based on correlations (see Table S2 in the Supplemental Materials), “Conservative Intervention ≤2 cm,” “Cancer Detection Rate,” and “Cancer Detection Rate ≤1 cm” were removed to mitigate redundancy.
Factor Loadings and Explained Variance of the Principal Components by Screening (after Varimax Rotation). Bold values highlight the normalized quadratic factor loadings used for constructing composite indicators

PC = Principal Component.
As illustrated in Figure 1, the ATS 6 exhibited the highest composite score for breast cancer screening activity, followed by ATS 8 and ATS 1. Both ATS 4 and ATS 3 performed around the regional mean, whereas ATS 5, ATS 2, and ATS 7 recorded values below the regional average. Comparative assessment of breast (left side of the plot) and colorectal cancer (right side of the plot) screening activity in Lombardy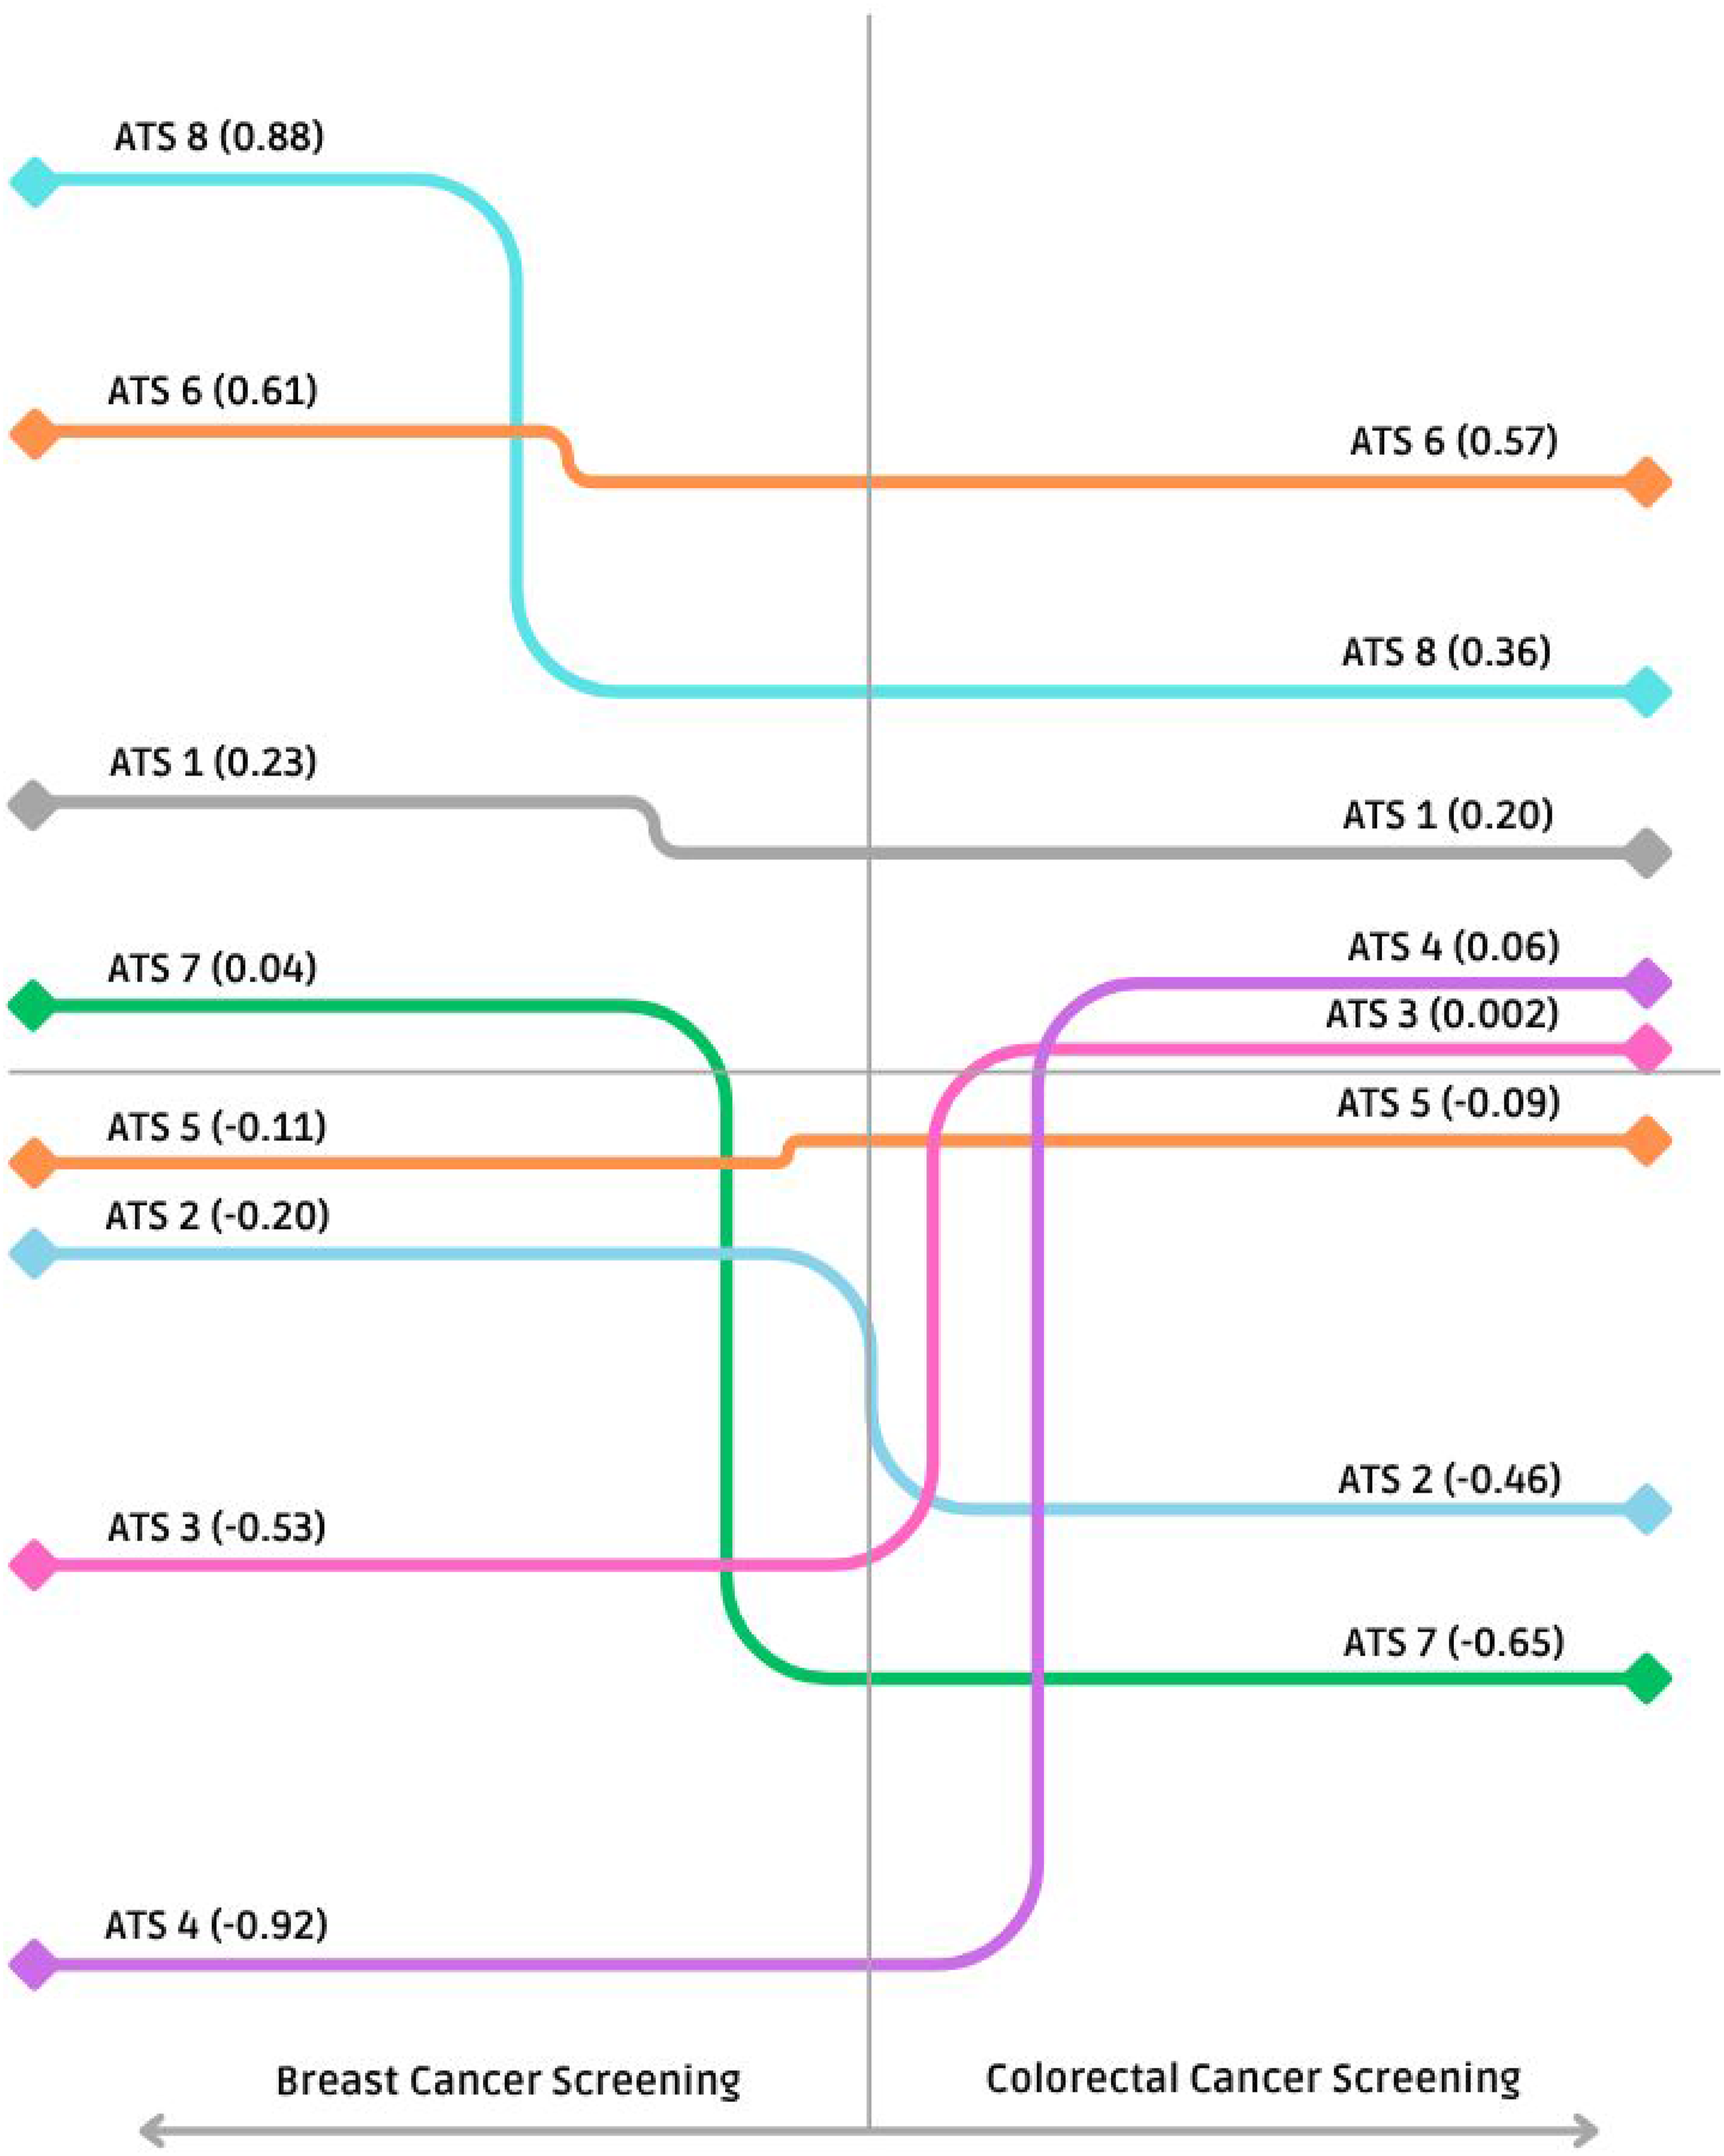
Colorectal Cancer Screening
For colorectal cancer screening, 19 indicators were initially reviewed (Table S1). Invitation coverage attained a regional average of 105%, and the participation rate stood at 47%. Although this participation rate was lower compared to breast cancer screening, its territorial variability was somewhat less pronounced.
As with breast cancer, certain indicators (eg, “Recall Rate,” “Cancer Detection Rate,” “Detection rate: advanced adenoma,” and “Detection rate: initial adenoma”) were transformed via complementary values to harmonize their polarity with the remaining indicators. Similarly, “Lesions treated with surgery” and “Lesions treated with surgery: advanced adenoma” were excluded, because they are essentially complementary to “Lesions treated with endoscopy” and “Lesions treated with endoscopy: advanced adenoma,” respectively.
“Detection rate: advanced lesions” was also omitted, since it represented the sum of 2 other base indicators, reducing its unique analytical contribution. Furthermore, “Detection rate: advanced adenoma,” “Positive Predictive Value: advanced lesions” and “Positive Predictive Value on colonoscopy” were removed due to high intercorrelations (Table S2).
PCA revealed the need for 4 principal components to explain at least 80% of the total variance, compared with 3 principal components for breast cancer screening. The resulting weighting scheme placed highest importance on “Examination Coverage,” followed by “Recall Rate,” “Participation Rate,” and “Detection rate: initial adenoma.” Meanwhile, “Positive Predictive Value: initial adenoma,” “Positive Predictive Value,” and “Invitation Coverage” received relatively low weights.
Figure 1 shows the geographical distribution of composite scores for colorectal screening, which proved more variable than that of breast cancer screening. ATS 8 led the region in performance, followed by ATS 6 and ATS 1. ATS 7 hovered near the regional average, whereas ATS 5 and ATS 2 fell below it. Both ATS 3 and ATS 4 posted scores substantially lower than the regional mean.
Sensitivity Analysis
The proposed composite indicator demonstrated a high degree of consistency across different normalization techniques, with correlation coefficients ranging between 0.88 and 0.98 for breast cancer screening and between 0.93 and 0.99 for colorectal cancer screening (Table S3). Likewise, comparisons with a simple arithmetic mean of standardized indicators (z-scores) using equal weights showed strong correlations (0.88 for breast and 0.93 for colorectal). These findings affirm the methodological robustness of the new composite indicator, underscoring its reliability in capturing underlying screening performance across diverse ATSs.
Discussion
This study introduced a composite indicator designed to evaluate breast and colorectal cancer screening activities in the LR. Although the individual (elementary) indicators analyzed offer essential insights into specific facets of screening programs, there is a clear need for a more holistic measure that can guide decision-makers in allocating resources and formulating policies. By consolidating multiple indicators into a single composite measure, healthcare authorities gain the ability to quickly identify both high-performing domains and areas in need of improvement.
A key benefit of this composite approach lies in revealing the relative importance of various indicators, as reflected in their PCA-derived weights. Notably, structural/organizational and clinical-diagnostic process metrics - specifically examination coverage, participation rate, and recall rate - emerged as the most impactful contributors to the composite score. This highlights the strategic significance of expanding overall coverage and ensuring robust follow-up practices, both of which are closely tied to enhanced screening outcomes. Conversely, indicators related to post–positive screening pathways, though clinically vital to patient management and outcomes, received lower weights in the composite measure. Likewise, invitation coverage was less influential than initially anticipated, suggesting that proactively reaching out to the target population, while crucial, may have a smaller overall impact on performance than ensuring that those who receive invitations ultimately participate and complete the relevant screening steps.
The relative importance of each indicator in the composite score is a key concept for ATSs aiming to improve cancer screening programs in their territories. By focusing on the indicators assigned the highest weights and comparing each ATS’s performance with its respective benchmark, ATSs can more effectively target areas for improvement and enhance overall program performance. This composite measure can also be used for planning and resource allocation, serving as a sentinel to identify potential issues at the level of individual ATSs. Access to data for each specific indicator allows the ATSs to engage in targeted discussions, improve performance on specific aspects of their screening programs, and better align their work objectives. Furthermore, by comparing their performance on the most heavily weighted indicators against benchmarks, each ATS can drive continuous improvement and raise its standing within the composite index.
It is important to acknowledge how methodological choices may have shaped these findings. The exclusion of highly correlated indicators, while necessary to prevent redundancy, can inadvertently omit subtle but clinically meaningful dimensions. For example, “cancer detection rate ≤1 cm” could shed valuable light on the success of early detection efforts; yet it was removed to maintain statistical rigor and avoid duplication in the composite measure.
Another limitation pertains to the use of data from a single year (2023), which restricts our ability to capture time-trends or the whole screening round performance and may be influenced by yearly fluctuations or unanticipated events. Expanding this analysis to a multi-year framework would enable researchers and policymakers to discern more stable patterns, potentially refining the reliability and interpretability of the composite indicator. Future work could also incorporate cervical cancer screening data, creating a more comprehensive measure that captures the full spectrum of organized screening activities in Lombardy.
A particularly noteworthy finding emerged regarding the disparities in screening uptake between densely populated urban centers and more rural areas. This outcome aligns with prior research from the ATS of Milan, which indicated that the concentration and availability of radiological and endoscopic services, as well as specialized medical consultations (eg, gynecological or gastroenterological), can influence participation rates in urban settings. 28
Such contextual factors emphasize the need for tailored interventions, including improved access to screening facilities and communication strategies adapted to diverse socio-demographic environments.
All the eight ATSs operate under the same regional protocols and organizational standards for screening implementation, ensuring uniform procedures across Lombardy. However, contextual factors may influence service delivery. Rural and mountainous areas, such as the ATS della Montagna and the ATS Insubria, face logistical challenges related to population dispersion, road infrastructure and transport accessibility, while urban areas like the ATS Città Metrpolitana Milano are characterized by high population mobility and turnover in healthcare registration, which may affect invitation coverage. Benassi et al 29 described similar territorial heterogeneities in healthcare accessibility among older adults in Lombardy, showing that infrastructural and geographical constraints can limit access in rural and mountainous areas. To reduce such barriers, since late 2025 the ATS Insubria has introduced a mobile screening unit to improve accessibility in peripheral and mountainous areas. 30
Our work should be seen as complementary to the 1 recently performed in the context of the CanScreen-ECIS project, 15 where 23 priority indicators were prioritized by consensus by a Delphi panel involving 33 cancer screening experts. Notably, the 2 approached converged on the relevance given to Examination Coverage and Participation Rate. Similarly, the new guaranteed system composite indicator, P15C—constructed for regional-level comparisons and calculated as the average of participation rates—reinforces the relevance of target population participation in screening programs. 14
Differences in breast and colorectal cancer screening performance across the ATS areas may be partially attributable to gender-related disparities in participation. Comparative and meta-analytic studies consistently report lower uptake among men than women in fecal immunochemical test (FIT)-based colorectal screening programs.31,32 This trend may reduce overall performance in programs where both sexes are eligible, in contrast to breast cancer screening, which targets only women. However, the evidence is not entirely consistent across different settings and study designs, with some reports indicating minimal differences.33,34 In our context, publicly available data from the LR reveal a persistent gap in participation between women and men in organized colorectal screening. 35 This pattern is consistent with international findings and supports the hypothesis that sex-related behavioral factors contribute to the observed variability across the ATS areas.
Although the number of observations in this study was insufficient to support a robust spatial analysis, a valuable and informative methodological extension—also for other contexts with larger sample sizes—would be to develop composite indicators based on PCA applied to geographical data. 36 The development of composite indicators has received considerable attention in the literature, particularly from a policy perspective, as such measures can facilitate the ranking of geographical units and inform resource allocation.37,38 Within this context, spatial PCA provides a means to explicitly incorporate spatial dependencies and assess the impact of spatial scale on composite indicator construction. 36
Despite these complexities, the composite indicator demonstrated consistent performance across a range of normalization methods, displaying high correlations even when compared to a simpler arithmetic mean with equal weights. This points to the robustness of the proposed metric and underscores its utility for both intra- and inter-regional comparisons. Moving forward, expanding data sources, integrating more screening programs, and conducting longitudinal analyses will further enhance our understanding of how composite indicators can best inform strategies to optimize cancer screening and ultimately improve population health.
Conclusions
Cancer screening programs are a cornerstone of public health, serving as a critical mechanism for both preventing and managing cancer. In this study, we developed and validated a composite indicator grounded in PCA to provide a more holistic assessment of screening programs in Lombardy. By integrating multiple metrics into a single synthetic measure, this new tool has brought to light important geographic variations in performance across the eight ATSs. Such insights are invaluable for pinpointing areas in need of intervention, guiding strategic investments in screening infrastructure, and refining clinical workflows to maximize outcomes.
Beyond its immediate utility for internal benchmarking, this composite indicator can significantly advance the planning, management, and monitoring of cancer screening programs. The ability to capture and compare multiple facets of screening effectiveness - ranging from population coverage to recall rates - offers decision-makers a robust framework for targeting resources where they are most needed and for setting evidence-based priorities. Ultimately, optimizing screening activities contributes to lowering cancer-related mortality, improving early detection, and enhancing the overall quality of life for the population.
Looking ahead, broadening the scope of analysis to include additional screening programs - such as cervical cancer screening - and incorporating data over multiple years would further strengthen the indicator’s applicability. This longitudinal perspective would facilitate tracking trends, reveal more stable patterns of performance, and permit nuanced evaluations of how organizational or policy changes impact screening outcomes over time. Furthermore, extending this methodology to other Italian and European regions could foster collaborative learning, stimulate the adoption of best practices, and expedite the pursuit of internationally recognized standards of excellence in cancer prevention and control.
In sum, this study underscores the power of composite indicators in distilling complex data into actionable intelligence. By illuminating strengths and weaknesses across different healthcare settings, the proposed PCA-driven approach can play a pivotal role in shaping more effective, equitable, and sustainable cancer screening programs in the LR and beyond.
Supplemental Material
Supplemental Material - Improving Cancer Screening Program Evaluation Through Principal Component Analysis-Driven Composite Indicators: Evidence From Lombardy, Italy
Supplemental Material for Improving Cancer Screening Program Evaluation Through Principal Component Analysis-Driven Composite Indicators: Evidence From Lombardy, Italy by Rossella Murtas, Brunella Frammartino, Danilo Cereda, Silvia Deandrea, Antonio Giampiero Russo in Cancer Control
Footnotes
Ethical Consideration
Data were provided in aggregated form directly by the Lombardy Region (the data holder) to the ATS of Milan, no individual-level information was included. According to the regulations of the LR and in agreement with its institutional policies, ethical approval was not required for the use of these data. Therefore, no submission to an ethics committee was necessary.
Author Contributions
A.G.R., D.C. and S.D. conceived the study, provided the conceptual framework, and guided the methodological approach. R.M., B.F., and A.G.R. designed the study. R.M. performed the statistical analysis and developed the composite indicator methodology. A.G.R. supervised the study, ensuring alignment with epidemiological and public health priorities. A.G.R., B.F. and R.M. drafted the manuscript, with substantial input and revisions from all authors. All authors critically revised the manuscript and approved the final version.
Funding
The authors received no financial support for the research, authorship, and/or publication of this article.
Declaration of Conflicting Interests
The authors declared no potential conflicts of interest with respect to the research, authorship, and/or publication of this article.
Data Availability Statements
Data cannot be shared due to restriction imposed by the data provider.
Supplemental Material
Supplemental material for this article is available online.
References
Supplementary Material
Please find the following supplemental material available below.
For Open Access articles published under a Creative Commons License, all supplemental material carries the same license as the article it is associated with.
For non-Open Access articles published, all supplemental material carries a non-exclusive license, and permission requests for re-use of supplemental material or any part of supplemental material shall be sent directly to the copyright owner as specified in the copyright notice associated with the article.