
Abstract
Purpose
The predictive sensitivity of carbohydrate antigen 19-9 (CA19-9) in assessing the prognosis of intrahepatic cholangiocarcinoma (ICC) remains inadequate. Integrating CA19-9 with tumor volume offers a potentially viable strategy for improving prognostic accuracy. This study aimed to develop a prognostic model utilizing volume-adjusted CA19-9 (VACA) for ICC patients.
Patients and Methods
A retrospective analysis was conducted on data from 436 ICC patients. These patients from two centers were divided into the training (n = 291, Center 1) and validation (n = 145, Center 2) cohorts. Using the training cohort, univariate and multivariable Cox regression analyses were employed to identify clinicopathological characteristics significantly associated with overall survival (OS) and recurrence-free survival (RFS), which enabled the construction of prognostic nomograms both with and without VACA. The nomograms’ discriminatory and calibration abilities were assessed using receiver operating characteristic (ROC) curves, decision curve analysis (DCA) curves, and calibration curves, applying both training and validation cohorts.
Results
VACA emerged as an independent variable that significantly correlated with prognosis. The nomogram incorporating VACA demonstrated superior accuracy in predicting OS and RFS rates compared to the model without VACA. In the validation cohort, the nomogram with VACA yielded area under the ROC curve (AUC) values of 0.695 (95% CI = 0.597∼0.793) and 0.666 (95% CI = 0.559∼0.773) (1- year), 0.662 (95% CI = 0.518∼0.806) and 0.651 (95% CI = 0.446∼0.857) (3- years), and 0.701 (95% CI = 0.486∼0.916) and 0.703 (95% CI = 0.428∼0.978) (5- years) for OS and RFS, respectively, along with improved calibration and DCA curves.
Conclusions
VACA, formed by integrating tumor volume with CA19-9, exhibits promising prognostic capabilities. The nomogram incorporating data from two centers and utilizing VACA demonstrates robust prognostic performance and holds clinical utility.
Condensed abstract
Combining CA19-9 with tumor volume presents a potentially viable strategy for improving prognostic accuracy. The nomogram incorporating VACA demonstrates robust prognostic performance and holds clinical utility.
Keywords
Introduction
Intrahepatic cholangiocarcinoma (ICC) is a highly invasive malignant tumor originating from the epithelial cells of the bile duct. 1 The early progression of ICC is insidious, with approximately 70% of patients losing the opportunity for surgery by the time of presentation. 1 Despite advancements in systemic therapies, including targeted therapy and immunotherapy, the 5-year survival rate remains between 20% and 35%.1,2 Recent advancements, including the emergence of fibroblast growth factor receptor (FGFR) inhibitors and isocitrate dehydrogenase (IDH) inhibitors, have highlighted potential therapeutic pathways, but their application is restricted to specific patient subgroups.3,4 Thus, a robust prognostic evaluation system remains urgently needed to guide treatment decisions.
Carbohydrate antigen 19-9 (CA19-9) is expressed on the surface of tumors and is closely related to epithelial-mesenchymal transition (EMT). 5 In recent years, serum CA19-9 has been widely used in the diagnosis and prognosis assessment of digestive system tumors such as pancreatic cancer, cholangiocarcinoma, and gastric cancer. 6 In ICC, CA19-9 demonstrates good specificity, with values exceeding 1000 ng/mL being significantly associated with poor prognosis. However, at the lower cut-off value (37 ng/mL), the prognostic value of CA19-9 is considerably restricted. 7 This limitation suggests that the sensitivity of CA19-9 for predicting prognosis is insufficient, warranting further investigation into its prognostic potential.
Tumor volume is directly related to the tumor burden and reflects the biological activity of tumors. 8 As a classic prognostic indicator, tumor volume has significant prognostic value in various cancers.9,10 Importantly, the integration of tumor volume with other clinical indicators has been shown to effectively enhance prognostic predictive performance. 10 Previous studies have shown that patients with different statuses of total lesion glycolysis (TLG) and Kirsten rat sarcoma virus (KRAS) mutations can be effectively stratified by the combined correction of tumor volume. 11 Based on this, we hypothesize that the poor prognostic performance of CA19-9 may be attributed to its reduced sensitivity in cases with low tumor burden, possibly due to low CA19-9 expression levels. 12 Therefore, combining CA19-9 with tumor volume correction represents a feasible strategy for enhancing its prognostic utility.
In conclusion, this dual-center study aims to propose a novel prognostic indicator, Volume-Adjusted CA19-9 (VACA), by integrating CA19-9 with tumor volume. Using multivariate Cox regression analysis, we constructed a new prognostic model that combines VACA with various clinical prognostic indicators.
Material and Methods
Case Selection
A total of 752 patients diagnosed with intrahepatic cholangiocarcinoma (ICC) in Center 1 (Center 2) and Center 2 (Center 1) between January 2013 and January 2023 were included. The inclusion criteria were as follows: 1) Pathological confirmation of primary ICC; 2) Preoperative CA19-9 levels outside the normal range (>37 U/mL); 3) Radical surgical resection as the standard treatment, achieving R0 resection based on patient preference and preoperative conditions. Exclusion criteria encompassed: 1) Patients with a history of other malignancies, prior interventions, or liver transplantation; 2) Incomplete clinicopathological data. Given the long study period, patients received a variety of adjuvant therapy regimens, which were not standardized across all cases. Therefore, the effect of preoperative and postoperative therapy was not systematically analyzed.
This retrospective study adheres to the principles outlined in the Declaration of Helsinki and complies with good clinical practice guidelines. Approval was obtained from the Ethics Committee of the Affiliated Cancer Hospital of Chongqing University (ethical approval number: CQCH-LAE-20231020001), which waived the requirement for informed consent due to the retrospective nature of the study. All medical records and data accessed for the study were devoid of personal or identifying information.
Data Collection
Data collection was conducted by two independent researchers and encompassed clinicopathological information prior to adjuvant therapy, including gender, age, presence of hepatitis B status, hepatolithiasis, cirrhosis, morphologic type, tumor number, tumor size, differentiation, liver capsule invasion, perineural invasion, microvascular invasion (MVI), lymph node invasion, Tumor volume, and Serum CA19-9 levels.
Serum CA19-9 levels were measured using a chemiluminescent enzyme immunoassay, with the upper normal range set at 37 U/mL. As previously described, 10 tumor size and number were assessed by two radiologists using preoperative CT scans or MRI. For tumor volume calculation, radiologists selected the most representative imaging plane—coronal, sagittal, or axial—based on tumor morphology to measure the maximum tumor radius. To evaluate the interobserver reliability of these measurements, the intraclass correlation coefficient (InCC) was calculated. Excellent agreement was observed for tumor size (InCC [95% CI]: 0.82 [0.68, 0.91]) and tumor number (InCC [95% CI]: 0.93 [0.78, 0.97]), with all InCC values exceeding 0.75. These results confirm the reliability and reproducibility of the measurements used in this study. The tumor size and tumor number data used in this study were derived from the average values of measurements performed independently by two radiologists. The volume of measurable lesions was calculated using the formula: Tumor volume (cm³) = 4/3*π*(maximum radius)3. The total tumor volume was determined by summing the volumes of all measurable lesions. This study used data on total tumor volume and serum CA19-9 levels. A scatter plot with a linear regression smoothing curve was created to visualize the relationship, and Spearman’s rank correlation coefficient was used to assess the association between the two variables.
VACA was computed by dividing the serum CA19-9 value with the tumor volume. To determine the optimal cut-off value of VACA, we calculated receiver operating characteristic (ROC) curves for 1-, 3-, and 5-year overall survival (OS) and recurrence-free survival (RFS) using the training cohort. For each cut-off value, corresponding nomograms were constructed to predict OS and RFS. By comparing their predictive performance, we determined that the cut-off value obtained from the 3-year OS ROC curve yielded the best performance for the constructed nomograms, which was also supported by supplemental materials Figure S1. This optimal cut-off value was determined to be 0.520. In this study, the 3-year OS was utilized as the primary endpoint for subsequent analyses, as it provided the strongest correlation with VACA and robust predictive capabilities for both OS and RFS.
The initial outpatient review commenced 3 weeks post-treatment completion, with patient follow-up extending until January 2024 or death (recurrence). Follow-up intervals varied: from 0 to 2 years post-operation, follow-up occurred every 3 months, while from 3 to 5 years post-operation, follow-up was scheduled every 6 months. Recurrence-free survival (RFS) was defined as the duration from surgery to recurrence, or last follow-up, while OS was defined as the time from surgery to death or last follow-up.
Construction and Performance Evaluation of the Nomogram
Statistical analyses were conducted using SPSS 25.0 software (Chicago, IL, USA) and R software (version 4.3; https://www.r-project.org). Construction of the Nomogram: Utilizing data from the training cohort, univariate and multivariate Cox regression analyses were performed using SPSS and the R software packages “RMS,” “Foreign,” and “Survival” to calculate the Hazard Ratio (HR) and corresponding 95% confidence interval (CI) for prognostic factors. Independent prognostic factors were selected to construct the nomogram. Kaplan-Meier survival curves were generated to assess differences in each prognostic factor. Evaluation of Performance: ROC curves, Decision Curve Analysis (DCA) curves, and calibration curves were plotted using the R software packages “rms,” “foreign,” “survival,” “survivalROC,” “ggDCA,” and “timeROC” based on data from the training and validation cohorts. The area under the ROC curve (AUC) was calculated to assess discriminatory ability. DCA curves were utilized to evaluate the clinical utility and net benefit of the model, while calibration curves were used to assess agreement between actual and predicted outcomes. 13 The reporting of this study conforms to Transparent Reporting of a Multivariable Prediction Model for Individual Prognosis or Diagnosis (TRIPOD) guidelines. 14
Statistical Analysis
Continuous variables were presented as medians with interquartile ranges or ratios. Between-group comparisons of continuous variables were performed using the t-test or the Mann-Whitney U test for non-normally distributed variables. Categorical data were compared using the χ2 test or Fisher’s exact test. The Kaplan-Meier curve’s differences were assessed via the log-rank test. A two-side P-value <.05 was deemed statistically significant.
Result
Patient Data
Comparison of Clinicopathological Characteristics Between Training and Validation Cohort.

Note. Data were presented as number (percentage); MVI: microvascular invasion; CA19-9: carbohydrate antigen 19-9; VACA: volume-adjust-CA19-9; MF: mass-forming; IG: intraductal growth; PI: periductal infiltrating; AJCC: American Joint Committee on Cancer; IQR: interquartile range.
The scatter plot between predicted tumor volume and serum CA19-9 levels, presented in Supplemental Materials as Figure S2, demonstrated a positive correlation (P-value = .0036). Notably, smaller tumor volumes were associated with more concentrated, lower levels of CA19-9, suggesting that smaller tumors may not produce sufficient CA19-9 to reflect their true burden. This observation highlights the potential value of the Volume-adjusted CA19-9 (VACA) approach, the VACA could significantly enhance the applicability of CA19-9, especially in cases with low tumor abundance.
Univariate and Multivariate COX Regression Analysis
Identification of Prognostic Factors for Overall Survival and Recurrence-Free Survival in the Training Cohort.
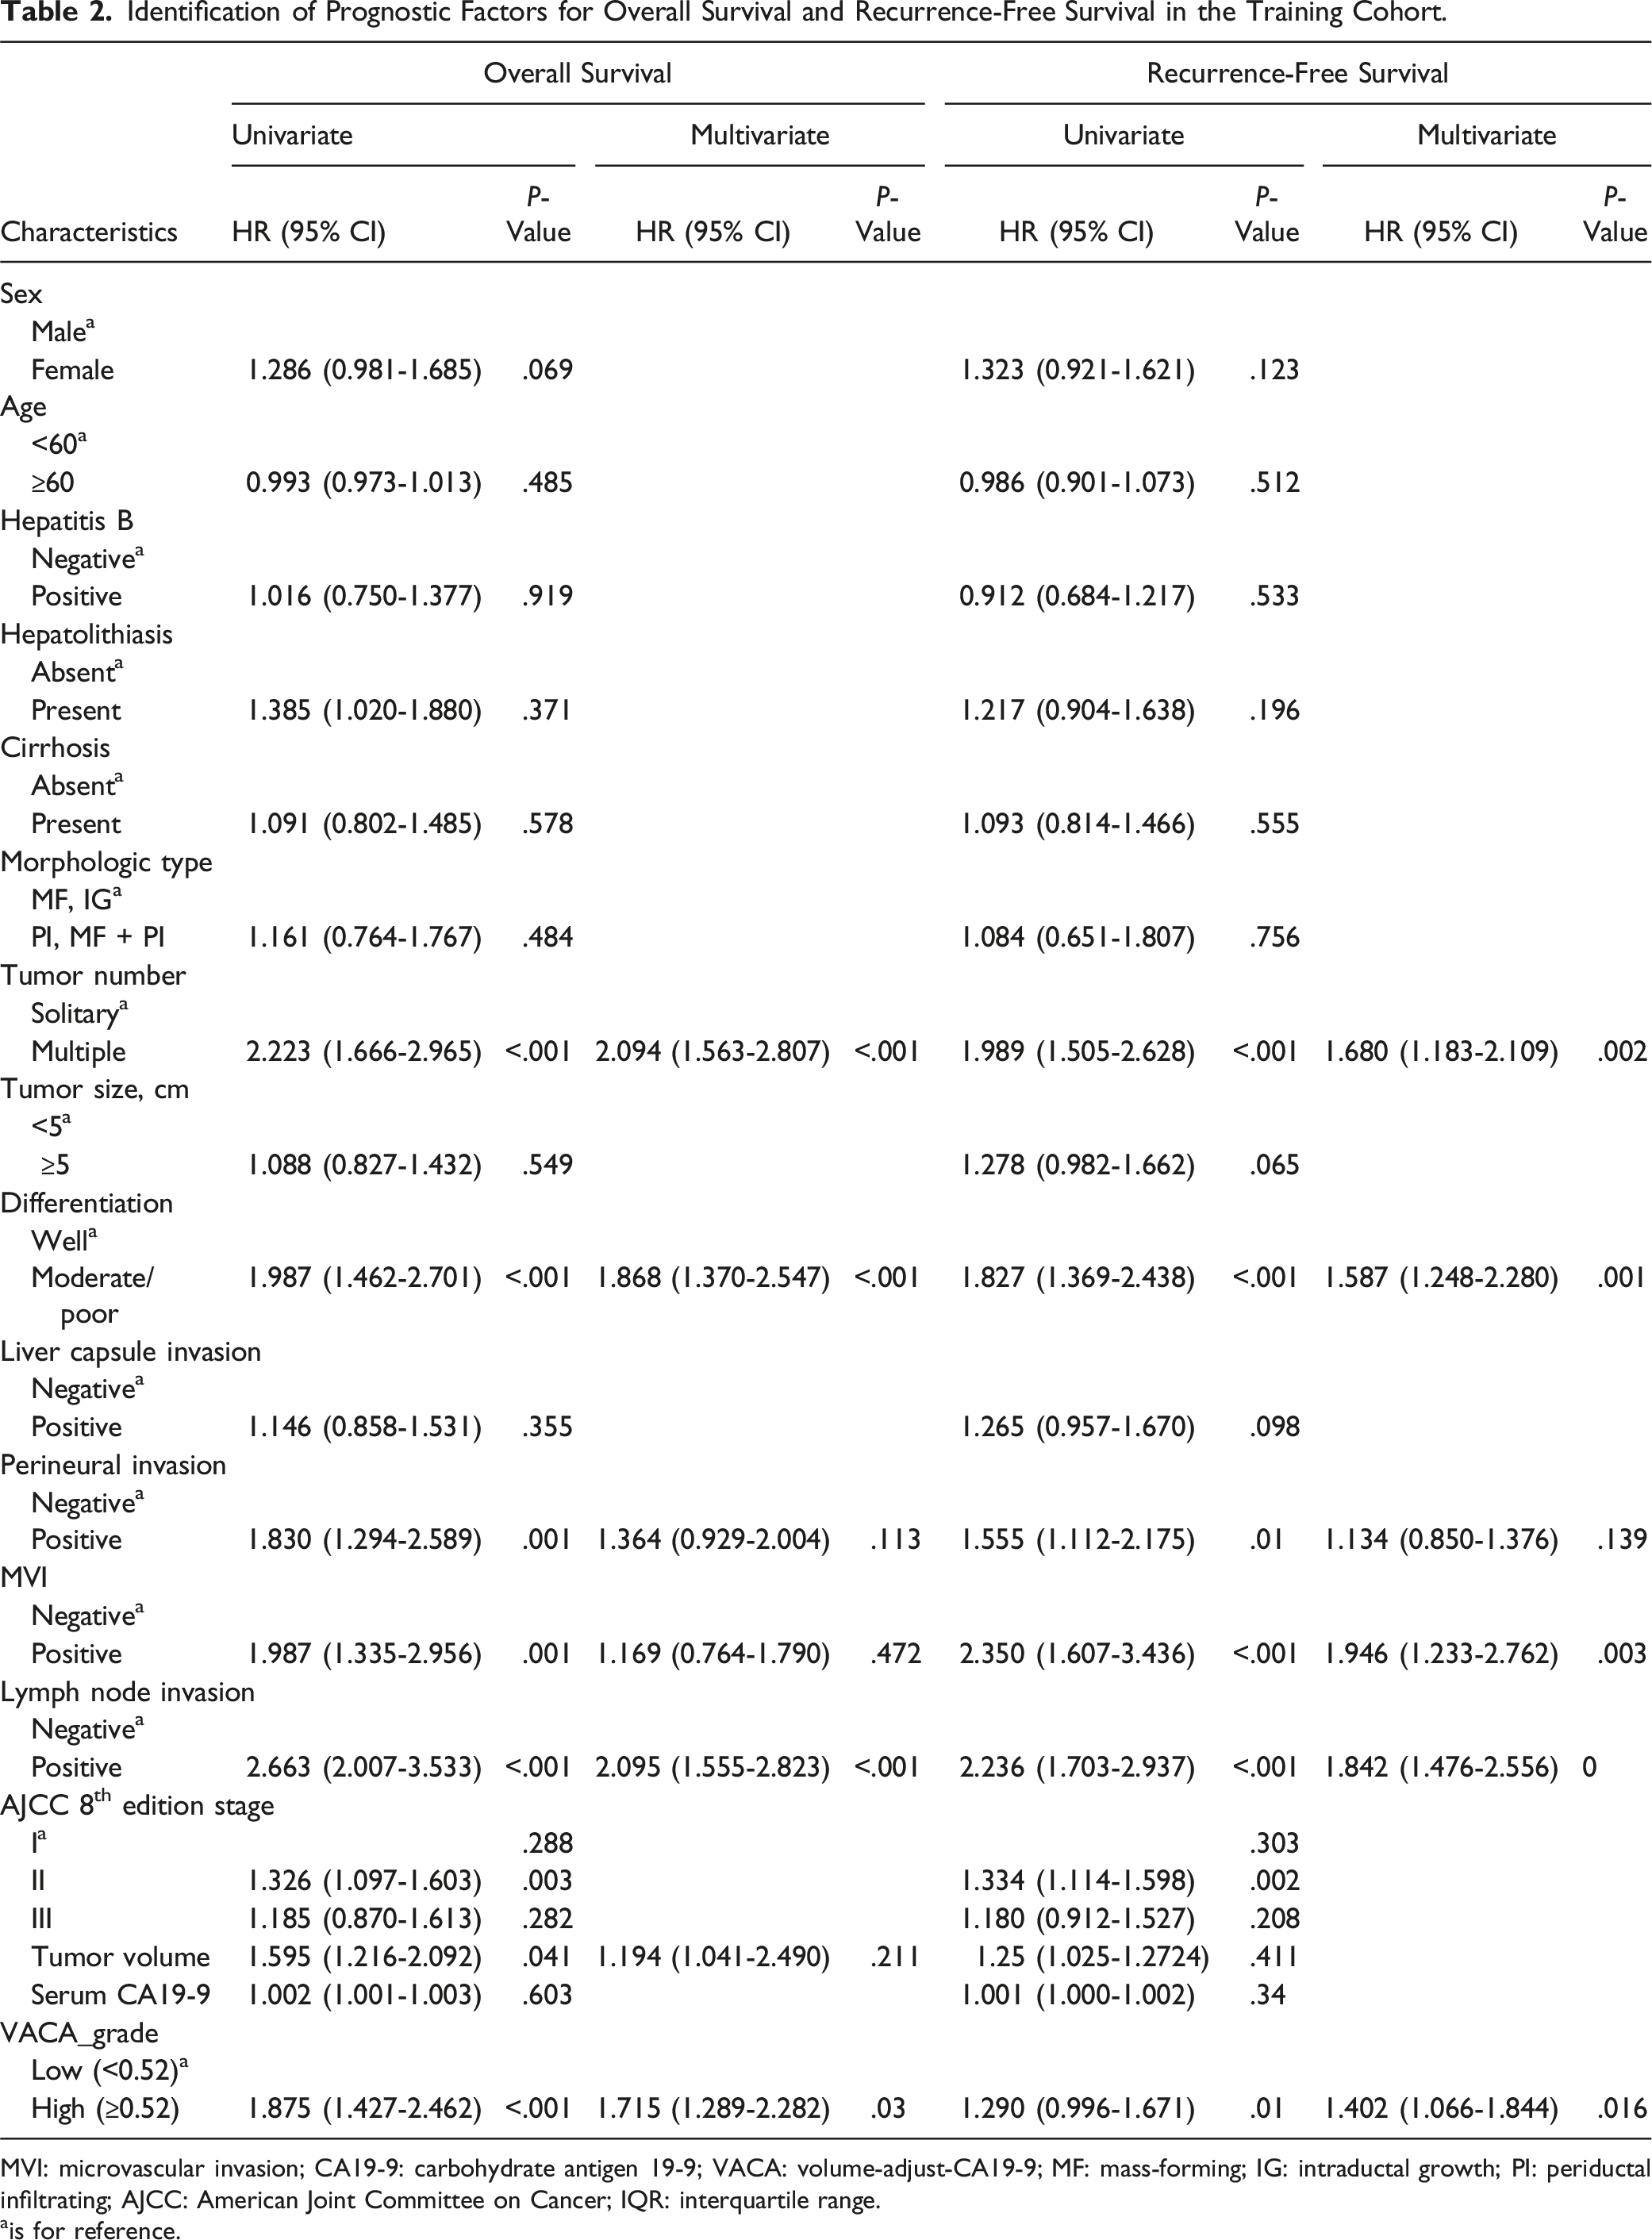
MVI: microvascular invasion; CA19-9: carbohydrate antigen 19-9; VACA: volume-adjust-CA19-9; MF: mass-forming; IG: intraductal growth; PI: periductal infiltrating; AJCC: American Joint Committee on Cancer; IQR: interquartile range.
ais for reference.
In the multivariate COX regression analysis results, Tumor number, Differentiation, Lymph node invasion and VACA grade are closely related to OS (P-value <.05). Tumor number, Differentiation, Lymph node invasion, MVI and VACA grade are closely related to RFS (P-value <.05). On the other hand, we found that Perineural invasion (Positive) and high tumor volume were correlated with poor prognosis, but did not reach statistical significance (P-value >.05).
Kaplan-Meier method is used to plot the survival curve of aforementioned prognostic factors, the differences are statistically significant (P-value <.05). Kaplan-Meier curves of patients with different clinicopathological features for OS in the training cohort, as shown in Figure 1 A-D. Kaplan-Meier curves for RFS in the training cohort, as shown in supplemental materials Figure S2A-E. Kaplan-Meier curves of patients with different clinicopathological features for overall survival (OS) in the training cohort, (A): volume-adjusted CA19-9 (VACA) grade; (B): Lymph node invasion; (C): Differentiation; (D): Tumor number. (E): The nomogram with VACA of predicting 1-, 3- and 5-year OS rate. (F): The nomogram without VACA of predicting 1-, 3- and 5-year OS rate.
Construction of Prognostic Nomogram
The nomogram included independent prognostic factors identified through multivariate Cox regression analysis. This model allows for the calculation of individual scores for each prognostic factor, which are then summed to obtain a total score. This nomogram with VACA for OS and RFS was visualized in Figure 1E and supplemental materials Figure S3F. To understand the impact of VACA on the prognostic model further, a nomogram without VACA was also constructed, utilizing other independent prognostic factors. This alternative model was presented in Figure 1F and supplemental materials Figure S3G.
Evaluation of Nomogram
The evaluation of the nomogram’s discrimination and calibration was conducted using data from the training and validation cohorts.
For evaluation of OS, the nomogram with VACA, the AUC values for predicting 1-year, 3-year, and 5-year OS were 0.782 (95% CI = 0.717∼0.847), 0.798 (95% CI = 0.732∼0.864), and 0.788 (95% CI = 0.686∼0.889) in the training cohort, respectively. Conversely, the AUC values for the nomogram without VACA were 0.728(95% CI = 0.657∼0.798), 0.768(95% CI = 0.699∼0.837) and 0.735 (95% CI = 0.628∼0.842) for the same time points, respectively. These results are depicted in Figure 2A and B. Receiver operating characteristic (ROC) curves of 1-, 3- and 5-year OS in the two cohorts predicted by nomogram, (A): The nomogram with VACA in the training cohort; (B): The nomogram without VACA in the training cohort; (C): The nomogram with VACA in the validation cohort; (D): The nomogram without VACA in the validation cohort. Calibration curves for the 1-, 3- and 5-year OS predicted by nomogram, (E-G): The nomogram with VACA in the training cohort, (H-J): The nomogram without VACA in the training cohort; (K-M): The nomogram with VACA in the validation cohort, (N-P): The nomogram without VACA in the validation cohort.
In the validation cohort, the AUC values for the nomogram with VACA predicting 1-year, 3-year, and 5-year OS were 0.695 (95% CI = 0.597∼0.793), 0.662 (95% CI = 0.518∼0.806) and 0.701 (95% CI = 0.486∼0.916), respectively. For the nomogram without VACA, the AUC values for the same time points were 0.571 (95% CI = 0.449∼0.692), 0.516 (95% CI = 0.362∼0.670) and 0.492 (95% CI = 0.375∼0.608), respectively, as shown in Figure 2C and D.
The calibration curves for 1-year, 3-year, and 5-year OS predicted by the nomograms with and without VACA in the training and validation cohort were illustrated in Figure 2E-J and K-P, respectively. These curves provide insights into how well our nomograms’ predicted probabilities align with the actual observed outcomes over time.
For evaluation of RFS, in the training cohort, the nomogram with VACA demonstrated AUC values of 0.737 (95% CI = 0.667∼0.807), 0.774 (95% CI = 0.700∼0.848) and 0.723 (95% CI = 0.610∼0.836) for predicting 1-year, 3-year, and 5-year RFS, respectively. On the other hand, the nomogram without VACA showed AUC values of 0.683 (95% CI = 0.613∼0.754), 0.707 (95% CI = 0.631∼0.784) and 0.682 (95% CI = 0.563∼0.801) for the same time points. These results were depicted in supplemental materials Figure S4A and B.
For the validation cohort, the nomogram with VACA exhibited AUC values of 0.666 (95% CI = 0.559∼0.773), 0.651 (95% CI = 0.446∼0.857) and 0.703 (95% CI = 0.428∼0.978) for predicting 1-year, 3-year, and 5-year RFS, while the nomogram without VACA had AUC values of 0.559(95% CI = 0.445∼0.672), 0.489(95% CI = 0.299∼0.678) and 0.601 (95% CI = 0.516∼0.686) for the respective time points. These findings were illustrated in supplemental materials Figure S4C and D.
The calibration curves representing the 1-year, 3-year, and 5-year RFS predictions by the nomograms with and without VACA in the training and validation cohort were presented in supplemental materials Figure S4E-J and K-P, respectively.
Comparison of Nomograms
Overall, across both training and validation cohorts, the nomogram with VACA consistently showed higher AUC values for predicting OS or RFS at 1-year, 3-year, and 5-year compared to the nomogram without VACA. Furthermore, the calibration curve of the nomogram with VACA demonstrated better alignment with the 45° ideal oblique line, indicating improved consistency between predicted outcomes and actual results. The DCA curve indicated that the nomogram with VACA provided a larger positive net benefit across a wider range of the risks, reflecting its strong clinical practicability and potential utility in decision-making processes. The details of these DCA curves for OS and RFS can be found in Figure 3 and supplemental materials Figure S5, respectively. Decision curve analysis (DCA) curves of 1-, 3- and 5-year OS in the two cohorts predicted by nomogram. (A): The nomogram with VACA in the training cohort; (B): The nomogram without VACA in the training cohort; (C): The nomogram with VACA in the validation cohort, (D): The nomogram without VACA in the validation cohort.
Discussion
The aggressive nature of ICC underscores the critical need for identifying patients at high risk of poor outcomes and tailoring their treatment accordingly. In our dual-center research, we endeavored to address this challenge by introducing a novel prognostic metric: VACA. This innovative indicator integrates two readily accessible clinical parameters, offering a promising avenue for prognostic refining. Complementing this, our predictive models for OS and RFS were constructed with a comprehensive set of variables including VACA, tumor number, differentiation, lymph node invasion, and MVI, culminating in enhanced predictive accuracy. Validation of the nomogram with VACA revealed robust discriminative performance, as evidenced by ROC values ranging from 0.728 to 0.768 for 1, 3, and 5-year OS, and 0.682 to 0.707 for RFS. By leveraging VACA and our comprehensive nomogram, clinicians can make informed decisions tailored to individual patient profiles, thereby maximizing clinical outcomes.
CA19-9 is believed to play a crucial role in tumor metastasis by mediating the expression of E-selectin, with elevated serum levels confirmed in several malignant tumors. 15 Of the studies relating to prognostic implications in CC, 3 groups have demonstrated a significant difference in survival when a high cut-off level (>1000 ng/mL, 16 >100 ng/mL17,18) is used to compare groups. The predictive prognostic ability of CA19-9 is associated with its critical value, with studies showing no significant correlation with survival rates at lower critical values (>37 ng/mL).19,20 Factors such as benign diseases like biliary obstruction can also lead to elevated CA19-9 levels, contributing to the lack of sensitivity of CA19-9. 21 Tumor volume is directly linked to tumor activity, and using tumor volume to develop tumor burden and various combined indicators as excellent prognostic markers has been validated.22,23 Previous studies have shown that prognostic prediction based on total tumor volume (TTV) outperforms classic staging systems, indicating the beneficial calibration effect of tumor volume. 10 Therefore, our study innovatively applied tumor volume-adjusted CA19-9 as an independent prognostic factor and combined it with other clinicopathological features to construct nomograms. Compared to the nomogram without VACA, the nomogram with VACA in the validation cohort exhibited an AUC increase of 0.124-0.209 for 1, 3, and 5-year OS and 0.102-0.162 for RFS. Consistently, the nomogram with VACA also achieved superior decision curve analysis (DCA) and calibration curves, indicating the significant prognostic predictive capability of VACA.
Of note, as research continuously seeks novel prognostic biomarkers, there is often a tendency to overlook the potential of classical tumor indicators such as CA19-9. 5 These traditional indicators are part of routine clinical assessments, requiring no additional economic burden and thus can be quickly adopted into clinical practice.5,12 In this study, we also explored the direct correlation between tumor size and CA19-9 levels. Our analysis revealed a positive correlation between tumor volume and CA19-9 levels. This finding suggests that smaller tumors may not produce sufficient CA19-9 to fully reflect their actual burden.19,20 The VACA method could significantly enhance the applicability of CA19-9, especially in cases with smaller tumors. While this observation aligns with the hypothesis that smaller tumors may not produce sufficient CA19-9 to fully reflect their burden, we recognize that this remains an area for further research. 16 Leveraging these established parameters in innovative ways, as exemplified by our study, is both cost-effective and practical for widespread implementation. In terms of future directions, this study lays the groundwork for exploring molecular mechanisms underlying the interaction between tumor burden and biomarker CA19-9’s expression. We anticipate advancements in imaging techniques and computational tools to further refine tumor volume assessments, leading to more precise prognostic modeling and individualized treatment approaches.
The increase in tumor number signifies more satellite nodules or intrahepatic metastases, which are significantly associated with poor prognosis. 24 Moreover, previous research has consistently shown that lower tumor differentiation and the presence of lymph node invasion (+) are linked to higher recurrence rates and poorer prognosis.25,26 These factors, consistent with our study results, serve as classical prognostic indicators and are related risk factors for OS and RFS in our prognostic model. MVI plays a critical role as a risk factor for poor prognosis in ICC, with MVI present within blood vessels containing cancer cell nests acting as seeds for metastasis, predominantly located near the hepatic veins and portal veins in the vicinity of the tumor.27,28 Previous studies have indicated that MVI is a significant adverse prognostic factor for ICC. 29 In this study, MVI is useful for predicting RFS, although it did not reach statistical significance in the Cox multivariate analysis for OS. In previous studies on the prognosis of ICC, there have also been inconsistent conclusions regarding the significance of MVI for OS and RFS. 30 We believe that this may be due to bias caused by different data sources.
This study has several limitations that warrant consideration. Firstly, the retrospective study design may introduce selection bias, despite efforts to ensure data quality and consistency. Additionally, this study covers a long period during which patients received diverse, non-standardized pre- and postoperative treatments. In future research, our team will further explore the impact of these treatments on the prognostic value of VACA. Secondly, this study only enrolled patients with abnormal CA19-9 levels, excluding those with normal CA19-9, which may limit the generalizability of the findings. Moreover, the selection of CA19-9 cut-off values may affect the accuracy of prognostic predictions, as different thresholds have varying implications across clinical contexts. Thirdly, while this study included data from two hospitals in East Asia, external validation in geographically diverse populations remains necessary to confirm the robustness of the proposed model. Fourthly, although VACA demonstrates significant prognostic value, its underlying biological mechanisms remain unclear and require further exploration through molecular studies. Lastly, our study primarily used classical and easily accessible clinicopathological features, without comparison to established staging systems or inclusion of novel biomarkers that may further enhance predictive performance.
Conclusions
In conclusion, based on CA19-9 and tumor volume, this dual-center research has established a novel prognostic indicator, VACA, which demonstrated promising predictive value in ICC patients. Incorporating tumor number, tumor differentiation, lymph node status, and MVI to predict OS and RFS, this novel index achieved enhanced predictive performance. This approach provides valuable clinical insights for screening high-risk ICC patients and guiding postoperative treatment decisions. However, further in-depth research is needed to further validate the prognostic significance of VACA and explore the underlying molecular mechanisms.
Supplemental Material
Supplemental Material - Developing a Prognostic Model for Intrahepatic Cholangiocarcinoma Patients With Elevated Preoperative Carbohydrate Antigen 19-9 Levels: Volume-Adjusted CA19-9 (VACA) as a Novel Biomarker
Supplemental Material for Developing a Prognostic Model for Intrahepatic Cholangiocarcinoma Patients With Elevated Preoperative Carbohydrate Antigen 19-9 Levels: Volume-Adjusted CA19-9 (VACA) as a Novel Biomarker by Bo Liu, Sheng Wang, Tao Wen, Haizhou Qiu, Lei Xiang, Zuotian Huang, Hong Wu, Dewei Li, and Hui Li in Cancer Control
Footnotes
Acknowledgments
Authors’ Contributions
All authors made a significant contribution to the work reported, whether that is in the conception, study design, execution, acquisition of data, analysis and interpretation, or in all these areas; took part in drafting, revising or critically reviewing the article; gave final approval of the version to be published; have agreed on the journal to which the article has been submitted; and agree to be accountable for all aspects of the work.
Declaration of Conflicting Interests
The author(s) declared no potential conflicts of interest with respect to the research, authorship, and/or publication of this article.
Funding
The author(s) disclosed receipt of the following financial support for the research, authorship, and/or publication of this article: This work was supported by grants from the National Natural Science Foundation of China (82203823), the China Postdoctoral Science Foundation (2023M730436, 2022TQ0393), the Chongqing Postdoctoral Science Foundation (2022CQBSHTB2029), and the Natural Science Foundation of Chongqing (CSTB2022NSCQ-MSX0477, CSTB2022NSCQ-MSX1174, CSTB2024NSCQ-QCXMX0051).
Ethical Statement
Supplemental Material
Supplemental material for this article is available online.
Appendix
References
Supplementary Material
Please find the following supplemental material available below.
For Open Access articles published under a Creative Commons License, all supplemental material carries the same license as the article it is associated with.
For non-Open Access articles published, all supplemental material carries a non-exclusive license, and permission requests for re-use of supplemental material or any part of supplemental material shall be sent directly to the copyright owner as specified in the copyright notice associated with the article.