
Abstract
Dynamic contrast enhancement (DCE) imaging is a valuable sequence of multiparametric magnetic resonance imaging (mpMRI). A DCE sequence enhances the vasculature and complements T2-weighted (T2W) and Diffusion-weighted imaging (DWI), allowing early detection of prostate cancer. However, DCE assessment has remained primarily qualitative. The study proposes quantifying DCE characteristics (T1W sequences) using six time-dependent metrics computed on feature transformations (306 radiomic features) of abnormal image regions observed over time. We applied our methodology to prostate cancer patients with the DCE MRI images (n = 25) who underwent prostatectomy with confirmed pathological assessment of the disease using Gleason Score. Regions of abnormality were assessed on the T2W MRI, guided using the whole mount pathology. Preliminary analysis finds over six temporal DCE imaging features obtained on different transformations on the imaging regions showed significant differences compared to the indolent counterpart (P ≤ 0.05, q ≤ 0.01). We find classifier models using logistic regression formed on DCE features after feature-based transformation (Centre of Mass) had an AUC of 0.89-0.94. While using mean feature-based transformation, the AUC was in the range of 0.71-0.76, estimated using the 0.632 bootstrap cross-validation method and after applying sample balancing using the synthetic minority oversampling technique (SMOTE). Our study finds, radiomic transformation of DCE images (T1 sequences) provides better signal standardization. Their temporal characteristics allow improved discrimination of aggressive disease.
Plain Language Summary
A DCE sequence enhances the vasculature and complements T2-weighted (T2W) and Diffusion-weighted imaging (DWI), allowing early detection of prostate cancer. However, DCE assessment has remained primarily qualitative. The study proposes quantifying DCE characteristics (T1W sequences) using six time-dependent metrics computed on radiomic feature transformations (306 radiomic features) of abnormal image regions observed over time. These characteristics discriminate against aggressive prostate disease.
Introduction
Prostate cancer is one of the most commonly diagnosed non-cutaneous cancers in men in the US and the second highest cause of cancer-related deaths. 1 While Prostate-Specific Antigen (PSA) has aided in the early detection of prostate cancers, it has also led to over-detection and over-treatment of the disease. 2 Multiparametric magnetic resonance imaging (mpMRI) has emerged as an essential tool for cancer detection, localization, and characterization of the prostate gland.3-5 It provides information about tumor physiology by combining functional mechanisms to describe cellular information (diffusion-weighted imaging, DWI), microvascular perfusion (dynamic contrast enhancement, DCE), and tumor morphology (T2 weighted image, T2W). 6
Prostate MR imaging is visually evaluated by a clinical radiologist following the guidelines of PI-RADS (Prostate Imaging-Reporting and Data System) to provide a risk assessment of an abnormality. 7 However, there are still limitations in the diagnostic accuracy of mpMRI. The positive predictive value (PPV) of mpMRI is low at 65%, which can result in unnecessary biopsies. 4 Additionally, mpMRI reportedly missed 12% of clinically significant prostate cancer. 4 Current clinical assessment with PI-RADS considers DCE-MRI as an optional sequence that is qualitatively assessed based on the presence or absence of signal, leaving room for development of quantitative methods to improve disease detection and diagnosis.7,8 There has been studies utilizing transfer function based models (Ktrans ) on DCE MRI shown to be highly correlated to high grade cancers, despite the difficulty in identifying arterial input functions.9,10
We aim to improve the reliability of DCE-MRI through the quantification of the T1W (DCE) sequences. DCE-MRI relies on T1-weighted (T1W) fast gradient echo images of the prostate obtained before, during, and after the rapid intravenous injection of a gadolinium (Gd) based contrast agent. 3 This technique measures the perfusion dynamics of the contrast, which can reveal tumor angiogenesis. 11 The dynamics of Gd contrast uptake and washout across the tissue regions are known to identify abnormal areas from their normal counterparts. 3 Currently, there is patient level variation in contrast uptake, and DCE-MRI relies on qualitative interpretation by the radiologist, which has led to large inter-reader variability. 12
Quantitative imaging metrics, popularly referred to as radiomics, involve transforming voxels and analyzing quantitative features in medical images. This technique has emerged as a method to describe abnormal regions and provides prognostic values to diagnosis and outcome.13,14 Texture metrics can describe tumor heterogeneity by distributing and interconnecting the levels of pixels or grayscale voxels in an image through quantitative mathematical descriptors, e.g., histograms, wavelets, etc.15-17 However, the reproducibility of these metrics in the presence of various human and technological variables (scanner settings, reconstruction, etc.) would need feature validation using repeated imaging (coffee break) type experiments; studies have shown utility in validating quantitative metrics.18,19
In this study, we focused on using DCE (T1W) sequences to quantify time-dependent patterns on transformed image regions and identify characteristics for an aggressive phenotype. Our goal is to create objective measure that is quantitative and reproducible across readers. The study uses quantitative DCE characteristics after transforming T1W sequences across time and using the time-dependent metrics to build predictors to discriminate clinically aggressive grade prostate cancer. We used whole-mount pathology as a ground truth to identify aggressive prostate grades, especially Gleason score.
Material and Methods
Data Cohort and MRI Acquisition
Patient Cohort.

Prostate Gland and Lesion Delineation
Prostate glandular anatomy and zonal structure (peripheral zone, PZ) were manually delineated by our research/clinical radiologists (JQ, JC) using research PACS tools (MIM Software Inc., Cleveland, OH, USA). Abnormal lesion regions identified by the pathologist on the whole-mount sections were used as a reference to manually co-registered to identify matching region on the MR T2W image and digitally marked across the slices (in 3D). These regions’ delineations were recorded in RT (radiation therapy) format and stored on our research PACS. The study cohort had 25 subjects with 49 lesions, and a pathologist provided the Gleason scores of these subjects based on whole mount sections. We illustrate an example case (see Figure 1) with T2W MRI (2D slice) with corresponding matching whole mount section markings. Patients MRI and corresponding pathology. (A) MRI-T2W image (2d slice) with zonal annotations, cyan: PZ; yellow: lesion. (B) Whole mount section of histopathology with lesion marking (C) flow diagram that describes the process steps in the proposed study.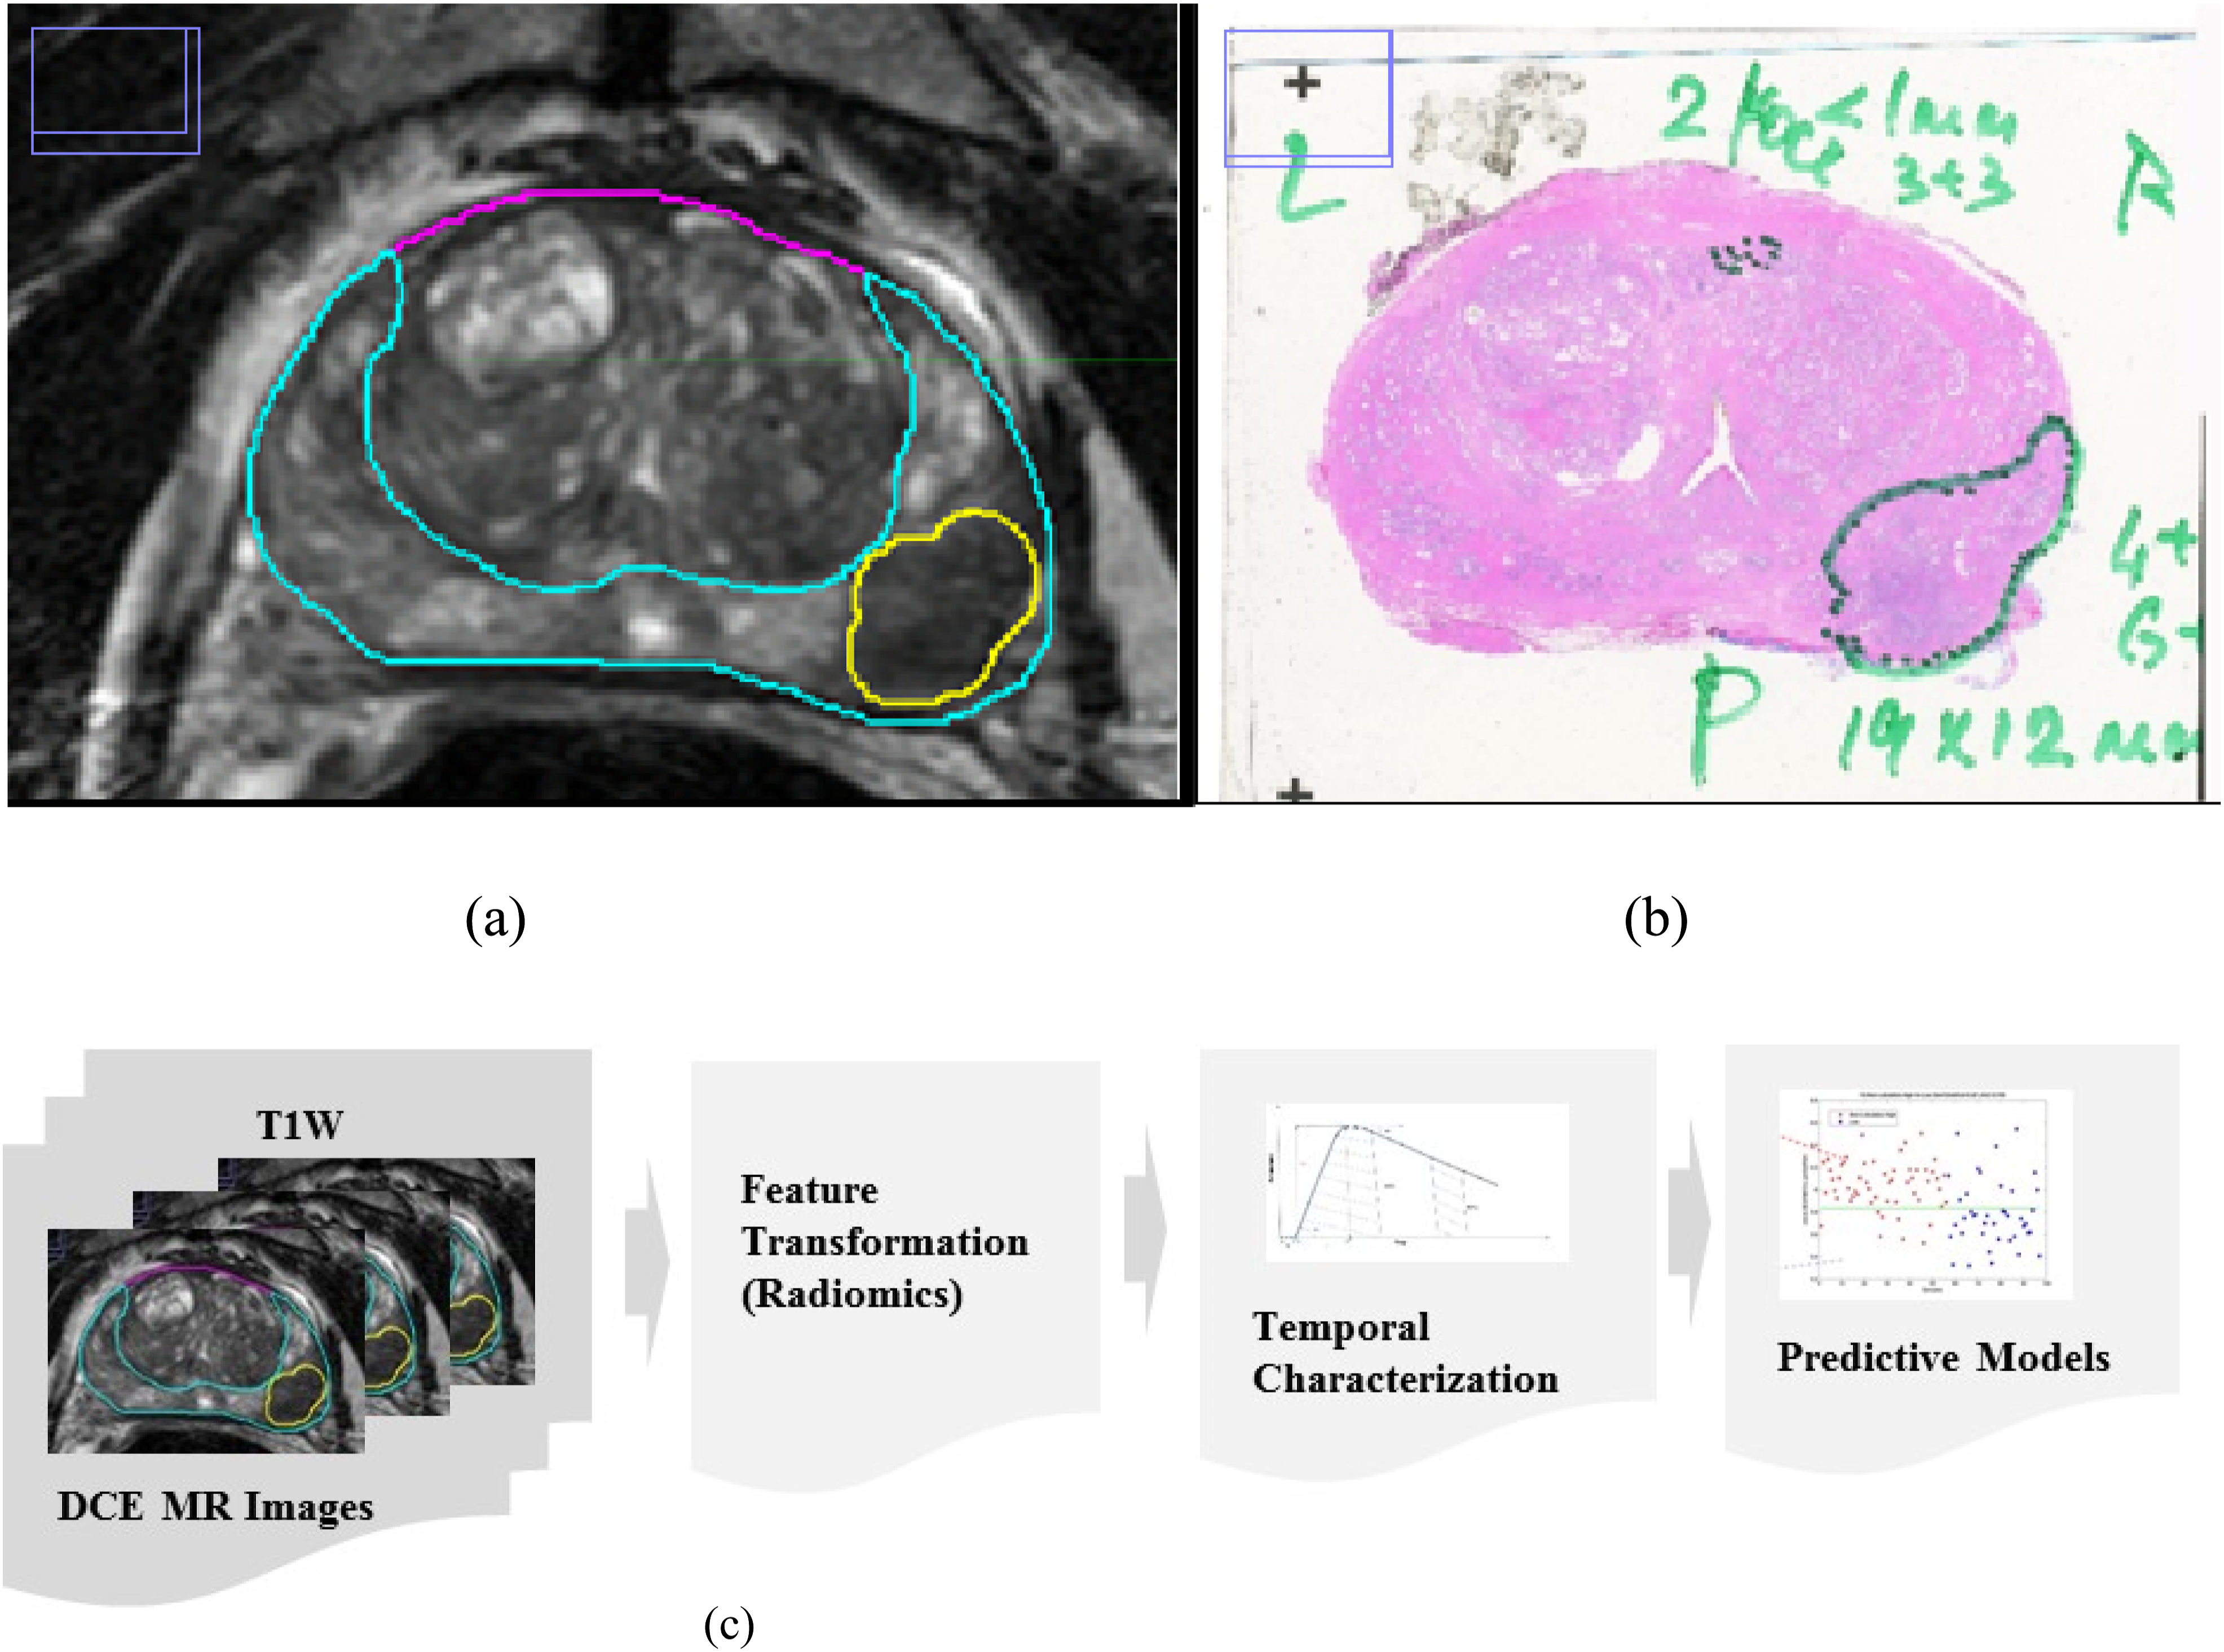
Preprocessing of Image Data
The prostate MR-image data (T2W, DCE, T1-series) was downloaded along with the RT structures from the research PACS for offline processing. The image data was visualized for any discrepancy before processing. We verified the orientation of the annotation images to be in the patient coordinate system and the necessary transformations applied (PATIENT coordinate system from the Gantry coordinate system), which is based on the information in the Image Orientation tag (0020,0037) and the Image Position tag (0020,0032). The above procedure was implemented using our in-house software, which is written in MATLAB (version R2023a; MathWorks, Natick, MA, United States) that has been previously reported.13,17,19
Image data registration between MR sequences (T2W, ADC, DCE) was carried out to align the volumes to the T2W reference. This procedure was implemented to remove misalignments due to voluntary and involuntary patient motions (including breathing and heart beating), as well as discrepancies in various imaging protocols. We applied intensity-based image registration by using “imregister” function in Matlab. This function was configured to “multimodal” in order to register images collected from different MR sequences, i.e. T2W, DCE and ADC. The registration procedure optimizes the image similarity metric. The method for optimizing the similarity metric was the Regular Step Gradient Descent, with the growth factor of 1.05, and the maximum iteration of 100. The number of pyramid levels for the registration process was set to 2, and the geometric transformation method applied to the images was “affine”. Figure 2 shows an example of a DCE sequence registered to T2 images. An example of the DCE registered to T2. 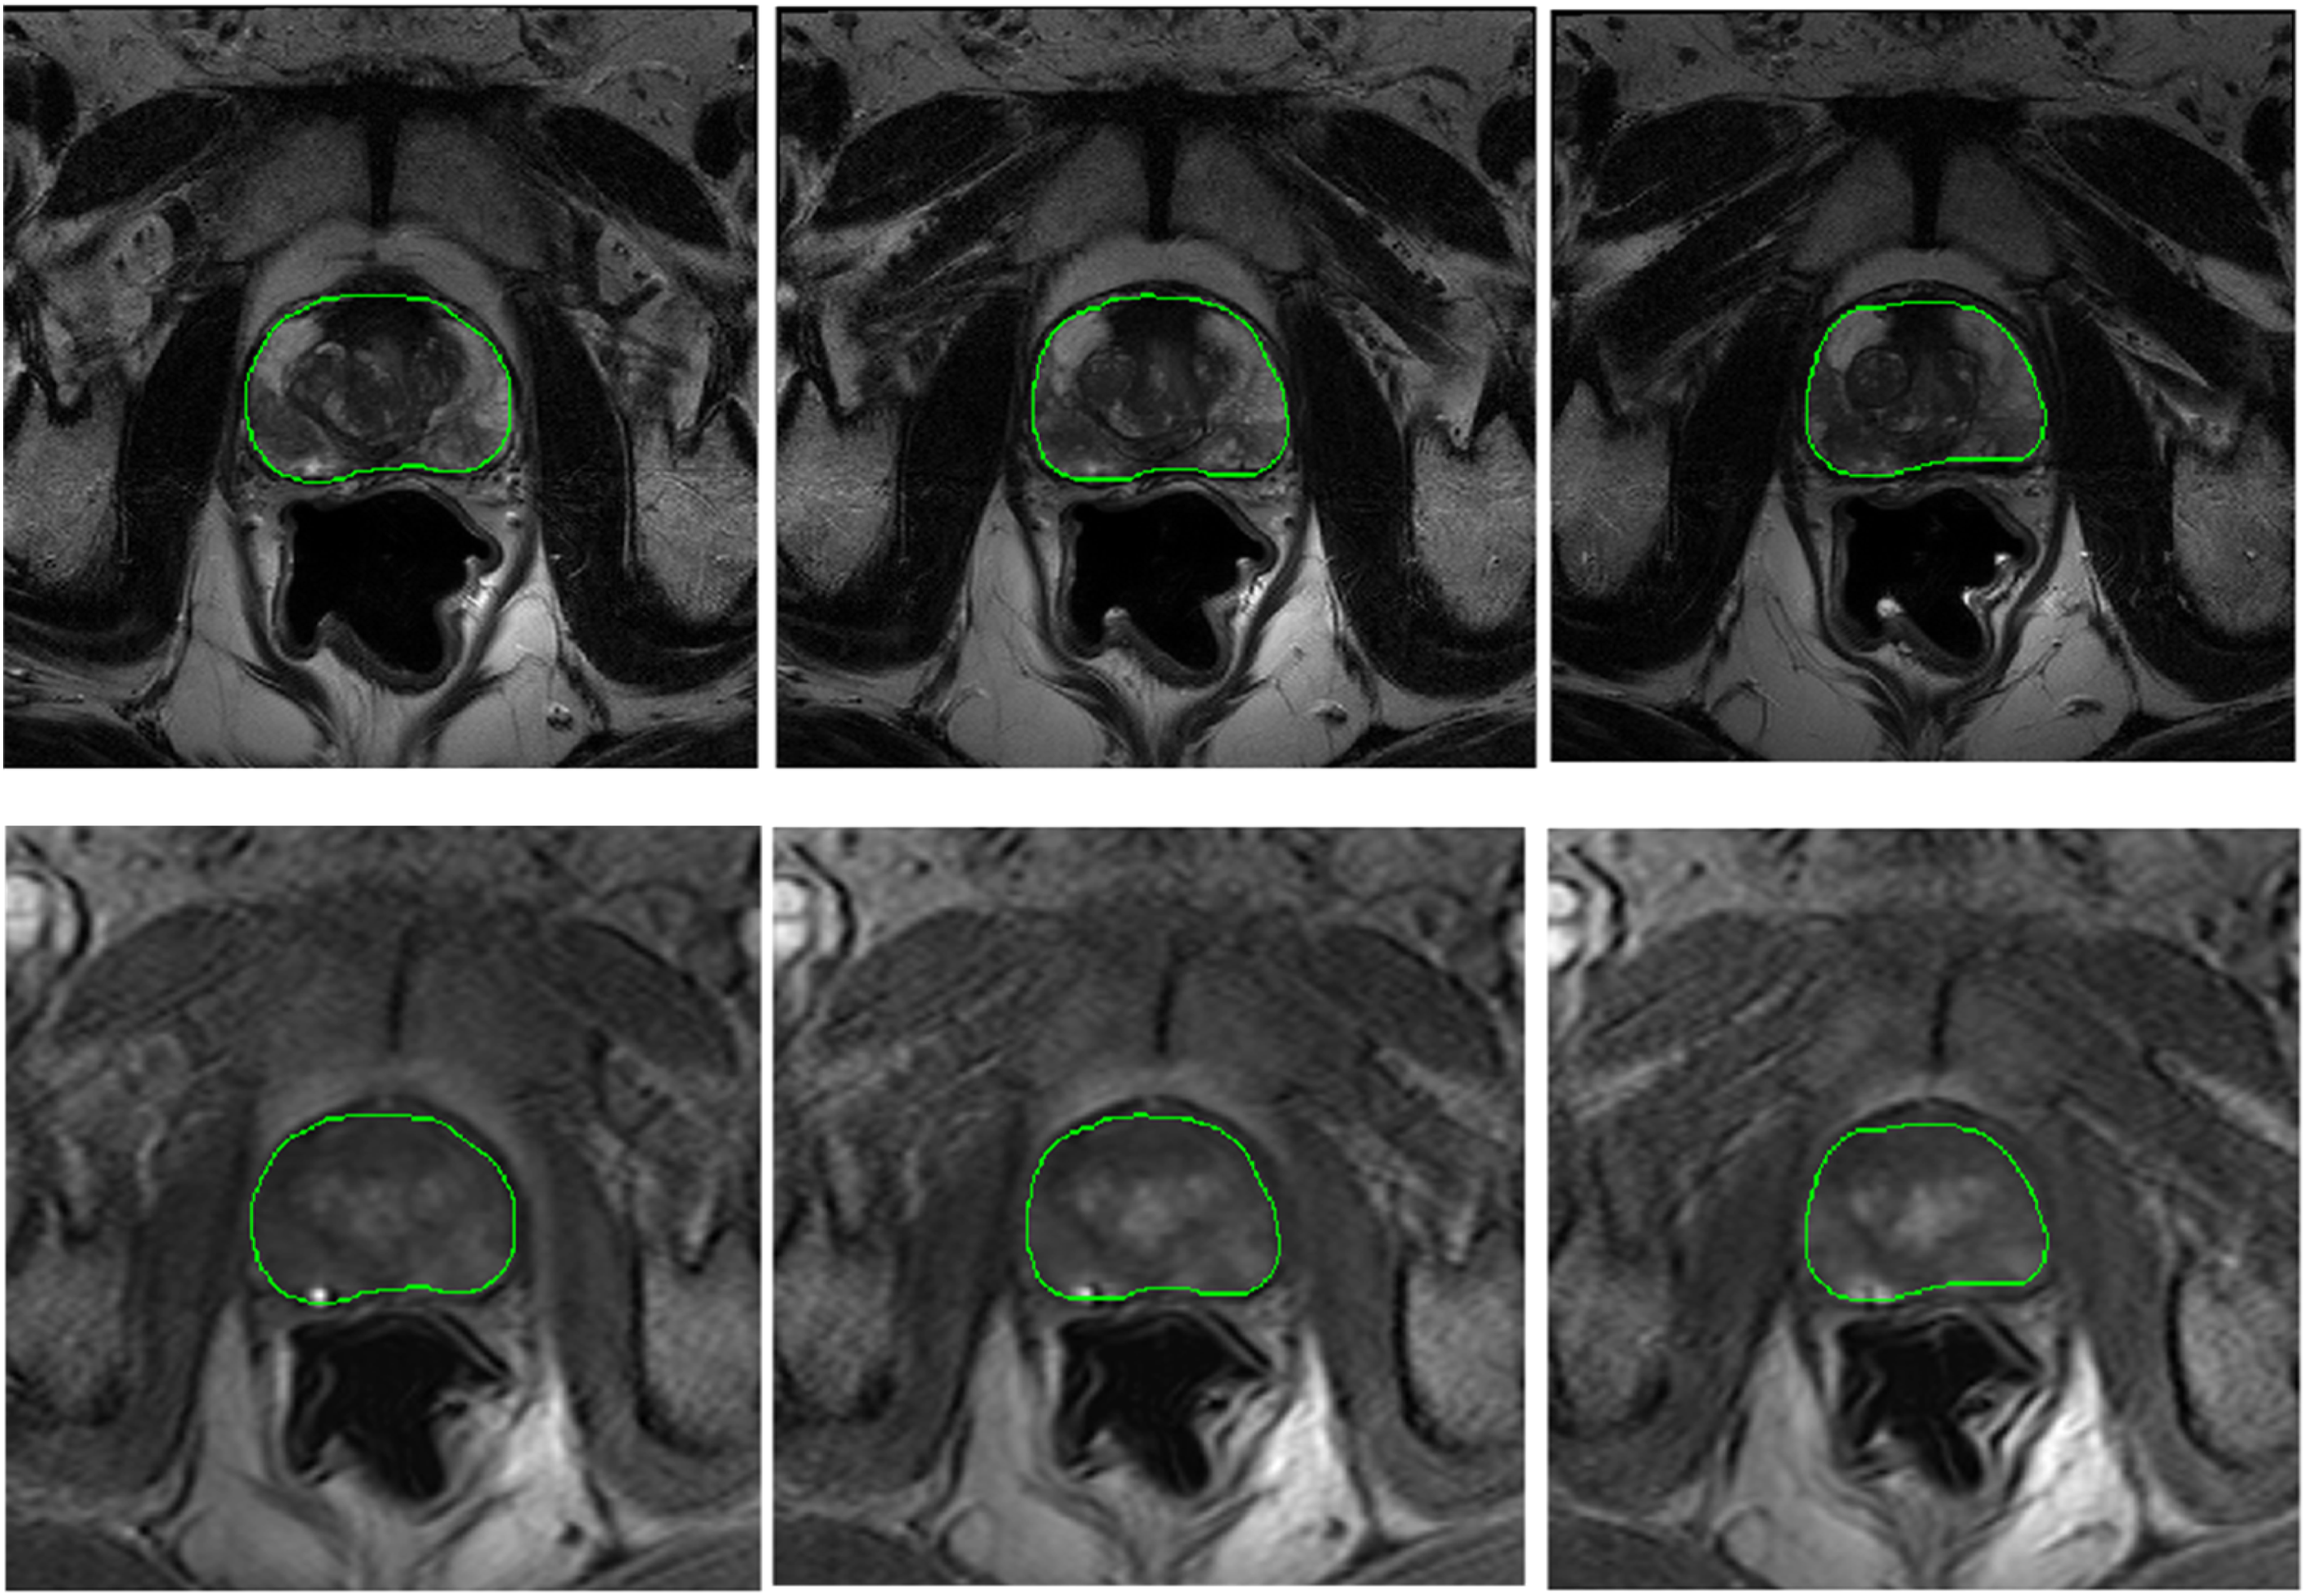
Feature Extraction on MRI Sequences
We computed radiomic features (306) on the abnormal regions on the T1- sequence of DCE MRI, repeated at each of the individual time points. We used an inhouse radiomic feature tool to describe the abnormal regions. Our study radiologist initially marked the abnormality on the T2W sequence, which was transferred to the T1w series across time after co-registration.
The radiomics feature tool used in the study followed the recommendation of The Image Biomarker Standardization Initiative (IBSI) and found be in compliance with others tool boxes in the field, including open source package.
20
Our toolbox extracted 306 quantitative features spanning three major categories (size, shape and texture); additionally, the entropy metric was computed on the region of interest. The time activity profile of contrast update in DCE imaging across time was approximated by a biexponential model.
21
We extracted 306 features on the regions of interest at each DCE (T1w) sequence. This process effectively transformed the native voxel into the feature space tracked across time. The time activity of the region was approximated using a bi-exponential function, and the time activity curve was quantified using six features
The example shows the time activity of transformed features with corresponding biexponential approximation (see Figure 3). We computed six features on the activity of the transformed features across time: a) peak enhancement sp = sm - s0, (S
p
), b) time to peak (τ), c) wash-in slope (w
i
), d) wash-out slope, wo. wash-in slope wi = sp/tau. In addition, we computed the area under the DCE curve between a time interval (at initial and final interval), namely: AUCt1-t2 is the area under the biexponential fitted DCE curve between time t1 and t2. AUCi = AUCt0-(t0+30) measures the early wash-in uptake curve, and AUCf = AUC(t0+240)-(t0+270) measures the late washout curve (see Figure 3a-c). Characterization of dynamic contrast enhancement (DCE) curve across time, a) description of parameters to model time activity curve description b) Bi-exponential fitted DCE curve on patient data (using Mean transformation feature), and c) description of features extracted on DCE curves.
Comparative Predictors using MRI-ADC
The region of abnormalities was initially marked on the T2W sequence; these annotations were translated to ADC maps and stored on our research PACS as a RT-formatted file. The image sequence, along with RT map, was used to extract imaging features related to first order statistics (mean, median deviation, kurtosis, coefficient of variation) on the regions of abnormality. The features were assembled for form univariate predictors using logistic regression model related to aggressive cancer stages. These metrics were used to compare with the DCE temporal feature performance.
Statistical Analysis
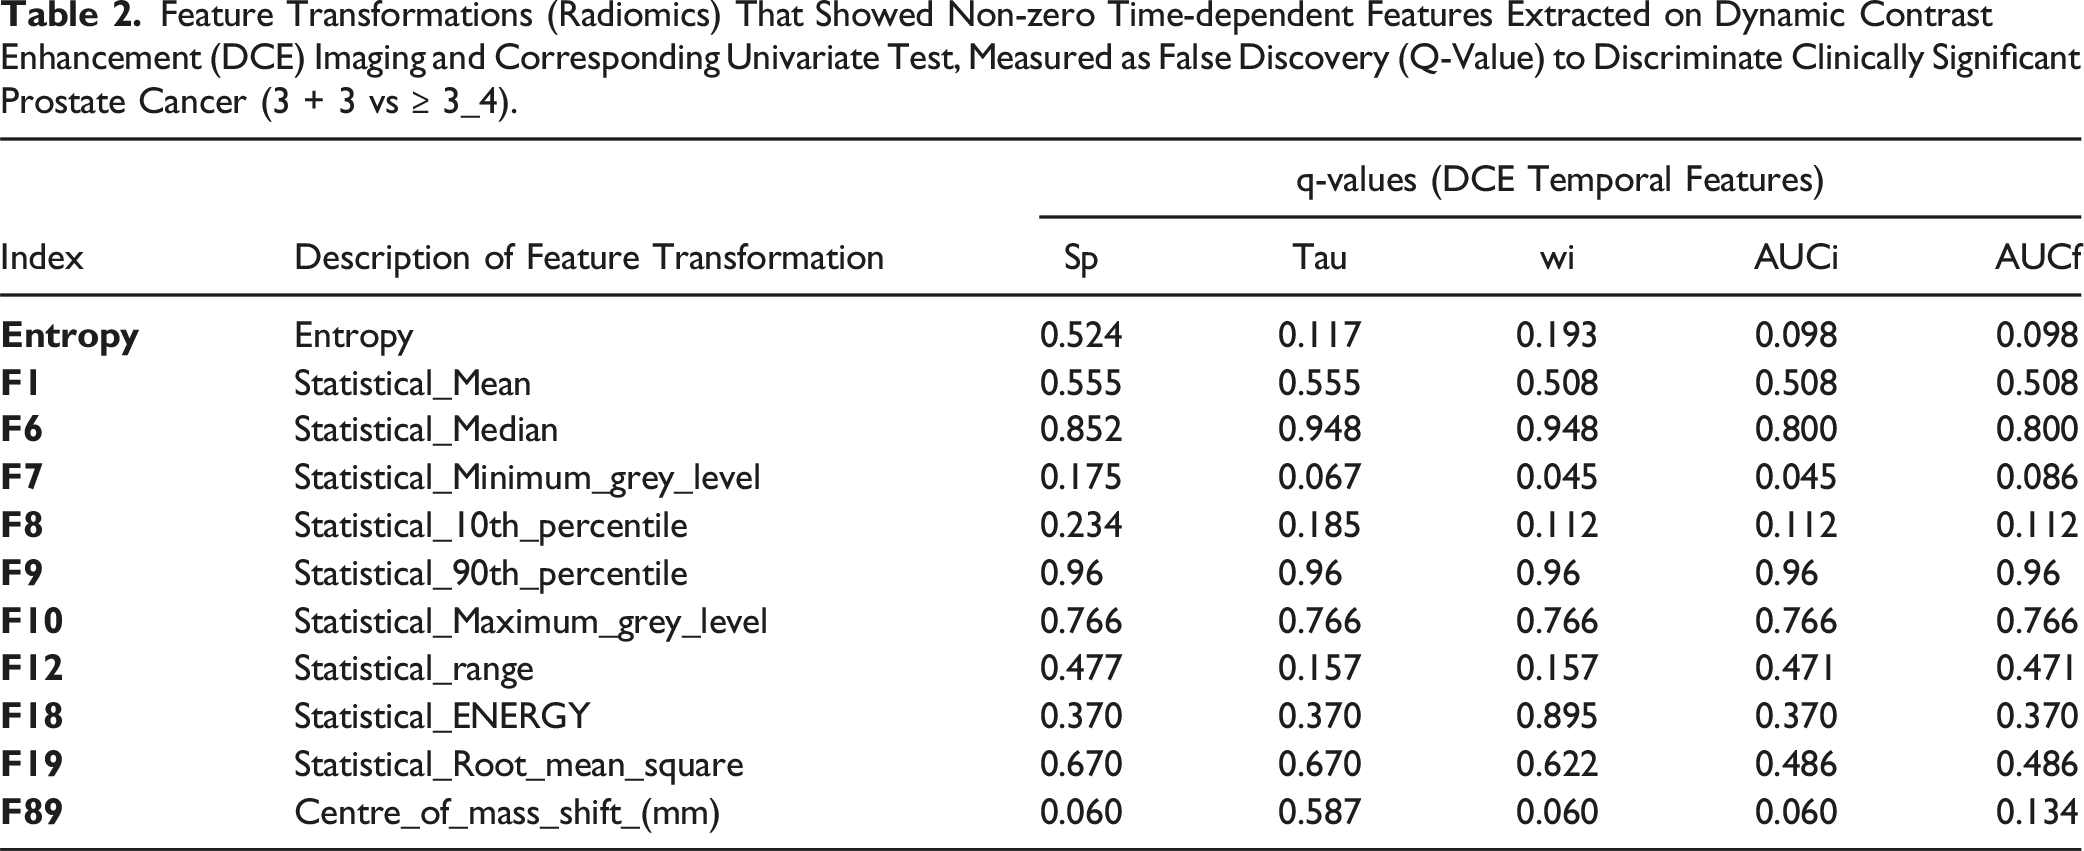
Feature Transformations (Radiomics) That Showed Non-zero Time-dependent Features Extracted on Dynamic Contrast Enhancement (DCE) Imaging and Corresponding Univariate Test, Measured as False Discovery (Q-Value) to Discriminate Clinically Significant Prostate Cancer (3 + 3 vs ≥ 3_4).
Performance Statistics (AUC, Sensitivity, Specificity) of Top Performing Multivariable Logistic Regression Model to Discriminate Clinically Significant Prostate Cancers (3 + 3 Vs >= 3 + 4). The Model’s Performance With 95% Confidence Limits, was Computed Using the Bootstrap (0.632) Cross-Validation Method (Averaged Over 100 Repeats). Using A) Mean and B) Center of Mass Transformation.

Results
The study used 25 patients with DCE images obtained in a finer time interval (about 3 seconds), averaging about 100 T1W sequences. The time-dependent features computed on the DCE images, following feature-based transformations, were used to build a classifier model to predict clinically significant prostate cancer grades. We find 11 feature transformations (out of 306) that have information (non-random), allowing us to characterize the DCE images with six features to describe the temporal pattern observed over time. We applied a bi-exponential data fit to smooth the time series data prior to feature extraction. We removed transformations with non-monotonic (random) time-dependent patterns or constant (no-information) across time or without consistent patterns. We find ten individual DCE features in five different transformations (mean, statistical min gray level, statistical 10th percentile, statistical range, center of mass shift) that were significant with individual features (P ≤ 0.05) to discriminate aggressive Gleason grades (GS3+3 vs ≥ 3 + 4) (see Table 2). We evaluated the dependency between features extracted on the DCE time series for each transformations. We find initial AUC (AUCi) and final AUC (AUCf) were highly correlated (ρ > 0.99) across all the transformations (see Supplemental Figure SF1). We attempted to build univariate classifier models to discriminate against aggressive grade disease. There were several DCE features (initial AUC, AUCi) that showed the ability to discriminate aggressive disease grade, with AUC ranging from 0.74 to 0.89 and 0.71 to 0.8 using Statistical minimum gray level and statistical 10th percentile-based feature transformations (see Figure 4 & Supplemental Figure SF2 & Supplemental Table ST1). We find the statistical minimum grey level, and Centre of mass shift-based transformation had three individual features in each of these (time to peak or τ, wash in slope or wi, initial AUC or AUCi) and (peak enhancement Sp, wash in slope or wi, initial AUC or AUCi) were borderline significant, corrected for multiple testing (false discovery, q ≤ 0.05), See Table 2. We then built a logistic regression model to independently predict aggressive Gleason grade using DCE temporal features across each transformation. We find using Centre of mass shift based transformation, DCE feature pair using wash-in slope (wi) with initial AUC (AUCi) and wash-in slope (wi) with final AUC (AUCf) showed predictive of aggressive Gleason grade (AUC of 0.94) estimated by 0.632 bootstrap cross-validation after SMOTE sample balancing. We compared predictors formed with Mean transformation (estimate). We find top models based on the wash-in slope (wi) with initial AUC (AUCi) showed an AUC of 0.769 for aggressive disease grade (see Table 3). These predictors have an average sensitivity in the range of 0.79 to 0.89 (center of mass shift), 0.71 to 0.74 (mean), and specificity in the range of 0.94 to 0.99 (Center of mass shift), 0.59 to 0.65 (mean) respectively. We also found other transformations showed the following best DCE feature-based predictor models, which were using Statistical minimum gray level (F7) and statistical 10th percentile (F8) had classifier models based on the wash-in slope (wi), initial AUC (AUCi), peak enhancement (sp) with AUC in the range of 0.84 to 0.91 and 0.80 to 0.84 respectively (see Figure 5, Supplemental Table ST2 and Supplemental Figure SF3).We formed univariate predictors of cancer aggressiveness using first order features computed on MRI-ADC and average AUC ranged from 0.69 to 0.82 (see Table 4), these metrics form a baseline comparator for DCE based features. Univariate analysis using logistic regression to discriminate clinically significant prostate cancers (3 + 3 vs 3 + 4). Graphical illustrates univariate model performance (AUC) across the eleven transformations using uncorrelated features (5 of 6 features, ρ < 0.99). The AUC was estimated using 0.632 bootstrap cross-validation (repeated n = 100 times). Multivariable analysis (2 features) using logistic regression to discriminate clinically significant prostate cancers (3 + 3 vs 3 + 4). Subplot illustrates performance statistics (AUC) for top feature pairs for top feature transformations (F89: Centre of Mass) compared with Mean (F1: Mean), (see Supplemental Figure 2 for other transformations). The model performance statistics (AUC) was estimated using SMOTE and 0.632 bootstrap cross-validation (repeated n = 100 times). Where X axis represents feature pairs and Y-axis represents AUC (of ROC curves). Predictor Performance on Statistical Metrics Computed in MRI-ADC Regions Used in Logistic Regression Model to Discriminate Clinically Significant Prostate Cancers (3 + 3 Vs >= 3 + 4). The Model’s performance(AUC, Sensitivity, Specificity) With 95% Confidence Limits, was Computed Using the Bootstrap (0.632) Cross-Validation Method (Averaged Over 100 Repeats).


Discussion
DCE imaging is the primary sequence in Magnetic resonance imaging that allows visualization of abnormal regions’ uptake of contrast agent (Gd) in real time. DCE images allow characterization of the blood flow into prostate tissue, providing potential metrics for identifying suspicious lesions by localizing abnormal contrast absorption in relative terms.3,15 Patient-level variation in the contrast uptake and difficulty in quantifying these biological processes has led to qualitative clinical interpretation. 25 Current clinical practice requires the practitioner to report the presence or absence of contrast uptake at the regions of abnormality as recommended by the Prostate Imaging Reporting & Data System (PIRADS). 26 The non-quantitative reporting for DCE uptake has resulted in falsely detected clinically significant cancer grades. 27 Several reports have attempted quantification of DCE characteristics, where time-dependent features have been used to discriminate aggressive pathological grades; some have reported an accuracy of over 94%.28,29 Additionally, these DCE characteristics have been used to detect abnormal regions semi-automatically; a recent study reports an AUC in the range of 0.88-0.95 30 . The reproducibility of these characteristics across cohorts has been a challenge30,31 broadly recognized in the field. Recently the Quantitative Imaging Biomarkers Alliance (QIBA) has issued recommendations to improve measurement errors and reduce bias in these modalities to enable clinical translation. 32 Previously, a preclinical study attempted to use radiomic features on DCE images to identify brain tumors. 33 In another study, Breast DCE radiomics (with six T1w sequences) was used to identify aggressive disease. 34 In comparison, we transformed DCE images (∼100 T1w sequences, in a patient) and obtained temporal characterization, which was shown to discriminate aggressive disease phenotype with better performance in comparison. 35
Our preliminary study found 11 (out of 306) feature-based transformations on T1W/DCE imaging across the time points had information (non-random). Of that, DCE features based on initial/final AUC (initial: 0 to 30 sec/ final: 240 to 270 sec) along with peak enhancement (sp) using Center of mass shift transformation, used in a multi-variable model had higher predictability of aggressive grade disease (AUC in range of 0.89 to 0.94), estimated by 0.632 bootstrap cross-validation. We compared our finding to mean features based on DCE features, which showed that the best feature pair had an AUC of 0.76. Prior studies have reported that DCE features were predictable, with AUC in the range of 0.8 to 0.86, in detecting aggressive disease grade. 36 Using a multi-institutional cohort, DCE features and radiomic metrics (ADC) reproducible with an AUC of 0.82. 37 Several groups have shown relevance to using these metrics in oncological diseases. 38 We formed univariate predictors using first-order statistics on regions of MRI-ADC as a baseline comparable (see Table 4) to DCE metrics.
In conclusion, we find time-dependent features (Sp, Wi, AUCi) on DCE computed after feature-based transformation (Center of mass shift, mean) show promise in developing predictors to identify clinically aggressive prostate disease. These metrics provide an excellent ability to assess the risk of aggressive disease. The disease grade in this cohort was ascertained by whole mount pathological diagnosis. Due to the limited sample size and absence of an independent cohort, further studies are essential to validate our findings.
Conclusion
Quantitative features in DCE imaging allow us to build predictive models to identify aggressive prostate disease grades. Our study systematically tested several transformations of T1W (DCE) imaging to derive temporal characterization, build predictors, and relate to pathological outcomes. We find temporal characteristics on radiomic transformed DCE sequence provide better discrimination of clinically aggressive disease. Our analysis shows great promise in developing high predictive features for clinically significant grade prostate cancers. We recognize the need for independent validation studies to validate the findings.
Supplemental Material
Supplemental Material - Quantitative DCE Dynamics on Transformed MR Imaging Discriminates Clinically Significant Prostate Cancer
Supplemental Material for Quantitative DCE Dynamics on Transformed MR Imaging Discriminates Clinically Significant Prostate Cancer by Zhouping Wei, Malinda Iluppangama, Jin Qi, Jung Choi, Alice Yu, Kenneth Gage, Vaibhav Chumbalakar, Jasreman Dhilon, Kethandapatti C Balaji, Satish Venkataperumal, David J. Hernandez, Jong Park, Clement Yedjou, Richard Alo, Robert Gatenby, Julio Pow-Sang, Yoganand Balagurunanthanin Cancer Control
Footnotes
Acknowledgments
The authors would like to acknowledge clinical data shared by the NCI research team (Choyke P, Turkbey B, Pinto P, Merino M, Wood B). We thank the Machine Learning/Radiomics researchers at H Lee Moffitt Cancer Center, an NCI designated Comprehensive Cancer Center. We are grateful for the research support, and valuable discussion from our analytical group, Ryan Fogarty, MS (PhD student) at USF Computer Sciences, and Dr. Chris Tskos, Professor, Department of Statistics & Mathematics at the University of South Florida. Authors (as indicated) acknowledge partial research funding received from the NCI (CA190105-01, U01 CA200464 and R37 CA229810, for YB) and Cohen’s family donation (for JPS & YB) that provided protected research time for the study.
Author Contributions
Declaration of Conflicting Interests
The author(s) declared no potential conflicts of interest with respect to the research, authorship, and/or publication of this article.
Funding
The author(s) disclosed receipt of the following financial support for the research, authorship, and/or publication of this article: We would like to acknowledge funding from Cohon’s family donation (for ZW, YB).) and NCI (U01 CA200464, CA190105-01 and R37 CA229810, for YB), for providing partial protected research time for the authors.
Ethical Statement
Data Availability Statement
The data used in the study is available to download: Prostate-MRI collection,
39
![]() .
.
Supplemental Material
Supplemental material for this article is available online.
Appendix
References
Supplementary Material
Please find the following supplemental material available below.
For Open Access articles published under a Creative Commons License, all supplemental material carries the same license as the article it is associated with.
For non-Open Access articles published, all supplemental material carries a non-exclusive license, and permission requests for re-use of supplemental material or any part of supplemental material shall be sent directly to the copyright owner as specified in the copyright notice associated with the article.