
Abstract
Introduction
Biparametric magnetic resonance imaging (MRI) preserves enough information to enable the prediction of prostate cancer (PCa). This fast, cost-effective, and non-invasive modality includes acquisition of T2-weighted images, and accelerated diffusion-weighted imaging (DWI) sequences with corresponding apparent diffusion coefficient (ADC) maps. In this proof-of-concept study, we aimed to assess the prediction of PCa using a tumor location-(L) dependent risk score (LADCT2) generated from an ADC and T2 images - based model.
Methods
The single-center institutional retrospective cohort study used 113 patients who underwent multiparametric MRI (mpMRI) for the diagnosis and management of PCa. A discovery cohort (n = 58) and an evaluation cohort (n = 55) were identified from a prospectively maintained institutional cancer registry. The discovery cohort consisted of patients who underwent MRI-guided TRUS biopsies, whereas the evaluation cohort consisted of patients who received only standard TRUS biopsy. Among the discovery cohort, we developed a predictive risk score (LADCT2) using a multivariable logistic regression model that incorporated tumor location (L) with normalized mean signal differences of T2-and ADC- tumor region of interest. The primary outcome assessed the predictive accuracy of the LADCT2 risk score in predicting PCa.
Results
Our results demonstrated that the LADCT2 score exhibited excellent predictive accuracy for PCa among both the evaluation (AUC = 0.84, OR = 2.80 [95% CI, 1.04-7.52]; P = .04), and discovery (AUC = 0.77, OR = 2.71 [95% CI, 1.38-5.35]; P = .003) cohorts. Additionally, it also predicted for clinically significant PCa among both the discovery (AUC = 0.71, OR = 2.11 [95% CI, 1.16-3.84]; P = .01), and evaluation (AUC = 0.65, OR = 1.94 [95% CI, 1.02-3.69]; P = .04) cohorts.
Conclusion
The novel LADCT2 risk score may function as an effective risk stratification tool to support clinical decision-making in the management of PCa.
Keywords
Introduction
Prostate cancer (PCa) is the second most common cancer diagnosed in men and the second most common cause of cancer death among men in the United States. 1 Based on the Surveillance, Epidemiology, and End results (SEER) database, the 5-year survival rate for localized PCa is nearly 100%. However, if PCa is diagnosed with distant metastasis, the survival rate drops to 37%. 2 Therefore, early and accurate detection of PCa is paramount for optimizing patient outcomes. Multiparametric MRI (mpMRI), with or without prostate biopsy, has become the standard of care for PCa diagnosis; however, its widespread implementation is limited by cost, acquisition time, and the need for specialized expertise.3,4 Standard mpMRI includes acquiring T2-weighted and accelerated diffusion-weighted imaging (DWI) sequences in addition to dynamic contrast-enhancement (DCE) sequence postinjection of gadolinium-based contrast agents.4,5 As a result, biparametric MRI (bpMRI), which represents an abbreviated version of prostate mpMRI that foregoes several non-contrast and postcontrast sequences,3,6,7 has gained attention as a faster, non-invasive, and accessible alternative while maintaining comparable diagnostic accuracy in clinical settings.3,8
Although bpMRI simplifies the imaging workflow, interpretation still depends heavily according to the Prostate Imaging Reporting and Data System (PI-RADS), most recently updated to version 2.1. 9 While there are many inter-related factors that contribute to wide variability in PIRADs performance including hardware, image quality, and patient-specific factors, the reliance on contrast-enhanced mpMRI remains a key practical limitation, adding cost, scan time, and barriers to accessibility. 10 Additionally, experience levels among radiologists and biopsy operators have significant impact on diagnostic accuracy and reducing variability. 10 Therefore, there is a pressing need for objective, quantitative imaging-based tools that leverage routinely acquired sequences to support early detection and risk stratification of prostate lesions.
Recent studies have demonstrated the feasibility of deep learning (DL)-based approaches for PCa detection and risk stratification using bpMRI and mpMRI.11-13 Several groups have reported automated or semi-automated frameworks for lesion detection, segmentation, and cancer risk prediction, including implementations developed using open-source platforms such as MONAI. 11 T2-weighted and DWI/Apparent diffusion coefficient (ADC) sequences are the most predictive for diagnosing clinically significant PCa on MRI, and therefore, these sequences are the workhorses of both bp and mpMRI.3,4 Leveraging these routinely available imaging parameters with biopsy pathological information, we developed a novel risk score intended to provide early detection and risk stratification of prostate lesions. Our risk score (LADCT2) uses tumor location (L) information with voxel-level data from ADC- and T2-weighted images and therefore, do not rely on contrast enhancement, and radiomic pipelines, making it suitable for broad clinical implementation. Additionally, it can also be applied during bpMRI protocol as a clinically interpretable method for lesion-level risk assessment.
In this study, we evaluate the diagnostic performance of the novel risk score (LADCT2) for predicting 1. PCa and 2. Clinically significant PCa, while also examining its potential function as an objective adjunct to existing MRI-guided diagnostic pathways. Our study aims to introduce a practical, quantitative tool that can improve the consistency and efficiency of PCa detection and risk stratification within bpMRI-based workflows.
Methods
Patient Demographics
This study involved the retrospective analysis of 113 patients who underwent mpMRI for the diagnosis and management of PCa at a tertiary academic institution between 2006 to 2019. Out of 113 patients, 57 were African-American men (AAM) and 56 were White men. A discovery cohort (n = 58) and an evaluation cohort (n = 55) were identified from a prospectively maintained institutional cancer registry. Discovery cohort included patients who underwent MRI-guided TRUS biopsy. The evaluation cohort included patients who received only standard TRUS biopsy. Clinical information was electronically annotated by chart review. We then abstracted detailed information on age at diagnosis, self-identified race, and centralized Gleason scores (GS). The presence or absence of PCa was determined by biopsy-derived GSs from pathology reports. GSs were categorized into 5 grade groups (GG1–5) according to the International Society of Urological Pathology consensus. Grade group 1 is considered clinically nonsignificant PCa with a corresponding Gleason score of equaled to 3 + 3. 14 Grade groups 2 and 3 are considered clinically significant PCa (csPCa), both with Gleason scores of 7 (group 2 = 3 +4) and (group 3 = 4 + 3). 14 Grade groups 4 and 5 are also considered csPCa with Gleason scores of 8 (group 4) and 9–10 (group 5). 14 Intraprostatic tumor location was defined as anterior or posterior based on lesion location in relation to the prostatic urethra; PIRADS score from diagnostic mpMRI was also identified.
The study was approved by the institutional review board of Advarra (#00000971), Columbia, Maryland. The institutional review board number is Pro00015023. Current date of approval is from May 21, 2025, to May 21, 2026. Analyses were conducted with an approved waiver for obtaining informed consent and with authorization by the Health Insurance Portability and Accountability Act of 1996. Patient identification was deidentified and study protocol adhered to HIPAA regarding data privacy and security. The reporting of this study conforms to the STROBE guidelines. 15
Contrast, MRI Technique, and Lesion Review
For contrast administration, weight-calculated gadolinium-based contrast was administered intravenously after performing renal function tests (within 1 week, GFR >45). The allergy profile of each patient was also checked to ensure no history of reactions or other contraindications. MR images were obtained on either 1.5 or 3.0 Tesla scanners using a multichannel surface coil according to institutional preference. Key protocol sequences included: axial T2 turbospin echo (TR, 11 700 msec; TE, 112 msec; FA, 160o; and ST, 3 mm), axial DWI using 150, 900, and 1000 b values (TR, 6000 msec; TE, 81 msec; FA, 90o; and ST, 3.5 mm) with corresponding ADC maps and axial T1 pre- and postcontrast gradient echo (TR, 4.5 msec; TE, 1.7 msec; FA, 12; and ST, 3.5 mm) run in 3-second intervals over 90 seconds (total of 30 T1 postcontrast series). Primary interpretation was completed using in-house picture archiving and communication systems (Centricity, GE Healthcare, Boston, Massachusetts, U.S.A.). Following lesion identification, contouring was applied using a third-party platform for voxel analysis (Mirada RTx, Mirada Medical Ltd., Oxford, UK). Images were interpreted by 2 fellowship-trained radiologists, each with at least 10 years of experience. Readers were blinded to clinical data to replicate prospective reading conditions. Radiopathologic correlation was performed manually and retrospectively, based on quadrant (or sextant) pairing. Lesions were categorized based on the PIRADS, version 2.1. 9 eFigure 1 provides visualization of the processing pipeline for primary and secondary interpretation.
Image Postprocessing
T2 and ADC sequences were exported to the third-party Mirada RTx software platform for voxel-level analysis of the lesions identified on secondary interpretation as well as the normal prostate. Briefly, T2 sequences were used as the base sequences for ADC registration. Tumor region-of-interests (ROIs) were contoured by a radiologist on both sequences and checked for accuracy. Intensity values were extracted from the contours from each volume. ROI of the adjacent normal prostate was also taken for normalization (normalized-ROI).
Discovery Cohort: Radiologic-Pathologic Correlation
Biopsy reports were reviewed for index lesion location identification. Index tumor locations were defined as the cores with the highest GS and the highest percentage of tumor involvement. Additionally, when the percentage of tumor involvement for the cores of significance were the same, the core taken from the location with the highest GS was considered the index tumor location. Any pathologic lesions were correlated with tumor-ROIs identified by a radiologist during secondary interpretation.
Evaluation Cohort: Radiologic-Pathologic Correlation
Routinely, some patients undergo diagnostic MRI followed by a standard TRUS biopsy without a simultaneous mpMRI to guide a targeted biopsy. Thus, to test whether our model can be generalizable, we used an independent cohort that included patients who had a diagnostic prostate MRI followed by a standard TRUS biopsy without MR-guidance. Validation of radiologic-pathologic correlation utilized standard TRUS biopsy results and secondary interpretation of earlier diagnostic mpMRI. Voxel-level data of tumor ROIs were applied to our predictive algorithm in the same manner as described earlier.
Statistical Analysis
Baseline characteristics were compared using Chi-square test for categorical variables and Wilcoxon rank-sum test for continuous variables. A two-sided Alpha value of ≤0.05 was considered as statistically significant. Analysis was carried out using SAS 9.4 software.
Discovery Cohort: Model Development and Benchmarking
In the discovery cohort, we initially focused on index lesions. The primary outcome was the presence of PCa on biopsy (based on GS). As a clinical benchmark, the diagnostic performance of PIRADS was first evaluated using the recommended clinical cutoff (PIRADs >=3). This served as a reference standard against which imaging-based models were compared.
Subsequently, a series of logistic regression models were generated by correlating voxel-level data (incorporating T2 and ADC mean ROI) with the presence or absence of cancer as determined by biopsy-derived GSs from pathology reports. The presence of cancer was indicated in an ROI if GS was ≥6(3 + 3). Odds ratios (ORs) with 95% confidence intervals (CIs) and corresponding p values were reported for each model.
Discrimination and Diagnostic Performance
Model discrimination was assessed using the area under the receiver operating characteristics curve (AUC). For each model, diagnostic performance metrics-including sensitivity, specificity, positive predictive value (PPV), and negative predictive value (NPV) were calculated. Optimal probability thresholds were identified using the Youden J statistics, defined as (sensitivity+specificity-1). The dichotomous variables based on these cuts (high vs low) were then incorporated into a final model with tumor location integrated with the T2 and ADC parameters (LADCT2) to calculate a prediction risk score for predicting cancer vs. no cancer.
Risk Score Calculation
A quantitative imaging-based risk score was derived from the multivariable logistic regression model developed in the discovery cohort. Regression coefficients from the final model-including the intercept, T2, ADC, and tumor location were used to compute the risk score based on the following equation:
For anteriorly located tumors, LADCT2 risk score from the fitted model was derived based on following equation:

Similarly, for posteriorly located tumors, the LADCT2 risk score from the fitted model was calculated using the following equation:

Mean values from quantitative ADC map and qualitative T2-weighted image intensities were used to calculate location-specific risk estimates (anterior and posterior). When we assigned values to the above equations, the LADCT2 risk score for anteriorly located tumors are derived from the following equation:

Similarly, for posteriorly located tumors, the LADCT2 risk score from the fitted model was calculated using the following equation:

The resulting Continuous LADCT2 risk score was then used to estimate the probability of PCa and csPCa among both cohorts.
Evaluation Cohort: Validation Analysis
Our newly trained algorithm the LADCT2 risk score, was applied to an independent validation set using the same coefficients and cutoff values obtained from the discovery cohort. Cutoffs were determined using the Youden J statistic in the discovery cohort and applied unchanged to the evaluation cohort. Additionally, separate cutoffs were derived for prediction of 1. PCa and 2. csPCa. This specific database was chosen to test the performance of our model on a more generalized population of patients who may not undergo an MR-guided TRUS biopsy as part of their diagnostic work up. Model performance on the evaluation cohort was assessed using AUC, ORs with 95% CIs, sensitivity, specificity, PPV, NPV, and corresponding p values.
Consistency of model performance between the discovery and evaluation cohorts was evaluated to assess the robustness and generalizability of the LADCT2 risk score.
Results
Patient Characteristics
Overall Cohort Characteristics (n = 113)

Abbreviations. AAM; African American men, SD; standard deviation, IQR; interquartile range, PIRADS; prostate imaging reporting and data system. Wilcoxon rank-sum test for numeric and Pearson Chi-square test for categorical variables. PIRADS score is categorized as low risk (2), intermediate risk (3), and high risk (4, 5).
Discovery Cohort
Association of PIRADS and LADCT2 With Prostate Cancer in Both Discovery and Evaluation Cohorts

Abbreviations: AIC, Akike information criterion; AUC, area under curve; LADCT2, location-dependent risk score; OR, odds ratio; PIRADS, Prostate Imaging Reporting and Data System.

Receiver operating characteristic (ROC) curves comparing the performance of PIRADs, LADCT2 risk score, and a combined model incorporating PIRADs and the LADCT2 risk score for predicting the presence of prostate cancer in the discovery cohort. Model discrimination is summarized by the area under the ROC curve.
Diagnostic Performance of PIRADS and LADCT2 in Discovery and Evaluation Cohorts for PCa
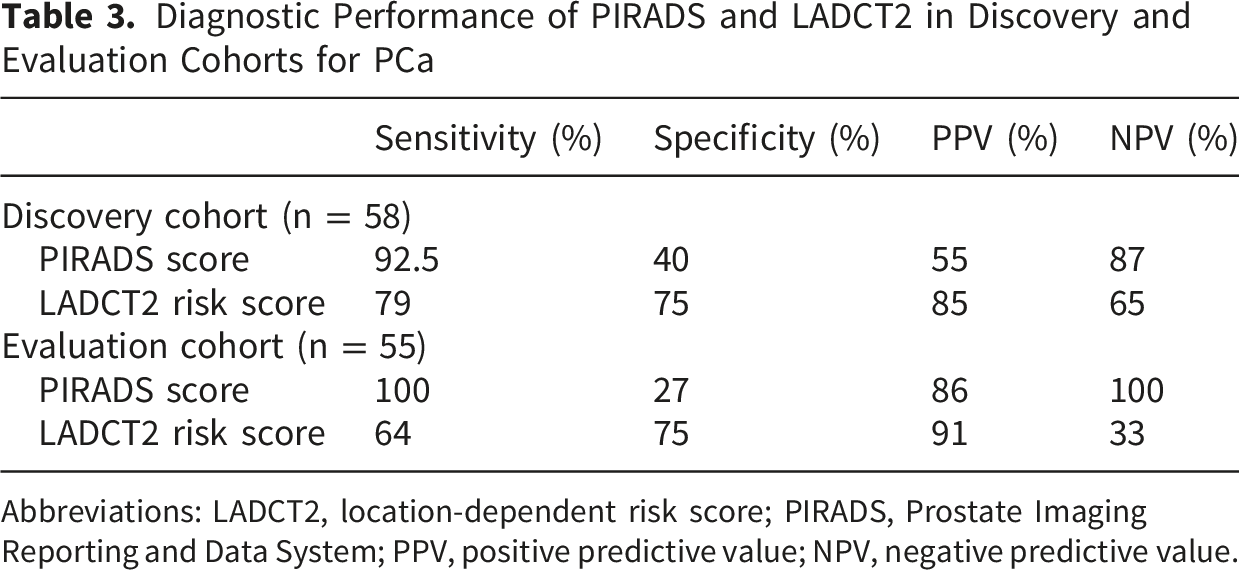
Abbreviations: LADCT2, location-dependent risk score; PIRADS, Prostate Imaging Reporting and Data System; PPV, positive predictive value; NPV, negative predictive value.
Association of PIRADS and LADCT2 With Clinically Significant Prostate Cancer in Discovery and Evaluation Cohorts
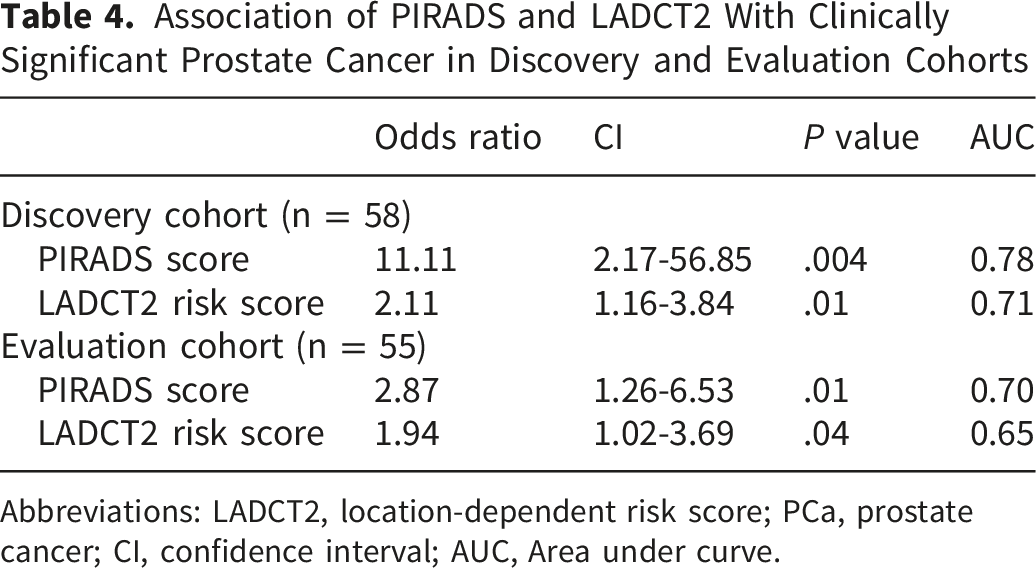
Abbreviations: LADCT2, location-dependent risk score; PCa, prostate cancer; CI, confidence interval; AUC, Area under curve.
Diagnostic Performance of PIRADS and LADCT2 for Clinically Significant Prostate Cancer in Discovery and Evaluation Cohorts

Abbreviations: LADCT2, location-dependent risk score; PPV, positive predictive value; NPV, negative predictive value.
Association of PIRADS and LADCT2 With Prostate Cancer Among African American Men in the Discovery and Evaluation Cohorts

Abbreviations: AIC, Akike information criterion; AUC, area under curve; LADCT2, location-dependent risk score; OR, odds ratio; CI, Confidence interval; AAM, African American men.
Diagnostic Performance of PIRADS and LADCT2 Among African American Men in the Discovery and Evaluation Cohorts

Abbreviations: LADCT2, location-dependent risk score; PPV, positive predictive value; NPV, negative predictive value; AAM, African American men.
Evaluation Cohort
Finally, the model was evaluated in an independent dataset of index lesions from MR images using the same coefficients and cutoff values from the discovery cohort. For the evaluation set, PIRADs demonstrated fair discriminatory performance to predict the presence of PCa (OR = 5.37, [95% CI, 1.17-24.58]; P = .03, AUC 0.78) (Table 2). At this threshold, PIRADs achieved a sensitivity of 100% and specificity of 27%, with a PPV of 86%, and NPV of 100% (Table 3). The LADCT2 risk score demonstrated excellent discriminatory performance in distinguishing between patients who diagnosed with PCa and those who did not (OR = 2.80 [95% CI, 1.04-7.52]; P = .04) with an AUC of 0.84 (Table 2) (Figure 2). Using the optimal cutoff, the LADCT2 risk score achieved a sensitivity of 64% and specificity of 75%, with a PPV of 91% and NPV of 33% (Table 3). The model demonstrated excellent calibration overall, with a non-significant Hosmer-Lemeshow test (P = .95) (eFigure 2C). The calibration plot showed good calibration in higher-risk group; interpretation of calibration at lower predicted risks was limited by the small number of observations in this range. When both PIRADS and LADCT2 scores were incorporated, model usefulness increased as determined by an AUC of 0.89 (Figure 2). PIRADs demonstrated fair discriminatory performance to predict csPCa (OR = 2.87, [95% CI, 1.26-6.53]; P = .01, AUC 0.70) (Table 4). At the recommended threshold (PIRADs >=3), PIRADs achieved a sensitivity of 100% and specificity of 7%, with a PPV of 48%, and NPV of 100% (Table 5). The LADCT2 risk score also demonstrated fair discriminatory performance in distinguishing clinically significant PCa (OR = 1.94 [95% CI, 1.02-3.69]; P = .04) with AUC of 0.65 in the evaluation cohort (Table 4). At the predefined cutoff, the risk score demonstrated sensitivity of 85% and specificity of 40%, with a PPV of 53% and NPV of 77% (Table 5). Additionally, the model was very well calibrated, with a non-significant Hosmer-Lemeshow test (P = .68), indicating strong agreement between observed and predicted probabilities (eFigure 2D). Lastly, among AAM, PIRADs demonstrated modest discriminatory performance to predict the presence of PCa (OR = 6.23, [95% CI, 1.76-50.57]; P = .02, AUC 0.78) (Table 6). At the recommended threshold (PIRADs >=3), PIRADs achieved a sensitivity of 100% and specificity of 42%, with a PPV of 87%, and NPV of 100% (Table 7). The logistic regression model yielded an AUC of 0.76 (OR = 1.90 [95% CI, 1.04-5.69]; P = .04 (Table 6) (Figure 3B), indicating modest discriminatory performance of LADCT2 risk score in distinguishing between AAM patients who diagnosed with PCa and those who did not. At the predefined cutoff, the LADCT2 risk score demonstrated sensitivity of 74% and specificity of 50%, with a PPV of 86% and NPV of 76% (Table 7). Receiver operating characteristic (ROC) curves comparing the performance of PIRADs, LADCT2 risk score, and a combined model incorporating PIRADs and the LADCT2 risk score for predicting the presence of prostate cancer in the evaluation cohort. Model discrimination is summarized by the area under the ROC curve. Receiver operating characteristic (ROC) curves based on area under curve (AUC) values among AAM to predict cancer status (cancer vs no cancer) using LADCT2 risk score. (A) Discovery cohort. (B) Evaluation cohort.

Next, we converted continuous LADCT2 to a categorical variable using Tertile (33% and 66%) values. In the evaluation cohort, the LADCT2 risk score was categorized as low risk (n = 11, 20% [≤0.63]); average risk (n = 21, 38% [>0.63-≤1.37]); and high risk (n = 23, 42% [>1.37]) (Figure 4A). We then analyzed the relationship between cancer diagnoses and LADCT2 risk categories. Among patients with no cancer diagnosis, 60% had a low-risk LADCT2 score (Figure 4B). Similarly, among those with a cancer diagnosis, 84% presented with average and high-risk LADCT2 scores (Figure 4B). Graphical representation of LADCT2 risk-score categories among evaluation cohort showing. (A) continuous LADCT2 converted to categorical variable using Tertile (33% and 66%) values. (B) Comparison between cancer diagnosis and LADCT2 risk categorization. Cancer diagnosis is based on GS: ≥6(3 + 3) and no cancer (GS = negative).
Discussion
BpMRI has gained traction in PCa screening as a noninvasive technique that offers many of the advantages of mpMRI such as having excellent tissue resolution while minimizing cost, time, and gadolinium-based contrast administration.3,4,6,7,10 This study provides further support to the growing body of literature that indicates that bpMRI is a valuable, highly sensitive screening tool for identifying PCa.16-18 The recently published PRIME diagnostic clinical study was established to evaluate the performance of bpMRI for PCa screening over mpMRI. 3 The results showed that bpMRI detected more csPCa cases than mpMRI without an increase in men undergoing biopsy or overdiagnosis of clinically insignificant cancer. 3 In addition, recently conducted prospective multicenter studies have reported that bpMRI represents an optimal alternative to the less specific PSA test and invasive TRUS-guided biopsy.16,19 As such, it is not surprising that our study confirmed that bpMRI-related data can be used to identify PCa with high sensitivity.
The study results demonstrate that a bpMRI-data–based mathematical model can be used for risk stratification of prostate lesions. Specifically, we found that the tumor-location–dependent prediction risk score (LADCT2) correlated well with PIRADS in discriminating prostate lesions. PIRADs demonstrated high sensitivity and NPV among both discovery and evaluation cohorts, supporting its utility in identifying clinically significant disease. In contrast, Our LADCT2 risk-score exhibited relatively higher specificity and PPV values, indicating its potential utility in refining lesion-level risk stratification. Therefore, our mathematical model can be used across MRI-generated data, alongside the PIRADS-based quantification of lesions by a radiologist during bpMRI, to improve risk stratification and management of PCa patients by reducing false-positive findings and better identifying patients who are most likely to harbor aggressive disease. In other words, once a lesion is identified as possibly abnormal, our model allows for objective risk stratification of the lesion based on the tumor location and voxel-level values. Additionally, compared with PIRADs, the proposed LADCT2 risk score is designed for use with bpMRI, eliminating the need for contrast-enhanced imaging and full mpMRI acquisition. This simplifies image acquisition and interpretation, reducing scan time and resource requirements while maintaining clinically meaningful risk stratification. As a result, LADCT2 risk score may improve accessibility and feasibility of PCa risk assessment, particularly in clinical settings where mpMRI or contrast administration is limited.
Furthermore, our findings can be applied to high-risk AAM populations. AAM have lower compliance for undergoing the recommended screening protocols of DRE and PSA testing.20,21 Additionally, evidence suggests that AAM may have a different tumor microenvironment than non-AAM, which can manifest clinically as a more aggressive phenotype of prostate tumors.22,23 Taken together, these factors lead to the well-reported later stage of PCa at diagnosis and an increased rate of upstaging on pathology that can lead to decreased cancer-specific overall survival for AAM.23,24 In this context, using LADCT2 risk score as a clinically interpretable method for screening these high-risk patients presents an exciting tool that might lead to early and accurate PCa diagnosis and risk stratification.
In this study, we demonstrate the clinical utility of the voxel-based LADCT2 risk score for PCa risk stratification using bpMRI. Our findings add to the growing body of literature exploring artificial intelligence (AI) enabled prostate MRI analysis by highlighting a pragmatic approach that emphasizes interpretability and feasibility within contrast-free imaging pathways. Parallel advances in deep learning-based workflows using bpMRI and mpMRI11-13 have further established the feasibility of automated lesion detection and risk stratification. Building on these developments, future studies will integrate automated lesion segmentation frameworks, such as those developed within the MONAI system, 11 to enable scalable and standardized implementation of the proposed risk score.
Overall, study findings suggest that the LADCT2 risk score may serve as a clinically useful tool for lesion-level risk stratification and may aid in clinical decision-making in the management of PCa. However, there are several limitations in the analysis presented in our study. First, this retrospective study involved a low number of patients (n = 113) who had the data points in the database necessary to produce this model which limits the generalizability of the findings. Additionally, the study population drawn from a single tertiary cancer center may introduce referral bias. The exploratory nature of the analysis, combined with the lack of internal validation procedures such as resampling or cross-validation (due to the small sample size of the discovery cohort) to correct for model optimism limits the strength of study conclusions. The ROC metrics reported (AUC, sensitivity, specificity) represent apparent performance and may overestimate true predictive accuracy. Although the LADCT2 risk score demonstrated good discrimination for PCa overall, its ability to discriminate clinically significant disease was modest, with fair performance among both discovery and evaluation cohorts. The annotations for tumour ROIs were manual and not automated – as such these are subject to inter-observer variability, leading to differences in mean T2 and ADC values across different observers who would be annotating the lesions. Future work will incorporate automated lesion segmentation approaches to reduce inter-observer variability and improve scalability of the proposed LADCT2 risk score, while preserving its clinically interpretable design. Such integration would enable end-to-end risk stratification pipelines that remain independent of contrast-enhanced imaging and full mpMRI acquisition. Lastly, over the study period, there have been substantial changes in scanner type (1.5T vs. 3T), 25 variations in protocols, and differences in reconstruction techniques. This heterogeneity may lead to potential drift in image quality, thereby limiting the generalizability of the model.
Conclusion
In summary, our novel LADCT2 risk score may lead to precise, early-risk stratification of PCa. In addition, our data suggested that bpMRI is an effective screening tool that can accurately predict PCa among high-risk AAM populations.
Supplemental Material
Supplemental Material - Novel Voxel-Based MRI Risk Score LADCT2 as a Tool for Prediction of Prostate Cancer: A Proof of Concept With Retrospective Study
Supplemental Material for Novel Voxel-Based MRI Risk Score LADCT2 as a Tool for Prediction of Prostate Cancer: A Proof of Concept With Retrospective Study by Maria L. Sandoval, Purvish Trivedi, Asmaa El-Kenawi, Kujtim Latifi, Arthur Parsee, Shivanshu Awasthi, Esther Katende, Michelle I. Echevarria, Jong Y. Park, Timothy R. Rebbeck, Jasreman Dhillon, Kenneth Gage, Nainesh Parikh, Kosj Yamoah in Cancer Control
Footnotes
Ethical Considerations
The study was approved by the institutional review board of Advarra (#00000971), Columbia, Maryland. The institutional review board number is Pro00015023. Current date of approval is from May 21, 2025, to May 21, 2026. Analyses were conducted with an approved waiver for obtaining informed consent and with authorization by the Health Insurance Portability and Accountability Act of 1996.
Author Contributions
All authors contributed to the study conception and design. Material preparation, data collection and analysis were performed by Purvish Trivedi, Kujtim Latifi, Esther Katende, Jasreman Dhillon, Shivanshu Awasthi and Kosj Yamoah. The first draft of the manuscript was written by Purvish Trivedi, Maria L. Sandoval, and Asmaa El-Kenawi and all authors commented on previous versions of the manuscript. All authors read and approved the final manuscript. Supervision was provided by Kosj Yamoah and Nainesh Parikh.
Funding
The authors disclosed receipt of the following financial support for the research, authorship, and/or publication of this article: This work was supported in part by NIH R37CA264518 (KY), and the Cancer Center Support Grant P30-CA076292 to Moffitt Cancer Center.
Declaration of Conflicting Interests
KY receives consulting fees from Janssen R&D and serves on the Health Advisory Board. KL receives consulting fees from ViewRay, Inc. SA receives a salary from Otsuka Pharmaceuticals. The other authors have no disclosures or conflicts of interest.
Data Availability Statement
The data that support the findings of this study are available from the corresponding author KY upon reasonable request. The data are not publicly available due to privacy concerns.
Supplemental Material
Supplemental material for this article is available online