
Abstract
Background
Liver cancer (LivCa) is a growing concern in the MENA region, driven by diverse factors, including viral hepatitis, lifestyle-related risks, and other causes.
Methods
Utilizing GBD 2019 data, we assessed LivCa patterns, emphasizing chronic viral hepatitis, non-viral factors, and health care disparities across the MENA region.
Results
Rising LivCa rates, particularly related to chronic viral hepatitis, highlight the region’s health challenges. Lifestyle factors, such as obesity and diabetes, contribute significantly. Disparities in health care access and cancer registration hinder accurate assessments.
Conclusion
A comprehensive strategy is vital, encompassing vaccination promotion, health care enhancements, and lifestyle awareness. Urgent coordinated efforts are needed to address disparities, implement evidence-based interventions, and alleviate the escalating LivCa burden in the MENA region.
Background
Liver cancer (LivCa) stands out as one of the most prevalent and economically burdensome malignancies globally, exerting a substantial burden on both health care systems and society at large.1-3 The costs of informal care (ie, services provided by relatives and friends) and indirect costs (ie, sick leave and early retirement) are high and surpass those associated with direct costs. 3 In 2020, LivCa ranked as the sixth most commonly diagnosed cancer globally (fifth in males and ninth in females), with around 905,677 new cases, marking a 21.1% increase since 2008 when there were 748,000 cases.4,5 Furthermore, it stood as the third leading cause of cancer-related death worldwide (second in males and sixth in females), accounting for 830,180 deaths, representing a 19.5% increase since 2008 when there were 695,000 cases.4,5 Across most regions, incidence and mortality rates are 2 to 3 times higher in men than in women.4,6 The estimated age-standardized incidence rate adjusted to the world standard population (ASIRw) per 100,000 population has also shown an increase among males (ASIRw: 14.1 in 2020, 13.9 in 2018, 15.3 in 2012, and 16.0 in 2008), and females (ASIRw: 5.2 in 2020, 4.9 in 2018, 5.4 in 2012, and 6.0 in 2008).4-8 From 1990 and 2019, the crude number of disease-adjusted life years (DALYs) and deaths in 204 countries increased from 11,278,630 to 12,528,422 and from 365,215 to 484,577, while, the age-standardized DALYs and mortality rates exhibited a decrease. 9
Primary LivCa includes hepatocellular carcinoma (HCC), accounting for 75 to 85% of cases, intrahepatic cholangiocarcinoma (CCA) at 10 to 15%, and other rare types. Major LivCa risk factors include chronic viral infections with hepatitis B virus (HBV) or hepatitis C virus (HCV), excessive alcohol consumption, and non-alcoholic fatty liver disease/non-alcoholic steatohepatitis (NAFLD/NASH) due to metabolic risk factors (eg, excess body weight, type 2 diabetes mellitus (T2DM)).6,10 Exposure to food contaminated by aflatoxins, and tobacco smoking are also risk factors.6,10 In Asian countries, liver fluke infection is also considered a significant risk factor for CCA, particularly in the Northeast region of Thailand. 11 For example, the leading causes of LivCa are chronic HBV infection and aflatoxin exposure in China and East Africa, chronic HCV infection in Egypt and Japan, while in Western countries, LivCa is often secondary to chronic HCV infection, alcohol consumption, and obesity/diabetes. 9 The major LivCa risk factors appear to be in transition, with the prevalence of HBV and HCV declining and excess body weight and diabetes increasing in many regions. 12
Substantial geographic variations in LivCa incidence are evident worldwide. These variations occur due to differences in the prevalence of major LivCa risk factors. The highest LivCa incidence rates (ASIRw) in 2020 were observed in Eastern Asia (17.8), notably in Mongolia (85.6); in Northern Africa (15.2), with a higher incidence in Egypt (34.1); in Micronesia (14.6) and South-Eastern Asia (13.7), where rates are elevated in Cambodia (24.3), Viet Nam (23.0), and Thailand (22.6). 4 In contrast, the lowest LivCa incidence rates were found in South Central America (3.0), South America (4.3), and Central and Eastern Europe (4.3).4,6
The Middle East and North Africa (MENA) region, including Egypt with the second-highest LivCa incidence and mortality rates worldwide in 2020 (following Mongolia), is characterized by a high prevalence of viral hepatitis (C and B) and a lack of appropriate preventive and therapeutic interventions. 6 This region is experiencing a growing burden of HCC. This study aims to assess the burden and trends of LivCa in the MENA region, utilizing data obtained from the Institute for Health Metrics and Evaluation Global Burden of Disease Study 2019 (GBD 2019). Additionally, the study examines the various underlying diseases and risk factors contributing to the age-standardized incidence and mortality rates of LivCa in this region. It concludes with recommendations for effective LivCa prevention and early detection.
Materials & Methods
Data Extraction
The GBD database encompasses all primary LivCa cases, including those involving intrahepatic bile ducts, identified by the International Classification of Diseases, 10th revision (ICD-10) code (C22-C22.8 and Z85.05). The primary objective behind constructing the GBD database was to create a comprehensive tool for quantifying health losses attributed to a wide range of diseases, injuries, and risk factors. This ambitious project was initiated and maintained by a consortium of over 3600 researchers from approximately 200 nations. The GBD database is a compilation of a wide range of scientific literature, including articles, surveys, censuses, vital statistics, and various population-based cancer registries such as the Cancer Incidence in 5 Continents (CI5), the Nordic Cancer Registries database, and the European Network of Cancer Registries.13-15 Therefore, the GBD database provides valuable insights into understanding the characteristics of LivCa, the evolving challenges it presents, and the optimal allocation of health care resources.
In the GBD 2019 database, LivCa cases were classified into 5 groups depending on the underlying etiology (hepatitis B, hepatitis C, alcohol, non-alcoholic steatohepatitis, and other causes). According to Choi et al, thorough literature searches and various adjusting models were used to determine the proportion of LivCa cases based on etiology. 9
For this cohort study, we obtained and reported the age-standardized incidence rate (ASIR), age-standardized mortality rate (ASMR), and disability-adjusted life years (DALYs) for LivCa from 1990 to 2019, along with the contribution of underlying etiology, directly from the GBD Results Tool. These data encompassed 21 countries in the MENA region (https://ghdx.healthdata.org/gbd-2019).13,14
These age-standardized rates adjusted to the GBD reference population, 16 ASIR for incidence and ASMR for mortality, are computed as weighted averages of age-specific incidence and mortality rates per 100,000 individuals, respectively. The weights correspond to the proportions of individuals within the equivalent age groups of a reference standard population. The use of standardization is crucial when comparing diverse populations with varying age compositions. DALYs for a particular disease or health condition represent the sum of years of life lost due to premature death (YLLs) and years lived with a disability (YLDs) caused by prevalent cases of the disease or health condition within a population. In essence, one DALY represents the loss of a year equivalent to perfect health. 17
Trends Analyses
For the age-standardized rates of LivCa, including DALYs, ASIR, and ASMR, we calculated the percentage change between 1990 and 2019 and computed the annual percentage change (APC) for the years 1990-2019 using the Joinpoint Regression Program (JRP) 5.0.2, with statistical significance defined at a P-value <.05. 18 These analyses were also performed for the major causes (underlying diseases) of the LivCa DALYs and ASIR.
Comparison of LivCa Incidence Rates in the MENA Region
The comparison was made with data from the Global Cancer Observatory data, built on high-quality population-based cancer registries and published by the International Agency for Research on Cancer (IARC), a part of the World Health Organization (WHO). 4 However, the Global Cancer Observatory data is based on the world standard population, whereas the GBD data uses the GBD standard population.
Results
Burden of Liver Cancer
Crude Numbers
Age-Standardized DALYs Rates (per 100,000) and Cases of Liver Cancer Based on GBD in 1990 and 2019: A Comparison Across the World, MENA Region, and MENA Countries.
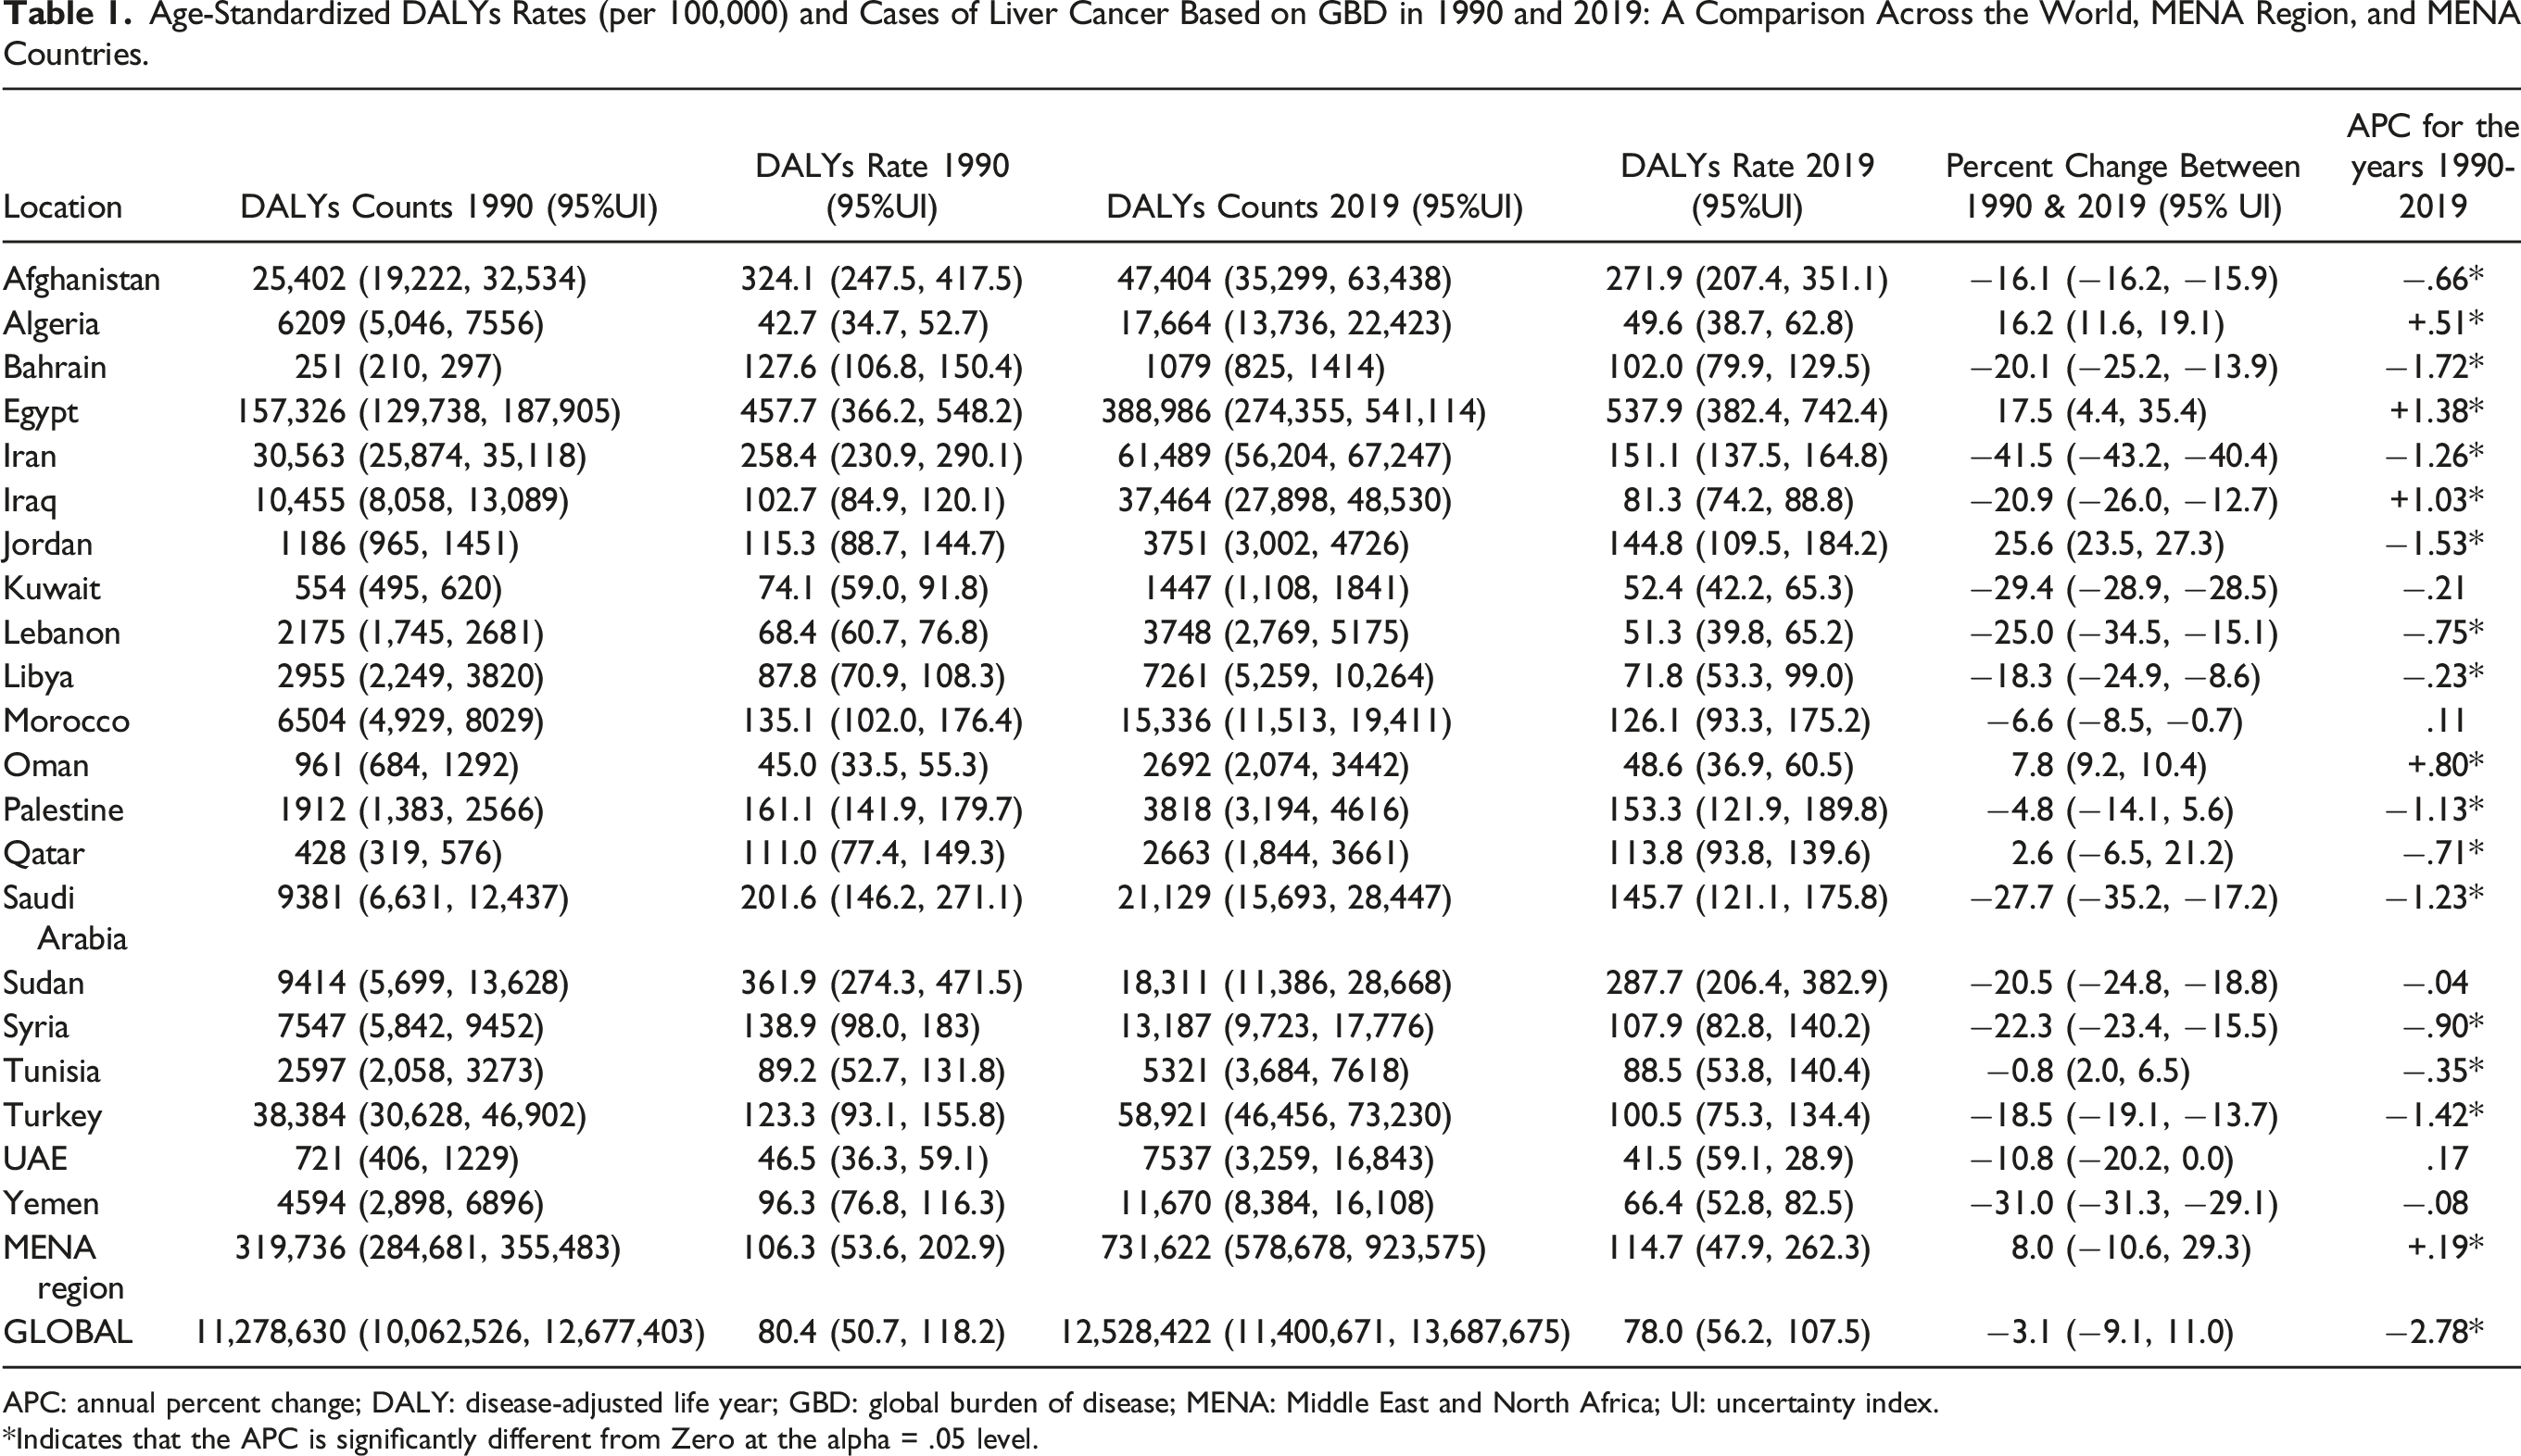
APC: annual percent change; DALY: disease-adjusted life year; GBD: global burden of disease; MENA: Middle East and North Africa; UI: uncertainty index.
*Indicates that the APC is significantly different from Zero at the alpha = .05 level.
Age-Standardized Incidence Rates (ASIR per 100,000) and Liver Cancer Cases Based on GBD in 1990 and 2019: A Comparison Across the World, MENA Region, and MENA Countries.
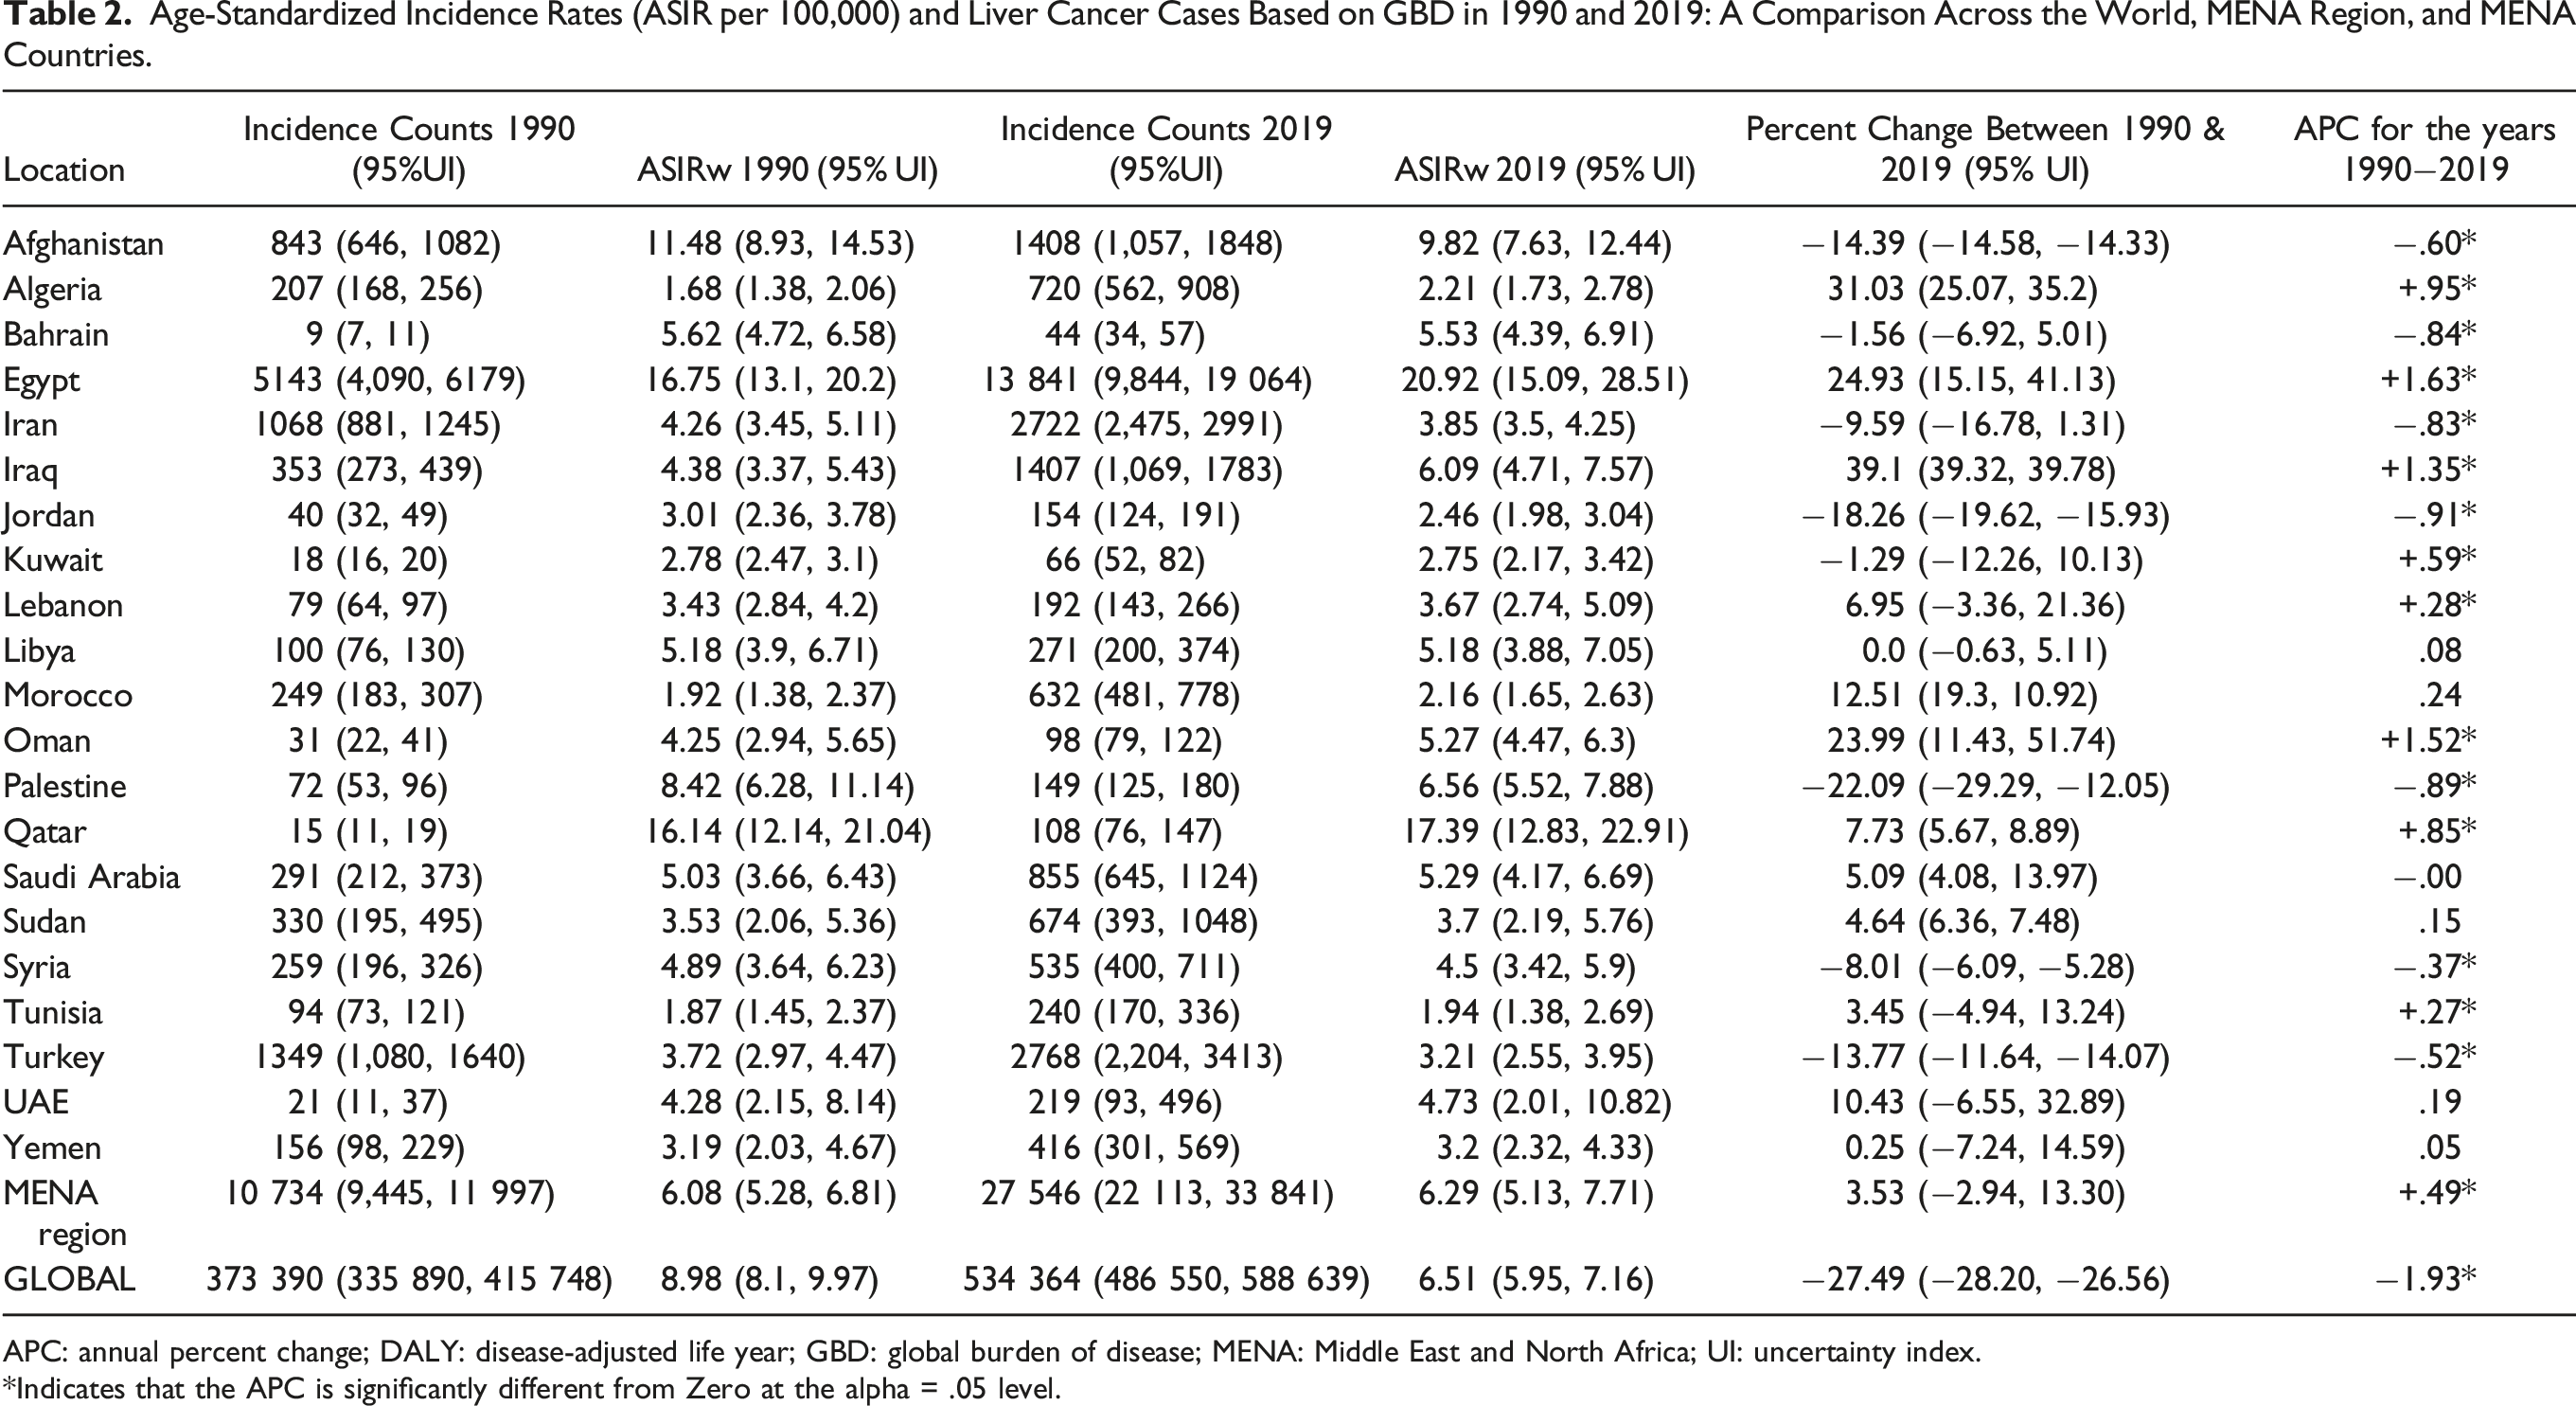
APC: annual percent change; DALY: disease-adjusted life year; GBD: global burden of disease; MENA: Middle East and North Africa; UI: uncertainty index.
*Indicates that the APC is significantly different from Zero at the alpha = .05 level.
Age-Standardized Mortality Rates (ASMR per 100,000) and Cases of Liver Cancer Based on GBD in 1990 and 2019: A Comparison Across the World, MENA Region, and MENA Countries.

APC: annual percent change; DALY: disease-adjusted life year; GBD: global burden of disease; MENA: Middle East and North Africa; UI: uncertainty index.
*Indicates that the APC is significantly different from Zero at the alpha = .05 level.
MENA’s share of the global crude DALYs number for LivCa increased from 2.8% in 1990 to 5.8% in 2019. Notably, Egypt accounted for approximately 49.2% of all DALY counts for LivCa in MENA in 1990, a figure that rose to 53.2% by 2019. Similarly, MENA’s contribution to the global number of LivCa incident cases also witnessed a substantial growth, rising from 2.9% in 1990 to 5.2% in 2019. Egypt’s significance in this context is evident, with the country contributing about 47.9% of all LivCa incident cases in MENA in 1990 (ie, a proportion that increased to 50.3% by 2019). Furthermore, MENA’s contribution to global LivCa death counts saw a significant surge, rising from 3.0% in 1990 to 5.5% in 2019. It’s noteworthy that Egypt alone accounted for approximately 47.2% of all LivCa deaths in MENA in 1990, and this figure surged to 51.4% by 2019.”
Age-Standardized Rates
Liver Cancer Disability-Adjusted Life Years (DALY) Rates (Table 1, Figure 1)
In 1990, the age-standardized LivCa DALY rate in the MENA region was lower (161.1) than the global one (258.4). However, by 2019, the MENA LivCa DALY rate had surpassed the global figure (153.3 and 151.1, respectively). Over the years encompassed by the GBD dataset (1990 to 2019), Egypt consistently recorded the highest LivCa DALY rate in the MENA region, followed by Qatar and Afghanistan (Table 1). Liver cancer age-adjusted DALY rates per 100,000 population in 1990 and 2019: a comparison across the world, MENA region, and MENA countries.
The global LivCa DALY rate experienced a notable decline of 41.5% in 2019 (151.1) compared to 1990 (258.4). The LivCa DALY rate in the MENA region exhibited a much lesser decline of 4.8% over the same time frame, decreasing from 161.1 in 1990 to 153.3 in 2019 (Table 1). While most MENA countries observed a decline in LivCa DALY rate, exceptions included Iraq, Egypt, Algeria, UAE, Morocco, and Oman.
The JRP analysis, which calculated the APC of the LivCa DALY rate from 1990 to 2019, revealed a significant decreasing trend in the LivCa DALYs globally (APC: −2.78). In contrast, there was a significant increasing trend in the MENA Region (APC: +0.19) for the same period (Table 1). Several MENA countries experienced a statistically significant increase in the LivCa DALY rate, namely Egypt, Iraq, Oman, and Algeria. The United Arab Emirates (UAE) and Morocco and had a non-statistically significant increasing trend. A statistically significant decreasing trend in the LivCa DALY rate was observed in Bahrain, Jordan, Türkiye, Iran, Saudi Arabia, Palestine, Syria, Lebanon, Qatar, Afghanistan, Tunisia, and Lybia. Kuwait, Yemen, and Sudan a non-statistically significant decreasing trend.
Liver Cancer Age-Standardized Incidence rates (Table 2, Figure 2)
While the incidence rates (ASIR) of LivCa in the MENA region were lower than the global rates in both 1990 and 2019, this difference has gradually lessened. Globally, the ASIR of LivCa experienced a decline of 1.93% in 2019 (ASIR: 6.51) compared to 1990 (ASIR: 6.98). In contrast, the ASIR of LivCa in the MENA region exhibited an increase of 3.53% over the same time frame, rising from 6.08 in 1990 to 6.29 in 2019 (Table 2). Liver cancer age-adjusted age-standardized incidence (ASIR) and mortality (ASMR) rates per 100,000 population in 1990 and 2019: a comparison across the world, MENA region, and MENA countries.
Throughout the years covered by the Global Burden of Disease (GBD) data (1990 to 2019), Egypt consistently recorded the highest incidence rates (ASIR) of LivCa in the MENA region (Table 1). Egypt’s LivCa incidence rates (ASIR) far exceeded those of any other country in the region in 1990 and 2019, followed by Qatar then Afghanistan. Notably, the ASIR of LivCa increased in several MENA countries, including Tunisia, Lybia, the UAE, Oman, Iraq, Palestine, Saudi Arabia, Qatar, Syria, Türkiye, Iran, and Jordan. Conversely, the ASIR for LivCa declined in the other MENA countries, including Egypt.
The analysis conducted by the JRP to compute the APC of LivCa incidence rates (ASIR) over the span of 1990 to 2019 revealed distinct trends. Globally, there was a significant decreasing trend in LivCa ASIRs (−1.93), in sharp contrast to a significant increasing trend observed in the MENA Region (+.49) (Table 2). Specifically, statistically significant increasing trends were noted in several MENA countries, including Egypt, Oman, Iraq, Algeria, Qatar, Kuwait, Lebanon, and Tunisia. Meanwhile, Morocco, the UAE, Sudan, Libya, and Yemen exhibited a mild, non-statistically significant increasing trend. In contrast, there was a statistically significant decreasing trend in LivCa incidence rates observed in Jordan, Palestine, Bahrain, Iran, Afghanistan, Türkiye, and Syria. Additionally, a slight, non-statistically significant decreasing trend was noted in Saudi Arabia.
The GBD 2019 report estimated the incidence rate (ASIR) of LivCa in the MENA region in 2019 to be 6.3 (95% UI: 5.1, 7.7), broken down into 8.4 (95% UI: 6.6, 10.6) for males and 4.1 (95% UI: 3.4, 5.0) for females. 14 Although it is challenging to compare due to the use of different standard populations, the Globocan Today report estimated ASIRw for LivCa in 2020 to be 5.6 (ie, the average of the ASIRw calculated based on the exhibited rates for all the MENA countries). When considering gender-specific rates, this estimate indicates a rate of 7.1 for males and 4.3 for females. 4
Liver Cancer Age-Standardized Mortality Rates (Table 3, Figure 2)
In contrast to the incidence rates (ASIR), the mortality (ASMR) rates of LivCa in the MENA region (4.57 in 1990 and 4.90 in 2019) were consistently higher than the global rates (3.42 in 1990 and 3.42 in 2019) throughout the years covered by the GBD dataset from 1990 to 2019). Notably, Egypt consistently exhibited the highest mortality rates (ASMR) of LivCa in the MENA region, followed by Sudan then Afghanistan (Table 3).
On a global scale, the ASMR of LivCa experienced only a negligible decline of 0.14% in 2019 (ASMR: 3.42) compared to 1990 (ASMR: 3.42). In contrast, the ASMR of LivCa in the MENA region exhibited a noteworthy increase of 7.21% over the same time frame, rising from 4.57 in 1990 to 4.90 in 2019 (Table 3). Significantly, the ASMR of LivCa witnessed increases in several MENA countries, including Jordan, Egypt, Algeria, Oman, Qatar, and Tunisia. Conversely, a decline in ASMR for LivCa was observed in the other MENA countries.
The JRP computed the APC of LivCa mortality rates (ASMR) over the years (1990-2019), revealing a significant decreasing trend in LivCa ASMRs globally (APC: −2.23). However, there was a significant increasing trend in the MENA Region (APC: +.25) (Table 3). Specifically, statistically significant increasing trends were observed in some MENA countries, including Egypt, Iraq, Palestine, Oman, and Algeria. Meanwhile, Kuwait, Morocco, the UAE, Sudan, and Yemen exhibited a mild, non-statistically significant increasing trend. In contrast, there was a statistically significant decreasing trend in LivCa mortality rates observed in Bahrain, Jordan, Iran, Türkiye, Saudi Arabia, Syria, Lebanon, Afghanistan, Tunisia, and Libya, while Qatar showed a non-statistically significant decreasing trend.
The GBD 2019 report estimated the mortality rate (ASMR) of LivCa in the MENA region in 2019 to be 6.2 (95% UI: 7.6, 5.1), broken down into 8.6 (95% UI: 6.8, 10.8) for males and 3.7 (95% UI: 3.1, 4.5) for females. 13 Using a different standard world population, the Globocan Today report estimated the ASMRw for LivCa in 2020 to be 5.4 (ie, the average of the ASMRw calculated based on the exhibited rates for all the MENA countries). When considering gender-specific rates, this estimate indicates a rate of 6.8 for males and 4.1 for females. 4
Burden of Liver Cancer Based on Etiology
Major Etiologies of Age-Standardized Liver Cancer DALYs
HBV infection was the leading etiology of age-standardized LivCa DALY in the world in 1990 and 2019, followed by HCV infection, alcohol consumption, and NASH. However, in the same years, HCV infection was the leading etiology of age-standardized LivCa DALYs in the MENA region, followed by HBV infection, with NASH coming in third in 2019, ahead of alcohol consumption.
Age-Standardized HBV-Related LivCa DALY Rates (Table 4)
Liver Cancer Age-Standardized DALY Rates (per 100,000) and Causes Based on GBD in 1990 and 2019: A Comparison Across the World, MENA Region, and MENA Countries.

APC: annual percent change; DALY: disease-adjusted life year; GBD: global burden of disease; HBV: hepatitis B virus; HCV: hepatitis C virus; MENA: Middle East and North Africa; NASH: non-alcoholic steatohepatitis; UI: uncertainty index.
*Indicates that the APC is significantly different from zero at the alpha = .05 level.
In the MENA region, Afghanistan followed by Qatar and Egypt, had the highest age-standardized HBV-related LivCa DALY rates in both 1990 and 2019.
Examining the MENA region’s trends further, age-standardized HBV-related LivCa DALY rates went down the most in Türkiye, then in Kuwait, Saudi Arabia, Jordan, and Qatar. On the other hand, they went up in Iraq, then in the UAE, Algeria, and Egypt (Figure 1).
The JRP calculated the APC of age-standardized HBV-related LivCa DALY rates for the years 1990 to 2019. This analysis revealed a significant decreasing trend in global rates (APC: −3.79) and in the MENA region (APC: −.64), although the decrease in the MENA region was less pronounced. In contrast, there was a significant increasing trend in Iraq, Egypt, Oman, Algeria, and the UAE (Table 3).
Age-Standardized HCV-Related LivCa DALY Rates (Table 4)
Globally, there was a significant decrease in age-standardized HCV-related LivCa DALY rates from 49.7 in 1990 to 35.0 in 2019, representing a decrease of 29.6%. In the MENA region, there was also a decrease, albeit to a much lesser extent, from 73.2 in 1990 to 70.9 in 2019, amounting to a reduction of 3.1%.
In the MENA region, Egypt had by far the highest age-standardized HCV-related LivCa DALY rates in 1990 and 2019, followed by Qatar, and Afghanistan.
Examining the MENA region’s trends further, age-standardized HCV-related LivCa DALY rates went down the most in Jordan, then in Palestine, Türkiye, and Iran. On the other hand, they went up the most in Iraq, then in Algeria, Egypt, and Morocco. (Figure 1).
Liver Cancer Age-Standardized Incidence Rates (ASIR per 100,000) and Causes Based on GBD in 1990 and 2019: A Comparison Across the World, MENA Region, and MENA Countries.

APC: annual percent change; DALY: disease-adjusted life year; GBD: global burden of disease; HBV: hepatitis B virus; HCV: hepatitis C virus; MENA: Middle East and North Africa; NASH: non-alcoholic steatohepatitis; UI: uncertainty index.
*Indicates that the APC is significantly different from zero at the alpha = .05 level.
NASH‐Related Age-Standardized LivCa DALY Rates (Table 4)
Globally, there was a significant decrease in age-standardized NASH-related LivCa DALY rates, which dropped from 11.35 in 1990 to 9.64 in 2019, representing a decline of 15.1%. In stark contrast, the MENA region witnessed a substantial increase in age-standardized NASH-related LivCa DALY rates, rising from 11.92 in 1990 to 15.25 in 2019 (ie, an increase of 27.9%).
In the MENA region, Egypt had the highest age-standardized NASH-related LivCa DALY rates in 2019, followed by Qatar and Afghanistan. In 1990, Qatar held the top position, with Egypt ranking second.
Examining the MENA region’s trends further, age-standardized NASH-related LivCa DALY rates increased the most in Egypt, followed by Oman, Algeria, Iraq, the UAE, Morocco, and Sudan. Conversely, the rates decreased the most in Palestine, followed by Jordan and Türkiye (Figure 1).
The JRP conducted an analysis to calculate the APC of age-standardized NASH-related LivCa DALY rates from 1990 to 2019. The results revealed a significant decreasing trend in the global rates (APC: −1.22). In contrast, the MENA region exhibited a significant increasing trend (APC: +1.12). More specifically, several MENA countries, notably Egypt, Oman, Iraq, Algeria, and the UAE, experienced a significant upward trend, while Palestine, Iran, Bahrain, Jordan, Türkiye, and Afghanistan demonstrated a significant decreasing trend (Table 4).
Alcohol-Related Age-Standardized LivCa DALY Rates (Table 4)
Globally, age-standardized alcohol-related LivCa DALYs decreased from 30.59 in 1990 to 26.07 in 2019 (−14.8%), while it increased in the MENA region from 13.95 in 1990 to 14.62 in 2019 (+4.8%).
In the MENA region, Egypt had the highest age-standardized alcohol-related LivCa DALY rates in 2019, followed by Qatar and Afghanistan. In 1990, Qatar held the top position, with Egypt ranking second.
Examining the MENA region’s trends further, age-standardized alcohol-related LivCa DALY rates increased the most in Egypt, followed by Algeria, Iraq, Morocco, Oman, and Sudan. Conversely, the rates decreased the most in Bahrain, followed by Türkiye, Iran, and Palestine (Figure 1).
The JRP conducted an analysis to calculate the APC of age-standardized alcohol-related LivCa DALY rates from 1990 to 2019. The results revealed a significant decreasing trend in the global rates (APC: −1.01). In contrast, the MENA region exhibited a significant increasing trend (APC: +.53). More specifically, several MENA countries, notably Egypt, Oman, Iraq, Algeria, Morocco, Sudan, and Yemen experienced a significant upward trend, while Bahrain, Iran, Türkiye, Saudi Arabia, Jordan, Syria, Palestine, Lebanon, Afghanistan, and Qatar demonstrated a significant decreasing trend (Table 4).
Other Causes-Related Age-Standardized LivCa DALY Rates (Table 4)
Globally, age-standardized LivCa DALYs attributable to other causes decreased significantly from 20.89 in 1990 to 11.24 in 2019 (−46.2%). In the MENA region, the decrease from 13.23 in 1990 to 11.59 in 2019 (−12.4%) was much less.
In the MENA region, Egypt had the highest age-standardized LivCa DALY rates attributable to other causes, followed by Afghanistan, and Qatar.
Examining the MENA region’s trends further, age-standardized LivCa DALY rates attributable to other causes increased the most in Iraq, followed by Oman, and Yemen. Conversely, the rates decreased the most in Kuwait, Palestine, Türkiye, followed by Tunisia and Iran (Figure 1).
The JRP conducted an analysis to calculate the APC of age-standardized LivCa DALY rates attributable to other causes from 1990 to 2019. The results revealed a significant decreasing trend in the global rates (APC: −2.97) and a marginally non-significant decreasing trend in the MENA region (APC: −0.09). In the MENA region, a significant downward trend was noticed mostly in Jordan, Saudi Arabia, Bahrain, Iran, Türkiye, Palestine, and Tunisia. In contrast Oman, Egypt, and Iraq had a significant upward trend (Table 4).
Major Etiologies of Age-Standardized Liver Cancer Incidence Rates (ASIR)
HBV infection was the leading etiology of LivCa ASIR in the world in 1990 and 2019, followed by HCV infection, and alcohol consumption, with NASH coming fourth in 2019 ahead of other causes. However, in the same years, HCV infection was the leading etiology of LivCa ASIR in the MENA region, followed by HBV infection, with NASH coming in third in 2019, ahead of alcohol consumption and other causes.
HBV-Related LivCa ASIR (Table 5)
Globally, there was a significant decrease in the HBV-related LivCa ASIR from 4.6 in 1990 to 2.6 in 2019, representing a decrease of 43.0%. In the MENA region, there was also a decrease, albeit to a lesser extent, from 1.7 in 1990 to 1.2 in 2019, amounting to a reduction of 9.2%.
In the MENA region, Qatar followed by Afghanistan and Egypt, had the highest HBV-related LivCa ASIR in both 1990 and 2019.
Examining the MENA region’s trends further, HBV-related LivCa ASIR went down the most in Türkiye, then in Jordan, Palestine, Kuwait, Afghanistan, and Syria (Figure 1). On the other hand, they went up the most in Iraq, then in Algeria, the UAE, Egypt, and Oman (Figure 1).
The JRP calculated the APC of HBV-related LivCa ASIR for the years 1990 to 2019. These analyses revealed a significant decreasing trend in global rates (APC: −3.10) and in the MENA region (APC: −0.34), although the decrease in the MENA region was less pronounced. In contrast, there was a significant increasing trend in Iraq, Oman, Egypt, Algeria, and the UAE (Table 3).
HCV-Related LivCa ASIR (Table 5)
Globally, there was a significant decrease in the HCV-related LivCa ASIR from 2.2 in 1990 to 1.9 in 2019, representing a decrease of 13.3%. In the MENA region, however, there was a slight increase from 3.0 in 1990 to 3.1 in 2019, amounting to an increase of 3.4%.
In the MENA region, Egypt had by far the highest HCV-related LivCa ASIR in both 1990 and 2019, followed by Qatar and Afghanistan.
Examining the MENA region’s trends further, HCV-related LivCa ASIR went up the most in Iraq, then in Algeria, Egypt, and Oman. On the other hand, they went down the most in Palestine, then in Jordan, Afghanistan, and Iran (Figure 1).
The JRP calculated the APC of HCV-related LivCa ASIR for the years 1990 to 2019. These analyses revealed a significant decreasing trend in global rates (APC: −1.04), whereas the MENA region had a significant increasing trend (APC: +.71) (Table 3). Further analyses for the MENA countries revealed that there was a significant increasing trend in Egypt, Iraq, Oman, Qatar, Algeria, Kuwait, Tunisia, Lebanon, Morocco, and Libya (Table 3). On the other hand, there was a significant decreasing trend in Jordan, Palestine, Afghanistan, Bahrain, and Syria.
NASH‐Related LivCa ASIR (Table 5)
Globally, there was an increase in NASH-related LivCa ASIR from .44 in 1990 to 0.45 in 2019, representing a decline of 1.2%. In stark contrast, the MENA region witnessed a substantial increase in NASH-related LivCa ASIR, rising from .48 in 1990 to .46 in 2019 (ie, an increase of 40.9%).
In the MENA region, Qatar had the highest NASH-related LivCa ASIR in 1990 and 2019, followed by Egypt and Afghanistan.
Examining the MENA region’s trends further, NASH-related LivCa ASIR increased the most in Oman, followed by Egypt, Algeria, Iraq, and Saudi Arabia. Conversely, the rates decreased the most in Palestine, followed by Afghanistan (Figure 1).
The JRP conducted an analysis to calculate the APC of NASH-related LivCa ASIR from 1990 to 2019. The results revealed a significant decreasing trend in global rates (APC: −.51). In contrast, the MENA region exhibited a significant increasing trend (APC: +1.49). More specifically, most MENA countries, notably Oman, Egypt, Iraq, Algeria, Kuwait, Qatar, Saudi Arabia, Lebanon, Tunisia, Sudan, the UAE, and Morocco, experienced a significant upward trend. Bahrain and Jordan had a non-significant upward trend, while only Palestine and Iran demonstrated a significant decreasing trend (Table 5).
Alcohol-Related LivCa ASIR (Table 5)
Globally, alcohol-related LivCa ASIR decreased marginally from 1.20 in 1990 to 1.19 in 2019 (−.4%), while it increased in the MENA region from .55 in 1990 to .61 in 2019 (+10.4%).
In the MENA region, Qatar had the highest alcohol-related LivCa ASIR in 1990 and 2019, followed by Egypt and Afghanistan.
Examining the MENA region’s trends further, alcohol-related LivCa ASIR increased the most in Egypt, followed by Algeria, Iraq, and Morocco. Conversely, the rates decreased the most in Bahrain, followed by Palestine, Iran, Afghanistan, and Türkiye (Figure 1).
The JRP conducted an analysis to calculate the APC of alcohol-related LivCa ASIR from 1990 to 2019. The results revealed a significant decreasing trend in the global rates (APC: −.40). In contrast, the MENA region exhibited a significant increasing trend (APC: +.71). More specifically, several MENA countries, notably Egypt, Oman, Iraq, Algeria, Qatar, and Kuwait experienced a significant upward trend. Saudi Arabia, Lebanon and the UAE had a non-significant increasing trend. On the other hand, Bahrain, Iran, Palestine, Afghanistan, Jordan, Syria, and Türkiye demonstrated a significant decreasing trend (Table 5).
Other Causes-Related LivCa ASIR (Table 5)
Globally, LivCa ASIR attributable to other causes decreased significantly from .56 in 1990 to .35 in 2019 (−36.5%), while they increased in the MENA region from .37 in 1990 to .38 in 2019 (+3.9%).
In the MENA region, Egypt had the highest LivCa ASIR attributable to other causes in 1990 and 2019. In 2019, Qatar surpassed Afghanistan to become the second highest.
Examining the MENA region’s trends further, LivCa ASIR attributable to other causes are presented in Figure 1.
The JRP conducted an analysis to calculate the APC of LivCa ASIR attributable to other causes from 1990 to 2019. The results revealed a significant decreasing trend in global rates (APC: −2.45), while the MENA region witnessed a significant increasing trend (APC: +.50). Details about the trends in different MENA countries are presented in Table 5.
Discussion
The age-standardized LivCa incidence (ASIR), mortality (ASMR), and disability-adjusted life years (DALYs) rates in the MENA region remain below the global averages except for Egypt; yet, the region showed a worrisome increase in these rates from 1990 to 2019, contrary to the global decrease.
HBV and HCV infections account for approximately 70% of LivCa incidence rates (ASIR) globally (69.1%) and in the MENA region (73.3%). HBV infections remain the predominant cause of LivCa globally, while HCV infections are the primary cause of LivCa in the MENA region, probably due to the high rate of these infections in Egypt, which has the highest population in the region. In fact, Egypt is known to have the second-highest age-standardized HCV-related LivCa DALY rate globally after Mongolia. 9
The Global Health Sector Strategy to eliminate hepatitis infection by 2030 was approved during the 69th World Health Assembly in 2016. The World Health Organization (WHO) set a target of 90% reduction in new HBV and HCV cases and a 65% decline in HBV and HCV-related mortality.19,20 In 2023, the WHO estimated that around 354 million people worldwide live with hepatitis B or C, and for most, testing and treatment remain beyond reach. 21 A new WHO comprehensive global sector strategy was developed for the years 2022 to 2030 with novel approaches and hepatitis-related measures for countries to implement.21,22
In 2015, the global prevalence of viremic HCV was estimated to be 1.0% (95% uncertainty interval .8-1.1), corresponding to approximately 71.1 million people (62.5-79.4) suffering from chronic HCV infection. 23 The WHO estimated a worldwide prevalence of chronic HCV of approximately 50 million people in 2022, with roughly 1.0 million new HCV infections reported annually. 24 Chronic HCV infection resulted in approximately 399,000 deaths in 2015 and 242,000 deaths in 2022, primarily attributed to complications such as liver cirrhosis and HCC.24,25 The Eastern Mediterranean Region and the European Region bear the highest burden of HCV, with 12 million people having chronic HCV in each region in 2019. 24 HCV infection has been a prevalent chronic liver disease in the MENA region (1.7%), with several countries showing an estimated high prevalence rate (>1.0%) of viremia in 2015, such as Egypt (6.3%), Syria (3.0%), Qatar (1.6%), and the UAE (1.3%). 23
According to the GBD 2019 data, the incidence rate of HCV-related LivCa exhibited a concerning increase (+48.8%) from 1990 to 2019, with a significantly rising trend (APC: +2.0), underscoring the need for more comprehensive interventions in most MENA countries.
On a global scale, Egypt experienced the highest transmission of blood-borne pathogens within the general population. 26 This was largely due to the widespread use of intravenous anti-schistosomiasis therapy in Egypt since the 1920s, often performed with inadequate sterile techniques. 26 In Egypt, according to blood-bank surveys, the HCV seroprevalence reached up to 40% in certain areas, such as the Nile delta region that has the highest infection rates of schistosomiasis.26-28 In the late 20th century (1960-1982), the Egyptian Ministry of Health, under the guidance and support of the WHO, introduced a community-wide mass anti-schistosomal therapy, which was administered intravenously reaching over 36 million injections during the 18-year period.26,29,30 This approach accelerated the transmission of HCV and other blood-borne pathogens in Egypt.26,31 Most carriers were asymptomatic with absence of acute clinical symptoms in 80% of HCV infections. 31 In Egypt, the prevalence of population with seropositive HCV antibodies was estimated to be 15% in 2008 (aged 15 to 59 years), and it decreased to 6% in 2014 (aged 1 to 59 years).32,33
To achieve the WHO’s global hepatitis C strategy targets by 2030, it is crucial to establish convenient testing access and ensure that 60% of eligible individuals with chronic HCV have access to treatment. 20 Many MENA countries now have access to HCV antiviral therapy utilizing direct-acting antiviral agents. 34 Egypt and Qatar stand out as pioneering countries on the path to eliminating HCV by 2030 in the MENA region.35,36 Following the control and elimination initiatives conducted from 2014 to 2020, Egypt succeeded in screening over 50 million citizens and providing locally manufactured direct-acting antiviral medicines to 4 million patients with chronic HCV. 37 Qatar’s mass HCV screening has resulted in the diagnosis and treatment of 4400 patients between 2010 and 2016.38,39 It is very likely that these endeavors will contribute to a decreasing trend in LivCa rates associated with HCV in the coming decade. However, it is important to note that some MENA countries like Syria and Afghanistan face a considerable challenge in this regard, given its current economic and public health challenges.
HBV represents a significant global health concern. According to WHO estimates from 2022, the worldwide prevalence of chronic HBV infection stood at approximately 254 million people with roughly 1.2 million new HBV infections reported annually, and approximately 1.1 million deaths attributed to complications associated with HBV such as liver cirrhosis and HCC. 24 The highest burden of HBV prevalence is primarily concentrated in the WHO Western Pacific region, followed by the African region, South-East Asia Region, and the Eastern Mediterranean region. 24
According to Gasim, chronic HBV infection prevalence in Western Europe and North America was generally less than 1% of the general population. In contrast, countries in the MENA region can typically be categorized as having either intermediate or high infection rates. These rates vary from 0 to 6% in Iraq, 3.5% in Kuwait, and 3.6% in Algeria to 4.25% in Saudi Arabia, 5.1% in Yemen, and exceeding 8.0% in Sudan. Existing data suggests that without swift and effective intervention, the number of cases is expected to increase.40,41
While age-standardized rates for HBV-related liver cancer (DALYs, ASIR, ASMR) decreased globally between 1990 and 2019, this reduction was relatively modest in the MENA region. Although HBV-related liver cancer rates in MENA countries are generally lower than the global rates, with the exception of Qatar, Afghanistan, and Egypt, some MENA nations, notably Iraq, Oman, Egypt, Algeria, and the UAE, witnessed a significant increasing trend in these rates between 1990 and 2019. Therefore, it is imperative to intensify efforts in these countries through the implementation of a comprehensive national immunization program that offers Hepatitis B vaccines at birth followed by 2 or 3 doses. There is also a critical need to ensure ready access to personal protective equipment when necessary.42,43 Furthermore, it is essential to provide education, robust screening processes, and access to treatment for individuals who are at a high risk of hepatitis B infection. This multi-pronged approach is vital for effectively combating hepatitis B in the region. Indeed, the incidence and prevalence of HBV infection have significantly declined in the MENA region due to the implementation of safety measures and effective universal vaccination programs in most MENA countries. Nevertheless, the transmission of HBV remains a notable risk in some developing countries due to limited access to personal protective equipment and HBV vaccination. 44 To achieve the WHO’s global hepatitis B strategy targets by 2030, it is crucial for example to ensure that 90% of newborns benefit from a timely birth dose of hepatitis B vaccine and from other interventions to prevent the vertical (mother-to-child) transmission of hepatitis B virus. 42 It is also crucial to reach the 90% of Hepatitis B vaccine coverage among children (third dose). 42 According to the Global Health Observatory, the estimated rates of hepatitis B immunization coverage among 1-year-olds varied significantly among MENA countries in 2022. 43 The highest rates were reported in Iran, Morocco, Oman, Palestine, and Qatar (99%), while the lowest rates were found in Syria (46%), Lebanon (67%), Afghanistan (69%), Libya (73%), Yemen (74%), Algeria and Jordan (77%), and Sudan (84%). Another WHO target for 2030 is to reduce the prevalence of Hepatitis B surface antigen (HBsAg) among children under 5 years old to .1%. 43 Based on the Global Health Observatory, these rates varied significantly between MENA countries in 2020. Some MENA countries have achieved the WHO’s 2030 target of .1%, namely, Saudi Arabia (0%), the UAE (.02%), Bahrain and Kuwait (.03%), Qatar and Iran (.05%), Lebanon (.07%), and Algeria (.08%). On the other hand, Yemen (1.76%), Sudan (1.66%), Syria (.69%), Jordan (.56%), Libya (.43%), Afghanistan (.39%), and Iraq (.29%) are still far from achieving the WHO 2030 target of .1%. Hence, many MENA countries should intensify their endeavors and maintain investments in primary prevention. This includes ensuring hepatitis B vaccination for infants and high-risk populations, enhancing the safety of medical injections and procedures, implementing comprehensive preventive measures such as harm reduction, and providing evidence-based interventions for people who inject drugs. Additionally, ensuring access to hepatitis B testing and treatment, particularly in high-risk populations, is essential. 42
Although chronic HCV and HBV have been identified as the primary and secondary causes of LivCa in the MENA region, there has been a significant increase in age-standardized rates of LivCa related to NASH and to a lesser extent to alcohol consumption, in contrast to the decreasing global trends. These changing trends are indicative of a notable shift in the primary causes of HCC within the MENA region. This shift suggests a move from chronic viral liver diseases as the predominant causes of LivCa, toward non-viral liver diseases as increasingly significant causes in the near future.
Globally, NAFLD is a leading cause of liver-related morbidity and mortality with a substantial increase in cases over the years. 45 A meta-analysis spanning from 1990 to 2019 revealed that NAFLD affects around 30.1% of the global population, making it the leading cause of chronic liver disease (CLD). 45 Regional variations in NAFLD prevalence were noted, with Latin America (44.4%), the MENA region (36.5%) and South America (33.8%) having the highest rates. 45 Recent data from the GBD study, covering the period from 2009 to 2019, showed that NAFLD is the fastest-growing contributor to the global burden of CLD, leading to complications such as cirrhosis and LivCa.46,47 MENA represented 8.9% of global LC-NAFLD incidence and 8.6% of LC-NAFLD-related deaths. 46 Due to their widespread occurrence, NAFLD has become the most prevalent CLD worldwide and a primary reason for liver transplants.46,48 The global rise in NAFLD cases is attributed to the increasing rates of significant risk factors, namely obesity, insulin resistance or overt type 2 diabetes mellitus (T2DM), and metabolic syndrome (hypertension, T2DM, and dyslipidemia).15,46,49 The burden of NASH is also increasing globally, with roughly one-third of NAFLD cases progressing to NASH. 50 However, the diagnosis of NASH relies on liver histology data, making the exact prevalence uncertain. Current estimates suggest that NASH affects about 20% of individuals with NAFLD.51,52 It also affects approximately 3-5% of the global population, with many individuals experiencing multiple comorbidities. 53 The global prevalence of NASH has increased significantly over the past 15 years and is expected to continue its upward trajectory, driven by the rising prevalence of obesity and type 2 diabetes. In fact, a comprehensive meta-analysis across 22 countries found that 80% of NASH patients are overweight, 72% have dyslipidemia, and 44% have T2DM.15,54 These statistics underscore the growing global health challenge presented by NAFLD and NASH. Indeed, there has been a worldwide rise in the prevalence of excess weight and T2DM in recent decades namely in countries that have been undergoing significant shifts in their epidemiological patterns, particularly in Asia, and the MENA region. This was largely attributed to changes in living environments and lifestyles, which have resulted in a decrease in the quality of nutrition and a surge in sedentary behaviors. 55 A recent meta-analysis revealed a high prevalence of obesity in Middle eastern countries despite the stable rates of obesity and overweight over the last 20 years (2000-2020). 56
Many countries in the MENA region have had relatively low levels of alcohol consumption due to cultural and religious reasons. However, an increasing shift in alcohol consumption was noted in recent years due to several possible factors: a growing population, cultural transitions, considering the use of alcohol as a symbol of modernization and westernization by young people, increased exposure to different lifestyles and attitudes through media, the normalization of alcohol consumption, and marketing strategies used by alcohol suppliers and distributors. 57 According to the World Bank, total alcohol consumption (liters of pure alcohol) per capita for individuals aged 15 years and older in 2019 was .53, compared to .40 in 2000, indicating a 33.5% increase in the MENA region. 58 This upward trend was observed in most MENA countries, except for Bahrain, Lebanon, Syria, Türkiye, and Yemen. Lebanon, Syria, and Yemen experienced political and economic challenges during this period, which may partially explain their declining trend. In the MENA region, the highest consumption in 2010 was recorded in Bahrain (2.7 liters per capita), followed by Türkiye (2.5), Lebanon (2.3), and the UAE (1.8). In 2019, the MENA region saw the highest alcohol consumption in the UAE (2.4 liters per capita), followed by Tunisia (2.0), Türkiye (1.8), and Bahrain (1.6). Although these rates are still significantly lower than those in Western countries in 2019 (eg, 11.0 in the European Union, 10.8 in the United Kingdom, 10.0 in Australia, and 9.6 in the United States of America), 58 the issue of alcohol consumption in the MENA countries requires attention and action. 57
Finally, it is worth noting that ambient air pollution can expedite the inflammation and steatosis of the liver, contributing to increase in liver cancer incidence and mortality. 59
LivCa is a multifaceted and serious public health issue in the MENA region. Its control faces unique challenges in a region that is well known for its diversity, varying levels of health care infrastructure, and disparities in access to cancer screening, early diagnosis and treatment. Multiple factors contribute to the increased LivCa rates in the MENA region. The high prevalence of chronic viral hepatitis C and B infections remains a prominent factor. Furthermore, lifestyle-related factors, such as a relatively high prevalence of obesity, T2DM, metabolic syndrome, NAFLD/NASH, and alcohol consumption, add to the region’s burden of non-viral related-LivCa. The new trends underscore the importance of addressing viral and non-viral liver diseases, as their contribution to LivCa rates becomes more prominent. Effectively tackling the challenge of LivCa in the MENA region demands a comprehensive strategy that encompasses different public health initiatives. These include promotion of hepatitis B vaccination, improving health care infrastructure, expanding access to screening and treatment services, and raising awareness on lifestyle-related viral and non-viral risk factors with main focus on NASH and alcohol consumption. The MENA region can then work towards reducing the burden of LivCa and improving the overall health of its diverse populations.
Limitations
Our study relied on LivCa estimates by the GBD 2019 database. Cancer and risk factors data in the Global Burden of Diseases (GBD) study, while crucial for informing health policies and resource allocation, faces significant challenges related to data quality. 60 The primary sources, including population-based cancer registries, vital registration systems, and hospital records, often suffer from underreporting, misclassification, and inconsistent coding, especially in low- and middle-income countries. These data sources undergo rigorous quality control and standardization processes to enhance validity, but discrepancies and gaps remain. The main pitfalls include incomplete data, varying diagnostic criteria, and healthcare access disparities, all of which can lead to inaccuracies in estimating the true cancer and risk factors burden. Addressing these issues requires improved data collection methods, enhanced standardization, and investment in health information systems. Moreover, in the MENA region, cancer and risk factors registration, particularly population-based registration, is underdeveloped. 61 It exhibits significant disparities between countries and is confronted with numerous logistical, political, financial, and conflict-related obstacles.
Conclusion
LivCa emerges as a critical public health concern in the MENA region, characterized by rising rates linked to chronic viral hepatitis, NASH, and evolving trends in alcohol consumption. The unique challenges posed by diverse populations and health care infrastructure variations necessitate a comprehensive strategy. Promoting hepatitis B vaccination, enhancing health care access, and addressing lifestyle-related risk factors are imperative. However, disparities in cancer registration hinder accurate assessments. Urgent, coordinated efforts are crucial to implement evidence-based interventions and awareness campaigns, ultimately mitigating the increasing burden of LivCa and fostering improved health outcomes across the MENA region.
Footnotes
Declaration of Conflicting Interests
The author(s) declared no potential conflicts of interest with respect to the research, authorship, and/or publication of this article.
Funding
The author(s) received no financial support for the research, authorship, and/or publication of this article.