
Abstract
Purpose
The aim of this study was to develop a novel nomogram to predict cancer-associated venous thromboembolism (CAT) in hospitalized patients with cancer who receive chemoradiotherapy.
Methods
This was a retrospective cohort study of hospitalized patients with cancer who received chemoradiotherapy between January 2010 and December 2022. Predictive factors for CAT were determined using univariate and multivariate logistic regression analyses, and a risk prediction model based on the nomogram was constructed and validated internally. Nomogram performance was assessed using receiver operating characteristic (ROC), calibration curve, and decision curve analysis (DCA).
Results
A total of 778 patients were eligible for inclusion in this study. The nomogram incorporated 5 independent risk factors: age, cancer stage, use of nonsteroidal anti-inflammatory drugs, D-dimer levels, and history of diabetes mellitus. The area under the curve (AUC) of the nomogram for the training and validation cohorts was 0.816 and 0.781, respectively, with 95% confidence intervals (CIs) of 0.770-0.861 and 0.703-0.860, respectively. The calibration and DCA curves also displayed good agreement and clinical applicability of the nomogram model.
Conclusions
The incidence of CAT was relatively high among patients with cancer receiving chemoradiotherapy. The nomogram risk model developed in this study has good prediction efficiency and can provide a reference for the clinical evaluation of the risk of adverse outcomes in patients with cancer receiving chemoradiotherapy.
Introduction
Cancer-related venous thromboembolism (CAT) is a common life-threatening disease with a significantly increasing incidence over the past several decades. 1 Increasing evidence indicates that CAT is significantly associated with cancer treatment interruption, decreased quality of life, and increased economic burden and is the second highest cause of death in patients with cancer. 2 Combined chemoradiotherapy plays an important role in antitumor therapy and has become the standard treatment for multiple locally advanced solid tumors. 3 Chemoradiotherapy has become an independent risk factor for CAT, reportedly 2-6 times greater than that of patients not receiving chemoradiotherapy.4,5 Multiple mechanisms may explain the increased risk of developing CAT caused by chemoradiotherapy. 6 Ionizing radiation generated by radiotherapy and the chemical infusion of chemotherapeutics can damage endothelial cells and promote an inflammatory response. In addition, chemoradiotherapy can affect the levels of various prothrombotic and hypercoagulant molecules, thus creating a prothrombotic environment in the body.7,8
To reduce the risk of CAT, the National Comprehensive Cancer Network (NCCN) guidelines of 2022 recommended risk screening models to identify patients at high risk of developing venous thromboembolism (VTE). 9 Several models, including the widely known Khorana model, 10 COMPASS-CAT score, 11 and a derivative model developed from the Khorana model, have been used to predict CAT risk. These include the Vienna score, 12 PROTECHT score, 13 ONKOTEV score, 14 and CATS/MICA score. 15 However, when these scores have been used to categorize patients in randomized controlled trials, they have failed to identify a significant proportion of patients with cancer who develop CAT 11 In addition, these models are mainly applied to outpatients, patients receiving chemotherapy, and other patients without distinguishing between therapeutic regimens, thereby neglecting the unique characteristics of patients receiving chemoradiotherapy in particular treatment subgroups. Consequently, applying these models to predict the CAT risk in patients receiving chemoradiotherapy presents notable limitations owing to their inability to encompass all relevant CAT risk factors, particularly those associated with radiotherapy.10-12 Existing studies on specific VTE risk assessments for patients with cancer receiving chemoradiotherapy are mostly univariate studies.16-20 Thus, there is an urgent need to develop a specific CAT prediction model for patients with cancer receiving chemoradiotherapy.
A nomogram was constructed using a multifactor regression model, and each predictive variable was scored according to its contribution to the outcome variable. This method converts complex equations into visual graphics, thereby increasing the readability and practicality of the results. 21 Relevant scholars at home and abroad have actively explored the application of nomograms in the field of chemoradiotherapy risk assessment, which has fully demonstrated their benefits in constructing accurate risk assessment models. 22
Therefore, in the present study, we analyzed the overall survival status of patients with cancer treated with chemoradiotherapy who developed CAT and subsequently developed and validated a specific risk stratification nomogram model to predict the risk of CAT development. Using this model, clinicians can implement early prevention and treatment strategies to reduce the risk of CAT.
Methods
Study Design and Population
This retrospective cohort study was conducted at a single institution, namely Chongqing University Cancer Hospital. The study was approved by the Ethics Committee of Chongqing University Cancer Hospital (CZLS2023085-A; approval date: 14 May 2023). The requirement for obtaining patient consent was waived due to the retrospective nature of the study. Data were collected from patients who received chemotherapy between January 2010 and December 2022. Inclusion criteria were as follows: patients who (1) had cancer diagnosed histopathologically; (2) underwent sequential chemoradiotherapy (SCRT) or concurrent chemoradiotherapy (CCRT); (3) were aged >18 years; and (4) were hospitalized. The exclusion criteria were as follows: patients who (1) died within 48 h after admission; (2) were diagnosed with non-solid neoplasm; (3) were receiving concurrent cytotoxic, biologic, or immunologic therapy for other conditions, or continuous single-agent chemotherapy; (4) had abnormal coagulation functions and active infections requiring treatment; (5) were using anticoagulant drugs and nonsteroidal anti-inflammatory drugs (NSAIDs); (6) were pregnant or lactating, and (7) had incomplete information in their records. Ultimately, a total of 778 patients were evaluated in the study and randomly assigned to the training (n = 598) or the validation (n = 180) cohorts. The reporting of this study conforms to the TRIPOD guidelines. 23
Clinical Outcome Measures and Definitions
In this study, the primary outcome used for grouping was the occurrence of CAT events observed during chemoradiotherapy. Chemoradiotherapy treatment entails a comprehensive therapeutic regimen comprising 25-30 sessions of radiotherapy administered over 5-6 weeks, accompanied by a chemotherapy cycle lasting approximately 3-4 weeks (ranging from 1 to 6 months). We did not conduct follow-ups for post-treatment CAT events because more than 80% of these events occurred during chemoradiotherapy, posing a significant threat to patients’ lives.24,25 CAT includes deep venous thrombosis (DVT) and pulmonary embolism (PE). Typical clinical symptoms combined with laboratory test results were used to determine whether patients with cancer should undergo imaging examinations (venous ultrasound and computed tomography [CT] pulmonary arteriography). Imaging is the gold standard for diagnosing CAT. This diagnostic procedure was performed in accordance with the CAT diagnostic guidelines in China. 26
Clinical Data Collection
The following data were obtained from the clinical electronic record system: Clinical variables known to be associated with CAT collected at baseline, including sex, age, body mass index (BMI), smoking history, cancer type, cancer stage, metastasis status, presence of comorbidities (hypertension, diabetes mellitus, chronic pulmonary disease, or cerebral infarction), surgical history, and available laboratory parameters within 3 d before chemoradiotherapy, including complete blood counts, liver and kidney function tests, and coagulation profile assessments, were considered. We also collected data on the use of NSAIDs, deep vein catheterization, cisplatin, radiotherapy sites, radiation doses, and chemotherapy cycles when the CAT occurred. As the data were collected retrospectively by data collection specialists, the researchers were blinded to the predictor variables and outcomes.
Statistical Analysis
Data analysis was performed using SPSS 22.0 and R version 4.1.0 software. Mean imputation was employed in our study to address missing data because there were limited missing values. Considering the variable distribution in the complete dataset, we selected the mean or median padding based on whether they were normally distributed. General clinical data usage rates and percentages were described. Using the chi-squared test, the CMH chi-squared test or Fisher’s exact probability test, and the Wilcoxon rank-sum test for group comparisons to identify variables significantly associated with CAT were included in the multivariate models. False discovery rate (FDR) correction was applied to adjust the type I error thresholds for multiple comparisons, as this step was exploratory. To avoid missing related variables, so long as variables were both statistically associated with the primary outcome in the bivariate analysis (at the P of FDR correction <0.2), they were included in the multivariate logistic regression. Multivariate logistic regression models were constructed to calculate the regression coefficients, odds ratios (ORs), and 95% confidence intervals (CIs) for each risk factor and identify independent predictive risk factors. A visual nomogram was established based on the predicted risk factors. Decision (DCA) and calibration curves were used to calculate the clinical applicability and accuracy of the model in the training and validation cohorts. The area under the receiver operating characteristic (ROC) curve (AUC) was used to evaluate the predictive efficacy and utility of the nomogram compared with the widely known Khorana model using the DeLong test. All P-values were two-tailed, and P < 0.05 was considered statistically significant.
Results
Clinical and Demographic Characteristics of the Study Population
Patient Characteristics in the Training and Validation Cohort.

ISR: International standardized ratio; LDL: Low density lipoprotein; NSAIDs: nonsteroidal anti-inflammatory drugs.
Independent Risk Factors for CAT in the Training Cohort
Results of Univariate Analysis for the Prediction of Incidence of of CAT in the training cohort.
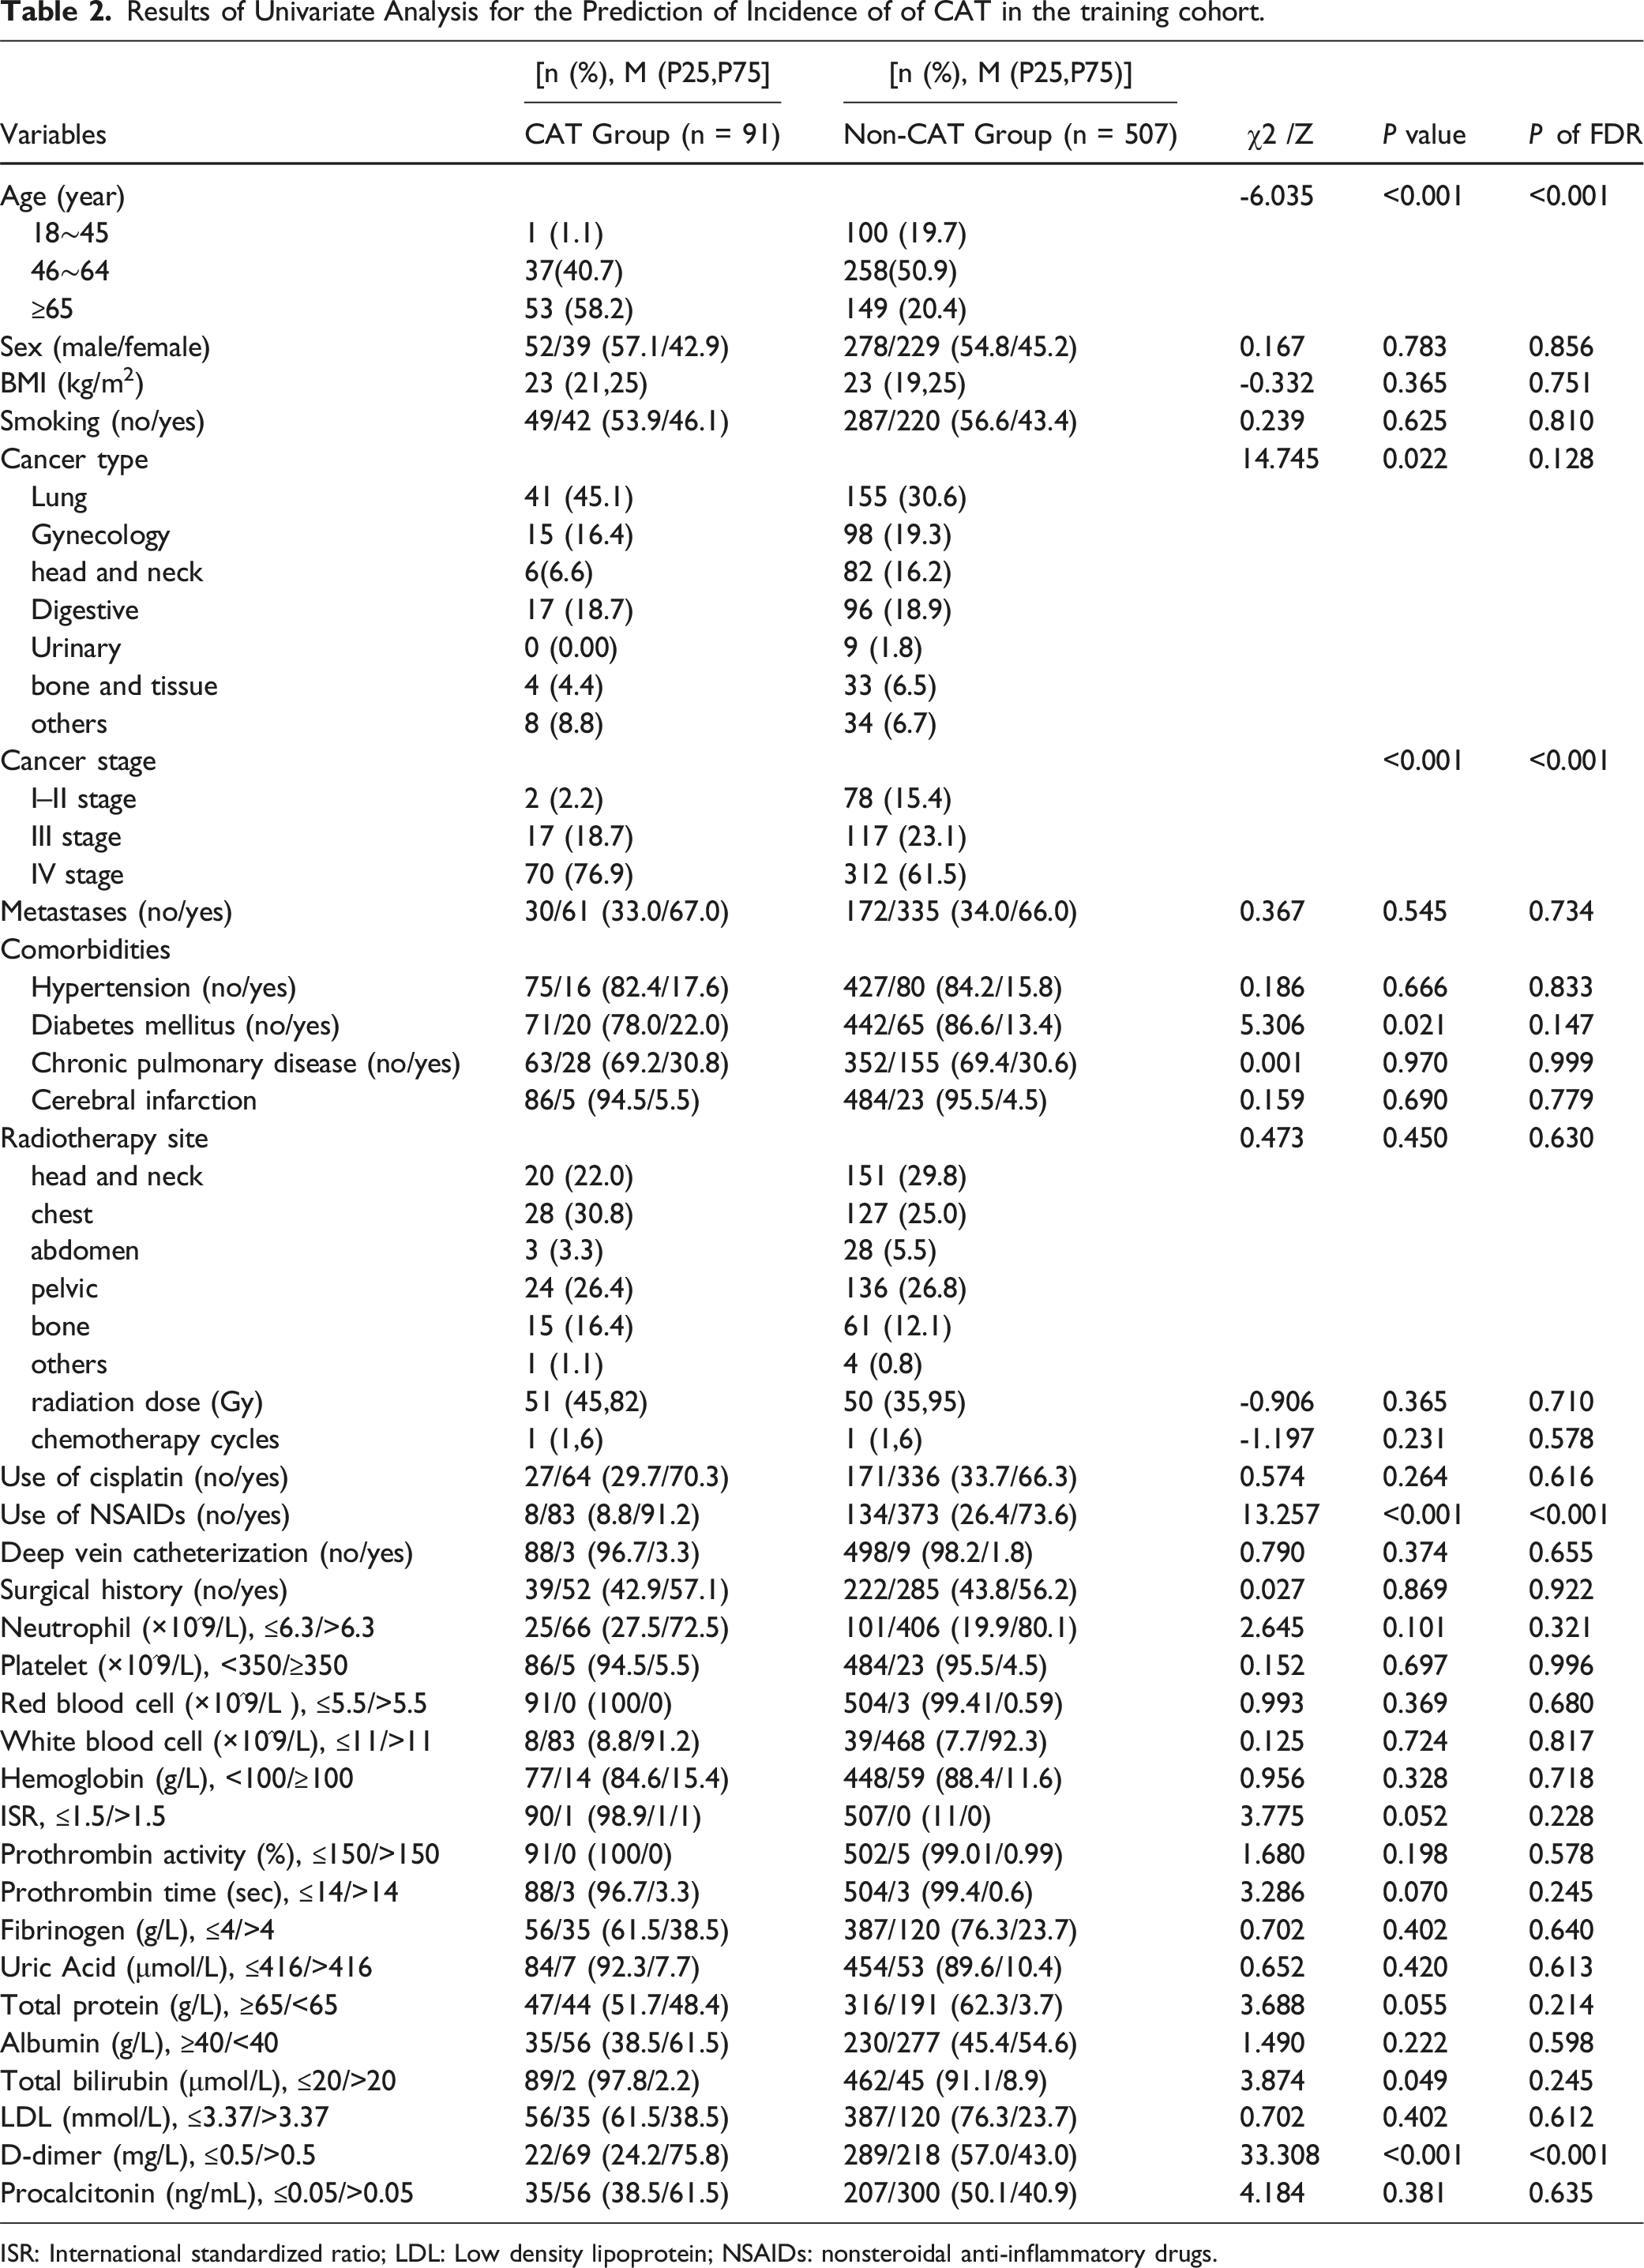
ISR: International standardized ratio; LDL: Low density lipoprotein; NSAIDs: nonsteroidal anti-inflammatory drugs.
Multivariate Logistic Regression of CAT in Cancer Patients Receiving Chemoradiotherapy.

Development of CAT Nomogram Model
Based on the above findings, a nomogram that incorporated 5 independent risk factors was constructed (Figure 1). The nomogram illustrated that age had the largest contribution to prognosis, followed by D-dimer levels, use of NSAIDs, and cancer stages. Diabetes mellitus was the comorbidity with a lower impact on CAT prediction. Each subtype within these variables was assigned a score on a point scale. Each variable was assigned a score on a point-scale axis. The predicted probabilities were converted into points on an axis scaled from 0 to 300. By adding up the total score and locating it on the total-point scale, we were able to easily draw a straight line to determine the estimated probability of CAT at each point. The nomogram model for quantifying individual risk of CAT in cancer patients receiving chemoradiotherapy.
Validation of CAT Nomogram Model
Calibration plots for the nomogram models were generated by repeating the bootstrap sampling 1000 times in both the training and internal validation cohorts, as depicted in Figure 2 A-B. The absolute errors between the simulated and actual curves in the training and validation cohorts were 0.008 and 0.043, respectively. Calibration plots showed acceptable agreement between the predicted and observed risks of CAT in patients with cancer receiving chemoradiotherapy. The calibration curves in cancer patients receiving chemoradiotherapy. A. The calibration curves of training cohort; B. The calibration curves of validation cohort.
Many models have inadequate accuracy in predicting false-positive and false-negative CAT rates, and the risk of bleeding was further exacerbated in patients with cancer receiving prophylactic anticoagulant therapy, even when administered to individuals with a high thrombosis risk according to the Khorana score.27,28 In our nomogram model, for a given wide range of threshold probabilities in the training and validation cohorts, which deviated from the 2 extreme curves (all and none) in Figure 3A, and B. This indicates that the nomogram could contribute more net clinical benefits and better predict the risk of CAT, which is particularly important for thromboprophylaxis, especially in patients receiving chemoradiotherapy. The DCA curves in cancer patients receiving chemoradiotherapy. A. The DCA curves of training cohort; B. The DCA curves of validation cohort.
Comparison with Existing Risk Model
The ROC curves of the developed nomogram and the Knorana model were compared in the training and validation sets (Figure 4A and B and Table 4) for predicting CAT. In the training cohort, the AUC for the established nomogram (0.816; 95% CI, 0.770-0.861) was significantly higher than that for the Khorana model (0.565; 95% CI, 0.501-0.628) (Z = 6.369; P < 0.001). With respect to the validation cohort, the C-index was also greater for the nomogram prediction (0.781; 95% CI, 0.703-0.860) than for the Khorana model (0.624; 95% CI, 0.509-0.738), although this difference was not statistically significant (Z = −0.350; P = 0.727). In addition, the accuracy, sensitivity, and specificity of the training and validation cohorts were superior to those of the Khorana model for patients with cancer receiving radiotherapy only. The ROC curves that Comparison between the CAT nomogram model and Khorana model in cancer patients receiving chemoradiotherapy. A. The ROC curves of training cohort; B. The ROC curves of validation cohort. Model Predictive Performance.

Discussion
The current findings showed that the incidence of CAT in patients with cancer receiving chemoradiotherapy was 15.4%, which was comparable to that previously reported in the literature for individual malignancies, such as esophageal cancer (9.6%), 29 cervical cancer (16.7%), 30 rectal cancer (13%), 4 and lung cancer (18.8%). 6 Evidence indicated that chemoradiotherapy has emerged as an independent CAT risk factor, necessitating the active management and prophylaxis of thrombosis in such patients. However, there are limited CAT models for chemoradiotherapy. In this study, we identified several independent risk factors, including age, cancer stage, use of NSAIDs, D-dimer levels, and diabetes mellitus history that can be easily obtained from baseline assessments and laboratory tests prior to treatment, and we developed a simplified nomogram based on these variables to predict CAT risk in patients receiving chemoradiotherapy with favorable performance metrics both in the training (AUC = 0.816; sensitivity = 77.3%; specificity = 77.9%) and validation (AUC = 0.761; sensitivity = 86.2%; specificity = 58.3%) cohorts, all outperforming the Khorana model which is widely used and had external validation in several studies within oncology settings. The resulting nomogram could discriminate between patients who did and did not develop CAT during chemoradiotherapy and was appropriately calibrated. Additionally, by calculating the DCA, we found that patients undergoing chemoradiotherapy may benefit tremendously from clinical practices guided by the nomogram, and it also provides clinicians with a consistent and reliable tool to predict CAT risk.
Consistent with previous studies on CAT, age, D-dimer levels, and cancer stage were identified as significant independent factors in our model.9,31-34 Thomas (2020) 35 showed that age could be used as a single predictor of VTE in hospitalized patients with non-severe diseases and can be as effective as other predictive models.10,13,36 In our study, age also exhibited strong predictive efficacy, as it was the most predictive of the 5 variables. The mechanism underlying the association between cancer stage and CAT involves the release of necrosis and tissue factors from cancer cells in advanced-stage (stages III–IV) tumors, leading to vascular endothelial injury and coagulation/fibrinolytic dysfunction.37,38
The D-dimer level was an important and independent predictor in our model, indicating its unique use as a biomarker of hemostatic abnormalities; however, determining a precise threshold for diagnosing CAT remains controversial. We stratified the CAT risk based on a D-dimer level of ≥0.5 mg/L according to our hospital laboratory’s test range and clinical practice considerations.33,34 Nevertheless, Shi (2019) 34 raised the threshold to 1.5 mg/L in patients with gynecological cancers with a sensitivity of 87.5% and a specificity of 93.8%, while Wu (2020) 39 found a higher threshold of 0.86 g/L in patients with non-oncological urological pathologies with good predictive efficiency. Therefore, the CAT prediction performance of D-dimer testing was consistent, but highlighting that adjusting D-dimer thresholds based on different clinical contexts and cancer types may improve model performance.
We must acknowledge that a history of diabetes mellitus and the use of NSAIDs as independent risk factors have seldom been mentioned in other CAT prediction models. Interestingly, our study identified these factors as independent risk factors for CAT in a chemoradiotherapy setting. The mechanisms underlying thrombosis caused by diabetes mellitus have been identified in several studies, including vascular endothelial damage and abnormal platelet activation under hyperglycemic conditions. Furthermore, these signals may represent surrogate factors, such as immobility, functional status, and disease severity, as demonstrated in PICC-related DVT in patients receiving chemotherapy. 40 Andrew (2022) 41 reported that two-thirds of patients receiving palliative radiotherapy were considered suitable for receiving NSAIDs. This is comparable to the NSAID use rate reported in the present study (76.25%). The association between NSAIDs and thrombotic events has been frequently reported and is primarily attributed to COX-2 inhibitors that inhibit prostacyclin synthesis (a potent inhibitor of platelet activation) while stimulating thromboxane release (an effective promoter of platelet aggregation). 42 The Lancet showed that NSAIDs increased the risk of strokes and myocardial infarction by one-third. 43 The U.S. Food and Drug Administration requires that the product profiles of all NSAIDs have in-frame warnings about cardiovascular disease (CVDs) risks. 44 However, the potential risk of CAT associated with NSAIDs may be underestimated or overlooked, with most oncologists focusing primarily on gastrointestinal side effects. Therefore, patients with cancer receiving chemoradiotherapy who use NSAIDs, especially those at a high risk of baseline CAT, should be closely monitored.
Limitations
The limitations of our study should be acknowledged. First, this study used a retrospective study design, which caused significant inherent limitations, and there was no external validation of the model through prospective studies. Nevertheless, we endeavored to compare the predictive efficacy with the Khorana model, which is endorsed in the NCCN guidelines and obtained satisfactory outcomes. Second, this was a single-center study with a small sample size of 788 patients. Therefore, our results need to be further verified by multicenter studies with larger sample sizes. Third, we did not conduct post-chemoradiotherapy follow-up of patients for CAT events, potentially leading to a potential loss of a proportion of such events and their impact on the study outcomes, despite identifying that most CAT events occurred during chemoradiotherapy. Furthermore, we chose hospitalized patients with cancer as the target population because of the hospitalization requirement in our institution, which is implemented to ensure the safety of patients undergoing chemoradiotherapy. However, patients with cancer undergoing outpatient chemoradiotherapy have been unintentionally overlooked. Future investigations should prioritize exploring and reporting the thrombosis risk in this specific group.
Conclusion
This study systematically developed and validated a novel nomogram model for predicting CAT in patients with cancer who received chemoradiotherapy. Using this model, clinicians can implement early clinical prevention and treatment to lower the CAT risk in patients with cancer receiving chemoradiotherapy.
Supplemental Material
Supplemental Material - A Nomogram for Predicting Cancer-Associated Venous Thromboembolism in Hospitalized Patients Receiving Chemoradiotherapy for Cancer
Supplemental MaterialA Nomogram for Predicting Cancer-Associated Venous Thromboembolism in Hospitalized Patients Receiving Chemoradiotherapy for Cancer by Yan Sisi, Li Genpeng, Chen Yao, Song Suting, Tang Rongying, Du Jiayi, Zhang Zhaoli, Wang Chunyu in Cancer Control.
Footnotes
Acknowledgments
Thanks to everyone who has contributed to this study.
Author contributions
Methodology: Li Genpeng, Wang Chunyu, and Zhang Zhaoli; Investigation: Yan Sisi, Chen Yao, Song Suting, and Tang Rongying; Conceptualization ideas: Wang Chunyu and Zhang Zhaoli; Data curation: Yan Sisi, Song Suting, Tang Rongying, and Du Jiayi; Validation: Yan Sisi and Li Genpeng; Formal analysis: Yan Sisi and Chen Yao; Writing – original draft: Yan Sisi and Li Genpeng; Writing – review & editing: Yan Sisi, Li Genpeng, Du Jiayi ,Wang Chunyu, and Zhang Zhaoli; Funding acquisition: Wang Chunyu and Yan Sisi; Project administration: Tang Rongying and Song Suting; Supervision: Zhang Zhaoli and Wang Chunyu.
Declaration of conflicting interests
The author(s) declared no potential conflicts of interest with respect to the research, authorship, and/or publication of this article.
Funding
The author(s) disclosed receipt of the following financial support for the research, authorship, and/or publication of this article: This work was supported by grants from the Chongqing Joint Science and Technology Medical Project(2023MSXM0880); Decision Consulting and Management Innovation Project, Chongqing, Shapingba District (Jcd2022066); Technology Innovation Project, Chongqing, Shapingba District(2024176).
Ethical Statement
Data Availability Statement
The private data analysed in this study are not publicly available due to hospital regulations and patient privacy considerations. All data generated or analysed during the study are included in the published paper. However, some data can be made available from the corresponding author on reasonable request only for academic purposes.
Supplemental Material
Supplemental material for this article is available online.
References
Supplementary Material
Please find the following supplemental material available below.
For Open Access articles published under a Creative Commons License, all supplemental material carries the same license as the article it is associated with.
For non-Open Access articles published, all supplemental material carries a non-exclusive license, and permission requests for re-use of supplemental material or any part of supplemental material shall be sent directly to the copyright owner as specified in the copyright notice associated with the article.