
Abstract
Objective
The aim of this study was to analyze the clinical significance and prognostic value of CD8+ T cell-related regulatory genes in hepatocellular carcinoma (HCC).
Methods
This was a retrospective study. We combined TCGA-LIHC and single-cell RNA sequencing data for Lasso-Cox regression analysis to screen for CD8+ T cell-associated genes to construct a novel signature. The expression of the signature genes was detected at cellular and tissue levels using qRT-PCR, immunohistochemistry, and tissue microarrays. The CIBERSORT algorithm was then used to assess the immune microenvironmental differences between the different risk groups and a drug sensitivity analysis was performed to screen for potential HCC therapeutic agents.
Results
An 8-gene CD8 + T cell-associated signature (FABP5, GZMH, ANXA2, KLRB1, CD7, IL7R, BATF, and RGS2) was constructed. Survival analysis showed that high-risk patients had a poorer prognosis in all cohorts. Tumor immune microenvironment analysis revealed 22 immune cell types that differed significantly between patients in different risk groups, with patients in the low-risk group having an immune system that was more active in terms of immune function. Patients in the high-risk group were more prone to immune escape and had a poorer response to immunotherapy, and AZD7762 was screened as the most sensitive drug in the high-risk group. Finally, preliminary experiments have shown that BATF has a promoting effect on the proliferation, migration and invasion of HuH-7 cells.
Conclusions
The CD8+ T-cell-associated signature is expected to be a tool for optimizing individual patient decision-making and monitoring protocols, and to provide new ideas for treatment and prognostic assessment of HCC.
Introduction
Primary liver cancer is the fifth highest incidence and third highest mortality rate in the world, and hepatocellular carcinoma (HCC) is the main type of primary liver cancer occupying more than 75%. 1 Although the rapid development of clinical imaging technology provides a powerful aid in the diagnosis of HCC, and the improvement of surgical and personalized treatment plans improves the cure and survival rates for patients, improving the effectiveness of treatment remains a challenging issue due to the high heterogeneity and complexity of HCC. 2 Given that the efficacy of immunotherapy depends on the tumor microenvironment, elucidating the tumor microenvironment in HCC is of great significance for identifying new therapeutic targets and predicting the prognosis of HCC patients.
CD8+ T cells, as the main cell population of the anti-tumor immune response, can specifically recognize and destroy tumor cells. Previous studies have found that elevated levels of CD8+ T cells in the tumor microenvironment positively correlate with antitumor effects in colorectal, breast, and cervical cancers.3,4 The main tumor immunotherapy strategies developed around CD8+ T cells in recent years include immune checkpoint therapy, cellular immunotherapy, nanomedicine immunotherapy, and neoantigens and vaccines, among others.5,6 The differentiation status of CD8+ T cells is related to the degree of response to immune checkpoint inhibitors, and immune checkpoint therapy reactivates the function of CD8+ T cells to kill tumor cells by blocking immunosuppressive signals. 7 However, due to the highly heterogeneous nature of CD8+ T cells and the many different differentiation states, many clinical studies have found that they still face the problems of low overall response rates and the development of drug resistance. The immune function response characterized by CD8+ T cell exhaustion has a significant role in the development of HCC. Several recent meta-analyses have shown the prognostic relevance of tumor-infiltrating CD8+ T cells in patients with HCC, suggesting that CD8+ T cells may be a promising prognostic factor in HCC.8-11 Therefore, it is particularly important to deeply explore the functional role of CD8+ T cells in HCC, and to provide new targets and new ideas for improving the efficacy of tumor immunotherapy by constructing a signature of prognostic markers related to CD8+ T cells.
Single-cell RNA sequencing technology is a powerful tool to study tumor heterogeneity in the tumor microenvironment, Ma L et al performed single-cell transcriptomics sequencing analysis on biological samples from HCC patients, and the results revealed an association between the diverse ecosystems of HCC and patient prognosis. 12 On this basis, here we combined the single-cell sequencing results with the TCGA-LIHC dataset for in-depth analysis, screened eight prognostic genes associated with CD8+ T cells, constructed a novel prognostic signature, and validated it with external cohort data, which showed that this signature could predict the prognosis of HCC patients, the differences of immunotherapy in different risk populations, and revealed the HCC patients' tumor immune microenvironment landscape. In addition, the role of the signature gene BATF in HCC has not been reported, and we conducted a preliminary exploration of its function.
Materials and Methods
Acquisition of Single-Cell Sequencing Data
This is a retrospective study and the reporting of this study conforms to the remark guidelines. 13 The single-cell sequencing data of 12 patients with HCC were obtained from the GSE125449 dataset of the GEO database, and the data were filtered and normalized by using the R packages Seurat and SingleR, 14 and the distribution of PC values was obtained by data downscaling using principal component analysis (PCA), and then the cell types were annotated for the subsequent analyses by t-SNE clustering analysis and the classical cytomarker genes.
CD8+ T Cell Survival Analysis and Acquisition of Related Genes
Clinical data and gene expression data of 374 HCC patients were obtained from the TCGA database. The R packages MCPcounter and xCell were used to calculate the abundance of CD8+ T cells in the TCGA-LIHC dataset, and the package ESTIMATE was run to get a score of the tumor microenvironment. Next, the score of CD8+ T cells and survival data were analyzed using the R packages Survival and Survminer, grouped into high and low abundance groups of CD8+ T cells based on the optimal cutoff value, and the survival differences between the two groups were compared, and survival curves were plotted using the K-M method. And the dataset TCGA-LIHC was subjected to data cleansing and filtering for subsequent WGCNA analysis. The samples were clustered to detect filtering outliers, the correlation coefficient between any two genes was calculated, and a suitable soft threshold value of 0.9 was chosen to make the constructed network more consistent with the scale-free network characteristics. Then a hierarchical clustering tree was constructed based on the coefficients, and dynamic shear module identification was carried out on the dendrogram, and the minimum number of genes for the modules was set to 60, and 6 modules were finally generated. Subsequently, module-trait association analysis was performed to obtain the most relevant genes to CD8+ T cells. Finally, CD8+ T-cell related genes were screened by taking the intersection of the yellow module genes with the marker genes obtained from single cell sequencing analysis.
Construction and Validation of CD8+ T Cell-Related Prognostic Signature
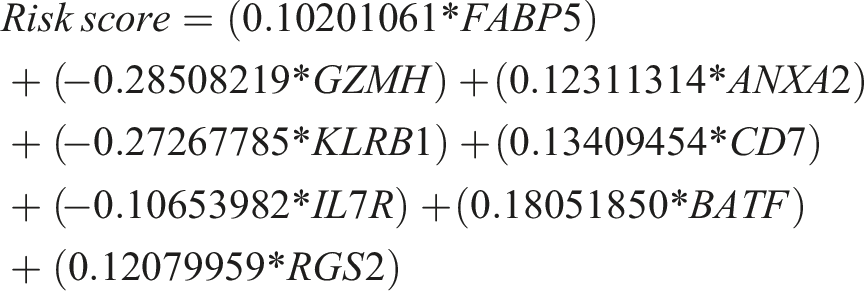
Initially, in order to explore the functions and involved pathways of the candidate genes obtained by taking the intersection, these candidate genes were subjected to pathway enrichment analysis and GO analysis. Next, to construct the prognostic signature, the CD8+ T-cell related genes obtained from the screening and the expression data were extracted for one-way cox regression analysis, and the R package survival, survminer, and the forest plot function were used to obtain the prognostic related genes and hazard ratio. Then LASSO regression analysis was used to find the minimum value of cross-validation error, and the prognosis-related genes were finally obtained. Then, the formula for the risk score signature based on the coefficient was as follows:
Analysis of the Immune Landscape
To further analyze the differences in the tumor microenvironment between patients in the high- and low-risk groups, the CIBERSORT algorithm was used to calculate the differences in the infiltration of 22 immune cells in the different risk groups. The ssGSEA was performed using the R package GSVA to analyze the score of the immune function of the patients in the two risk groups. Immune checkpoint-associated genes were used as predictors of immunotherapy, and immune checkpoint gene expression levels were analyzed in different risk groups. Finally, stromal score, immune score, and estimate score were calculated for high and low risk groups by R package estimate to assess tumor purity differences.
Analysis of Immunotherapeutic Response and Drug Sensitivity
Immunophenoscore (IPS) of the response to immunotherapy was analyzed based on the TCIA database (https://tcia.at/home) for patients in the high and low risk groups. 15 And the response to immunotherapy in both groups was analyzed based on the TIDE website using the TIDE score. Subsequently, the correlation between anticancer drugs and prognostic genes was analyzed using the cellMiner database, and multiple anticancer drugs were screened and analyzed for differences in sensitivity to patients in the high and low risk groups by R package oncoPredic.
Cell Culture
One normal hepatocyte cell line (LO2) and two HCC cell lines (SK-Hep1, HuH-7) were purchased from Cellverse Bioscience Technology Co., Ltd. (Shanghai, China). All cells were cultured in the Dulbecco’s modified Eagle’s medium containing 10% fetal bovine serum (InCellGene LLC) at 37°C under a 5% CO2 atmosphere.
RNA Extraction and Quantitative Real-Time PCR
Total RNA was extracted from cells using Trizol reagent (Life Technologies), first-strand cDNA was synthesized according to Prime Script RT reagent Kit (Invitrogen), and qRT-PCR was performed using Power SYBR™ Green PCR Master Mix (Invitrogen). The 2−ΔΔCt method was used to calculate the relative expression of target genes.
Cell Transfection
Knockdown of BATF was achieved by human target gene BATF siRNA (purchased from GenePharma Co., Ltd, Suzhou, China) with sequences: BATF-siRNA-288: sense5′-GAUGUGAGAAGAGUUCAGATT-3′, antisense5′-UCUGAACUCUUCUCACAUCTT-3'; BATF-siRNA-430: sense5′- GCUCACAGAGGAACUGAAGTT-3′, antisense5′-CUUCAGUUCCUCUGUGAGCTT-3'; BATF-siRNA-547: sense5′-CGCAUUCCACCAACCUCAUTT-3′, antisense5′- AUGAGGUUGGUGGAAUGCGTT-3'. Lipofectamine 2000 (Invitrogen, USA) was transfected with HuH-7 cells and cells infected for 48 h were used for subsequent analysis.
Cell Proliferation Assays
To evaluate the proliferative ability of HCC cells after BATF silencing, HuH-7 cells transfected with BATF-siRNA and NC-siRNA were incubated at 37°C and 5% CO2. Cell proliferation was assessed using CCK-8 (CA1210, Beijing Solarbio Science & Technology) and the absorbance at 450 nm of each well was measured at 0, 24, 48 and 72 h after transfection.
Wound Healing Assays
To determine the cell migration ability by wound healing assay, transfected HuH-7 cells (8 × 10⁶/well) were inoculated into 6-well plates, and when the cells were confluent to 80% - 90%, they were treated with 200 μL lance tip scribing, washed with PBS buffer for 3 times, and then added into DMEM culture for 0, 24 and 48 h for microscopic photo recording.
Transwell Migration and Invasion Assays
Transfected 5 × 10⁵ cells (200 μL/well) were implanted into transwell chambers (8.0 μm, Corning) with serum-free medium for cell migration and invasion assays. In cell invasion assays, transwell chambers were precoated with 20 μg Matrigel (BME001, R&D). Then, 500 μL medium containing 10% FBS was added to 24-well plates. Membranes were fixed with 4% paraformaldehyde for 20 min after incubation at 37°C for 48 h, 0.1% crystal violet staining for 30 min. The cells were observed under an inverted microscope.
Tissue Microarrays and Immunohistochemistry Analysis
Tissue microarrays (array number HLivH060CS01) containing 29 HCC samples and paired paracellular carcinoma samples were purchased from Shanghai Outdo Biotechn Company (Shanghai, China). Primary antibody BATF was rabbit polyclonal primary antibody (ab196762, Abcam) diluted at 1:50. After dewaxing and hydration, the tissue microarrays were immersed in 3% hydrogen peroxide for 5 min, followed by high-temperature repair of the antigen with sodium citrate solution for 10 min, closure at room temperature for 60 min, and overnight incubation with BATF antibody at 4°. The results were quantitatively analyzed using ImageJ, density mean = density sum/area sum, with larger values indicating stronger staining. And protein expression of CD8+ signature genes in HCC tissues was analyzed in the Human Protein Atlas database (https://www.proteinatlas.org), which provides immunohistochemical micrographs of HCC and normal tissues.
Statistical Analysis
Statistical analyses were performed using version R. Differences in survival between high- and low-risk groups were analyzed using the K-M method and compared between the two groups using the Wilcoxon test. One-way cox and LASSO regression were used to analyze independent prognostic characteristics. P < 0.05 was considered a significant difference.
Results
Identification of CD8+ T Cell-Related Genes by WGCNA
We performed survival analysis of TCGA-LIHC and GSE125449 datasets by xCell and MCPcounter algorithms, and the K-M results showed that the survival of patients with high levels of CD8+ T cells was significantly higher than that of patients with low levels of CD8+ T cells in both groups (P < 0.05), suggesting that a high density of CD8+ T cell is associated with a good prognosis (Figure 1(A)–(D)). Next, we used WGCNA analysis for the screening of CD8+ T cell related genes. Hierarchical cluster analysis was performed on the TCGA-LIHC samples and the soft threshold was set to 10, and a total of six modules were identified, among which the one significantly associated with CD8+ T cells was the MEyellow module, with 485 genes identified (Figure 1(E)–(H)). Scatterplot further analysis showed the significant correlation of MEyellow module with CD8+ T cell genes (Figure 1(I)). CD8+ T cell-associated survival analysis and screening of CD8+ T cell-associated genes. (A, B) Survival analysis of the GSE125449 datasets by the xCell and MCPcounter algorithms, respectively, (C, D) and analyzed the TCGA-LIHC dataset using the xCell and MCPcounter algorithms, showed that HCC patients with high CD8+ T-cell content had a worse prognosis. (E) No outlier samples were detected by clustering the samples. (F) The WGCNA analysis soft threshold was set to 10. (G, H) Module-trait correlation analysis identified 6 modules, of which the yellow module was found to be most relevant to CD8+ T cells. (I) Scatter plots further showed that the yellow module was significantly correlated with CD8+ T cells-related genes.
Acquisition of CD8+ T Cell-related Maker Genes Using Single-Cell Sequencing Data
We filtered a total of 3326 cells 4281 genes by quality control and data filtering of single-cell sequencing data from 12 patients with HCC. The QC violin plot shows the distribution of the number of genes identified in a single cell (nFeature), the number of sequences (nCount), and the percentage of mitochondrial genes (percent.mt), respectively (Figure 2(A)). The scatter plot showed a positive correlation between nFeature and nCount (Figure 2(B)). Next, the distribution and expression of CD8+ T cell marker (CD2, CD5, CD28) was visualized by scatter plots (Figure 2(C)). Then 20 PCs were obtained by PCA principal component analysis of the screened genes (Figure 2(D)), which revealed the high heterogeneity of the tumor cells. 15 independent cell clusters were obtained by cell clustering through the tSNE algorithm (Figure 2(E)), and then the cell subgroups were annotated according to the specific marker genes as: CD8+ T cells, B cells, fibroblasts, endothelial cells, macrophages, monocytes, epithelial cells (Figure 2(F)), in which the results of the annotation of the CD8+ T-cell subgroups overlapped with those of the CD8+ T-cell maker, indicating that the reliability of the annotation results. Finally, a total of 389 CD8+ T cell-related genes were obtained, and the heatmap revealed the gene distribution of these cell subgroups (Figure 2(G)). Processing of single-cell sequencing data and acquisition of CD8+ T-cell marker genes. (A) Quality control and data filtering of single-cell sequencing data. (B) The scatter plot showed a positive correlation between nFeature and nCount. (C) Expression and distributi CD8+ T cell on of -associated maker genes (CD2, CD5, CD28). (D) PCA analysis showed the top 20 PCs. (E) The cells were clustered into 15 independent cell clusters by the t-SNE algorithm. (F) The cell clusters were further annotated to obtain 7 cell types. (G) Heatmap showing the distribution of differentially expressed genes in different cell subpopulations.
Screening and Analysis of Prognostic Genes Associated with CD8+ T Cells
To further screen CD8 + cell-associated prognostic genes, we obtained 71 candidate genes by taking the intersection of 485 derived from TCGA-LIHC with 389 genes identified from scRNA-seq data (Figure 3(A)), and analyzed these genes for functional enrichment. KEGG pathway analysis revealed 71 candidate genes mainly involved in pathways related to immune cell response to tumors (Figure 3(B)), and GO enrichment analysis demonstrated the major involvement of these genes in cell adhesion and T cell activation in biological processes (Figure 3(C)). Univariate COX analysis was used and the results showed the hazard ratios and P-values of 9 candidate genes (Figure 3(D)). Finally, we used LASSO regression analysis (Figure 3(E) and (F)) to screen and obtain 8 prognostic genes: FABP5 (Fatty Acid Binding Protein 5), GZMH (Granzyme H), ANXA2 (Annexin A2), KLRB1 (Killer Cell Lectin Like Receptor B1), CD7, IL7R (Interleukin 7 Receptor), BATF (Basic Leucine Zipper ATF-Like Transcription Factor), RGS2 (Regulator of G Protein Signaling 2). Screening and functional analysis of CD8+ T cell-related prognostic genes. (A) Veen plot showing acquisition information for candidate CD8 + T-related genes. (B) KEGG pathway analysis of candidate prognostic genes. (C) GO enrichment analysis of candidate prognostic genes. (D) Forest plot for univariate Cox regression analysis of 9 overlapping genes. (E, F) Lasso regression analysis was performed to further screen for prognostic genes.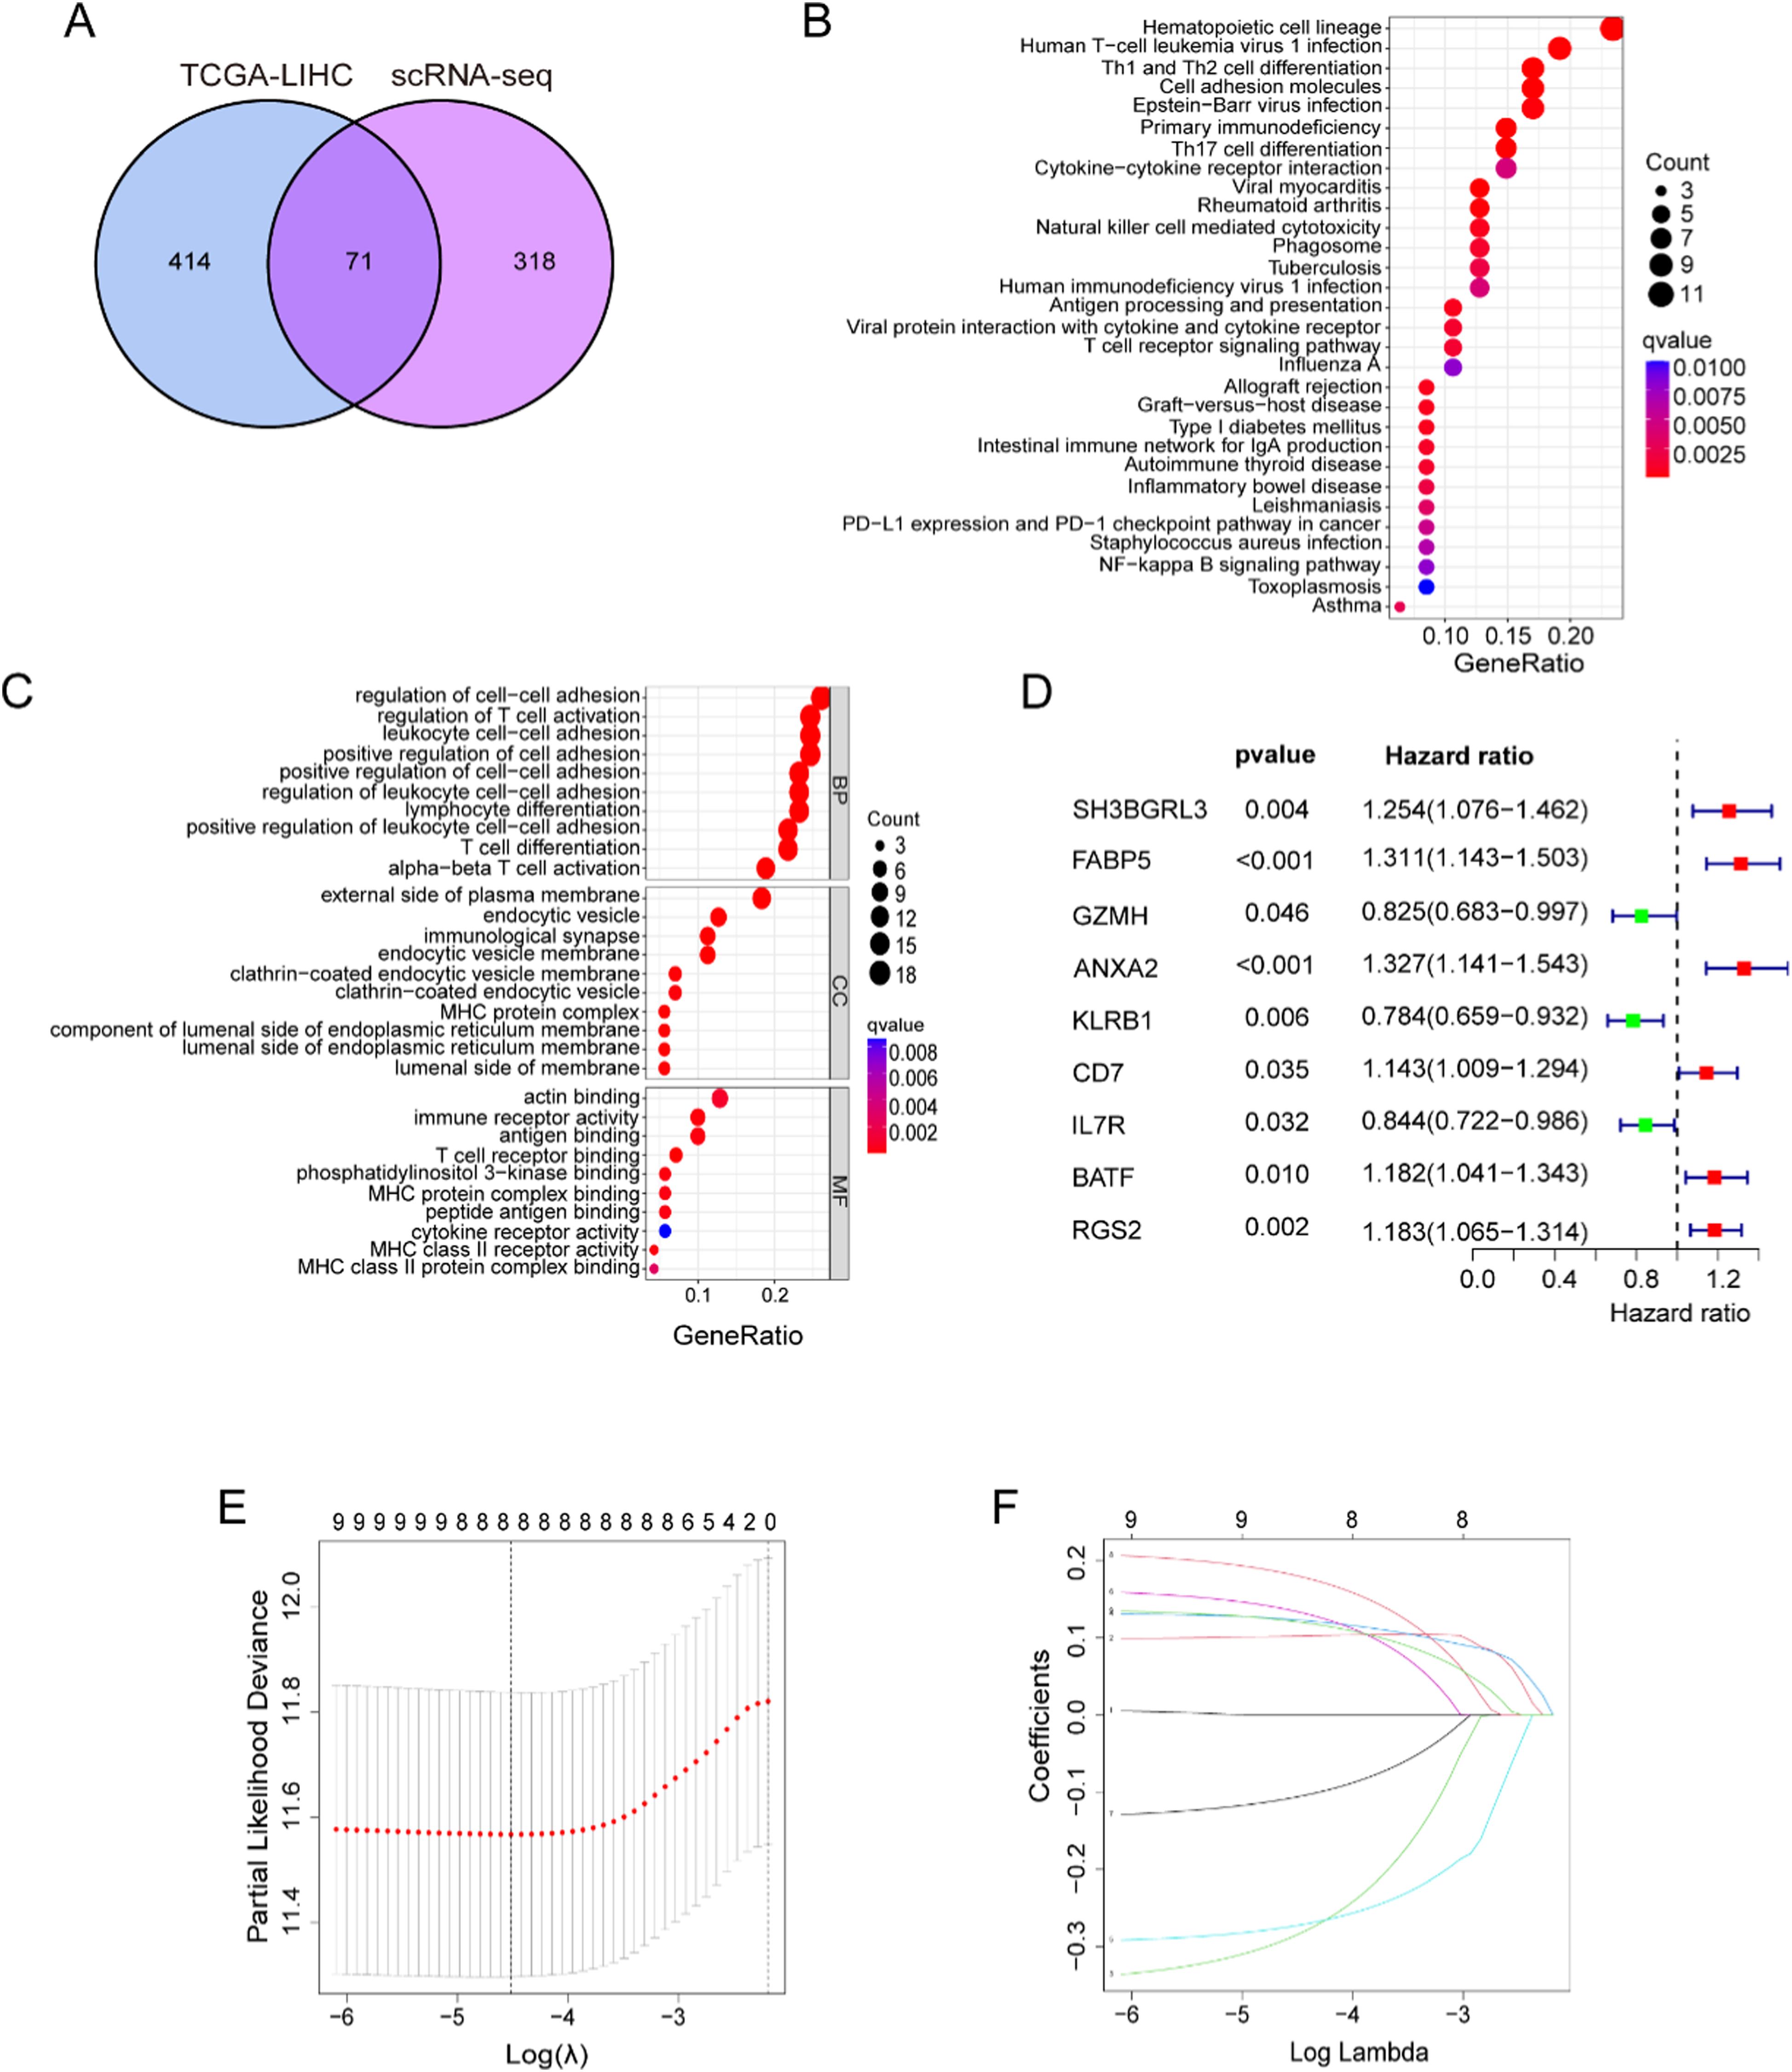
Construction of a Risk-Prognostic Signature for CD8+ T Cells
To quantify the risk score of patients with HCC, a risk score formula was constructed based on CD8+ T cell-associated prognostic genes as well as on the value with the smallest cross-validation error. The formula is as follows
Patients were grouped into high-risk and low-risk groups based on the best cut-off value for the risk score (Figure 4(A)). Survival analysis showed that patients in the high-risk group had a significantly lower overall survival than those in the low-risk group (Figure 4(B)). We then performed a ROC curve analysis, which showed 1-, 2-, and 3-year AUC values of 0.747, 0.757, and 0.737 for the risk score, respectively, and these results illustrate the good predictive performance of the risk prognostic signature (Figure 4(C)). Meanwhile, progression free survival (PFS), disease free survival (DFS), and disease specific survival (DSS) analyses all showed a better prognosis and longer survival in the low-risk group (Figure 4(D)–(F)). Univariate and multifactorial Cox analyses demonstrated that a risk score was an independent prognostic factor in a population at risk for HCC (Figure 4(G) and (H)). Additionally, GSEA enrichment analysis revealed that the top 5 most significant pathways in the high-risk group were cell cycle, ecm receptor interaction, hypertrophic cardiomyopathy hcm, neuroactive ligand receptor interaction, and taste transduction, whereas complement and coagulation cascades, fatty acid metabolism, glycine serine and threonine metabolism were significantly altered in the low-risk group (Figure 4(I) and (J)). Construction of a CD8+ T cell-related prognostic signature. (A) Survival status and risk score of HCC patients in the training set. (B) K-M survival analysis of patients in high and low risk groups. (C) ROC curves and their AUC values for 1, 2 and 3 years. (D) Progression free survival (PFS). (E) Disease free survival (DFS). (F) Disease specific survival (DSS). (G, H) Univariate and multifactorial analyses showed risk score to be an independent prognostic risk factor. (I) GSEA analysis of patients in the high-risk group. (G) GSEA analysis in low-risk patients.
Validation of the Prognostic Signature
Subsequently, the reliability of the signature was further validated using the external cohort-merged GSE76427 and ICGC-LIRI datasets, to group people at risk in the same way (Figure 5(A)). The results of survival analysis showed that the patients in the high-risk group had a poorer prognosis and a lower survival than that of the low-risk group (Figure 5(B)), and the ROC curve analysis showed that the 1-,2-, and 3-year AUC values were 0.631, 0.629, and 0.626, respectively (Figure 5(C)). To further elucidate the relationship between the signature genes and HCC, we examined the expression of these prognostic genes in 1 normal human hepatocyte cell line (LO2) and 2 human HCC cell lines (SK-Hep1, HuH-7) using qRT-PCR (Figure 5(D)). The results showed a significant up-regulation of FABP5, ANXA2, CD7, BATF, and RGS2 in HuH-7 cells, whereas the expression of GZMH, KLRB1, and IL7R had an opposite trend. However, the four genes ANXA2, CD7, BATF, and RGS2 were not significantly differently expressed in SK-Hep1 cells. Except for IL7R and RGS2, which are not available in the HPA database, we explored the protein expression of other CD8+ prognostic genes in HCC tissues (Figure 5(E)). Overall, the expression of these signature genes was consistent with the results of the TCGA cohort. These results illustrated the stability and reliability of the risk-prognostic signature we constructed, with a good predictive performance. External validation of a prognostic signature. (A) Survival status and risk score of HCC patients in the test set (GSE76427 and ICGC-LIRI). (B) K-M survival analysis of patients in high and low risk groups. (C) ROC curves and their AUC values for 1, 2 and 3 years. (D) The expression levels of 8 genes in human normal liver cell line (LO2) and HCC cell lines (SK-Hep1 and HuH-7) were examined by qRT-PCR. Statistical significance determined at P<0.05 according to one-way analysis of variance (ANOVA). ** and *** indicate significant differences at a P<0.01 and P<0.001. (E) The expression levels of genes were determined by immunohistochemistry in HCC and normal tissues obtained from the HPA database.
Correlation Analysis of Prognostic Signature with Clinicopathologic Profiles
To further explore the relationship between risk score and clinicopathologic characteristics, we performed stratified analyses based on age, gender, grade, and T stage. The heatmap revealed the expression distribution of genes associated with clinicopathologic features and prognostic signature (Figure 6(A)). The results showed significant differences in tumor grade and tumor infiltration T stage in the risk groups, and the proportion of patients with G3-4 and T3-4 stage was higher in the high-risk group than in the low-risk group, while the proportion of patients with G1-2 and T1-2 stage was lower than in the low-risk group (Figure 6(B)). In addition, we performed survival analysis for different subgroups and showed that patients with G1-2, G3-4, T1-2, T3-4, age ≥60, age <60, male, and female had a significantly lower survival in the high-risk group than in the low-risk group (Figure 6(C)–(J)). Correlation analysis between prognostic signature and clinicopathologic profiles. (A) Heatmap showed the distribution of expression of genes associated with clinicopathologic profiles and prognostic signature. (B) Histogram showed differences in tumor grading and tumor infiltration T-stage between high and low risk groups. K-M analysis showed the results of survival analysis in different subgroups stratified by tumor grade (C, D), tumor T-stage (E, F), age (G, H), and gender (I, J).
Analysis of Immune Signature Landscape
The CIBERSORT algorithm was used to analyze immune cell infiltration in patients in the risk group, and the results showed significant differences in four of the 22 immune cell types, with the levels of naive B cells, CD8+ T cells, gamma delta T cells, and M1 Macrophages being significantly lower in the high-risk group than in the low-risk group (Figure 7(A)). Differences in immune function were analyzed by ssGSEA, which showed that APC co-inhibition, CCR, check point, cytolytic point, HLA, inflammation promoting, T cell co-inhibition, T cell co-stimulation, Type I IFN reponse, and Type II IFN reponse were significantly lower in the high-risk group than in the low-risk group (Figure 7(B)). Subsequently, the TMEscore was analyzed using the ESTIMATE algorithm, which showed that patients in the high-risk group had significantly higher stromalscore, immunescore, and ESTIMATEscore than patients in the low-risk group (Figure 7(C)). Finally, Figure 7(D) showed the expression of immune checkpoint-related genes such as CD80, CD44, VTCN1, TNFSF4, BTLA, and others in high- and low-risk groups, and these results provide new ideas for mining novel targets. Analysis of immune profiles based on prognostic risk signature. (A) Immune cell infiltration was analyzed by the CIBERSORT algorithm in patients in the high and low risk groups. (B) Differences in immune function between patients in high and low risk groups were analyzed by ssGSEA. (C) TME scores of high- and low-risk groups. (D) Differences in the expression of immune checkpoint-related genes in patients from different risk groups. *, ** and *** indicate significant differences at a P<0.05, P<0.01 and P<0.001.
Immunotherapy Response Analysis and Anticancer Drug Prediction
IPS and TIDE scores were used to predict the ability of tumor patients to respond to immunotherapy,
16
and the results showed that the IPS scores of patients in the low-risk group were significantly higher than those of patients in the high-risk group in different groups (ips_ctla4_neg_pd1_neg, ips_ctla4_neg_pd1_pos, ips_ctla4_pos_pd1_neg, ips_ctla4_pos_pd1_pos), indicating that the patients in the low-risk group were more sensitive to immunotherapy (Figure 8(A)–(D)). The results of the TIDE score showed higher score for patients in the high-risk group, and these results illustrate that patients in the high-risk group are more prone to immune escape and have a poorer response to immunotherapy (Figure 8(E)). Risk score-based analysis of immunotherapy response. The IPS score was used to predict the responsiveness of tumor patients to immunotherapy, (A) ctla4_neg_pd1_neg, (B) ctla4_neg_pd1_pos, (C) ctla4_pos_pd1_neg, (D) ctla4_pos_pd1_pos. (E) TIDE scores of patients in the high and low risk groups. ** indicate significant differences at a P<0.01.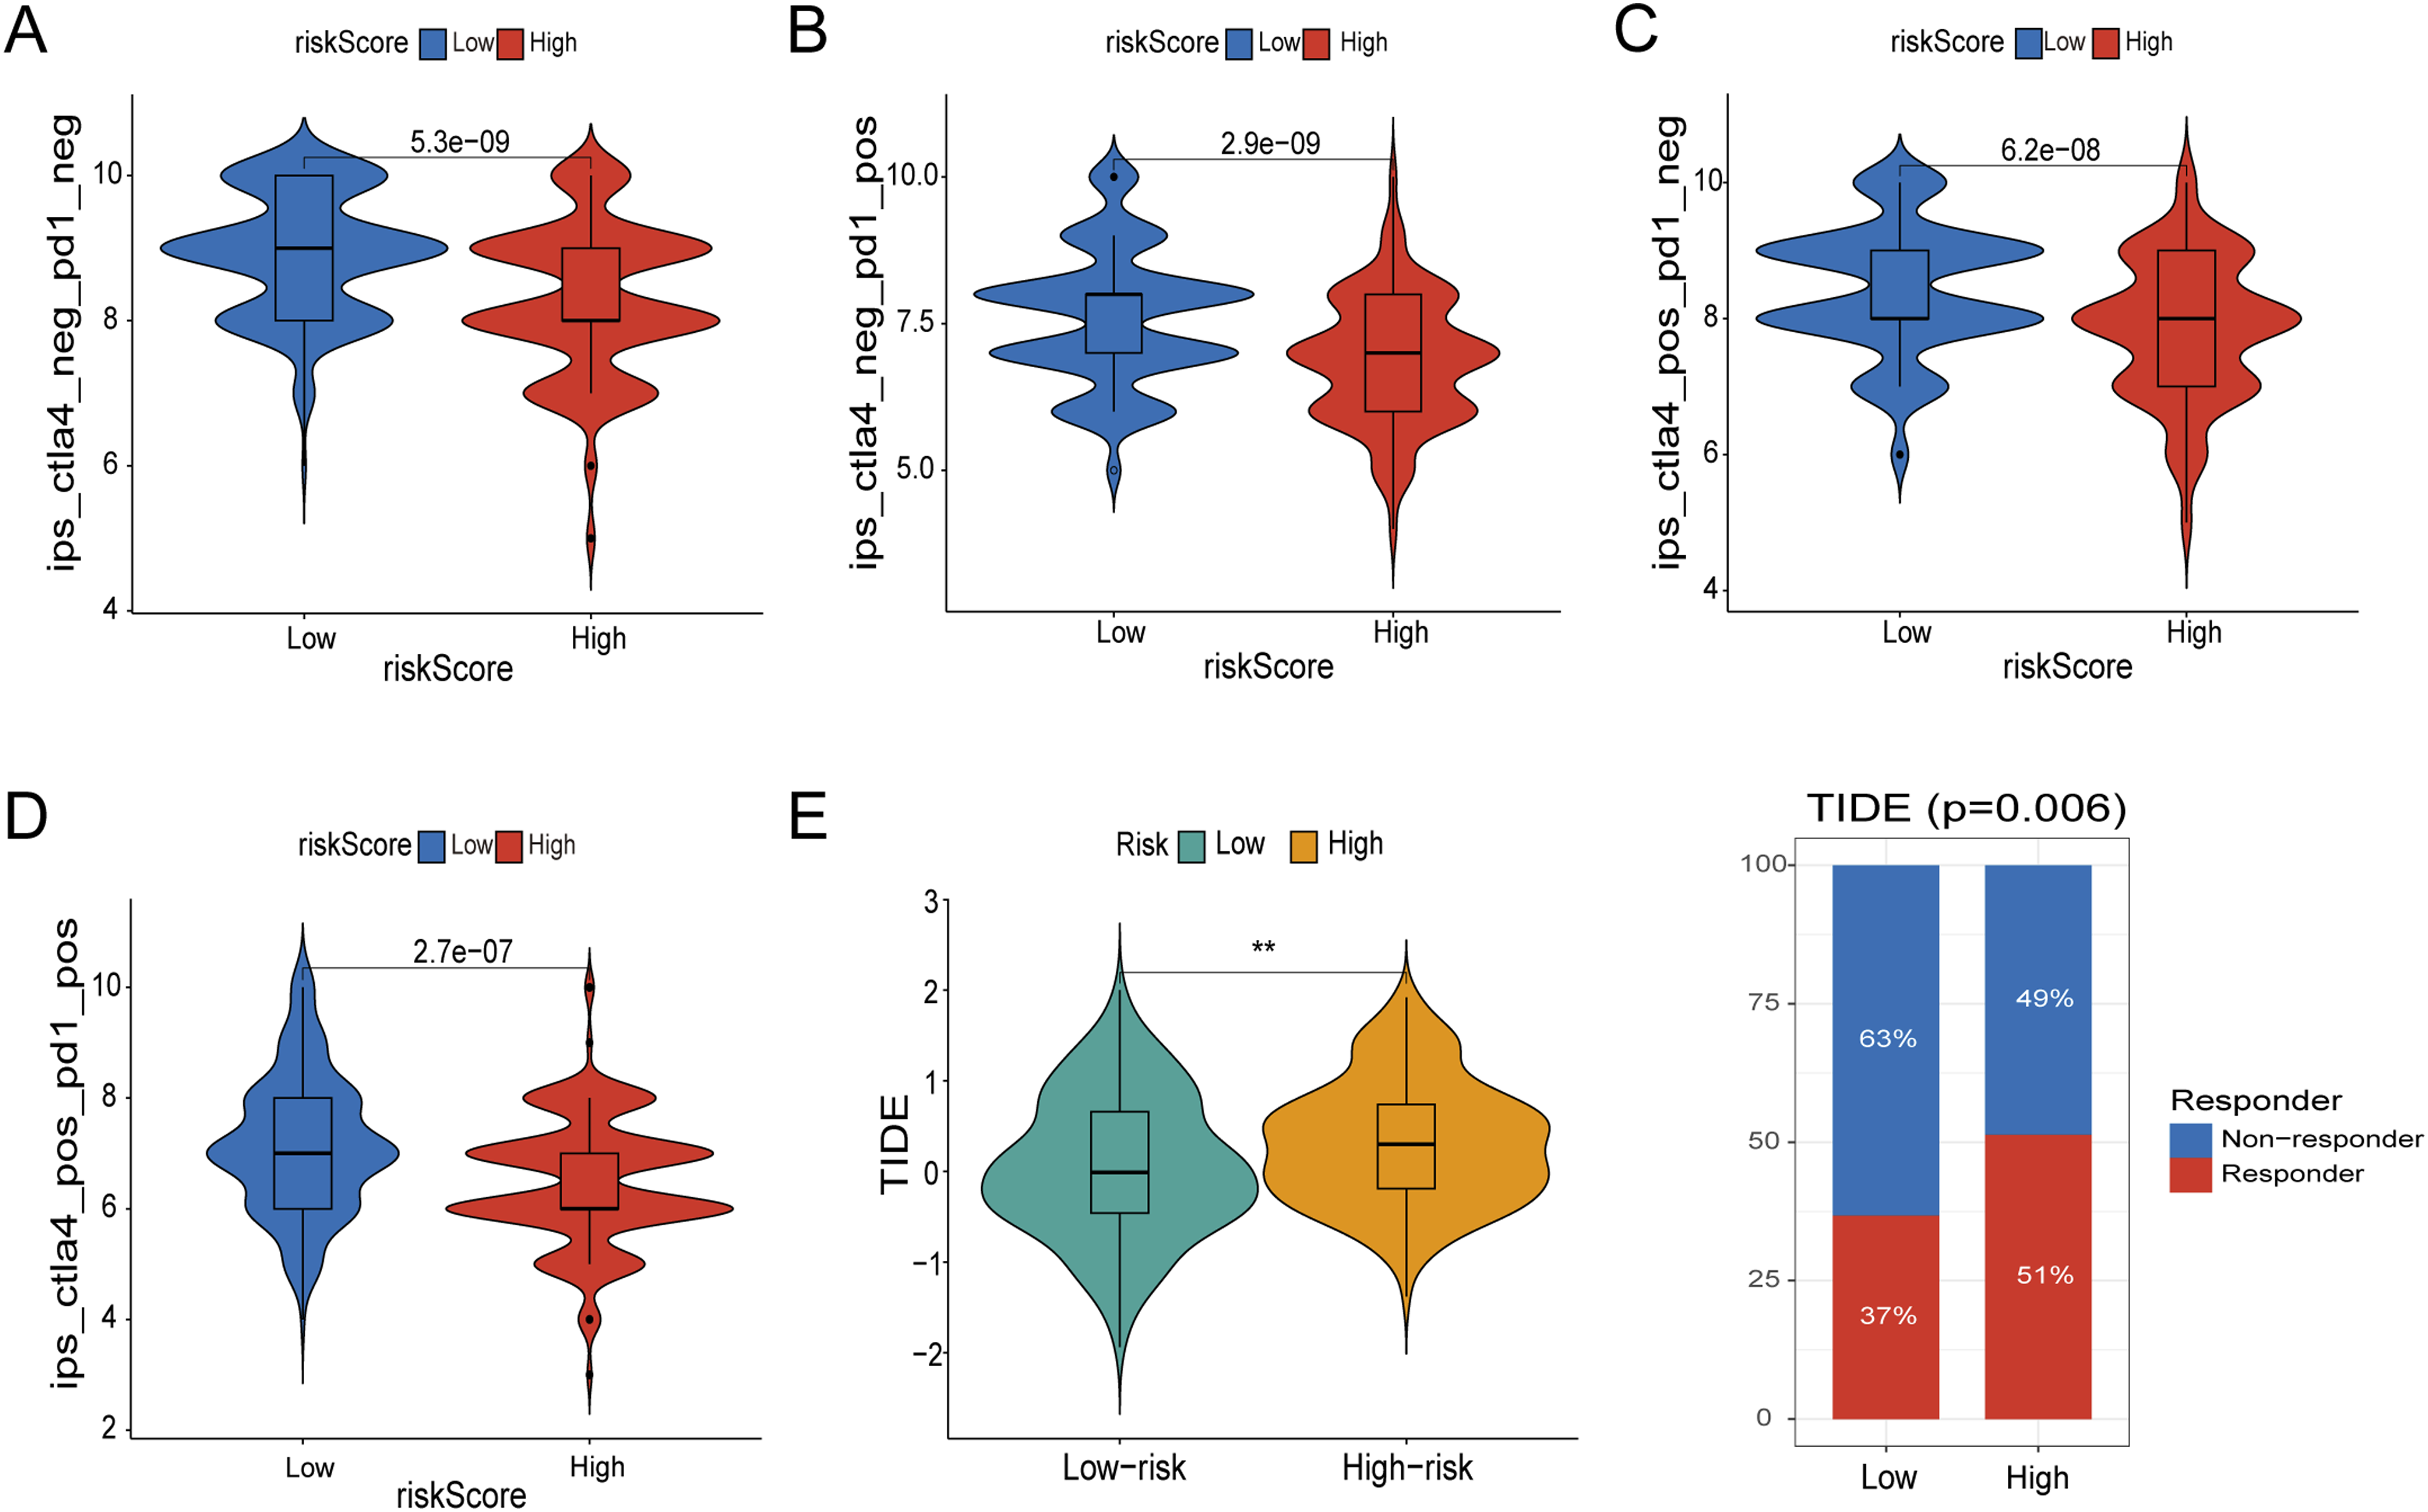
To further explore the clinical application of prognostic genes, the cellMiner algorithm was used to perform drug sensitivity analysis. The results showed that the expression of CD7 and BATF was significantly and positively correlated with asparaginase and raloxifene (Figure 9(A) and(B)). For improving the prognosis of patients in the high-risk group, the results of drug sensitivity analysis showed that 10 drugs responded better to patient treatment: ABT737, Afatinib, AZD7762, Cediranib, Dasatinib, Fulvestrant, GDC0810, Gefitinib, Lapatinib, Nilotinib (Figure 9(C)–(L)). Overall, these predicted anticancer drugs may have a positive effect on improving the prognosis of HCC patients. Prognostic signature-based screening of potential anticancer drugs. (A, B) The expression of CD7 and BATF was significantly and positively correlated with asparaginase and raloxifene, respectively. (C-L) 10 potential anticancer drugs responded better to treatment in patients in the high-risk group for HCC.
Knocking Down BATF Suppresses the Proliferation and Migration of HCC Cells
Based on the qRT-PCR results we found that BATF was significantly highly expressed in HCC cell lines, however, the function of BATF in HCC is still unknown, and the role of BATF was initially explored. We detected the distribution of BATF expression in 29 HCC patients using HCC microarray, and the results showed that BATF was highly expressed in HCC tissues (Figure 10(A) and (B)). HuH-7 cells were used for subsequent functional experimental analysis. Different types of siRNAs were used to suppress BATF expression in HuH-7 cells. The qRT-PCR assay showed that BATF-siRNA-430 had the best silencing efficiency (Figure 10(C)). CCK-8 assay showed that knockdown of BATF gene significantly reduced the number of HuH-7 cells compared with the control NC-siRNA group (Figure 10(D)). The results of Wound-healing assay showed that the healing ability of HuH-7 cells was decreased at 48 h after knocking down BATF gene (Figure 10(E) and (F)). The results of transwell assay showed that the migration and invasion ability of HuH-7 cells was significantly reduced after knocking down BATF gene (Figure 10(G)–(I)). Effects of knockdown of BATF on proliferation and invasion of HCC cells. (A, B) Immunohistochemistry was used to detect the expression level of BATF protein between HCC and the adjacent normal tissues in HCC microarrays (n = 29). (C) The efficiency of silencing BATF was shown by qRT-PCR in the HuH-7 cell line. (D) The CCK-8 viability assay detected the proliferative ability of HuH-7 in the NC group and the BATF-siRNA430 knockdown group. (E, F) Wound healing assay showed that BATF knockdown inhibited the migration of HCC cell line HuH-7. (G–I) The transwell assay showed that BATF knockdown affects the migration and invasion ability of HuH-7 cells. Statistical significance determined at P<0.05 according to one-way analysis of variance (ANOVA). *, ** and *** indicate significant differences at a P<0.05, P<0.01 and P<0.001.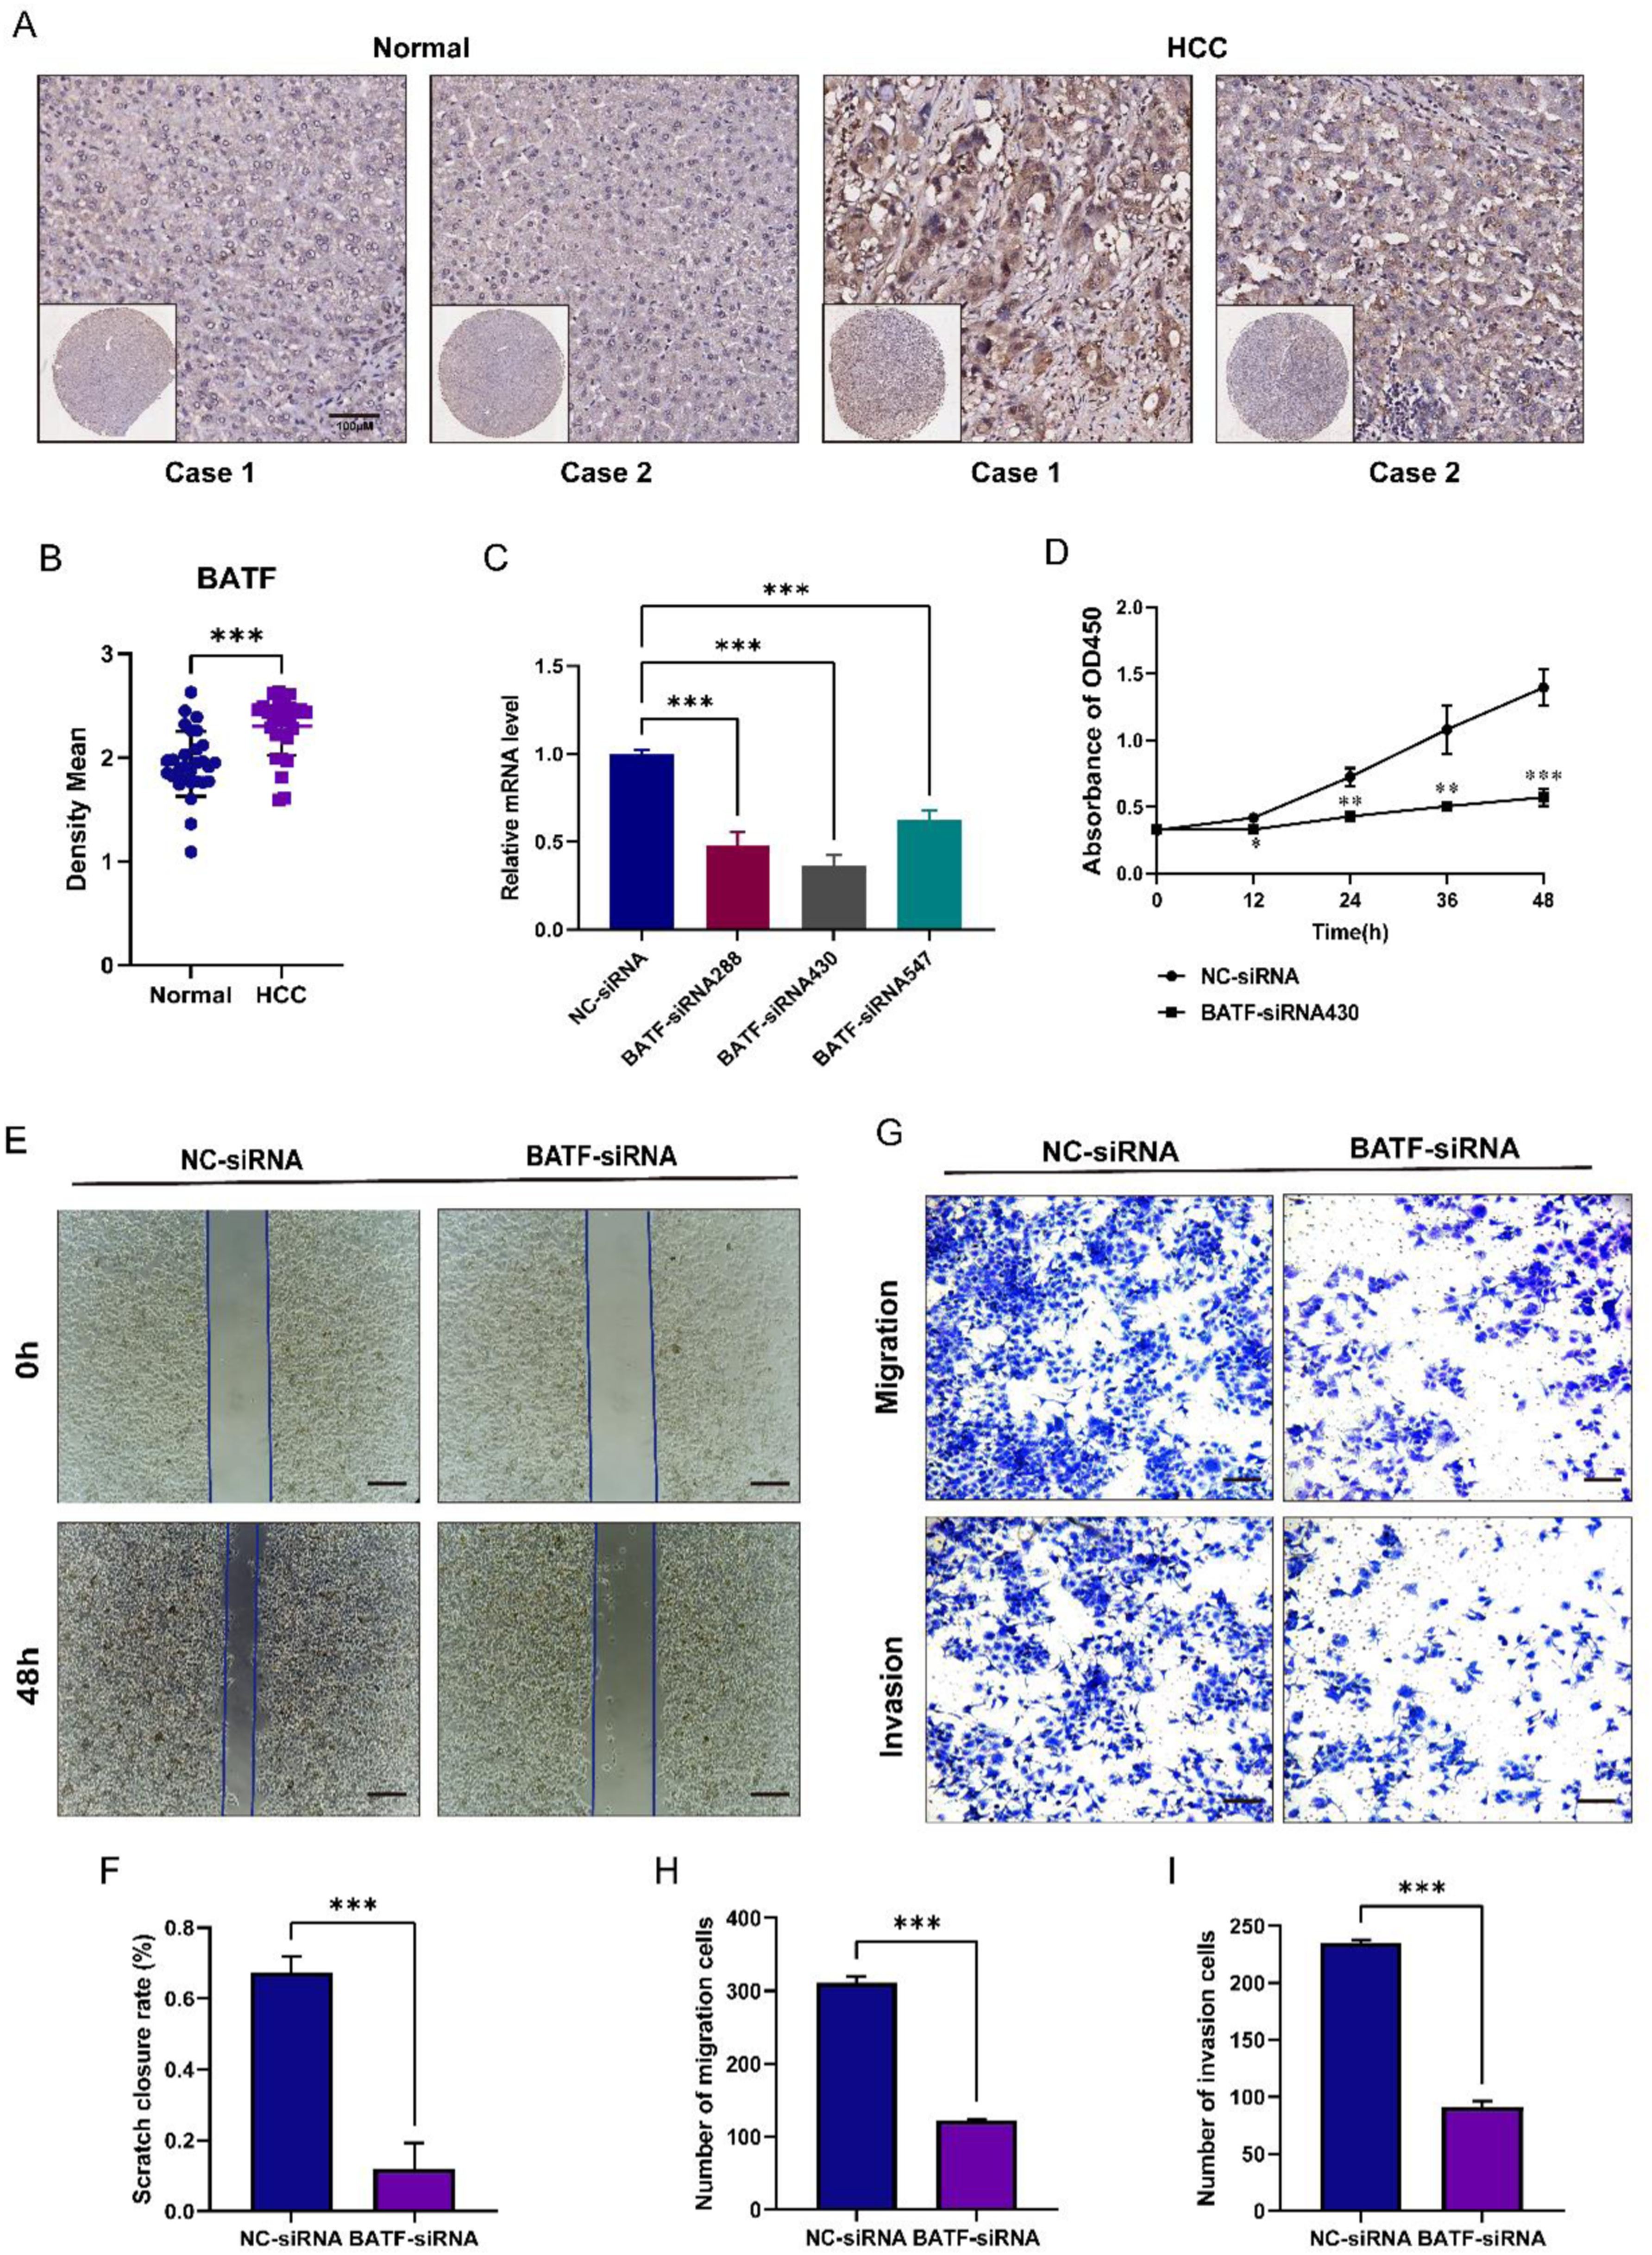
Discussion
HCC is a common malignant tumor, and the treatment of HCC patients includes various modalities such as surgical treatment, local ablation therapy, interventional therapy, targeted therapy and immunotherapy, and radiation therapy, etc. Studies have shown that comprehensive treatment with transarterial chemoembolization combined with radiofrequency ablation can improve the survival rate of patients with HCC,17,18 and although the combined treatment shows better efficacy, its safety and applicability still need to be evaluated individually. Molecularly targeted drugs and used for HCC treatment have large individual differences in therapeutic efficacy,19,20 and it has been reported that exploring the dynamic imaging patterns of HCC after different drug treatments by multimodal imaging technology, reflecting the potential histopathological features behind the evolution of the multimodal imaging of different individual treatments, which can help to develop a better standard of therapeutic response. 21 Immunotherapy centered on immune checkpoint inhibitors has demonstrated better efficacy in clinical studies of HCC. Immunotherapeutic agents are closely related to the differences of immune cells in the tumor microenvironment, and the differentiation status of CD8+ T cells, as the main force of anti-tumor immune response, is closely associated with the intensity of immune response and the degree of response to immunotherapy.22,23 Therefore, to further screen the beneficiary population, predict the therapeutic efficacy, and improve the disease prognosis, we next constructed a CD8+ T-cell-related prognostic signature to elucidate the immune characteristics and immunotherapy response of HCC patients with different prognostic stratification. To the best of our knowledge, this has not been previously reported.
In our study, we combined single-cell and bulk RNA-sequencing data to screen for CD8+ T-cell-associated signature genes, constructed a novel signature featuring CD8+ T-cell-related genes and demonstrated its excellent predictive properties, and validated using two external HCC cohorts. The expression of these signature genes was also verified using qRT-PCR and IHC staining. Our results reveal the immune characteristics of the tumor microenvironment and differences in response to immunotherapy in different HCC patients, providing new perspectives and understanding for decision-making in clinical treatment, which may be beneficial for personalized treatment of HCC patients.
The eight CD8+ T-cell-related genes (FABP5, GZMH, ANXA2, KLRB1, CD7, IL7R, RGS2, BATF) screened were used to construct a risk-prognostic signature for HCC. Previous studies have shown that these genes are associated with survival prognosis and tumor immunotherapy in patients with HCC as well as other tumors. FABP5 expression was upregulated in multiple cancer types including brain, breast, liver, prostate, cervical, lung, kidney, and HCC patients with high FABP5 expression in those HCCs had poorer OS, DFS, RFS. 24 Granzyme H (GZMH) has a similar ability to granzyme B (GZMB) and plays an important role in T-cell and NK-cell mediated tumor killing,25,26 and reports have shown that GMZB acts as a predictor of tumor immunotherapy, and in nasopharyngeal carcinoma deletion of the copy number of the GMZB/H gene correlates with poor therapeutic outcome, 27 however, GMZH has been reported less frequently in HCC. Studies have shown that ANXA2 can be an independent prognostic factor in HCC, which exerts its immune function by affecting Treg cells and immune checkpoint genes, and that HCC patients with high levels of ANXA2 are associated with a poor prognosis, chemotherapy resistance, and shorter survival.28,29 Patients with early relapsed HCC have CD8+ T cells that highly express KLRB1, and patients with high levels of these cells have a poorer prognosis, possibly due to the low cytotoxicity, low expression of checkpoint genes, and low clonal status of these cells. 30 CD7 is expressed in T cells or NK cells, and the high expression of CD7 affects tumor adhesion and metastatic ability correlates with the development of hematological malignant tumors, and the CD7 CAR T cell tumor immunotherapy technology with the ability to modify T cells has become a hot spot nowadays. 31 Hepatitis B virus X protein promotes the expression of IL-7R through NF-κB and Notch1 pathways, and promotes the proliferation and migration of hepatitis B virus-associated HCC cells. 32 High expression of RGS2 is associated with poor prognosis in non-small cell lung cancer, and translational control mediated by targeting RGS2 after chemotherapy is used to carry out the treatment of recurrent non-small cell lung cancer. 33 The transcription factor BATF plays a critical role in virus resistance by regulating epigenetic through modulation of Sirt1 expression influencing CD8+ T cell differentiation. 34 Moreover, BATF improves the antitumor response of CAR T cells, possibly by altering their phenotype and transcriptional profile depletion status to enhance the effector function of CAR T cells. 35 There is currently no study exploring the function of BATF in HCC progression and the close mechanisms involved in this process. Our results showed that BATF was able to promote the proliferation, migration, and invasion of HCC cells, suggesting that BATF may have a contributory role in the progression of HCC.
Next, we calculated risk score based on prognostic marker genes and set the optimal cutoff value for risk score to categorize the population into high-risk patient group and low-risk patient group. And the survival analysis showed that the survival rate of the high-risk group was significantly lower than that of the low-risk group, as well as the ROC curve also showed the reliability of the prediction signature. In addition, we also showed that risk score was an independent prognostic factor using univariate and multivariate cox analyses. GSEA analysis demonstrated significant differences in metabolic pathways such as fatty acid metabolism, glycine serine and threonine metabolism in patients in the low-risk group, whereas patients in the high-risk group were involved in the activation of a variety of disease-signaling pathways, which may partly explain the poorer prognosis of patients in the high-risk group. To further validate the applicability of our constructed signature, external data validation was performed by merging the two HCC patient cohort datasets GSE76427 and the ICGC-LIRI. Survival analysis showed that patients in the high-risk group had a poorer prognosis. Subsequently, in order to better apply the signature to clinical practice, we analyzed the correlation between prognostic signature-related genes and clinicopathological characteristics (age, gender, tumor grade, and tumor-infiltrating T-stage) based on the risk score. Stratified survival analysis also demonstrated a longer survival in the low-risk population.
In addition to validating the validity and applicability of the signature, we also analyzed the immune microenvironment of the population in different risk groups. Clinical studies have shown that B cells can be used as predictors of immune-related adverse events (IRAEs), and assessment of B cell levels has been associated with improved prognosis in tumor patients. 36 In patients with immune-heavy subtypes of sarcoma, B cells are considered prognostic markers in response to ICI therapy. 37 CD8+ T cells in TME play a major role in tumor immunity, and CD8+ T cells differentiate into cytotoxic T cells and exhibit killing effects on tumor cells. In our study, B-cell, CD8+ T-cell and M1 macrophage levels were significantly lower in the high-risk group of patients than in the low-risk group, which emphasizes the importance of these infiltrating cells in the process of HCC occurrence and development. A recent study showed that GOLM1 induces CD8+ T cell suppression by promoting PD-L1 stabilization and translocation of PD-L1 into exosome-dependent tumor macrophages, which provides a new strategy for the efficacy of anti-PD-L1 therapy for HCC. 38 For the immune function score, we found that the high-risk group was significantly lower than the low-risk group in terms of APC co-inhibition, CCR, checkpoints, cytolysis points, HLA, pro-inflammatory, T-cell co-inhibition, T-cell co-stimulation, type I IFN response, and type II IFN response, which suggests that the patients of the low-risk group had a more active immune system than the patients of the high-risk group. And the analysis showed that most immune checkpoint-related genes were more active in the high-risk group, including CD44, VTCN1, TNFSF4, and NRP1, suggesting that these individuals may be more sensitive to immunotherapy. Thus, the analysis of immunoprofiling based on our constructed prognostic signature showed significant differences between patients in the high-risk and low-risk groups, suggesting that the differences in HCC prognosis may stem from the heterogeneity of TME, which provides new insights for individualized treatment of HCC in the future.
IPS and TIDE scores were used to assess the response of patients in different risk groups to immunotherapy, and the results demonstrated that patients in the high-risk group were more susceptible to immune escape and had a poorer response to immunotherapy. In addition, we screened HCC patients for anticancer drugs, and asparaginase and raloxifene were significantly and positively correlated with the expression of CD7 and BATF. Recent studies have shown that asparaginase reverses cell proliferation induced by aberrant PTTG1 expression and participates in the progression of HCC by regulating cellular metabolic reprogramming. 39 Matsushima NR et al found that raloxifene inhibited TGF-α-induced HCC cell migration through the ERβ-mediated AKT signaling pathway. 40 Our results further support the use of both drugs for the treatment of HCC. And the relationship between the action of these two drugs and the maker gene deserves further exploration. In our prognostic signature, a high-risk population implies a poorer prognosis and the need to provide a more personalized and precise treatment regimen, thus we screened 10 more sensitive potential drugs for the treatment of HCC. Among them, AZD7762 as the 10 drugs with the lowest IC50 was the more sensitive drug in the high-risk group. AZD7762, a CHK1 inhibitor, was found to target the DNA damage response through the ERH-ATR axis to enhance chemosensitivity in the treatment of HCC. 41
Some limitations should be noted in our study. First, this was a retrospective bioinformatics analysis based on publicly available gene expression data; the real prognostic and therapeutic value of CD8+ T cell-associated signature should be cross-validated in multicenter and prospective data. In addition, the specific biological roles of CD8+ T cell-associated signature biomarkers in HCC need to be validated by molecular and animal experiments. Nevertheless, our instructive results could serve as a framework for the future mapping of CD8+ T cell in HCC.
Conclusions
This study provides a new perspective to recognize the role of CD8+ T cells in HCC and establishes a prognostic signature based on CD8+ T cell correlation, which provides new ideas and strategies for the therapeutic and prognostic assessment of HCC.
Footnotes
Author Contributions
Conceptualization, SYQ and WN; methodology, LXZ; software, QXD; validation, QXD; formal analysis, LSB; data curation, LKX and YN; writing—original draft preparation, LXZ; writing—review and editing, LXZ; visualization, QXD.
Declaration of conflicting Interests
The author(s) declared no potential conflicts of interest with respect to the research, authorship, and/or publication of this article.
Funding
The author(s) disclosed receipt of the following financial support for the research, authorship, and/or publication of this article: This research was funded by National Natural Science Foundation of China, grant number No. 82170560 (SYQ) and No. 82200567 (WN).
Ethical Statement
Data Availability Statement
There are no restrictions regarding data availability. The datasets used and analysed during the current study are available from the corresponding author on reasonable request