
Abstract
Background
Black-White racial disparities in cancer mortality are well-documented in the US. Given the estimated shortage of oncologists over the next decade, understanding how access to oncology care might influence cancer disparities is of considerable importance. We aim to examine the association between oncology provider density in a county and Black-White cancer mortality disparities.
Methods
An ecological study of 1048 US counties was performed. Oncology provider density was estimated using the 2013 National Plan and Provider Enumeration System data. Black:White cancer mortality ratio was calculated using 2014-2018 age-standardized cancer mortality rates from State Cancer Profiles. Linear regression with covariate adjustment was constructed to assess the association of provider density with (1) Black:White cancer mortality ratio, and (2) cancer mortality rates overall, and separately among Black and White persons.
Results
The mean Black:White cancer mortality ratio was 1.12, indicating that cancer mortality rate among Black persons was on average 12% higher than that among White persons. Oncology provider density was significantly associated with greater cancer mortality disparities: every 5 additional oncology providers per 100 000 in a county was associated with a .02 increase in the Black:White cancer mortality ratio (95% CI: .007 to .03); however, the unexpected finding may be explained by further analysis showing that the relationship between oncology provider density and cancer mortality was different by race group. Every 5 additional oncologists per 100 000 was associated with a 1.6 decrease per 100 000 in cancer mortality rates among White persons (95% CI: −3.0 to −.2), whereas oncology provider density was not associated with cancer mortality among Black persons.
Conclusion
Greater oncology provider density was associated with significantly lower cancer mortality among White persons, but not among Black persons. Higher oncology provider density alone may not resolve cancer mortality disparities, thus attention to ensuring equitable care is critical.
Plain language summary
Our study provides timely information to address the growing concern about the need to increase oncology supply and the impact it might have on racial disparities in cancer outcomes. This analysis of counties across the US is the first study to estimate the association of oncology provider density with Black-White racial disparities in cancer mortality. We show that having more oncology providers in a county is associated with significantly lower cancer mortality among the White population, but is not associated with cancer mortality among the Black population, thereby leading to a disparity. Our findings suggest that having more oncology providers alone may be insufficient to overcome existing disadvantages for Black patients to access and use high-quality cancer care. These findings have important implications for addressing racial disparities in cancer outcomes that are persistent and well-documented in the US.
Introduction
Black-White racial disparities in cancer mortality are persistent and well-documented in the United States (US). 1 Disparities in outcomes have primarily focused on individual-level patient risk factors, such as greater tobacco use, and structural barriers, such as lower rates of access to cancer screenings for Black persons than White persons,2-6 with less emphasis on the contexts in which these disparate outcomes occur.7-12 In response to the American Society of Clinical Oncology’s prediction of a shortage of 2258 oncologists by year 2025, 13 there is growing concern about oncologist supply and the impact it might have on cancer disparities.
Oncology provider density, as 1 measure of oncology care access, has the potential to improve cancer outcomes and mortality. Greater density of providers may facilitate timely diagnosis and treatment, while also giving more opportunities for patients to access care. In the US, 1 recent study estimated that median survival of cancer patients in counties with lowest oncology provider density was significantly lower (8 vs 11 months) than patients in counties with highest oncology provider density, after controlling for patient demographics and use of radiation treatment. 14 Other studies have examined general provider density, using Health Professional Shortage Areas (HPSA), on specific aspects of cancer treatment. For example, patients living partially (vs. completely) in a HPSA had greater adherence to oral anti-cancer medications for breast cancer survivors,15,16 yet neither study focused on racial disparities. A greater number of locally available providers could reduce structural barriers to early diagnosis, timely treatment, and adherence, potentially improving survival among Black cancer patients, who are more likely to be affected by these barriers; yet the relationship between oncology provider density and racial disparities in cancer mortality has not been explored empirically.
In this ecological analysis, our goal was to examine the role of oncology provider density in Black-White cancer disparities in the US. We hypothesized that higher oncology density in a county, as a proxy for oncologist availability, is associated with smaller Black-White racial disparities in cancer mortality.
Materials and Methods
This ecological observational study used publicly available, de-identified data. The Institutional Review Board office determined that this study did not require IRB oversight.
Data Sources and Measures
Dependent Variables
The primary outcome measure was the Black-White cancer mortality ratio in the US based on mortality rate data from Black and White persons in 2014-2018, from State Cancer Profiles. We calculated the mortality ratio outcome as the age-standardized cancer mortality rates among the Black population divided by rates among the White population in the same county. A ratio >1 represents higher cancer mortality rates for Black vs White persons while <1 represents lower cancer mortality rates for Black vs White persons. Secondary outcomes were age-standardized, county-level cancer mortality rates, including deaths from all cancers. Case counts <16 are suppressed in State Cancer Profiles data, therefore counties with <16 race-specific deaths (either due to low mortality rates or small population size) were excluded from our analyses. Puerto Rico was missing cancer incidence and mortality data for Black and White populations and was excluded in this analysis.
Independent Variables
Oncology provider density was defined as the number of oncologists per 100 000 population in a county obtained from the publicly available 2013 Centers for Medicare & Medicaid Services (CMS) National Plan and Provider Enumeration System (NPPES). Providers specializing in oncology and practicing in the US were identified using provider taxonomy code (Supplemental Table 1). Provider practice addresses were geocoded to US county using ArcGIS. Total population counts for each county came from the 2013-2017 American Community Survey (ACS).
Covariates
We selected covariates hypothesized a priori to be potential confounders, including county-level covariates: 2013-2017 State Cancer Profiles Black-White cancer incidence ratio 17 ; 2013-2017 ACS variables for income inequality (Gini index ranging from 0 [perfect equality] to 1 [maximal inequality]), percent of population that is Black, percent of population with health insurance coverage; metropolitan status based on United States Department of Agriculture (USDA) Rural-Urban Continuum Codes (values 1-3 were coded as metro areas; values 4-9 were coded as non-metro areas); and US Census Bureau census region (Northeast, Midwest, West, and South). Black-White cancer incidence ratio was constructed to account for geographic variation in risk factor profiles and cancer prevention practices. This variable was defined as age-standardized cancer incidence rates among the Black population divided by rates among the White population. As with mortality data, case counts <16 were suppressed, leading to incomplete incidence data. Given our age-standardized rates, we did not include age in our models We did not include sex in our models, given that some cancers are sex-specific.
Calculation
Continuous variables were converted to z-scores and included in the regression models. Linear regression models were constructed to quantify the association of county-level oncology provider density with subsequent Black-White cancer mortality ratio, adjusting for the covariates listed above. Next, linear regression was used to quantify the association of oncology provider density with cancer mortality rates, overall, and separately among Black and White populations. In models of cancer mortality rates, we adjusted for cancer incidence rates (overall, among Black and White persons, respectively), Gini index, percent of population that is Black (only in the model of overall cancer mortality rates), health insurance coverage, metropolitan status, and census region. These race-specific analyses allowed us to explore whether oncology provider density might have a different association with cancer mortality by race. Furthermore, predicted cancer mortality rates by oncology provider density were estimated after fitting multivariable linear regression models adjusted for the covariates listed above. We conducted sensitivity analyses with oncology provider density modeled as a categorical variable, which allowed us to explore potential non-linearity in its association with the outcomes.
Linear regression was chosen for modeling age-standardized cancer mortality rates to control for potential confounding by age, instead of Poisson regression which is commonly used to model crude cancer mortality rates. There was little evidence of clustering of counties within state (intra-class correlation <.15 for all models), thus standard errors were not adjusted for clustering by state. Statistical significance was determined by a 2-sided P-value <.05. Analyses were conducted using STATA/IC 16.1, R version 4.0.2, and SAS University Edition.
Results
Characteristics of 3142 US Counties Overall and 1048 US Counties Included in the Analysis.

a10 states were excluded because these counties either did not have data on Black-White cancer incidence or mortality disparity or counties had oncology provider density >40 per 100 000: ID, KS, ME, MN, MT, ND, NH, SD, VT, WY, and PR.
bIQR = interquartile range.
There were 20 935 oncology providers practicing in the US in 2013 (Supplemental Table 1), including 20 352 oncology physicians and 403 oncology nurses and physician’s assistants. Oncology provider density was higher in the analytic sample compared to overall US counties (median value: 2 vs 0 per 100 000; Table 1). About one-third of overall US counties had at least 1 oncologist compared with 56% (592 counties) in the analytic sample. Overall, there were substantial variations in geographic distribution of oncologists throughout US counties (Figure 1A). At the census region level, 71.4% of counties in the Northeast had at least 1 oncologist, higher than the proportions in the West (34.8%), South (30.9%) and Midwest (26.5%). Within a region, oncology provider density varied by state and county, suggesting that oncology provider density may be impacted by local, state, and regional-level factors. Figure 1B shows the distribution of cancer mortality ratio comparing Black persons to White persons. In the 1048 counties studied, the mean cancer mortality ratio was 1.12, indicating that cancer mortality rate among Black persons was on average 12% higher than that among White persons. Cancer mortality ratio was heterogeneously distributed across counties, ranging from .44 (in Coryell County, TX) to 2.03 (District of Columbia). Map of oncology provider density per 100 000 in 2013 (Panel A) and cancer mortality ratio comparing Black to White persons from 2014-2018 (Panel B) for US counties and the District of Columbia. Note. In Panel a, oncologist count data came from the 2013 CMS National Plan and Provider Enumeration System. In Panel b, Black-White cancer mortality ratio was defined as age-standardized cancer mortality rate among Black persons of a given county divided by the rate among White persons. Cancer mortality rates included all cancer sites, all ages and sexes, from 2014 to 2018, provided by the State Cancer Profiles. Greater inequity in cancer mortality rate was depicted by red color (higher cancer mortality rate for Black vs White persons) or blue color (lower cancer mortality rate for Black vs White persons). Equity in cancer mortality rate was depicted by white color. (A) total of 1075 counties had complete data for cancer mortality ratio. Cancer mortality ratio was unavailable for 2067 counties, depicted by grey color, where race-specific cancer mortality rates were unavailable on the State Cancer Profiles. R (version 4.0.2) was used to generate the figure.
Association of Oncology Provider Density (per 100 000) With County-Level Cancer Mortality Ratio Comparing Black to White Persons in the US, Adjusting for Covariates.

aContinuous variables were converted to z-scores, and their coefficients shown in the table represent the change in cancer mortality ratio associated with 1 standard deviation (SD) increase in the independent variable.
To investigate why oncology provider density was associated with higher Black-White cancer mortality ratio, we modeled the association of oncology provider density with cancer mortality rates, overall and separately among Black and White populations (Figure 2; Supplemental Table 2) Association of oncology provider density (per 100 000) with age-standardized cancer mortality rates (per 100 000) overall and among Black and White persons in the US. Note. Estimate represents the change in age-standardized cancer mortality rate per 100 000 associated with 1 standard deviation increase in oncology provider density per 100 000. Estimate was adjusted for age-standardized cancer incidence rate per 100 000 (overall and among Black and White persons, respectively), Gini index, percent of population that is Black (only in the model of overall cancer mortality rates), percent of health insurance coverage, metropolitan status, and census region. Error bars indicate 95% confidence interval (CI). R (version 4.0.2) was used to generate the figure.
To contextualize these results, we next predicted the cancer mortality rates among Black and White populations by oncology provider density, adjusting for covariates (Figure 3). In counties with 5 oncologists per 100 000, the predicted cancer mortality rates were 194.0 per 100 000 (95% CI: 183.5 to 204.6) for Black population and 162.2 per 100 000 (95% CI: 155.2 to 169.1) for White population. These mortality disparities were predicted to be greater among counties with more oncologists. In counties with 15 oncologists per 100 000, the predicted cancer mortality rates were 202.6 per 100 000 (95% CI: 171.3 to 233.8) for Black population and 146.3 per 100 000 (95% CI: 125.7 to 166.8) for White population. Predicted cancer mortality rates per 100 000 among Black and White persons by oncology provider density in the US. Note. Predicted cancer mortality rates were estimated after fitting a multivariable linear regression model for the outcome of cancer mortality rates among Black and White persons separately, adjusting for Gini index, cancer incidence rate (among Black and White persons, respectively), percent of health insurance coverage, metropolitan status, and census region. Error bar indicates 95% confidence interval for the predicted estimates. Excel was used to generate the figure.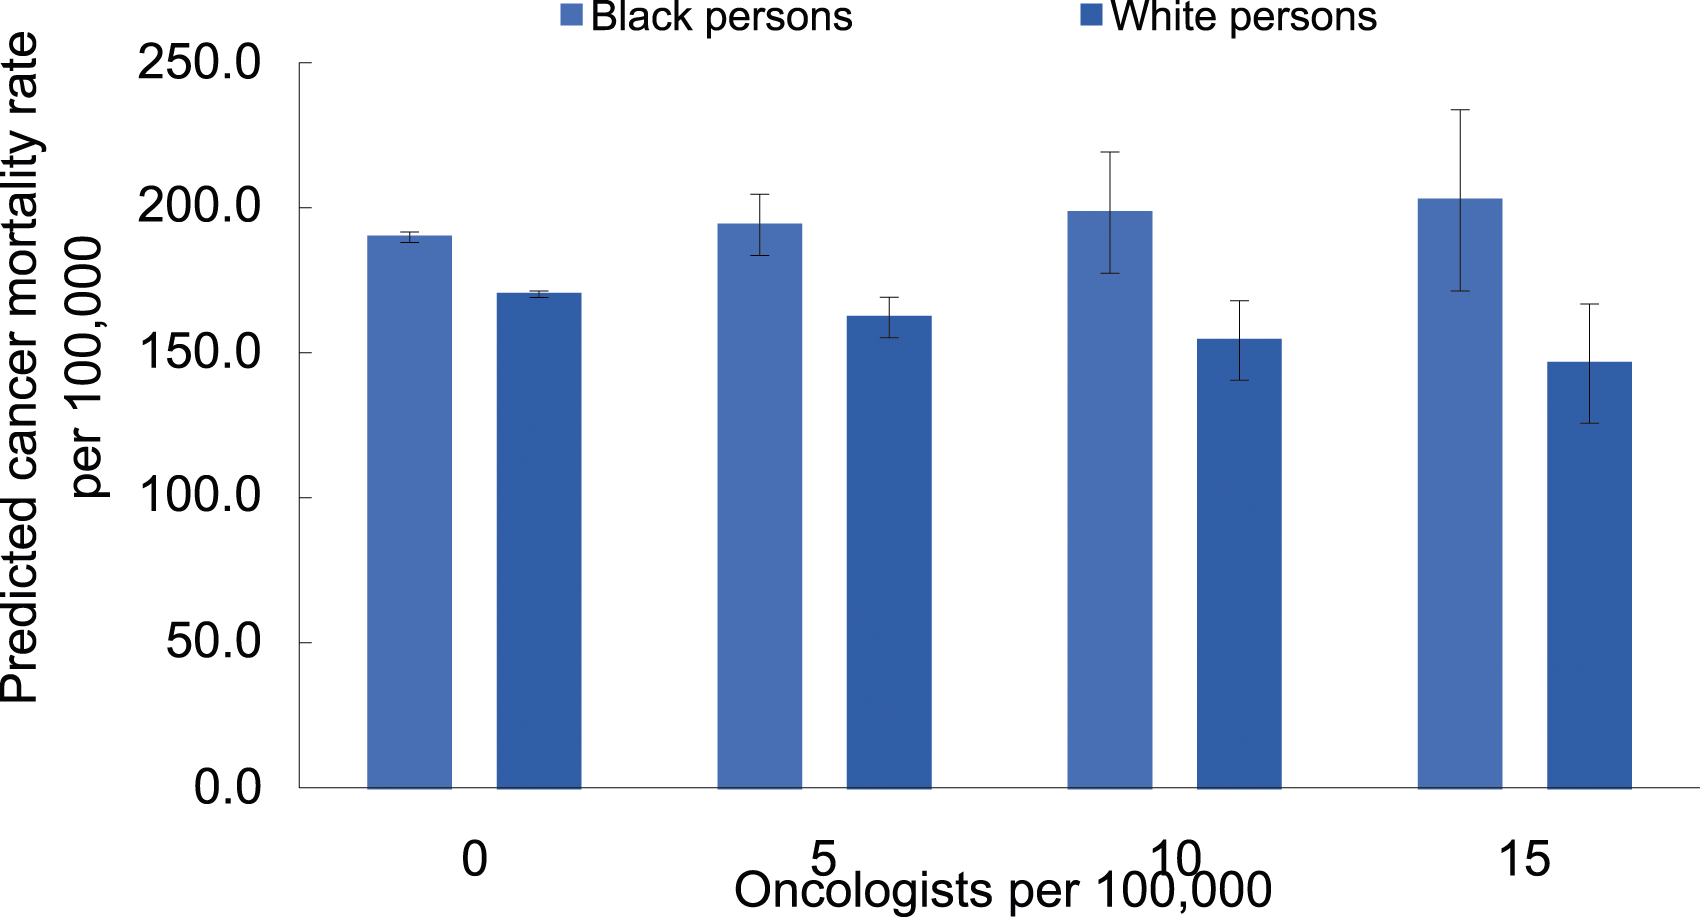
Results from sensitivity analyses where oncology provider density was modeled as a categorical variable were similar to primary results (Supplemental Tables 3 and 4).
Discussion
Contrary to our initial hypothesis, higher oncology density in US counties was associated with greater income inequality, Black-White cancer incidence disparities, and Black-White mortality disparities. Upon further inspection, this result was driven by differential relationships between oncology provider density and cancer mortality by race group: a higher density of oncology providers in a county was associated with lower mortality rates among White persons, but not among Black persons. These findings may also indicate that oncology provider density data are a good proxy for oncology service access and use among White persons but not Black persons. To our knowledge, this is the first study to assess the association of oncology provider density and racial disparities in cancer outcomes.
Our findings of better cancer outcomes among White persons in areas with higher oncology provider density were consistent with results of previous studies in the US.14,18 In studies of SEER data, overall survival is higher 14 and prostate cancer mortality rates were lower 18 in areas with higher provider density. Similarly, higher density of urologists and dermatologists have been associated with lower mortality rates for urologic cancer and melanoma, respectively.19,20 Our research adds to this body of literature by illustrating that the potential protective impact of higher oncologist supply is not equally reaching Black persons.
We found that oncology provider density was not associated with improved cancer mortality among Black persons. This finding is consistent with the diminishing return hypothesis, which in the context of health suggests that Black persons receive diminished health returns from resources and assets compared with their White counterparts.21,22 Several potential mechanisms may underlie this finding. First, high oncology provider density does not necessarily reflect access to high-quality cancer care because of race-based segregation that has led to inequal geographic distribution of high-quality cancer care facilities. For example, in Chicago, 1 of the most persistently racially segregated cities in the US, hospitals with an American College of Surgeons Commission on Cancer Center designation were disproportionally located in predominantly White neighborhoods, while only 2 of 12 hospitals with American College of Surgeons designation were located in predominantly Black neighborhoods. 23 Therefore, despite the oncology care available, Black patients living in these neighborhoods might have been more likely to encounter obstacles to high-quality cancer care compared with their White counterparts.
Aside from unequal geographic distribution of facilities providing high-quality cancer care, Black patients may encounter challenges in accessing care at high-quality facilities. In the US, Black patients remain less likely to have insurance coverage than White patients, 24 and are disproportionally treated at safety-net hospitals which provide healthcare to patients irrespective of their insurance status. While some studies suggest that safety-net hospitals had similar levels of performance on quality measures compared with other hospitals, studies in oncology care and others have reported an association of safety-net hospitals with poorer performance, longer hospital stays, increased rates of mortality and surgical complications than non-safety-net hospitals.25-27
In addition, Black patients may be treated by different providers and experience different referral patterns.28-30 In an early study of Medicare beneficiaries, Bach and colleagues reported that primary care providers treating Black patients were less well trained, and were more likely to face challenges in accessing high quality healthcare resources for their patients. 29 Differences in providers’ qualification leading to differential referral patterns may in part explain disparities in the number of subspecialist referrals/visits,31-33 quality of the treatment received, 34 and quality of the hospital where subsequent care is given 35 between Black and White cancer patients.
Disparities in cancer outcomes between Black and White persons may still occur due to cumulative challenges that Black persons experience along the cancer care continuum. In the US, Black persons are more likely to be diagnosed at more advanced stages than White persons for breast cancer, lung cancer, colorectal cancer, and prostate cancer2,36; stage at diagnosis is 1 of the most influential factors contributing to racial disparities in cancer survival. 36 Among patients with cancer, Black persons were more likely to encounter treatment delays and receive different treatment regimens and examinations compared with White persons.37-43 For example, in an observational study of breast cancer patients, Black women were more likely to experience delayed initiation of adjuvant chemotherapy, which was associated with poor outcomes. 38 During and after cancer treatment, Black-White racial disparities in health-related quality of life have also been documented. 44 It is possible that Black patients who are disproportionately exposed to discrimination and barriers to health care 45 may be more vulnerable to adverse effects of cancer diagnosis and treatment, leading to worse survival.
Given the growing concern about the need to increase oncology provider density, the healthcare community must be careful to think about how to also optimize equity of care. As suggested by our findings, greater oncologist supply alone may be insufficient to overcome existing systematic disadvantages for Black persons to access and use high-quality cancer care. In fact, increasing oncology provider density while failing to account for the context of overarching health inequities may potentially further widen the gaps in cancer mortalities between Black and White persons. Collective efforts within and among institutions are needed to identify solutions to address structural racism that is a root cause of unequal distribution of high-quality healthcare resources and to promote equity in cancer care delivery.
Our study has a few limitations. First, we used a single source, NPPES data, to generate oncology counts; however, NPPES has similar levels of accuracy as other data sources (e.g., SK&A and American Medical Association Physician Masterfile)
46
and our estimated oncologist count is mostly consistent with the figures previously published.47-49 Our estimate may have been an undercount, however, since we could not account fornur secondary provider practice locations and the oncologist workforce has been slowly increasing since 2013,
47
and cancer surgeons may have been listed under some other surgical taxonomy code other than oncology (e.g, thoracic surgery, general surgery). County-level oncology provider density is an imperfect measure of access, especially in areas where patients may cross county borders for care
Conclusion
In conclusion, we demonstrate that higher oncology provider density is associated with lower cancer mortality rates among White persons, but not among Black persons. Increasing oncology provider density alone may not resolve cancer mortality disparities, thus attention to ensuring equitable cancer care remains critical even if oncology provider density grows.
Supplemental Material
Supplemental Material - The Association of Oncology Provider Density With Black-White Disparities in Cancer Mortality in US Counties
Supplemental Material for The Association of Oncology Provider Density With Black-White Disparities in Cancer Mortality in US Counties by Yuehan Zhang, Kathryn M. Leifheit, Kimberley T. Lee , Roland J. Thorpe, Darrell J. Gaskin, and Lorraine T. Dean in Cancer Control
Footnotes
Author Contributions
Conceptualization: All authors
Methodology: All authors
Writing – original draft: All authors
Writing – review & editing: All authors
Data curation: Zhang, Leifheit
Formal Analysis: Zhang, Leifheit
Visualization: Zhang, Leifheit
Funding acquisition: Gaskin, Thorpe
Resources: Gaskin, Thorpe
Project administration: Dean
Supervision: Dean
Authors’ Note
Abstract was presented as a virtual poster presentation at 14th AACR Conference on The Science of Cancer Health Disparities in Racial/Ethnic Minorities and the Medically Underserved, October 2021.
Declaration of Conflicting Interests
The author(s) declared no potential conflicts of interest with respect to the research, authorship, and/or publication of this article.
Funding
The author(s) disclosed receipt of the following financial support for the research, authorship, and/or publication of this article: This work was supported by the Agency for Healthcare Research and Quality (2T32HS000046) and National Institutes of Health (U54MD000214). The National Institute On Minority Health And Health Disparities of the National Institutes of Health, and the Agency for Healthcare Research and Quality played no role in the design and conduct of the study; collection, management, analysis, and interpretation of the data; preparation, review, or approval of the manuscript; and decision to submit the manuscript for publication.
Ethical Statement
Data Availability Statement
The datasets generated during and/or analyzed during the current study are available in the public domain: CMS National Plan and Provider Enumeration System (https://download.cms.gov/nppes/NPI_Files.html), State Cancer Profiles (https://statecancerprofiles.cancer.gov/data-topics/incidence.html; https://statecancerprofiles.cancer.gov/data-topics/mortality.html), and United State Census Bureau (![]() ). The data underlying this article will be shared on reasonable request to the corresponding author.
). The data underlying this article will be shared on reasonable request to the corresponding author.
Supplemental Material
Supplemental material for this article is available online.
Appendix
References
Supplementary Material
Please find the following supplemental material available below.
For Open Access articles published under a Creative Commons License, all supplemental material carries the same license as the article it is associated with.
For non-Open Access articles published, all supplemental material carries a non-exclusive license, and permission requests for re-use of supplemental material or any part of supplemental material shall be sent directly to the copyright owner as specified in the copyright notice associated with the article.