
Abstract
Introduction
Neuroblastoma is the most common extracranial solid tumor in children. Patients with high-risk neuroblastoma have a 5-year survival rate less than 50% after extensive treatment. Signaling pathways control cell fate decisions that dictate the behavior of tumor cells. The deregulation of signaling pathways is etiological in cancer cells. Thus, we speculated that the pathway activity of neuroblastoma contains more prognostic information and therapeutic targets.
Methods
Using a footprint-based method, we calculated the activity of fourteen pathways in neuroblastoma. Through stepwise Cox regression analyses, we established a three-gene prognostic signature whose predictive performance was evaluated by external validation. Combining a single-cell sequencing dataset, the most active pathways in high-risk neuroblastoma were found.
Results
We found that several pathway activities were correlated with neuroblastoma outcomes. We built a three-gene model comprising DLK1, FLT3, and NTRK1, which exhibited superior internal and external performances. We created a nomogram that combines clinical characteristics to aid in the selection and visualization of high-risk neuroblastoma patients. Furthermore, by integrating a single-cell sequencing dataset, we found that estrogen and MAPK were the most active pathways in high-risk neuroblastoma.
Conclusion
Our findings suggest that pathway-related therapies may hold promise for the treatment of high-risk neuroblastoma.
Introduction
Neuroblastoma is a highly heterogeneous pediatric tumor ranging from spontaneous regression to metastasis.1,2 Prognostic factors for neuroblastoma include tumor stage, age at diagnosis, and MYCN status. Generally, high-risk neuroblastoma is more prevalent in patients over 18 months old with metastatic disease or those with MYCN amplification.3,4 While low-risk neuroblastoma exhibits a 5-year overall survival rate of approximately 90%, the survival rate for high-risk neuroblastoma drops to 50% even after multimodal treatment. 5 Despite its potential as a therapeutic target, MYCN is considered undruggable due to a lack of a binding surface. 6 Thus, new therapeutic strategies for high-risk neuroblastoma are urgently needed.
Various methods have been employed to develop numerous prognostic signatures for neuroblastoma. For example, Zhong constructed a prognostic model including ERCC6L, AHCY, STK33, and NCAN using the random forest algorithm, demonstrating good predictive ability. 7 Xia grouped patients based on MYCN status and constructed a five-gene prognostic model including CPLX3, GDPD5, SPAG6, NXPH1, and AHI1 using stepwise Cox regression, which exhibited good predictive ability in neuroblastoma prognosis. 8 Garcia constructed a neuroblastoma prognostic model using PCR, which included three genes: CHD5, PAFAH1B1, and NME1. 9 Among them, the CHD5 gene, located at 1p36 and used as a detection target for 1p deletion, has been widely applied in the prognosis stratification of neuroblastoma patients. 10
Driver events in the tumor, such as copy number variation and mutation, are crucial for understanding the mechanism and identifying therapeutic targets.11,12 However, tumors are not solely genetic diseases; they are also diseases with altered signaling pathways. 13 Several gene variations point to one pathway alteration, indicating that pathway activity may be a more personalized target than driver mutations.14,15
Herein, we speculate that the pathway activity of neuroblastoma contains more prognostic information than traditional clinical-characteristic biomarkers. Through bioinformatics calculations, we explored the correlation between neuroblastoma pathway activity and outcomes and the most active pathways in high-risk neuroblastoma. We aim to provide a deeper understanding of pathway activity in high-risk neuroblastoma and to offer new therapeutic strategies through this research.
Materials and Methods
Data Acquisition
The expression matrix and clinical information from GSE49710 (Zhang et al, n = 498) were downloaded from the GEO database. The expression matrix and clinical information for E-MTAB-8248 (Christoph et al, n = 223) were downloaded from the ArrayExpress database. The batch effect of the expression matrix was removed in the “limma” package. 16 The GSE49710 was used to build and validate the prognostic model, and the E-MTAB-8248 was used to validate the model.
The count matrix of the neuroblastoma single-cell dataset was downloaded from the Shiny App (https://adrenal.kitz-heidelberg.de/developmental_programs_NB_viz/). The count matrix was processed and annotated according to the authors’ protocol. 17
Pathway Scores Calculation and Unsupervised Clustering
The “PROGENy” package was used to calculate pathway scores of the GSE49710 dataset. Briefly, following the package instructions, the expression matrix of GSE49710 was vsn-normalized. For the bulk-sequencing dataset, the top 100 most representative genes per pathway were used to compute scores. For the single-cell sequencing dataset, the top 500 most representative genes per pathway were used to compute scores. In practice, pathway scores were calculated using the formula P = E × G, where E represents the expression matrix and G represents the gene regulatory model matrix.
The median value normalizes the pathway scores for clustering. The “ConsensusClusterPlus” package was utilized to cluster neuroblastoma samples based on the pathway scores. 18
Differentially Expressed Gene Identification and Functional Enrichment
The neuroblastoma samples were divided into two clusters based on the clustering results. The probes matched the symbols according to the annotation file provided by the manufacturer. The median expression value represents the gene expression value when multiple probes matched a single gene. Differentially expressed genes (DEGs) were explored between clusters using the “limma” package with a cutoff setting of |log2 (fold-change) | > 2 and adjusted P-value <.01. DEGs functional enrichment analyses were carried out through the “ClusterProfile” package. 19
Predictive Signature Establishment and Validation
Stepwise Cox regression analysis was used to establish the predictive signatures. DEGs (P < .01 in the univariate Cox analysis) were included in the subsequent Cox analysis. LASSO-penalized Cox regression analysis was performed to reduce the number of genes with the best predictive power in the “glmnet” package. 20 A predictive signature was constructed based on a linear combination of the mRNA expression values and multiple regression coefficients. Patients were divided into high- and low-risk groups based on the median risk value of the signature. Kaplan–Meier analysis, Harrell’s concordance index (C-index), and the area under the curve (AUC) of the receiver operating characteristic curve were used to evaluate the performance of the signature.
The E-MTAB-8248 dataset was used for the signature validation. The same formula was used to compute the risk score, and the patients were divided into high-risk or low-risk groups using the cutoff value calculated from the GSE49710 dataset. The two groups were compared to evaluate signature performance.
Nomogram Construction
The independent prognostic characteristics of neuroblastoma were identified through univariate Cox regression analysis with
Drug Sensitivity Prediction
Genomics of Drug Sensitivity in Cancer (GDSC) was used as the training data. The “oncoPredict” package was used to predict the drug sensitivity of IC50 to pathway-related chemotherapy drugs for the 498 neuroblastoma patients in GSE49710 dataset through a ridge regression analysis.
Tumor Immunity Assessment
Stromal, immune, and estimated scores were calculated using the Estimation of STromal and Immune cells in MAlignant Tumor tissues using the Expression data (ESTIMATE) algorithm in the “IOBR” package. Multiple algorithms, including xCell, CIBERSORT, MCPcount, EPIC, and other literature-based genesets, were used to predict the NK cell, T-cell, and B-cell infiltration between subgroups in the “IOBR” package.
Statistical Analysis
Statistical analyses were performed using RStudio (version 1.1.463). The Kaplan–Meier method was used to compare overall survival between groups. Univariate Cox and LASSO-penalized Cox regression analyses were used to evaluate the overall survival-related characteristics. The Mann–Whitney U test was used to compare immune cell infiltration between the groups. Unless otherwise stated,
Results
Subgroup Neuroblastoma Patients by 14 Pathway Scores
The research flowchart is presented in Supplementary Figure 1. Using the “PROGENy” package, we calculated 14 pathway scores of the 498 neuroblastoma patients in the GSE49710 dataset.
22
Supplementary Table 1 shows the clinical information of the GSE49710 dataset. The association of pathway scores was relatively weak (P > 10-10), except for EGFR with MAPK and NF-κB with TNFα, which existed in biological cross-talk (Figure 1A). Univariate Cox regression analysis revealed that the estrogen, MAPK, and EGFR pathways were promotion factors, whereas the NF-κB, TNFα, Trail, and androgen pathways were protective factors for neuroblastoma (Supplementary Table 2, | Neuroblastoma Classification based on the PROGENy Pathway Scores (A) Correlation for each PROGENy pathway score. Few cross-talks were observed in agreement with biological knowledge. •P < 10-5. (B) Clustering results of 498 neuroblastoma samples in the GSE49710 dataset at k = 2. (C) Heatmap showing pathway scores in two clusters. **P < .01, ****P < .0001, n.s., not significant. (D) t-distributed stochastic neighbor embedding (t-SNE) visualization of two clusters. (E) Overall survival curves of the two clusters. The log-rank test was used to calculate the P-values. (F) Show the MYCN amplification neuroblastoma sample distribution in two clusters.
DEGs Between Clusters
We calculated differentially expressed genes (DEGs) between clusters with the criteria set as |log2FC|>2 and adjusted-P-value <.01.1 upregulated and 31 downregulated genes were found (cluster2 vs cluster1, Supplementary Figure 2A). Functional enrichment analysis revealed that the DEGs mainly participated in immune cell differentiation and the regulation of cytokine (Supplementary Figure 2B). We performed univariate Cox analysis to explore the association between DEGs and patient outcomes. 27 of the 32 DEGs were identified to be associated with overall survival (Supplementary Figure 2C), (
Three-Gene Risk Model Construction and Validation
Stepwise Cox regression analysis was used to reduce the number of genes for prognostic model construction. Three genes, including Fm-Related Receptor Tyrosine Kinase 3(FLT3), Delta-Like Non-Canonical Notch Ligand 1 (DLK1), and Neurotrophic Receptor Tyrosine Kinase 1(NTRK1), were selected for LASSO-penalized Cox analysis (Figure 2A-B). A prognostic model was constructed using multivariate Cox regression (Figure 2C) and the risk score was calculated using the following equation: | Construction and Validation of the Predicative Three-Gene Signature (A) LASSO coefficient profiles of 27 DEGs. Each gene is colored and the dotted line indicates the selected gene. (B) The ten-fold cross-validation for tuning predictor selection. (C) The forest plot of the three-gene signature. (D) Overall survival curves of the two risk groups. Patients from the GSE49710 dataset were divided into two groups based on the median risk score calculated using this equation. The log-rank test was used to calculate the P-values. (E) Distribution of the risk score, survival data, and mRNA expression levels of each patient in the GSE49710 dataset. (F) ROC curves predict 1-year, 3-year, and 5-year overall survival for the three-gene signature. (G) Show the MYCN amplification neuroblastoma sample distribution in two risk groups. (H) AUC values of the three-gene signature, INSS stage, and MYCN status model. (I) Show the 1-year, 3-year, and 5-year DCA curves of the three-gene signature, INSS stage, and MYCN status model are shown.
Risk score = [(-.15198) × expression value of FLT3] + [(.11482) × expression value of DLK1] + [(-.29222) × expression value of NTRK1].
The median risk score (−3.285) was set as the cut-off value. The patients were grouped based on their risk scores. Compared with the high-risk group, the low-risk group showed significantly favorable overall survival (Figure 2D-E, (
External Validation of the Three-Gene Model
The E-MTAB-8248 dataset was used to validate the performance of the three-gene model. The risk score was calculated using the same formula, and the cutoff value (−3.285) was adopted from the GSE49710 dataset. Patients were divided into high- and low-risk groups. The two groups exhibited great separation in t-SNE analysis (Supplementary Figure 3A). The low-risk group exhibited favorable outcomes (Supplementary Figure 3B-C, (
Clinical Characteristics and Immune Infiltration Association of the Three-Gene Model
We explored the association between the three-gene model and clinical characteristics of neuroblastoma in the GSE49710 dataset. Late-stage and MYCN amplification neuroblastoma manifested a higher risk score (Figure 3A-B). Furthermore, patients with higher risk scores were more likely to progress (Figure 3C). | The Clinical Characteristics Relevance and Immunity of the Signature (A-C) Show the risk score distribution in INSS stage groups (A), MYCN status (B), and tumor progression status (C) in the GSE49710 dataset. ****P < .0001. (D)The distribution of the immune score, stromal score, estimate score, and tumor immunity in the high-risk and low-risk groups. The ESTIMATE algorithm calculates the infiltration scores. ****P < .0001. (E-G) The distribution of the NK cell(E), T cell(F), and B cell(G) scores in the high-risk and low-risk groups. The scores were calculated by multiple algorithms collected in the “IOBR” package. *P < .05, **P < .01, ****P < .0001, n.s., not significant.
We evaluated immune cell infiltration using multiple algorithms to explore differences in tumor immunity between the risk groups. Compared with the higher-risk group, the low-risk group showed a higher immune score by ESTIMATE analysis, indicating more immune cell infiltration in the low-risk group (Figure 3D). We scored T, NK, and B cells collected in the “IOBR” package using the ssGSEA algorithm to deconvolute the immune cell difference between risk groups.23,24 In most circumstances, the low-risk groups exhibited higher NK cell, CD8 + T cell, CD4 + T cell, and B cell infiltration (Figure 3E-G).
Nomogram Construction and Pathway Activity Correlation
A nomogram provides direct visualization of patient prognosis. Four hundred ninety-three neuroblastoma with complete clinical information, including age, stage, MYCN status, and sex, were used for nomogram construction. Cox regression analysis revealed that age, stage, MYCN status, and the three-gene risk score were independent prognostic factors for neuroblastoma (Figure 4A). We built a nomogram for predicting 1-year, 3-year, and 5-year survival based on the Cox regression results (Figure 4B). The patients were divided into two groups based on the nomogram points. The survival curve was significantly discriminative: the low-point group without death events, while the high-point group had a 5-year overall survival of about 37%, indicating that the nomogram model has fair usage for high-risk neuroblastoma patients (Figure 4C). The AUCs for 1-year, 3-year, and 5-year overall survival predictions of the nomogram model were .847, 0.905, and .915, respectively (Figure 4D). Furthermore, the calibration plots demonstrated that the nomogram performed satisfactorily in predicting the overall survival of neuroblastoma patients in both the short and long term (Figure 4E). | Nomogram Construction (A) Univariate Cox regression analysis of overall survival-related clinical characteristics in GSE49710 dataset. (B) Nomogram predicting 1-year, 3-year, and 5-year overall survival of neuroblastoma. (C) Overall survival curves of the nomogram. The patients were divided into two groups based on the nomogram point. The log-rank test was used to calculate the P-values. (D) ROC curves predict the nomogram 1-year, 3-year, and 5-year overall survival. (E) Calibration plot of 1-year, 3-year, and 5-year survival rates for validation of the nomogram. The x-axis represents the predicted overall survival, and the y-axis represents the actual survival.
To determine which pathway plays a vital role between nomogram groups, we calculate each pathway’s normalized enrichment score (NES) through enrichment analysis in the “PROGENy” package. Estrogen and MAPK were the most active pathways, whereas NF-κB was the most inactive pathway in the high-point nomogram group (Figure 5A). The most responsive genes (progeny weights) and their t-values for the estrogen pathway were labeled (Figure 5B). We used the single-cell sequencing dataset of neuroblastoma to validate the pathway differences in neuroblastoma tumor cells. In the single-cell sequencing dataset, each cell pathway activity was calculated in the “PROGENy” package. UMAP displayed high-risk (NB11, NB14) and low-risk (NB04, NB07) neuroblastoma cell composition, and increased infiltration of immune cells was observed in low-risk neuroblastoma (Figure 5C). The tumor cells from the high-risk neuroblastoma exhibited high estrogen, MARK, EGFR, and PI3K pathway activities, corresponding to the bulk-sequencing results (Figure 5D). In high-risk neuroblastoma, tumor cells exhibited significantly high estrogen and MAPK pathway activities (Figure 5E-G). | Pathway Difference Between Nomogram Model (A) Differences in pathway activity between nomogram groups (high-point vs low-point). The y-axis represents the normalized enrichment scores (NES), and NES >0 represents higher pathway activity. (B) Gene weights and t-values of the estrogen pathway in the nomogram groups are shown. Genes that contributed the most to the pathway were labeled. A t-value >0 represents higher expression in the high-point nomogram, and a weight>0 represents a positive contribution to pathway activity. Red indicates gene-positive regulation of pathway activity and blue indicates gene-negative regulation of pathway activity. (C) UMAP visualization of high-risk (NB11 and NB14) and low-risk (NB04 and NB07) neuroblastoma from a single-cell sequencing dataset. (D) The 14 pathway activities of tumor cells from high-risk (NB11, NB14) and low-risk neuroblastoma (NB04, NB07) (E-F) Feature plot visualization of estrogen (E) and MAPK (F) pathway activities of tumor cells in high-risk and low-risk neuroblastoma. (G) Boxplot showing estrogen and MAPK pathway activities of neuroblastoma tumor cells in different risk groups. ****P < .0001.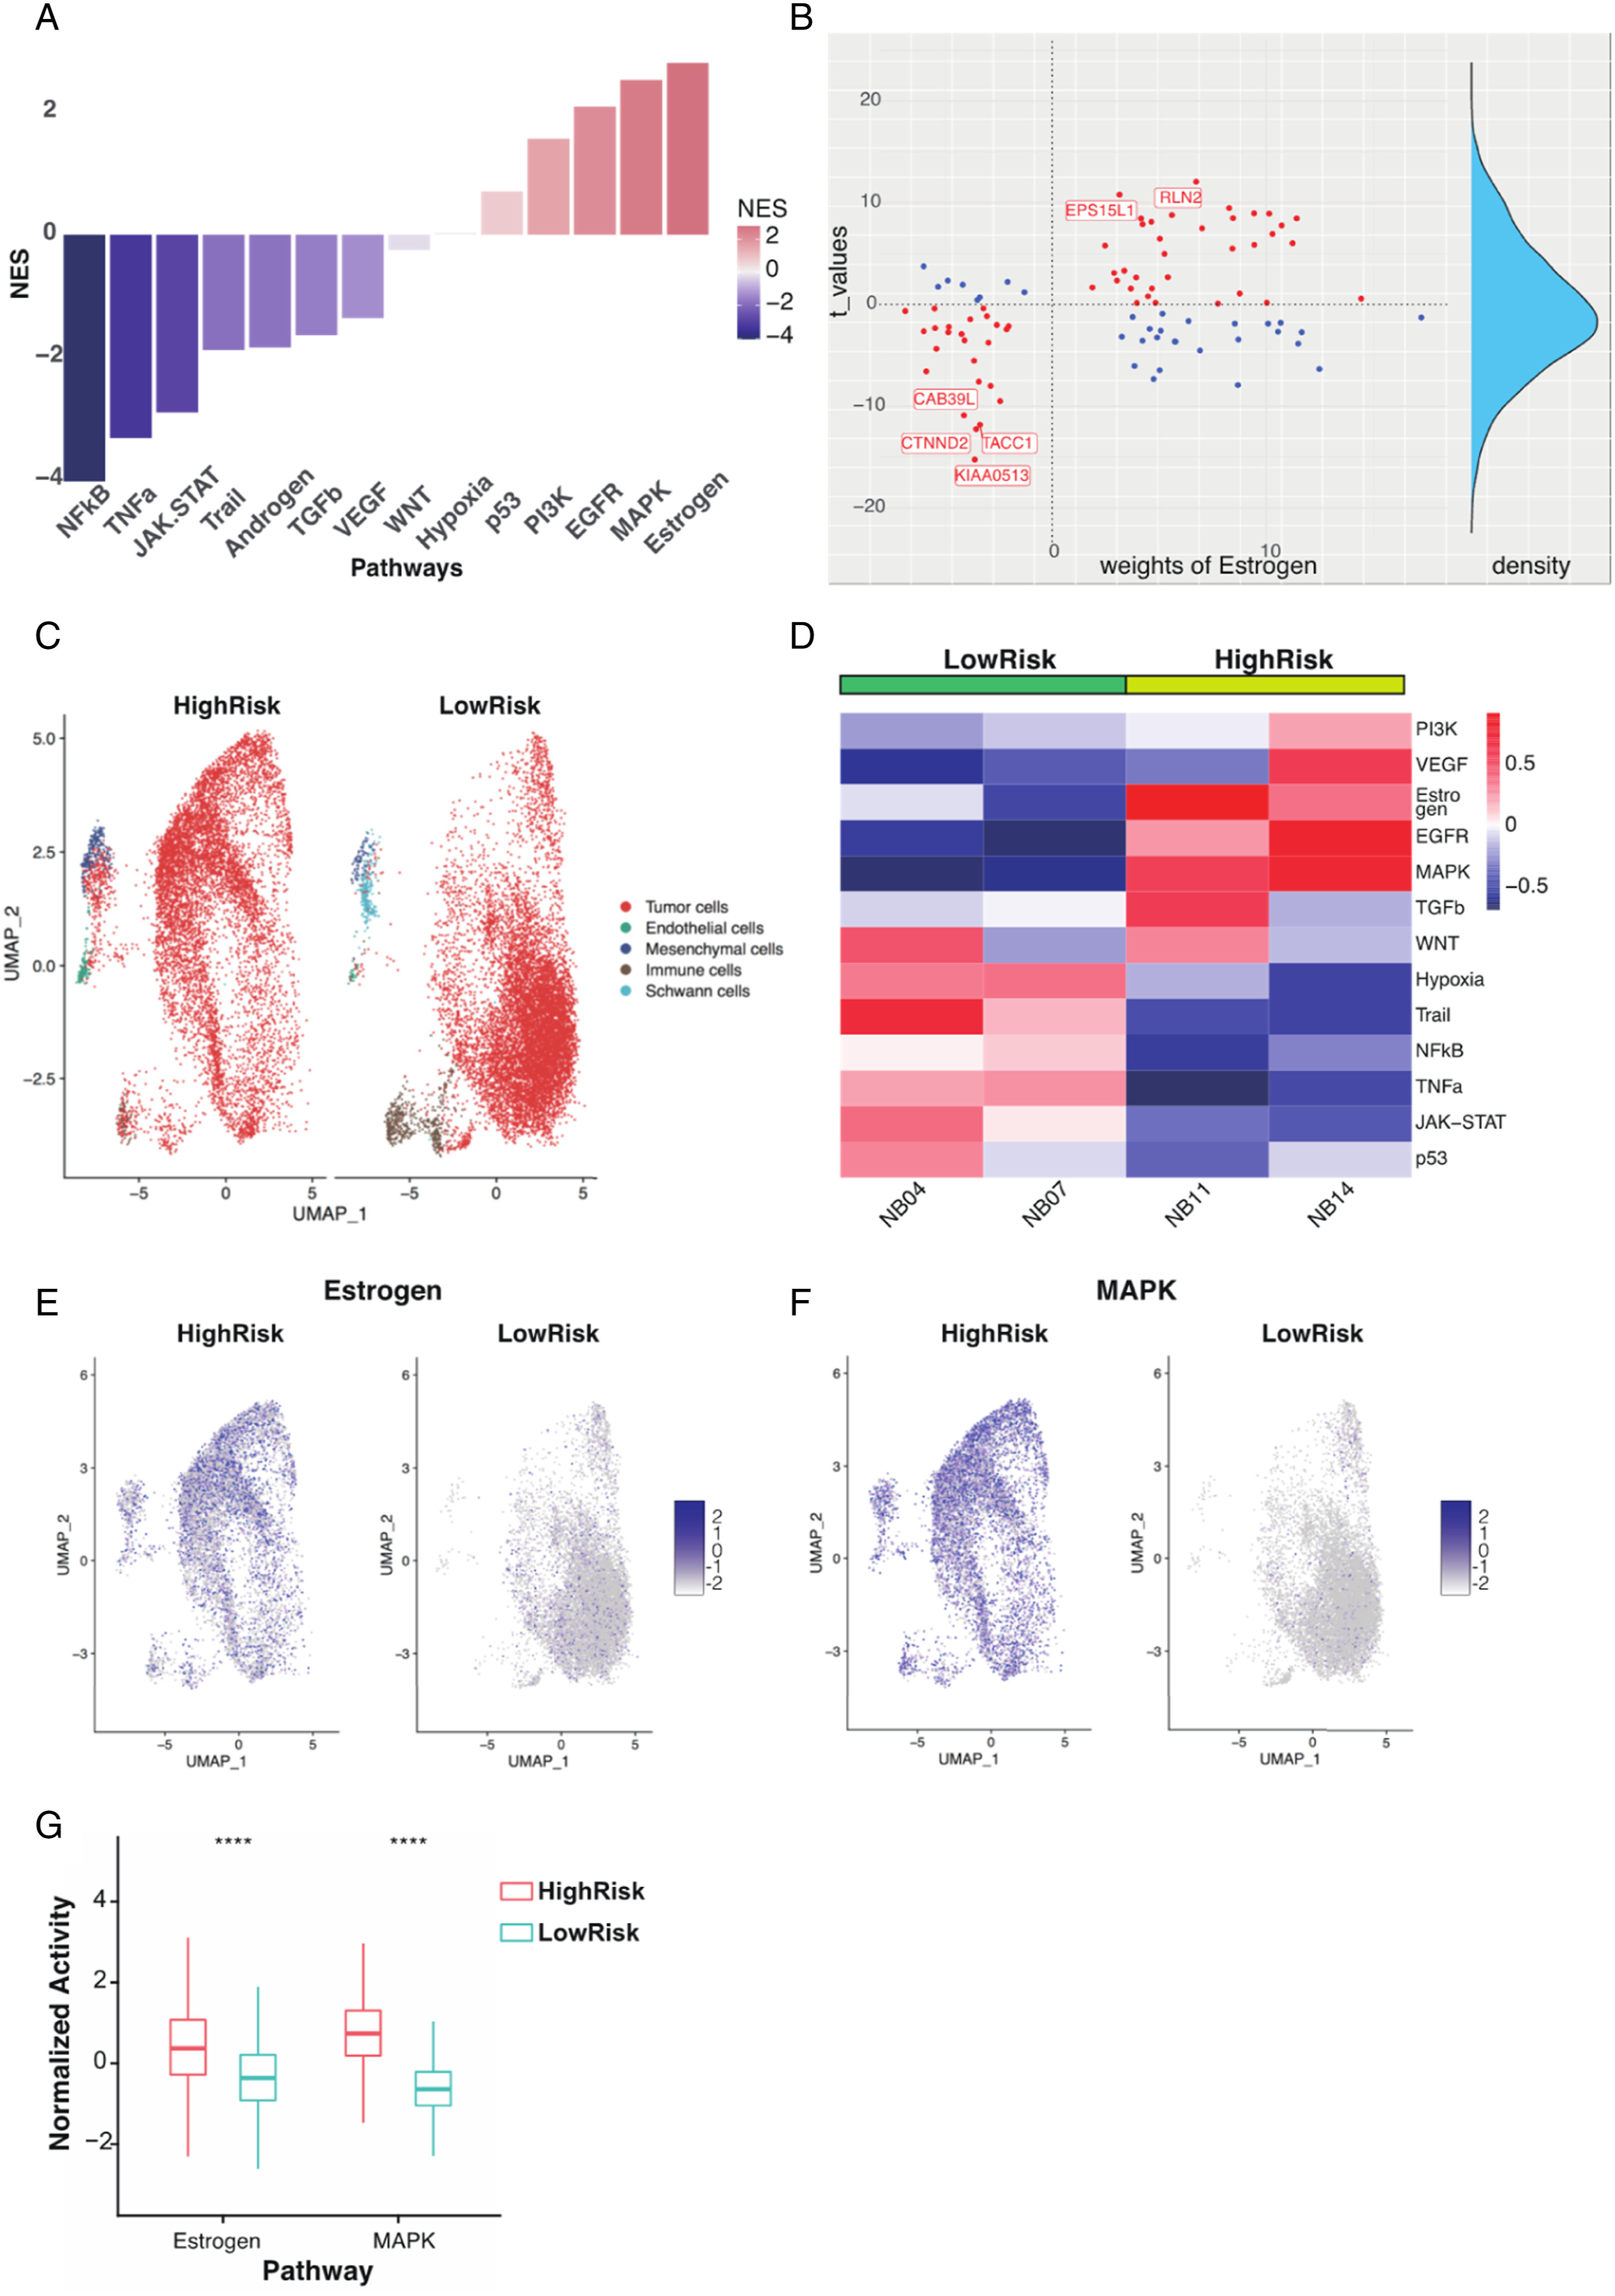
To explore the association between pathway activity and drug sensitivity, we simulated the pathway-related drug IC50 through the “oncoPredict” package. 25 The high-point nomogram group was more sensitive to estrogen pathway-related drugs (tamoxifen and fulvestrant) and MAPK pathway-targeted drugs (lapatinib and gefitinib) (Supplementary Figure 4A-B), indicating that the estrogen and MAPK pathways may be promising targets for high-risk neuroblastoma.
Discussion
We found that multiple pathway activities were correlated with neuroblastoma outcomes, with estrogen, MAPK, and EGFR pathways were promotion factors, and NF-κB, TNFα, Trail, and androgen pathways were protective factors. In high-risk neuroblastoma, the estrogen pathway was found to be the most active, while the NF-κB pathway was the most inactive. Furthermore, we identified the most responsive genes of the estrogen pathway. The estrogen pathway refers to estrogens that activate transcriptional processes by binding to the estrogen receptors (ERs).26,27 ER expression was reported to be a protective factor against neuroblastoma by inducing cell differentiation. 28 However, we found that the estrogen pathway activity was a promoting factor for neuroblastoma, and high-risk neuroblastoma showed more sensitivity to endocrine therapy-related drugs. Recent research revealed that one-third of ER-expressing breast tumors had a functionally inactive ER pathway, and ER pathway activity improved the prediction of response to endocrine therapy in breast tumors.29,30 Thus, the correlation between ER expression and the estrogen pathway, and the clinical use of estrogen pathway activity in high-risk neuroblastoma remains unclear.
In addition to the estrogen pathway, we found that MAPK, EGFR, and PI3K pathway activities were increased in high-risk neuroblastoma. MAPK pathway activity is strongly correlated with the EGFR pathway, which exists in biological cross-talk. Previous studies showed that 80% of relapse neuroblastoma exhibited a hyper-activating MAPK pathway,31,32 and our findings suggest that high-risk neuroblastoma patients may benefit from MAPK pathway inhibition drugs, indicating its potential as an effective therapeutic target. The PI3K pathway is one of the most frequently activated pathways in adult and pediatric tumors, affecting 50% of malignancies. 33 However, the activation mechanism of the PI3K pathway is different: adult tumors mainly depend on mutations in PIK3CA or PTEN, whereas neuroblastoma mainly depends on mutations in ALK. 34 Ongoing clinical trials are evaluating the efficacy of targeting the PI3K pathway in neuroblastoma. 35
TP53 is widely recognized as a classic tumor suppressor gene due to its crucial role in regulating cell division and preventing the formation of cancerous cells. Mutations in the p53 gene are commonly found in adult tumors, which further supports its significance in tumor suppression. 36 The occurrence of germline and somatic p53 mutations in neuroblastoma is rare, which suggests that p53 activity may be regulated through alternative mechanisms. 37 There is growing evidence to suggest that the p53 pathway is deactivated in neuroblastoma, with MDM2 overexpression possibly playing a predominant role in negatively regulating p53 activity. 38 Our single-cell sequencing analysis showed that tumor cells from high-risk neuroblastoma display lower p53 pathway activity, which is consistent with the classical understanding of p53 as a tumor suppressor gene. However, the bulk-sequencing analysis revealed that high-risk neuroblastoma exhibits greater p53 pathway activity. We speculated that unlike MYCN amplification, the p53 pathway dysfunction may not be a driver event in neuroblastoma formation and progression, since germline and somatic p53 mutations are rare in neuroblastoma. Further investigation is warranted to address this inconsistency. The NF-κB pathway is a group of highly conserved transcription factors that regulate cell survival. Recent studies have demonstrated that the activity of NF-κB in neuroblastoma is cell type-specific, with the SH-EP and SK-N-AS cell lines exhibiting constitutively active NF-κB activity, while the SH-SY5Y and IMR-32 cell lines exhibit constitutively inactive NF-κB activity to prevent apoptosis and sustain cell survival. 39 By integrating bulk sequencing and single-cell sequencing, our findings revealed that high-risk neuroblastoma exhibits notably reduced NF-κB pathway activity, indicating that NF-κB activity is a protective factor for neuroblastoma.
Immunotherapy is a prominent area in cancer treatment. However, neuroblastoma, due to its low mutation burden and lack of T-cell infiltration, is considered immunologically “cold”. 40 While immune checkpoint blockade antibodies targeting CTLA4, PD-1, and PD-L1 have shown no impact on the clinical outcomes of neuroblastoma. 40 Dinutuximab, the FDA-approved immunotherapy for high-risk neuroblastoma, has significantly improved 2-year event-free survival rates. However, its contribution to 5-year overall survival rates is limited. 41 One major drawback of dinutuximab is its inability to induce immunological memory, which can prevent relapse in high-risk neuroblastoma. 42 Therefore, developing strategies to convert the immunosuppressive environment of neuroblastoma into an immunostimulating one and inducing immunological memory may prove promising in addressing this issue. Our analysis revealed that low-risk neuroblastoma are associated with greater infiltration of CD8+ T-cells, natural killer (NK) cells, and CD4+ T-cells, as well as favorable outcome. The presence of NK cells in the tumor microenvironment (TME) has been linked to improved prognosis in neuroblastoma. NK cells mediate cellular cytotoxicity, which is a key mechanism of anti-GD2 therapy in neuroblastoma. A combination of anti-GD2 antibodies and adoptively transferred NK cells has been shown to significantly improve survival in neuroblastoma patients. 43 Higher abundance of CD8+ T-cells has also been correlated with favorable prognosis and long-term survival in neuroblastoma. 44 These findings suggest that low-risk neuroblastoma has an immunogenic “hot” phenotype, characterized by greater infiltration of anti-tumor immune cells.
Numerous neuroblastoma prognostic models have been built using various methods, but systematic research based on pathway activity predicting neuroblastoma outcomes has not been reported.7–9 Using unsupervised hierarchical clustering of 14 pathway activities and stepwise Cox regression analysis, we built a three-gene predictive model containing DLK1, FLT3, and NTRK1. The downregulated genes FLT3 and NTRK1 appeared to be associated with poor survival, whereas the upregulated gene DLK1 was identified as a tumor promoter. Internal and external validations confirmed that the three-gene model accurately predicted neuroblastoma outcomes. We created a monogram of low-risk neuroblastoma with no death events in a combined three-gene model with clinical characteristics. In contrast, high-risk neuroblastoma has a lower than 40% survival rate for 5-year, showing excellent efficiency for high-risk neuroblastoma selection and visualization. The nomogram model showed better prediction performance than traditional clinical characteristics, which may further aid neuroblastoma classification.
The three genes in the predictive model correlated with multiple tumor progressions. DLK1 is a transmembrane protein that belongs to the NOTCH non-canonical ligand family and regulates cell differentiation. 45 In normal tissues, DLK1 expression is lost after birth. However, several pediatric malignancies, such as neuroblastoma and hepatoblastoma, show high expression level of DLK1.46,47 A recent study found that DLK1 is an epigenetic oncoprotein in high-risk neuroblastoma that plays a vital role in maintaining stem cell-like neuroblastoma cells. 48 We found that DLK1 is a tumor-promoting gene in neuroblastoma that is upregulated and associated with poor survival. NTRK1 encodes tyrosine receptor kinase A (TrkA), which regulates the differentiation and migration of neural cells. 49 High TrkA expression is associated with favorable outcomes in several solid pediatric tumors, including neuroblastoma. 50 NTRK1 rearrangement, which leads to constitutive activation of kinase activity, has been reported in lung cancer, whereas no mutations or activating rearrangements have been identified in neuroblastoma, indicating multiple NTRK regulation mechanisms.51,52 In our study, NTRK1 exhibited tumor-protective roles in neuroblastoma, in which low expression correlated with poor outcomes. The mechanism of NTRK1 expression and regulation of neuroblastoma outcomes remain to be elucidated. FLT3 is a tyrosine receptor kinase that regulates hematopoietic cell proliferation and differentiation. 53 FLT3 is mainly expressed on the surface of hematopoietic progenitors in acute myeloid leukemia (AML). The mutation causes constitutive activation of FLT3 is associated with poor outcome of AML.54,55 Quizartinib, an FLT3 inhibitor, showed excellent efficacy and induced complete remission in FLT3-mutant AML tumors. 56 However, FLT3 expression was associated with a good prognosis in neuroblastoma, and whether a mutation of FLT3 exists in neuroblastoma is not known.57–59 We found that FLT3 seems to be a cancer-protective gene in neuroblastoma, that is upregulated and associated with a favorable outcome. The mechanism by which FLT3 regulating the neuroblastoma outcomes and whether FLT3 inhibitors could be used in neuroblastoma remains to be further studied.
We found that multiple pathway activity was correlated with neuroblastoma outcomes. However, this study had several limitations exist in our research. First, to our knowledge, high-risk neuroblastoma from the nomogram had higher activity of the p53 pathway, which is a classical tumor-suppressed pathway. Second, the research was based on bioinformatics analysis, which was invalidated by the clinical sample. The correlation between specific pathway activity and neuroblastoma outcomes remains a more in-depth investigation.
Conclusions
In conclusion, our findings highlight that estrogen and MAPK are the most active pathways in high-risk neuroblastoma. To the best of our knowledge, our study is the first bioinformatics analysis of the correlation between multiple pathway activities and neuroblastoma outcomes. Our findings pave the way for further studies on pathway-related therapy for high-risk neuroblastoma.
Supplemental Material
Supplemental Material - Integrating Bulk-seq and Single-cell-seq Reveals Estrogen and MAPK Pathways Associating with Neuroblastoma Outcome
Supplemental Material for Integrating Bulk-seq and Single-cell-seq Reveals Estrogen and MAPK Pathways Associating with Neuroblastoma Outcome by Xin Li, Yanlong Zheng, Qiao Ge, Zhenbo Dai, Dejun Zhou and Xiangdong Tian in Cancer Control
Footnotes
Acknowledgments
We would like to acknowledge Selina Jansky and Frank Westermann from the German Cancer Research Center for kindly providing single-cell neuroblastoma datasets.
Author Contribution
X.L. and Y.Z. performed data analysis and original draft writing; Q.G. and Z.D. reviewed and edited the manuscript; X.T. and D.Z. performed the study concept and design; X.T. is the guarantor of this work and takes responsibility for the integrity of the data and accuracy of the data analysis. All the authors have read and approved the final manuscript.
Declaration of Conflicting Interests
The author(s) declared no potential conflicts of interest with respect to the research, authorship, and/or publication of this article.
Funding
The author(s) disclosed receipt of the following financial support for the research, authorship, and/or publication of this article: This work was supported by the Tianjin Health Technology Project (Grant no. 2022QN106) and National Nature Science Foundation of China (Grant no. 81903055).
Ethics Approval
As all data analyzed in this study were obtained from publicly available datasets, no ethics approval form was required for this manuscript.
Data Availability
The data analyzed in this study were obtained from Gene Expression Omnibus (GEO) at GSE49710, ArrayExpress at E-MTAB-8248. The codes used during the current study are available from the corresponding author upon reasonable request.
Supplemental Material
Supplemental material for this article is available online.
References
Supplementary Material
Please find the following supplemental material available below.
For Open Access articles published under a Creative Commons License, all supplemental material carries the same license as the article it is associated with.
For non-Open Access articles published, all supplemental material carries a non-exclusive license, and permission requests for re-use of supplemental material or any part of supplemental material shall be sent directly to the copyright owner as specified in the copyright notice associated with the article.