
Abstract
Background
This study compared anatomical imaging features between high-risk and non-high-risk groups in neuroblastoma with at least one image-defined risk factor (IDRF). It also assessed the diagnostic performance of these features in identifying the high-risk group.
Methods
A retrospective analysis of neuroblastoma patients with at least one IDRF was conducted. Imaging features, including estimated tumor volume and IDRFs, were compared between the two groups. The diagnostic performance of these features was assessed using receiver operating characteristic (ROC) curves, and the areas under the ROC curves (AUCs) along with their 95% confidence intervals (CIs) were calculated. Additionally, to internally validate their diagnostic performance, the bootstrap resampling method with 1000 bootstrap resamples was employed.
Results
The study included 255 patients (185 high-risk cases, 70 non-high-risk cases). Significant differences were found in estimated tumor volume and IDRF number between the high-risk and non-high-risk groups (P < 0.001). The estimated tumor volume and the IDRF number-based cluster were independent risk factors, and their combination achieved an AUC of 0.801 (95% CI: 0.747-0.848) for high-risk group diagnosis, with the average AUC of the 1000 bootstrap samples of 0.800 (95% CI: 0.798-0.802). In abdominal lesions, specific IDRF categories differed between high-risk and non-high-risk groups (P < 0.05).
Conclusion
Our study reveals anatomical imaging differences between high-risk and non-high-risk groups in neuroblastoma with at least one IDRF.
Plain Language Summary
Neuroblastoma from different risk groups shows different anatomical imaging features.
Keywords
Introduction
Neuroblastoma is a highly heterogeneous tumor originating from neural crest cells and primarily affecting children. This tumor manifests a broad range of clinical behaviors, leading to varying prognostic outcomes. High-risk patients, in particular, experience a significantly poor prognosis, with survival rates often falling below 50%. 1 To enable risk-stratified treatment and optimize clinical management, accurate diagnostic assessment is indispensable. 2 Imaging assumes a pivotal role in the diagnosis and assessment of neuroblastoma, providing valuable information regarding tumor characteristics and disease extent.3-5 CT and MR imaging are fundamental modalities in the radiological assessment of neuroblastoma, offering high-resolution anatomical information and aiding in the delineation of the anatomical relationships between tumors and adjacent structures, thereby playing a critical role in the identification of image-defined risk factors (IDRFs).6,7
Given the particularly poor prognosis of high-risk neuroblastoma, the identification of such patients holds significant clinical value. 8 Currently, risk stratification for neuroblastoma is based on clinical and biological factors such as patient age, tumor staging, histology, and genetic aberrations.9-11 These risk stratification approaches guide treatment decisions for neuroblastoma, with low-risk patients typically managed conservatively, while high-risk patients treated with aggressive multimodal therapies. 12 However, while risk stratification has been instrumental in neuroblastoma treatment, there remains a need for accurate and reliable imaging biomarkers to complement clinical and molecular data, especially when preoperative biopsy information is inadequate. 13
Owing to the spatial and temporal heterogeneity of neuroblastoma, the results derived from a single-biopsy have the potential to impact the selection of treatment for patients, consequently influencing their prognosis. 14 Although IDRFs are already used in risk stratification of neuroblastoma, the risk stratification only considers the presence or absence of IDRFs for non-metastatic lesions, 15 and this binary classification may overlook the additional clinical value brought by the number of IDRFs in L2 stage and M stage neuroblastoma lesions. Furthermore, the significance of IDRFs in predicting neuroblastoma complexity and surgical risk exhibits varying degrees of importance across different categories of IDRFs. 16 Consequently, the weighting of diverse IDRF categories in neuroblastoma risk stratification may also vary. Our prior study has shown a significant correlation between a higher number of IDRFs, specific categories of IDRFs, and overall survival in neuroblastoma. 17 However, whether these IDRFs are associated with the clinical risk stratification system remains unknown.
In the revised Children’s Oncology Group (COG) neuroblastoma risk classifier, the risk classification of neuroblastoma integrates tumor staging, patient age, and biological characteristics. High-risk criteria for non-metastatic cases (L1 and L2 stages) and metastatic cases (M and MS stages) include factors such as MYCN amplification and unfavorable histology or biological features in specific age groups, while non-high-risk cases are associated with MYCN non-amplification, younger age, and favorable histology or biological characteristics. 15 However, the low-risk group is primarily concentrated in the L1 stage with the absence of IDRFs.
Therefore, to mitigate the impact of International Neuroblastoma Risk Group staging system (INRGSS) on the study results, this study aimed to compare anatomical imaging features between high-risk and non-high-risk groups in neuroblastoma with at least one IDRF. Additionally, it also assessed the diagnostic performance of these features in identifying the high-risk group. Furthermore, this study also compared the differences in specific categories of IDRFs between high-risk and non-high-risk groups for abdominal neuroblastoma.
Methods
Patient Selection
This retrospective study adhered to ethical guidelines and received approval from the Institutional Review Board of Children’s Hospital of Chongqing Medical University (Approval Number: 202235). This cohort study adhered to the STROBE guidelines, with the STROBE checklist available in Supplementary Material_1. Pediatric patients diagnosed with neuroblastoma and treated at our hospital between January 2010 and September 2023 were retrospectively included in this study (Figure 1). Informed consent was waived, because this was a retrospective study. Inclusion criteria: (1) Histologically confirmed neuroblastoma during the initial hospitalization period; (2) Availability of CT or MR scan. Exclusion criteria: (1) Inadequate clinical data for assigning risk groups according to the revised neuroblastoma risk classification system
15
; (2) Presence of metal or motion artifacts in the images, impeding radiologists from accurately assessing IDRFs; (3) Absence of IDRFs. Flowchart of patient selection.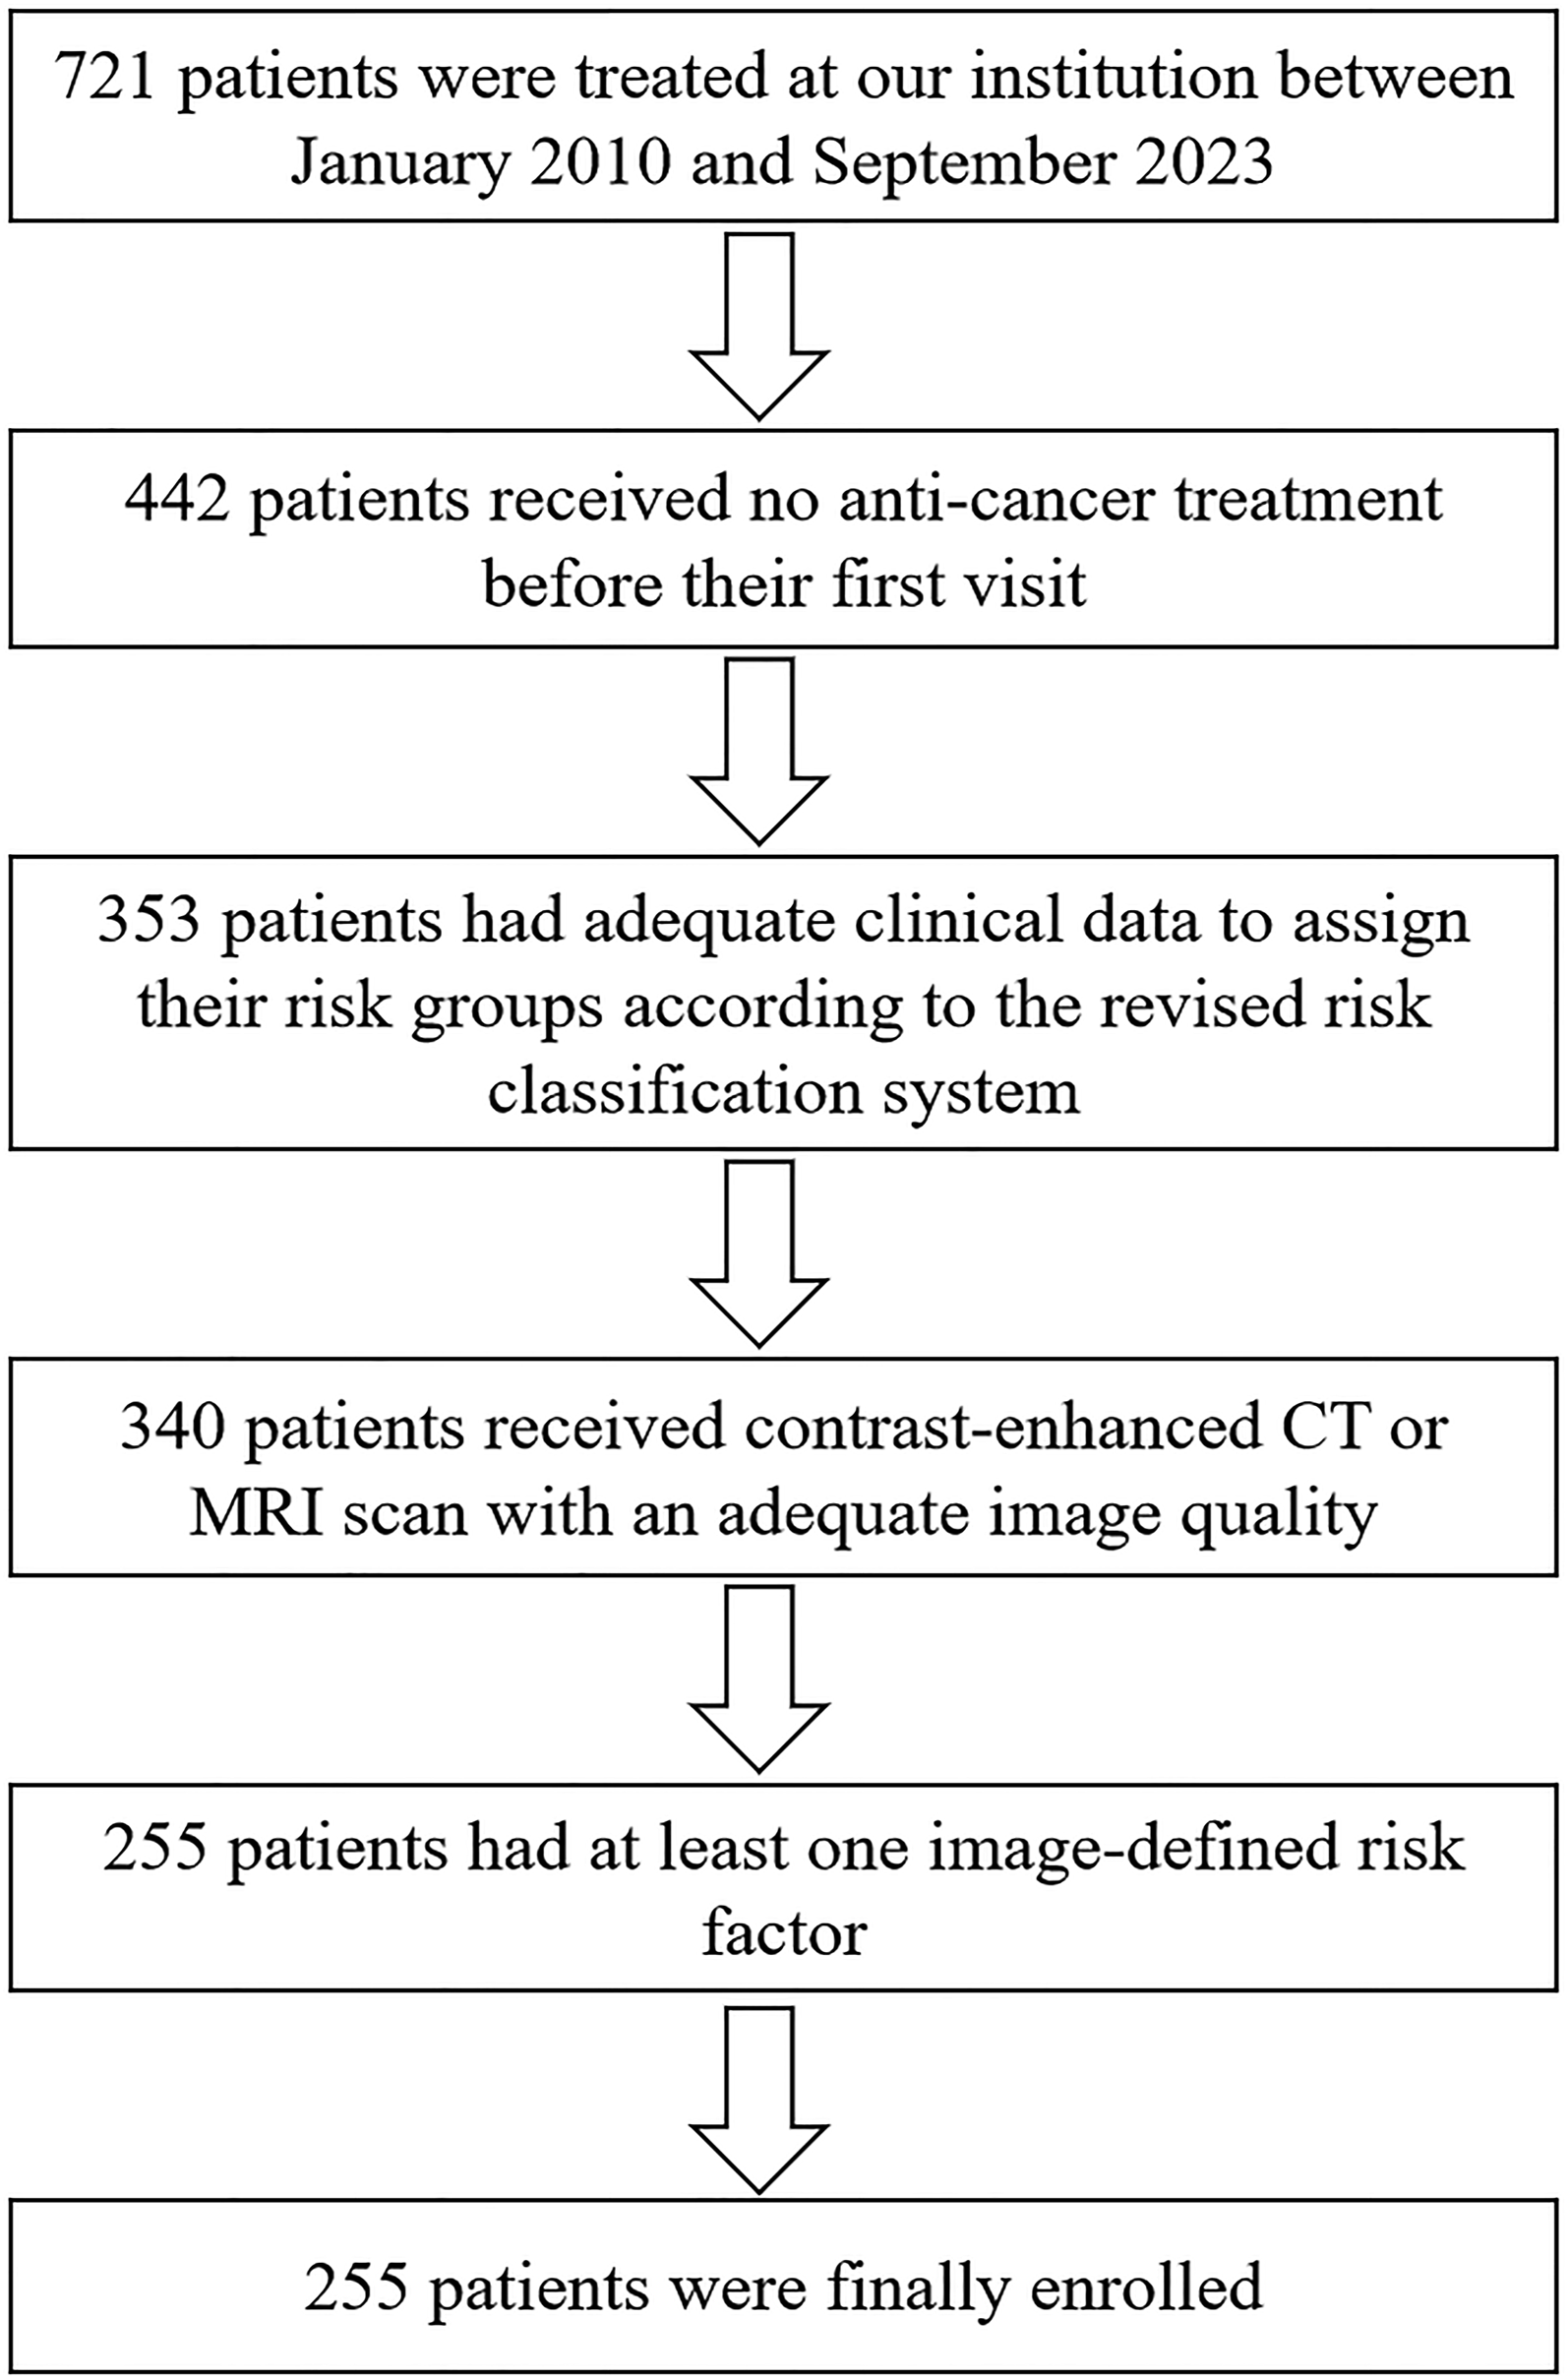
Risk Stratification
Following the INRGSS, 18 non-metastatic lesions were divided into L1 and L2 stages based on the absence or presence of IDRFs. Metastatic lesions were divided into M and MS stages based on the sites of metastasis and patient age. The patients were classified into high-risk and non-high-risk groups based on the revised COG neuroblastoma risk classifier (version 2). 15 For cases in L2 stage, the following were classified into the high-risk group: (1) Cases with MYCN amplification; (2) Cases without MYCN amplification aged between 18 months and 5 years with unfavorable histology; (3) Cases aged 5 years or older with undifferentiated or poorly differentiated subtypes. For cases in M stage, the following were classified into the high-risk group: (1) Cases younger than 12 months with MYCN amplification; (2) Cases aged between 12 and 18 months with MYCN amplification; (3) Cases aged between 12 and 18 months without MYCN amplification but with any unfavorable biology; (4) Cases aged 18 months or older. For cases in MS stage, the following were classified into the high-risk group: (1) Cases younger than 12 months, absence of MS-related symptoms, and MYCN amplification; (2) Cases aged between 12 and 18 months with MYCN amplification; (3) Cases aged between 12 and 18 months without MYCN amplification but with any unfavorable biology.
Image Acquisition and Analysis
A total of 244 patients underwent contrast-enhanced CT scan, and 21 patients underwent MR scan. The Lightspeed CT scanner (GE Healthcare, USA) or the Brilliance CT scanner (Philips, The Netherlands) was used to obtain CT images, with a scanning slice thickness of 5.0 mm. For MR imaging, a 1.5 T or 3.0 T MR imaging system from GE Healthcare (USA) was utilized to obtain axial, sagittal, coronal T1-weighted and T2-weighted imaging images. T1-weighted imaging parameters included a repetition time of 400-700 ms and an echo time of 12-15 ms. In the T2-weighted imaging sequence, the repetition time and echo time were set at 2000-4000 ms and 80-100 ms, respectively. The slice thickness and spacing of MR imaging were configured at 5-6 mm and 0.5-1 mm, respectively. The field of view varied from 24-30 cm, and the matrix size was either 256 × 256 or 256 × 128.
CT and MR images were retrieved from the institutional digital archive and transmitted to workstation for image analysis. Subsequently, two radiologists with over 4 and 12 years of experience in pediatric imaging assessed the following imaging features: (1) tumor location, which could be in the neck, thorax, abdomen, pelvis, or involvement of two sites ipsilaterally; (2) primary tumor lesion size measurements, including the largest axial diameter (cm), perpendicular axial diameter (cm), and the largest craniocaudal diameter (cm).19,20 Then, the estimated tumor volume was calculated by an ellipsoidal volume calculation, ie, largest axial diameter × perpendicular axial diameter × largest craniocaudal diameter × π/6; 21 (3) IDRF number; (4) the presence or absence of specific IDRF categories, which were defined in a previous literature. 18 In the case of artery-related IDRFs, they were considered positive only when the tumor encased more than half of the circumference of the arterial wall. Conversely, for vein-related IDRFs, they were deemed positive only when the venous lumen was fully compressed. 22 Meanwhile, intraspinal tumor extension (above L2) was considered positive if any of the following criteria were met: more than one-third of the spinal canal in the axial plane was invaded, perimedullary leptomeningeal spaces were not visible, or spinal cord signal intensity was abnormal. 6 In case of disagreement between the two radiologists, the final assessment was made after discussion.
Comparison of Imaging Features Between High-Risk and Non-High-Risk Groups
Initially, an unsupervised K-means clustering analysis was performed on all cases using the IDRF number. Through this method, all cases were grouped into two clusters based on the number of IDRFs. Then, the estimated tumor volume, IDRF number, and IDRF number-based cluster were compared between high-risk and non-high-risk groups. Univariate logistic regression analysis was employed to explore the correlation between the estimated tumor volume, IDRF number, IDRF number-based cluster, and the high-risk group. Subsequently, the features with a P-value less than 0.05 from the univariate logistic regression analysis were incorporated into stepwise multivariate logistic regression analysis to identify imaging features independently associated with the high-risk group. The odds ratio (OR) and 95% confidence interval (CI) of these imaging features were calculated.
The receiver operating characteristic (ROC) curves were used to assess the diagnostic performance of the independent imaging features for distinguishing the high-risk group from the non-high-risk group, and area under the curve (AUC), 95% CI, sensitivity, and specificity were calculated. The diagnostic performance of the independent imaging features for the high-risk group was internally validated by bootstrap resampling method with 1000 bootstrap resamples. The bootstrap resampling method needs randomly sampling cases with replacement to generate multiple bootstrap samples of the same size as the original dataset. By employing the bootstrap method, more reliable estimates of diagnostic performance can be obtained. 23 To mitigate the impact of INRGSS stages on study results, subgroup analysis was carried out on the estimated tumor volume and IDRF number across various INRGSS stages. Since the number of cases in the MS stage was limited, we further analyzed the estimated tumor volume and IDRF number differences between high-risk and non-high-risk groups in L2 and M stages. As there was only one low-risk case, we further focused our comparison on high-risk vs intermediate-risk cases. The results of this analysis are presented in Supplementary Material_2.
Specific IDRFs Between High-Risk and Non-High-Risk Groups for Abdominal Neuroblastoma
Considering the differences in specific categories of IDRFs among lesions at different anatomical locations and acknowledging that the cases in this study were predominantly concentrated in the abdomen, we further compared the differences in specific IDRF categories between high-risk and non-high-risk groups in abdominal neuroblastoma. For abdominal neuroblastoma cases, univariate and multivariate analyses were used to investigate the specific categories of IDRFs independently associated with the high-risk group, and the OR and 95% CI of these IDRF categories were calculated. Then, binary logistic regression was used to establish the ROC curve of the independent IDRF for diagnosing the high-risk group. The diagnostic performance of the independent IDRF for the high-risk group in abdominal neuroblastoma underwent internal validation using the bootstrap resampling method with 1000 bootstrap resamples.
Statistical Analysis
IBM SPSS Statistics software (version 23.0), MedCalc (version 18.2.1), and RStudio (version 4.2.2) were utilized. The Mann-Whitney U test was used to compare quantitative data between the two groups, while the Chi-square or Fisher’s exact test was employed for categorical data. “tidyverse” R package was used to conduct the bootstrap resampling. Statistically significant differences were determined when the P-value was less than 0.05.
Decision curve analysis was used to assess the clinical net benefit for imaging features against threshold probability in comparison to default strategies of assuming that all or no observations.24,25 “rmda” R package was used to conduct decision curve analysis. The X-axis of decision curve referred to the high-risk threshold probability at which the imaging features determined whether a patient was classified as high-risk. The Y-axis of decision curve referred to the disparity between the true positive rate and false positive rate of the imaging features at various probability thresholds. However, within each high-risk group determined by the threshold probability, there were true positives and false positives. Treating true positive patients yields benefits, while treating false positive patients incurs costs. Choosing different threshold probabilities results in a ratio of true positives to false positives, thereby influencing the balance of cost and benefit. If the net benefits of the imaging features are higher than the net benefits of the default strategy across various probability thresholds, it indicates that these imaging features have potential clinical utility. The cost-benefit ratio represented the proportion of cost to benefit at different threshold probabilities.
Results
Basic Information
A Comparison of Clinical and Imaging Features Between High-Risk and Non-High-Risk Groups.
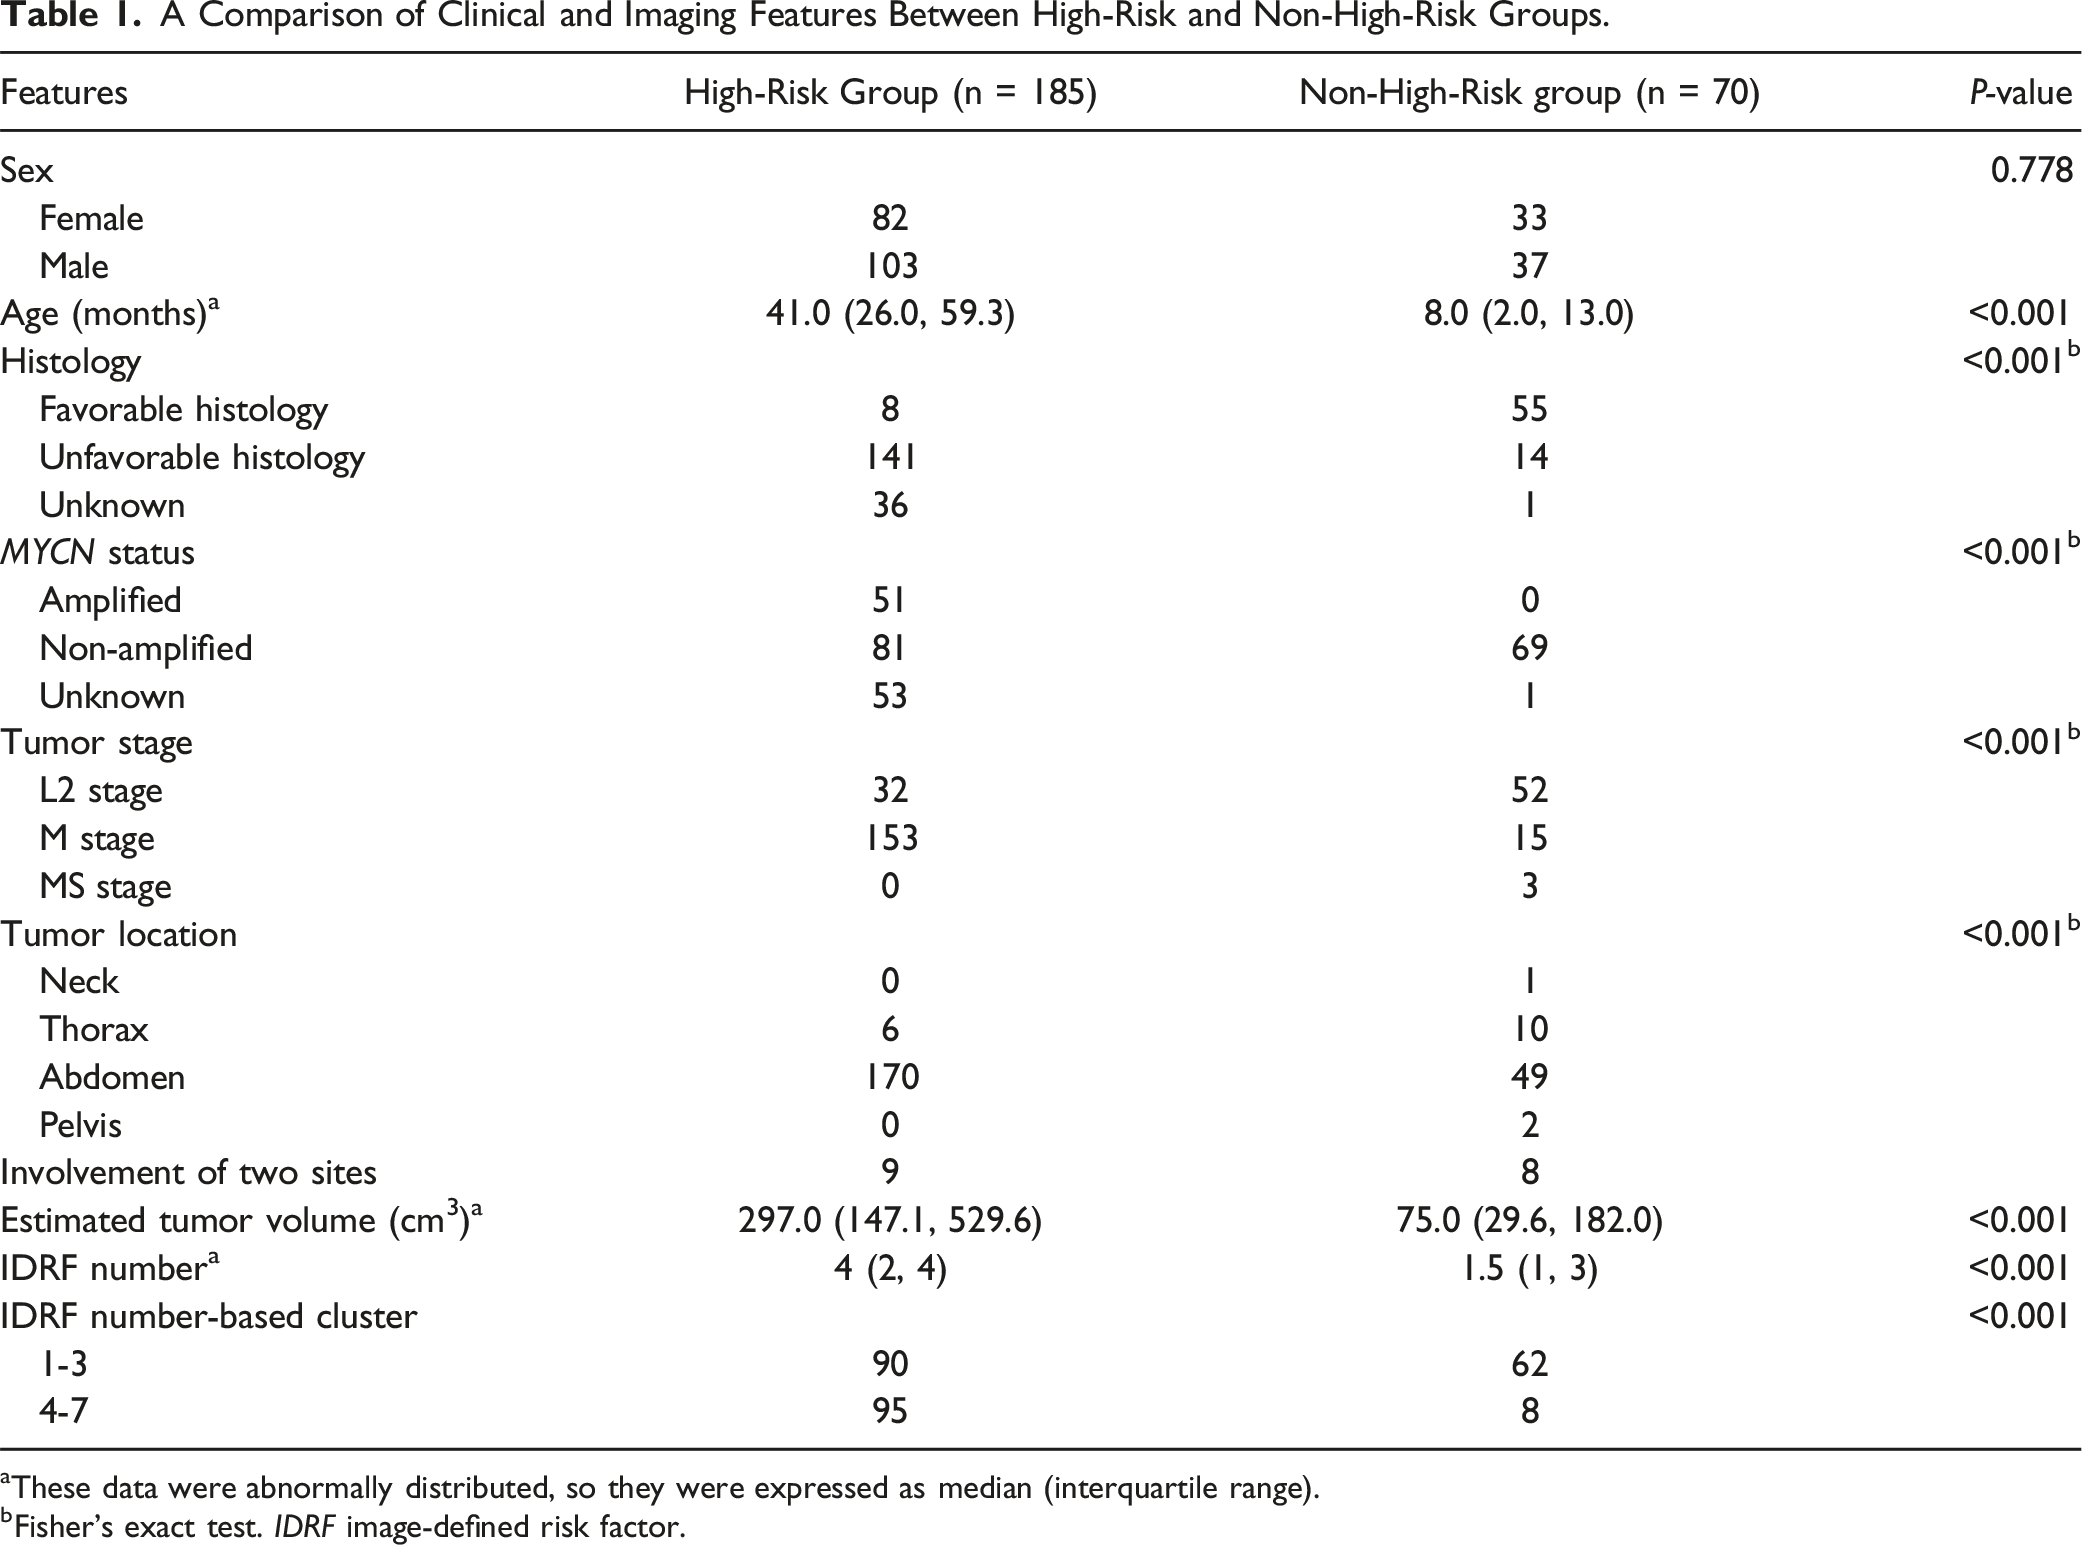
aThese data were abnormally distributed, so they were expressed as median (interquartile range).
bFisher’s exact test. IDRF image-defined risk factor.
The estimated tumor volume exhibited a significant statistical difference between MYCN amplified and non-amplified groups, with medians of 457.24 cm³ (interquartile range: 260.72 to 644.67 cm³) and 164.84 cm3 (interquartile range: 52.61 to 341.21 cm³) respectively (P < 0.001). Similarly, the IDRF number also demonstrated a significant statistical difference between MYCN amplified and non-amplified groups, with medians of 4 (interquartile range: 2.25 to 5) and 2 (interquartile range: 1 to 4) respectively (P < 0.001).
The median tumor volume for stage L2 was 167.14 cm3 (interquartile range: 49.96 to 504.58 cm3), while the median tumor volume for metastatic lesions (stages M and Ms) was 269.35 cm3 (interquartile range: 99.91 to 455.75 cm3), with no statistically significant difference between the two (P = 0.067). The median number of IDRFs for stage L2 was 2 (interquartile range: 1 to 3), whereas for metastatic lesions, the median was 3 (interquartile range: 2 to 4), showing a statistically significant difference (P < 0.001). Furthermore, IDRF-based clusters revealed a significant statistical difference between stage L2 and metastatic lesions, with metastatic cases mostly having 4-7 IDRFs (P < 0.001).
Estimated Tumor Volume and IDRF Number for the Diagnosis of High-Risk Group
Significant differences in the estimated tumor volume and the number of IDRFs were observed between the high-risk and non-high-risk groups (P < 0.001) (Table 1). The estimated tumor volume demonstrated an AUC of 0.768 (95% CI: 0.712-0.819), with an optimal cutoff value of 126.7 cm³, achieving a sensitivity of 79.46% and a specificity of 67.14%. The IDRF number had an AUC of 0.730 (95% CI: 0.671-0.784), with an optimal cutoff value of 3, yielding a sensitivity of 51.35% and a specificity of 88.57%. Through K-means clustering analysis of the number of IDRFs, all cases were divided into two clusters: 1-3 and 4-7 IDRFs (Figure 2(A)). There was also a significant difference in the distribution of high-risk and non-high-risk groups between these two IDRF-based clusters (P < 0.001), indicating that the risk stratification varied significantly between the 1-3 and 4-7 IDRF clusters (Figure 2(B)). K-means clustering analysis. (A) the distribution of IDRF number of each case used for clustering. (B) the distribution of high-risk and non-high-risk groups between the two IDRF number-based clusters. IDRF image-defined risk factor.
Correlations Between Imaging Features and the High-Risk Group.

CI confidence interval, IDRF image-defined risk factor, NA not applicable, OR odds ratio.
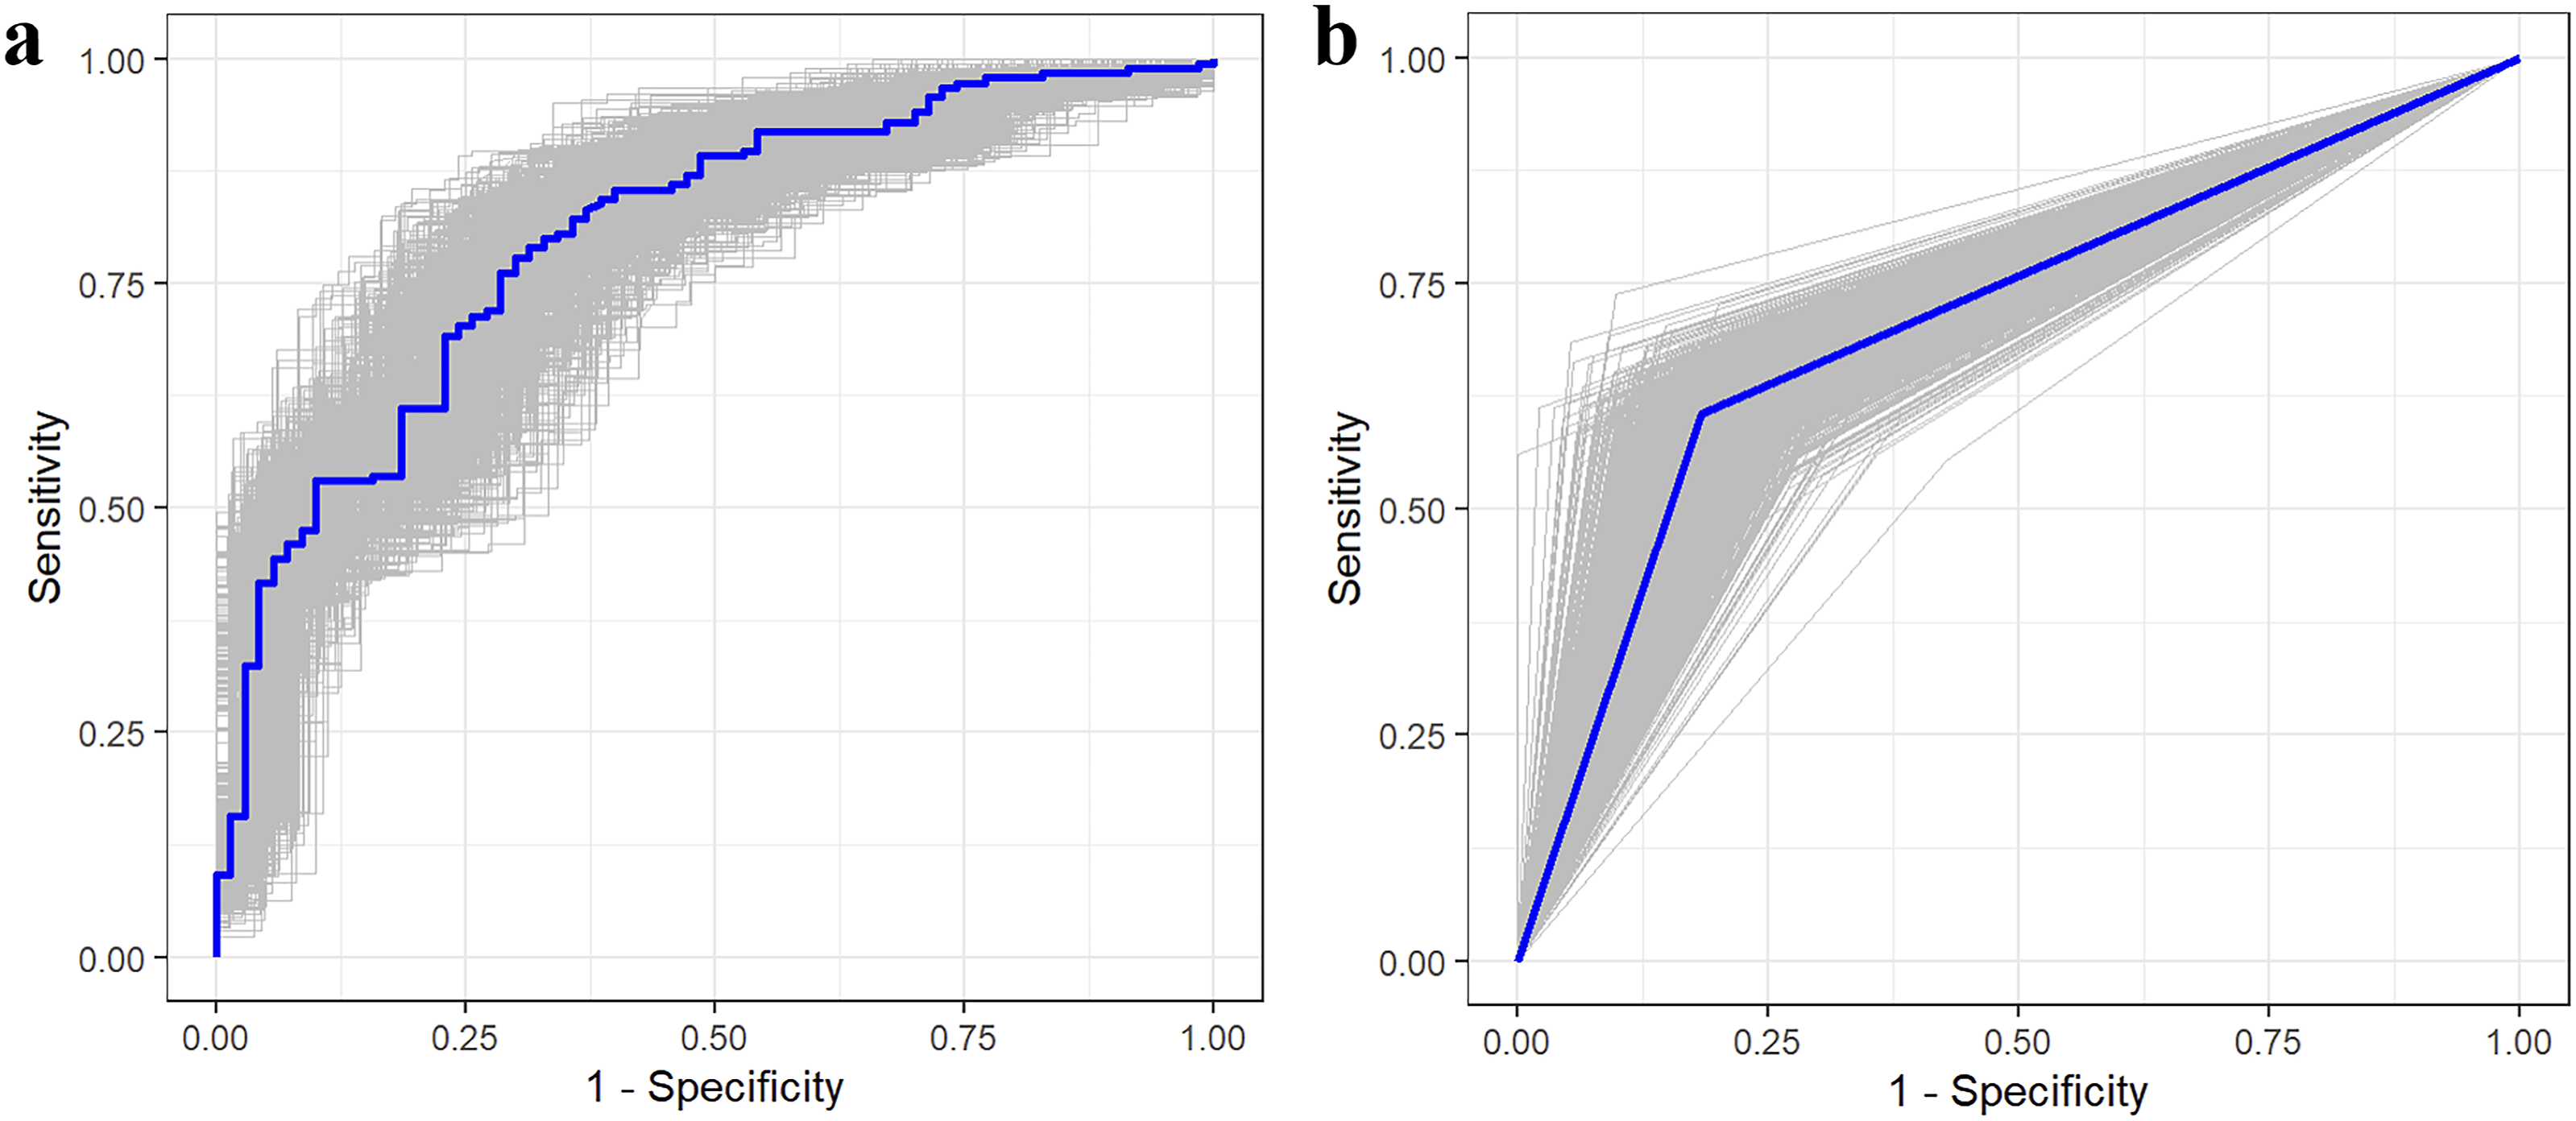
Receiver operating characteristic curves. (A, B) illustrate the receiver operating characteristic curves of the combination of the estimated tumor volume and the IDRF number-based cluster and tumor infiltrating the porta hepatis/hepatoduodenal ligament, respectively. The blue curves in (A and B) indicate the receiver operating characteristic curves from original data; the gray curves indicate the receiver operating characteristic curves from 1000 bootstrap samples.

Decision curves of imaging features for diagnosing high-risk group. Two_features in (A) indicates the combination of the estimated tumor volume and the IDRF number-based cluster; Independent_IDRF in (B) indicates tumor infiltrating the porta hepatis/hepatoduodenal ligament. IDRF image-defined risk factor.
Subgroup Analysis
Subgroup analysis revealed significant differences in estimated tumor volume between high-risk and non-high-risk groups (P < 0.001), irrespective of L2 or M stage (Figure 5(A)). In the L2 stage, the IDRF number did not exhibit a statistically significant difference between the high-risk and non-high-risk groups (P = 0.153); however, in the M stage, the IDRF number showed a statistically significant difference between the high-risk and non-high-risk groups (P < 0.001) (Figure 5(B)). Figure 6 shows a high-risk M stage neuroblastoma with three IDRFs. Subgroup analysis. (A, B) illustrate the comparison of estimated tumor volume and IDRF number between high-risk and non-high-risk groups in L2 and M stages, respectively. The box plots in (A and B) display the median and quartile of the data. IDRF image-defined risk factor, INRGSS International Neuroblastoma Risk Group staging system. (A) 34-month-old girl diagnosed with high-risk M stage neuroblastoma in the thoracic region. (A, B) show CT lung window images, highlighting compression of the left main bronchus by the tumor lesion (black arrows). (C) presents a contrast-enhanced CT image, revealing the tumor encasing the descending aorta (white arrow) and extending into the spinal canal (black arrow). (D, E) display T1-weighted and T2-weighted images, respectively, further confirming that the tumor invades more than one-third of the spinal canal (white arrows).

Specific IDRFs Associated with High-Risk Group in Abdominal Lesions
Distribution of Image-defined Risk Factors Between High-Risk and Non-High-Risk Groups in Neuroblastoma Located in the Abdomen.

aFisher’s exact test.
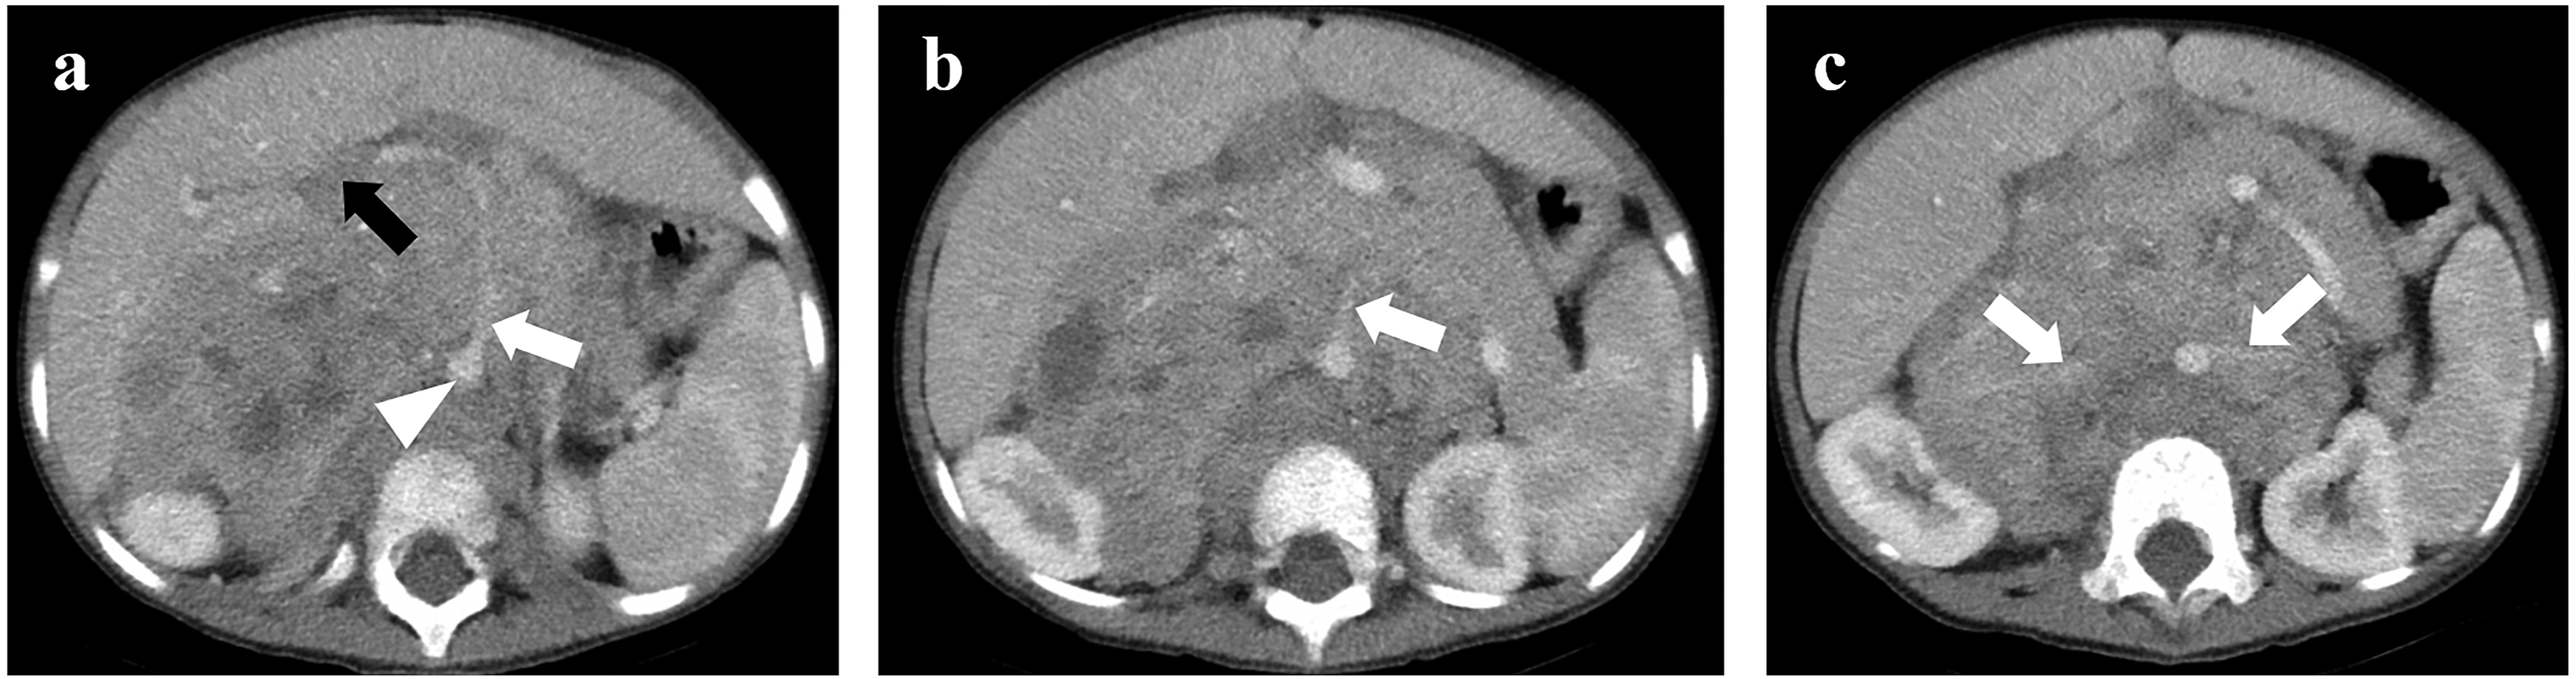
(A) 68-month-old girl diagnosed with high-risk neuroblastoma located in the abdominal region. (A) contrast-enhanced CT shows the tumor lesion infiltrating the porta hepatis (black arrow) and encasing the aorta (arrowhead) and the origin of the coeliac axis (white arrow). (B) contrast-enhanced CT shows the tumor lesion encasing the origin of the superior mesenteric artery (white arrow). (C) contrast-enhanced CT shows the tumor lesion invading both renal pedicles (white arrows).
Correlations Between Specific Image-defined Risk Factors and the High-Risk Group in Abdominal Neuroblastoma.

CI confidence interval, NA not applicable, OR odds ratio.
Discussion
In this study, we assessed and compared the anatomical imaging features between high-risk and non-high-risk groups in neuroblastoma with at least one IDRF, including estimated tumor volume and IDRFs. The risk level of the neuroblastoma increased progressively from non-high-risk to high-risk, and corresponding imaging features were observed on CT and MR images, aligning with their respective risk levels. Specific categories of IDRFs in abdominal neuroblastoma also exhibited a significant difference between high-risk and non-high-risk groups. The findings of our study imply that anatomical imaging features differ significantly between high-risk and non-high-risk groups in neuroblastoma, and these imaging features are helpful for diagnosing high-risk neuroblastoma. In the future, these findings should be correlated with survival outcomes in a prospective manner.
In a recent COG Diagnostic Imaging Committee/Society for Pediatric Radiology Oncology Committee White Paper, portal venous CT and MR imaging have been recommended for assessing neuroblastoma. 26 The significant value of radiological findings in the risk stratification of neuroblastoma are increasingly recognized,15,27 particularly because patients in the L1 and L2 stages often have a significantly better prognosis.28,29 In our study, we observed a significant difference in INRGSS stages between high-risk and non-high-risk groups. Additionally, we observed a significant increase in estimated tumor volume and IDRF number in high-risk neuroblastoma. This indicates that the risk level of neuroblastoma can be effectively demonstrated through CT and MR images. Qi et al. 13 also found tumor volume was an independent factor for high-risk neuroblastoma. Besides, vascular encasement of major vessels has been shown to be a crucial factor in surgical procedures, 30 showing the significance of vascular encasement as an element for identifying high-risk neuroblastoma. Therefore, when the tumor volume is larger and the number of IDRFs is greater, particularly when the tumor volume and IDRF count exceed 126.7 cm3 and 3, respectively, the risk of tumor stratification is higher, and a more aggressive treatment approach should be considered. 31
However, when it comes to risk stratification for neuroblastoma, International Neuroblastoma Risk Group and COG have only incorporated the INRGSS, which categorizes non-metastatic neuroblastoma into L1 and L2 stages solely based on the absence or presence of IDRFs, without considering the specific categories of IDRFs.15,27 Exploring the specific categories of IDRFs may yield additional insights from imaging for identifying high-risk neuroblastoma. In abdominal neuroblastoma, we observed a significant association between the invasion of adjacent structures, vascular-related IDRFs, and high-risk group. High-risk neuroblastoma exhibited a greater tendency to encase major vascular structures and invade neighboring tissues, possibly due to their larger size and increased aggressiveness. These IDRFs not only affect the completeness of tumor resection but also determine the feasibility of surgery. When these IDRFs are present, the prognosis for patients with unresected tumors may worsen.
Liu et al. 32 reported a significant correlation between higher F-FDG uptake and invasive characteristics in neuroblastoma, including vascular encasement and adjacent organ invasion, indicating that these IDRFs are associated with the metabolic activity of neuroblastoma cells. Additionally, a previous study has demonstrated a strong association between IDRFs and MYCN amplification, as well as overall survival in neuroblastoma. 17 When the number of IDRFs exceeded 4, the patient prognosis was significantly worse. In this study, IDRF number-based clustering analysis and multivariate analysis showed that exceeding 4 IDRFs was an independent risk factor associated with the high-risk group. Therefore, our findings in this study serve as both an extension and an important complement to this prior investigation. Bedoya-Reina et al. 33 also unveiled unique cellular profiles distinguishing low-risk from high-risk neuroblastoma, with malignant cells resembling TRKB + cholinergic progenitors in high-risk. Furthermore, our findings indicate that although there is no statistically significant difference in tumor volume between stage L2 and distant metastatic lesions, the number of IDRFs is significantly higher in tumors with distant metastases. This suggests that IDRFs are also associated with an increased likelihood of distant metastatic spread. These adverse pathological and genetic traits are pivotal for identifying high-risk neuroblastoma and may serve as the potential biological foundation for IDRFs in assessing the high-risk status of neuroblastoma.
This study also comes with some limitations. First, the presence of IDRFs is an important component of the revised neuroblastoma risk group classification, so there may exist a preselection bias for IDRFs. Second, it was a single-center retrospective study, which may introduce a certain degree of selection bias. Besides, due to the relatively small number of patients who underwent MR examinations, we did not analyze the signal characteristics of MR images. Instead, in this study, our primary focus was on the anatomical relationship between neuroblastoma and adjacent structures. Then, due to the limited number of cases undergoing MR scans in this study, this study lacks a comparison of inter-observer reliability between CT and MR. Due to the differences in spatial resolution between CT and MR, the inter-observer reliability of CT and MR may vary. Furthermore, since there was only one low-risk case in this study, the results are primarily applicable to comparisons between high-risk and intermediate-risk groups. Lastly, given the limited number of cases of neuroblastoma located in other sites, we restricted our statistical analysis of specific IDRFs to abdominal neuroblastoma.
Conclusion
In conclusion, there is a significant difference in estimated tumor volume and IDRF number between high-risk and non-high-risk groups for neuroblastoma. When the estimated tumor volume is larger and the number of IDRFs is higher, neuroblastoma is more likely to be classified as high-risk. Furthermore, in abdominal neuroblastoma, specific categories of IDRFs also exhibit a significant difference between high-risk and non-high-risk groups. Therefore, the anatomical imaging features potentially provide complementary information to distinguish high-risk neuroblastoma from non-high-risk neuroblastoma.
Supplemental Material
Supplemental Material - Stratification of Anatomical Imaging Features Between High-Risk and Non-High-Risk Groups in Neuroblastoma
Supplemental Material for Stratification of Anatomical Imaging Features Between High-Risk and Non-High-Risk Groups in Neuroblastoma by Celeste Glasgow and Emma Ballard in Cancer Control
Footnotes
Author Contributions
L.H. and J.C. conceived, supervised and supported the study. H.W and X.C collated and analysed the data, performed the statistical analysis and drafted the initial manuscript. J.C. revised the manuscript. All authors reviewed and approved the final manuscript.
Declaration of Conflicting Interests
The author(s) declared no potential conflicts of interest with respect to the research, authorship, and/or publication of this article.
Funding
The author(s) disclosed receipt of the following financial support for the research, authorship, and/or publication of this article: This project was funded by Natural Science Foundation of Chongqing ((CSTB)2023NSCQ-BHX0127) and Key Project of Technology Innovation and Application Development of Chongqing Science and Technology Bureau (No. CSTB2022TIADKPX0151).
Ethical Statement
Supplemental Material
Supplemental material for this article is available online.
Appendix
References
Supplementary Material
Please find the following supplemental material available below.
For Open Access articles published under a Creative Commons License, all supplemental material carries the same license as the article it is associated with.
For non-Open Access articles published, all supplemental material carries a non-exclusive license, and permission requests for re-use of supplemental material or any part of supplemental material shall be sent directly to the copyright owner as specified in the copyright notice associated with the article.