
Abstract
Introduction
Cancer is a malignant condition in which cells grow abnormally, invade and spread to other tissues in the body. 1 According to a recent report by the China Cancer Statistical Survey, since 2010, cancer has become the leading reason of death in China, growing both in incidence and fatality. 2 One type of primary brain tumor that develops from glial cells is known as a low-grade glioma. Gliomas can be categorized into grades I, II, III, and IV based on World Health Organization (WHO) criteria, and grades II and III are commonly referred to as low-grade gliomas.3,4 Studies have shown that lower-grade glioma (LGG) exhibits inter-individual heterogeneity in pathology, molecular features, and prognosis. 5 According to recent research, the majority of low-grade gliomas eventually develop into high-grade gliomas, which have a worse prognosis. 6 Even with undergoing surgical resection, radiation therapy, chemotherapy, and immunotherapy, it was frequently impossible to totally avoid recurrence or malignant progression. 7 One of the most prevalent malignant tumors of the digestive system worldwide is liver hepatocellular carcinoma, which is mostly brought on by drinking, HBV and HCV, among other factors. 8 According to data from 2020 on cancer mortality, liver hepatocellular carcinoma (LIHC) is sixth overall in terms of cancer. 9 An increasing body of evidence suggests that the recurrence rate of patients with hepatocellular carcinoma is extremely high, and the prognosis of patients with postoperative recurrence is poor. 10 Therefore, for patients with LGG and LIHC, identify the underlying molecular pathways and prognostic markers is crucial.
Selenium (Se) is a vital element that has antioxidant effects, immune system control, and antagonistic poisons in the body, making it important for both animal and human health. However, the lack of selenium can lead to various diseases. Selenium primarily serves a biological purpose in the human body in the form of selenoprotein. 11 According to earlier studies, selenoproteins can regulate biological processes such as cellular oxidative stress, endoplasmic reticulum stress, antioxidant defense, immune response, and inflammatory response, 12 anti-apoptosis, inhibition of transcription factor activity, promoting sperm maturation, participation in cellular redox capacity and thyroid hormone metabolism.13,14 Higher eukaryotes have 2 different selenophosphate synthases, called SEPHS1 and SEPHS2. Among them, the enzyme that creates selenophosphate, the active selenium donor for selenoproteins and selenium-modified tRNA, is known as selenophosphate synthetase (SEPHS), 15 and in cells that divide quickly, such as cancer cells and embryonic cells, SEPHS1 mRNA is abundantly expressed. According to reports, a variety of conditions, including as oxidative stress and salt stress, might increase SEPHS1 expression. 16 It is well established that SEPHS1 can interact with cell division cycle-associated protein 4 (CDCA4), guanylate-binding protein 2 (GBP2), and solute carrier F6 (SLC35F6) to regulate the cell cycle and cell activity. 17 Accordingly, the connection between selenoprotein and human health is currently a prominent topic in research.
Multi-omics pan-cancer analysis has been used recently to pinpoint the shared phenotypic traits of cancers and gain a deeper understanding of the underlying molecular causes and internal regulatory mechanisms.
18
In 33 distinct cancers, this study sought to determine whether there may be a relationship between the expression of SEPHS1 and microsatellite instability (MSI), tumor mutational burden (TMB), immunological infiltration levels, DNA mismatch repair genes (MMRs), and immune checkpoint genes (ICGs). Additionally, univariate and multivariate Cox regression, a prognostic nomogram model, and calibration curves were used to shed new light on the function of SEPHS1 in various cancers that may affect prognosis. Finally, analysis was performed on the effects of SEPHS1 expression and hepatitis B and C infection on overall survival in patients with LIHC as well as the effects of SEPHS1 expression and radiation and chemotherapy on survival in patients with LGG. The drug sensitivity of LGG and LIHC patients with high SEPHS1 expression was assessed. Overall, our analysis offered a comprehensive overview of SEPHS1’s crucial function in tumor formation and its potential regulatory mechanism, laying the groundwork for the development of therapeutic targets. Figure 1 showed the flow chart for the research. The flowchart of the overall research methodology and design used in the present study.
Resources and Methods
Data Source
The reporting of this study conforms to TRIPOD guidelines. 19 The Genotype-Tissue Expression (GTEx) database was used to determine the levels of SEPHS1 expression in 33 normal human tissues. The Cancer Cell Line Encyclopedia (CCLE) was used to determine the levels of SEPHS1 expression in 21 tumor cell lines. The Cancer Genome Atlas (TCGA) database was used to determine the differential expression of SEPHS1 in 27 tumor tissues and neighboring tissues.
SEPHS1 Expression in the Tumor Tissues
Information on the differential expression of SEPHS1 in tumor tissues and normal tissues was obtained from the TCGA and GTEx projects. In this investigation, the log2 (TPM+1) converted expression data was chosen as the parameter for visualization. To ensure an adequate number of normal TCGA samples, we used the information from TCGA tumor tissues and GTEx normal tissue data to examine the differential expression of SEPHS1 in 27 tumor tissues.
Association Between SEPHS1 and Immune Checkpoints
The common 47 immune checkpoint genes were sorted out, 20 and the linkage between SEPHS1 and immune checkpoint genes was examined using the SangerBox database (http://www.sangerbox.com/), and the results were displayed as a heatmap.
Association Between SEPHS1 Expression and TMB, MSI
In cancer cells, mutated genes are responsible for encoding a neoantigen known as tumor mutational burden (TMB). The total number of mutations per big base of DNA, when observable differences are categorized as insertions, base substitutions, or base deletions between bases, is used to compute the rate of change. 21 Numerous neoantigens may be produced by high TMB levels to promote the anti-tumor immune response. 22 A molecular tumor characteristic known as microsatellite instability (MSI) describes the spontaneous loss or acquisition of repetitive DNA segments in short tandem nucleotides. 23 In 33 tumor tissues, SEPHS1 expression was related to TMB and MSI adopting Spearman correlation analysis. Statistical significance was defined as a P-value <.05.
Correlation Between SEPHS1 and DNA Mismatch Repair and Methyltransferases
During DNA replication and recombination, the mismatch repair system is primarily responsible for fixing base-base mismatches and insertion/deletion mispairs. The connection between SEPHS1 expression and mutations in five DNA repair genes (MMRs): MLH1, MSH2, MSH6, PMS2 and EPCAM was assessed using the TCGA database.
A chemical process called DNA methylation can change the epigenetics and regulate gene expression. The correlation between SEPHS1 and four methyltransferases (DNMT1, DNMT2, DNMT3a, and DNMT3b) was assessed and visualized by the R package “ggplot”. A significant correlation was considered at P < .05 and r > .20.
Prognostic Value of SEPHS1 in Human Tumors
The Kaplan-Meier (KM) Plotter database (https://kmplot.com/analysis/) enables in-depth analysis of 54,000 genes from multiple databases affecting survival in 21 cancer types. 24 To investigate the relationship between SEPHS1 expression and prognostic state in 33 carcinomas from the TCGA dataset, the overall survival rates (OS), disease-specific survival rates (DSS), disease-free survival rates (DFS), and progression-free survival rates (PFS) of pan-cancer patients were computed using the Kaplan-Meier database. The median risk score was used to categorize LGG patients and LIHC patients into high-risk and low-risk groups. 95% confidence interval (CI) and log-rank determined hazard ratio (HR) values were used to describe survival probability, and there was statistical significance at a P-value <.05.
Construction and Verification of LGG and LIHC Nomograms
By using a nomogram, it is possible to condense the statistical prediction model into a single numerical evaluation of the overall survival probability that is tailored to each patient. Therefore, it was widely used for prognosis in cancer patients.25–27 Clinicopathological factors were used in univariate and multivariate Cox regression aim was to test the risk score system’s potential as an independent predictive measure. To create a nomogram, the multivariate Cox regression analysis findings were used. The calibration curve and consistency index (C-index) were employed to assess the prediction model’s precision. The larger the C-index, the higher the prediction accuracy, and the closer the prediction risk is to the standard curve, the higher the model conformity. Using the R package maxstat, the ideal threshold for risk score was determined with a minimum sample grouping percentage of over 25% and a maximum sample grouping percentage of under 75%. The Kaplan-Meier survival curve was drawn to determine the effect of these effective factors on the survival time of LGG and LIHC patients. HR values with 95% CI and the log-rank test were used to assess the survival probability and prognosis.
Validation of the Effect of SEPHS1 on OS in LIHC and LGG Patients
The ICGC and CGGA datasets were used to confirm the expression and diagnostic usefulness of SEPHS1 in LIHC and LGG. Patients were split into 2 groups according to the median score, 1 with high SEPHS1 expression and the other with low SEPHS1 expression. The log-rank test and HR values with a 95% confidence interval were used to evaluate the likelihood of survival and prognosis.
Association Between SEPHS1 and Immune Infiltration in LGG and LIHC
The Tumor Immune Estimation Resource (TIMER http://timer.cistrome.org/) is an extensive online tool that analyzes and visualizes immune cell infiltration of all TCGA tumors. 28 B cells, CD4+ T cells, CD8+ T cells, macrophages, neutrophils, and dendritic cells are among the six distinct immune cell subsets that make up the infiltration estimation findings produced by the TIMER algorithm. A P-value <.05 was statistically significant.
Correlation Between SEPHS1 and Tumor Pathway Scores in LGG and LIHC
From TCGA, SEPHS1’s RNA-sequencing expression patterns and associated clinical data were retrieved. To examine the relationship between SEPHS1 and the scores of 6 important tumor pathways in LGG and LIHC, Gene Set Variation Analysis (GSVA) was applied. A P-value <.05 was statistically significant.
Cross-Over Interaction of SEPHS1 With Chemotherapy and Radiotherapy on OS in LGG Patients
To examine the impact on LGG-OS in the TCGA database of the relationship between SEPHS1 expression and chemoradiotherapy, Radiation therapy and non-radiation therapy groups were created for LGG patients, as well as chemotherapy and non-chemotherapy groups. Then, the 4 groups were separated into the high and low SEPHS1 expression groups based on the median score of the Kaplan-Meier curve. HR values with 95% CI and log-rank test were determined to assess the survival probability and prognosis. Next, logistic regression analysis was used to evaluate how SEPHS1, radiation, and chemotherapy affected LGG. Statistical significance was set at P < .05.
Cross-Over Interaction of SEPHS1 With Infected Hepatitis B and Hepatitis C on OS in LIHC Patients
To assess the effect of the interaction of SEPHS1 with hepatitis B and C infection on OS in LIHC patients, patients with hepatitis B and C were split into infected and uninfected groups. Then, the 4 groups were separated into the high and low SEPHS1 expression groups according to the moderate score of the Kaplan-Meier curve. HR values with 95% CI and log-rank test were determined to assess the survival probability and prognosis. The interaction between SEPHS1, HBV infection, and HCV infection on LIHC was next assessed using logistic regression analysis. Statistical significance was set at P < .05.
Sensitivity of SEPHS1 to Chemotherapy
GDSC (https://www.cancerrxgene.og/) is a public database for studying cancer cell drug sensitivity and drug response targets. The most used treatment for people with glioblastoma is Temozolomide (TMZ). 29 5-Fluorouracil and Sorafenib are widely acknowledged as the most commonly used drug in clinical treatment for LIHC. Thus, For 371 LIHC samples from the TCGA database, 5-fluorouracil and sorafenib were chosen to predict the chemotherapeutic response. Temozolomide was chosen to forecast the efficacy of chemotherapy in 510 LGG samples from the TCGA database. The clinical data was processed using the R package “pRRophetic,” and ridge regression was applied to determine the sample’s half-maximal inhibitory concentration. A P-value <.05 was statistically significant.
Results
SEPHS1 Expression in Various Tumors in Humans
SEPHS1 expression in normal human tissues was analyzed based on the GTEx dataset, and the findings revealed that SEPHS1 has variable levels of expression in many kinds of normal tissues. (Figure 2A). The expression of SEPHS1 in 21 single tumor cell lines was analyzed based on the CCLE database, and the results showed that it was also expressed in each tumor tissue with heterogeneous expression levels in different tumor tissues (Figure 2B). The differential expression patterns of SEPHS1 in individual tumor samples compared to neighboring tumors were retrieved from TCGA. Most tumor samples had statistically significant differences in SEPHS1 expression between cancer and nearby tumors, and most tumor tissues had higher SEPHS1 expression than normal tissues. (Figure 2C). To undertake a differential expression analysis of SEPHS1 in 27 cancers, the GTEx database’s normal tissue data and the TCGA tumor tissue data were combined. The findings demonstrated that the majority of tumor tissues had greater levels of SEPHS1 expression than did normal tissues. (Figure 2D). Analysis of SEPHS1 expression in all types of cancer demonstrated that SEPHS1 expression was often higher in tumors than in healthy tissues. SEPHS1 expression in GTEx 31 tissues (A); in 21 tumor cell lines (B); in carcinogenesis and adjacent cancers (C); and in 27 tumors (D).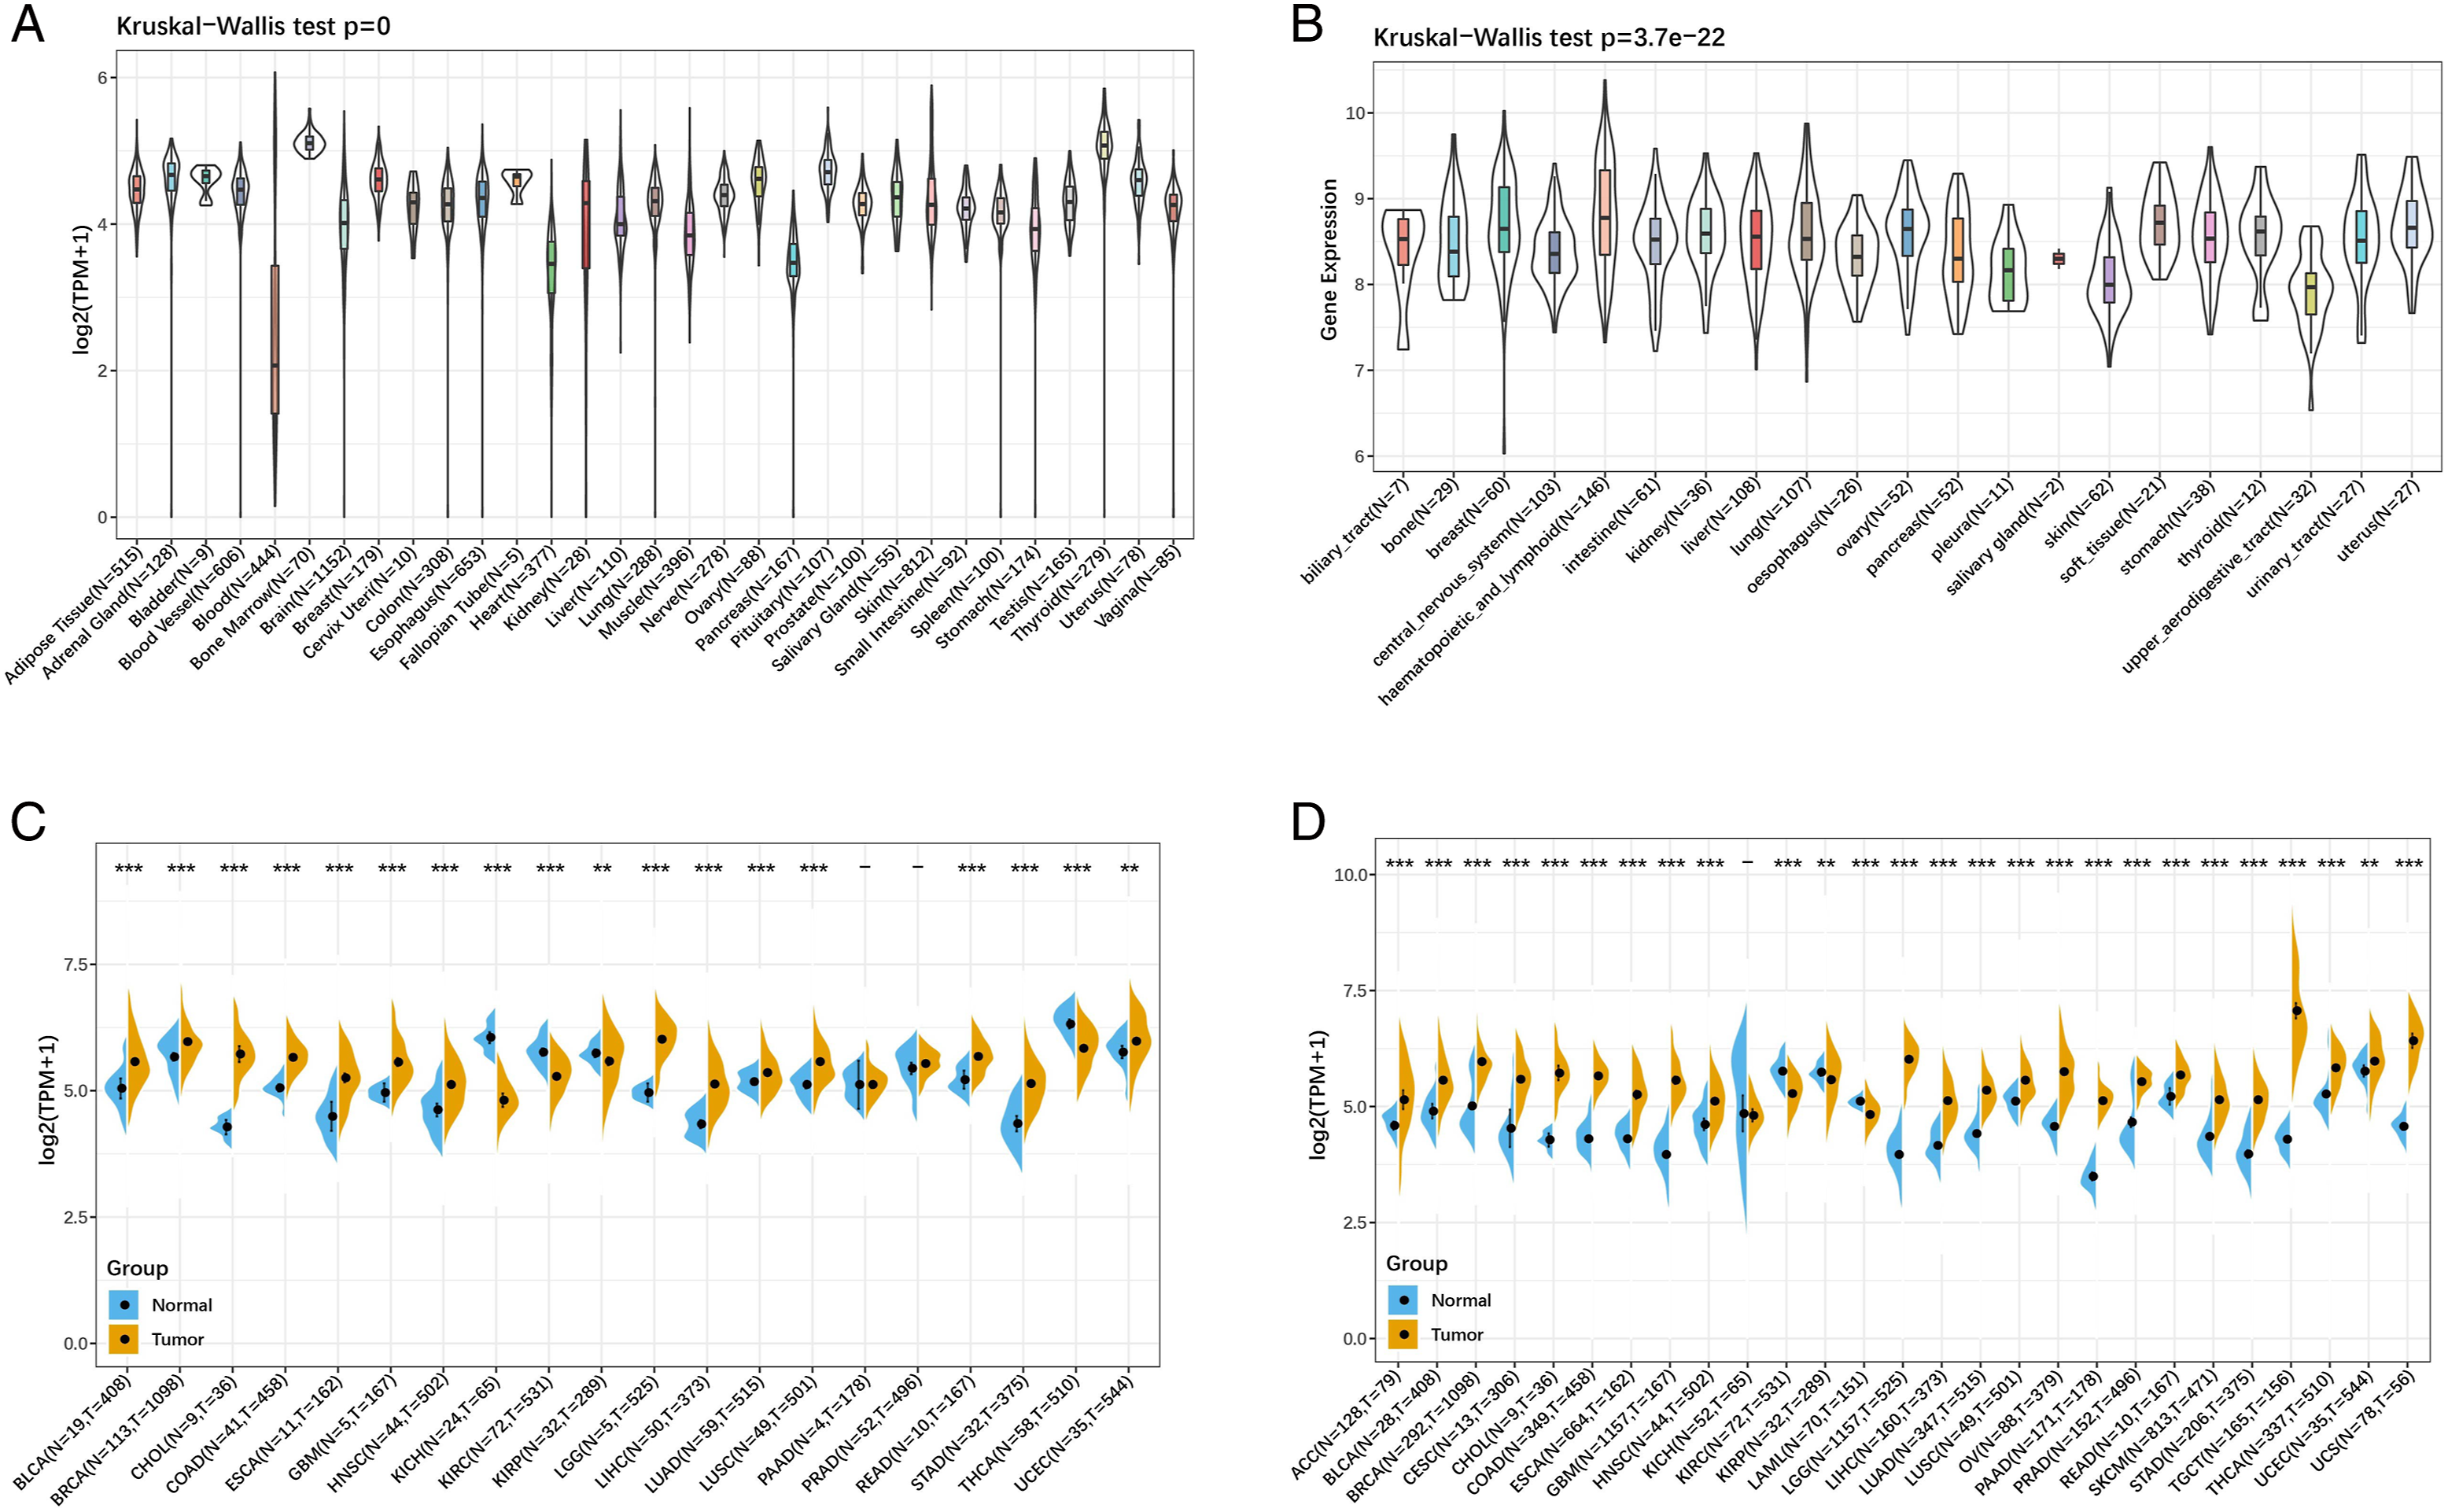
Association Between SEPHS1 and Immune Checkpoints
The association between the expression of SEPHS1 and immunological checkpoints was investigated using the SangerBox database. In diverse cancer tissues, SEPHS1 expression was substantially connected with multiple immune checkpoint gene expression levels, according to an analysis of the relationships between SEPHS1 and the expression of 47 immunological checkpoint genes. (Figure 3). Association between SEPHS1 expression and ICGs in 33 different tumor types. (*P < .05, **P < .01, ***P < .001).
Association Between SEPHS1 Expression, TMB and MSI
To determine whether the expression of SEPHS1 and TMB, MSI were correlated, Spearman’s rank correlation coefficient was employed. Particularly, SEPHS1 expression was associated with TMB in bladder urothelial carcinoma (BLCA), stomach adenocarcinoma (STAD), skin cutaneous melanoma (SKCM), lung adenocarcinoma (LUAD), glioblastoma multiforme (GBM) and breast invasive carcinoma (BRCA). Besides, a negative correlation was found with TMB in thymoma (THYM), thyroid carcinoma (THCA), LGG, esophageal carcinoma (ESCA), and colon adenocarcinoma (COAD) (Figure 4A). In contrast, a significant positive connection between MSI and SEPHS1 expression was found in STAD, ovarian serous cystadenocarcinoma (OV), LIHC, and KIRC., while SEPHS1 expression in lymphoid neoplasm diffuse large B-cell lymphoma (DLBC) was negatively correlated with MSI (Figure 4B). Association between SEPHS1 expression with TMB (A) and MSI (B).
Association Between SEPHS1 and DNA Mismatch Repair Genes and Methyltransferases
With the exception of cholangiocarcinoma (CHOL) and uterine carcinosarcoma (USC), almost all MMRs were positively correlated with SEPHS1 expression, showing that SEPHS1 can prolong tumor cell viability by enhancing DNA mismatch repair-related genes (Figure 5A). Association between SEPHS1 expression and the expression of DNA repair genes (MMRs) and methyltransferases. (A) The five MMRs. (B) The four methyltransferases (the red color indicates DNMT1, the blue color indicates DNMT2, the green color indicates DNMT3a, and the purple color indicates DNMT3b).
By analyzing the relationship between SEPHS1 and the expression of the 4 methyltransferases, it was discovered that there was a strong positive association between the 2 in all malignancies. The findings implied that SEPHS1 can control the epigenetic status of human pan-cancer to control tumor genesis and development (Figure 5B).
Prognostic Value of SEPHS1 in Human Tumors
The relationships between the expression of SEPHS1 and OS, DSS, DFI, and PFI in 33 malignancies from the TCGA dataset were analyzed and displayed in forest plots. We discovered that SEPHS1 expression was strongly linked with OS in LIHC (P = 2.3 × 10⁻⁵), ACC (P = 9.1 × 10⁻⁵), acute myeloid leukemia (LAML) (P = 6.5 × 10⁻³), SKCM (P = .02), LGG (P = 1.9 × 10⁻⁵), KIRC (P = 2.8 × 10⁻⁴), glioma (GBMLGG) (P = 1.1 × 10⁻¹⁸), and pan-kidney cohort (KIPAN) (P = .01) (Figure 6A). High SEPHS1 expression was related with PFS in ACC (P = 8.1 × 10⁻⁷), LIHC(P = 1.7e-3), cervical squamous cell carcinoma and endocervical adenocarcinoma (CESC) (P = .02), uveal melanoma (UVM) (P = .03), GBMLGG (P = 1.5 × 10⁻¹²), LGG (P = 8.8 × 10⁻⁴), KIRC (P = 1.4 × 10⁻³), OV (P = 9.8 × 10⁻³), KIPAN (P = .02) and THYM (P = .04) (Figure 6B). Besides, High SEPHS1 expression was connected with a worse outcome in ACC (P = 1.2 × 10⁻⁴), LIHC (P = 2.4 × 10⁻⁴), SKCM (P = .03), GBMLGG (P = 2.0 × 10⁻¹⁶), LGG (P = 2.4 × 10⁻⁵), KIRC (P = 6.6 × 10⁻⁵), KIPAN (P = 1.1 × 10⁻³), THYM (P = 8.8 × 10⁻³) and OV (P = .02), according to DSS analysis (Figure 6C). According to DFS analysis, SEPHS1 expression and prognosis were associated in ACC (P = 3.3 × 10⁻³) and LIHC (P = .04) (Figure 6D). Taken together, in ACC, LGG, and LIHC, SEPHS1 was substantially related to prognosis. Plots of the forests demonstrating the relationships between SEPHS1 expression and overall survival (OS) (A); progression-free survival (PFS) (B); disease-free survival (DFS) (C); disease-specific survival (DSS) (D) among patients with different forms of cancer. (E) OS of LGG patients. (F) OS of LIHC patients.
Due to few ACC samples (N = 77), for the purpose of estimating the likelihood of OS survival in patients with LGG and LIHC, a survival analysis was built. According to the analysis, the high SEPHS1 expression group in LGG had greater prognosis of surviving than the low expression group. (HR = .38, P = 5.4 × 10⁻⁸) (Figure 6E), while the high expression group in LIHC was significantly worse than low expression group (HR = 2.13, P = 6.2 × 10⁻⁵) (Figure 6F), suggesting that SEPHS1 is a high-risk factor in LIHC, but a low-risk factor in LGG.
Building and Evaluating LGG and LIHC Nomograms
Age, histological tumor grade, SEPHS1, the patient’s age, and radiation were all risk variables for OS in LGG patients, according to a univariate Cox regression analysis (P < .05). The multivariate Cox regression analysis revealed that SEPHS1, histological tumor grade, and patient age could all be used as independent risk variables for LGG patients (P < .05). According to the multivariate analysis results of the COX proportional hazards model, 6 risk factors, including SEPHS1, patient age, race, gender, histological tumor grade, and radiotherapy, were included to establish the LGG overall survival nomogram, which yielded a C-index of .792 (95% CI .722-.862), which showed good accuracy and reliable predictions (P = 3.27 × 10⁻¹⁶). For the 1-year, 3-year, and 5-year OS probability, calibration plots demonstrated good concordance between nomogram prediction and actual observation. The risk score’s ideal cutoff value, as determined by the R program maxstat, was .797. Based on the proper cutoff value for the risk score, patients were split into 2 groups with high and low scores. When the log-rank test method was used to determine the significance of prognostic differences between several groups of samples, in comparison to the low-score group, the high-score group’s prognosis was substantially poorer. (P = 4.8 × 10⁻¹⁵) (Figure 7). (A) Univariate Cox regression analysis; (B) Multivariate Cox regression analysis; (C) Nomogram for predicting the 1-year, 3-year, 5-year OS of LGG patients; (D) External calibration has been performed on the predictive nomogram for the LGG-OS; (E) OS of LGG patients.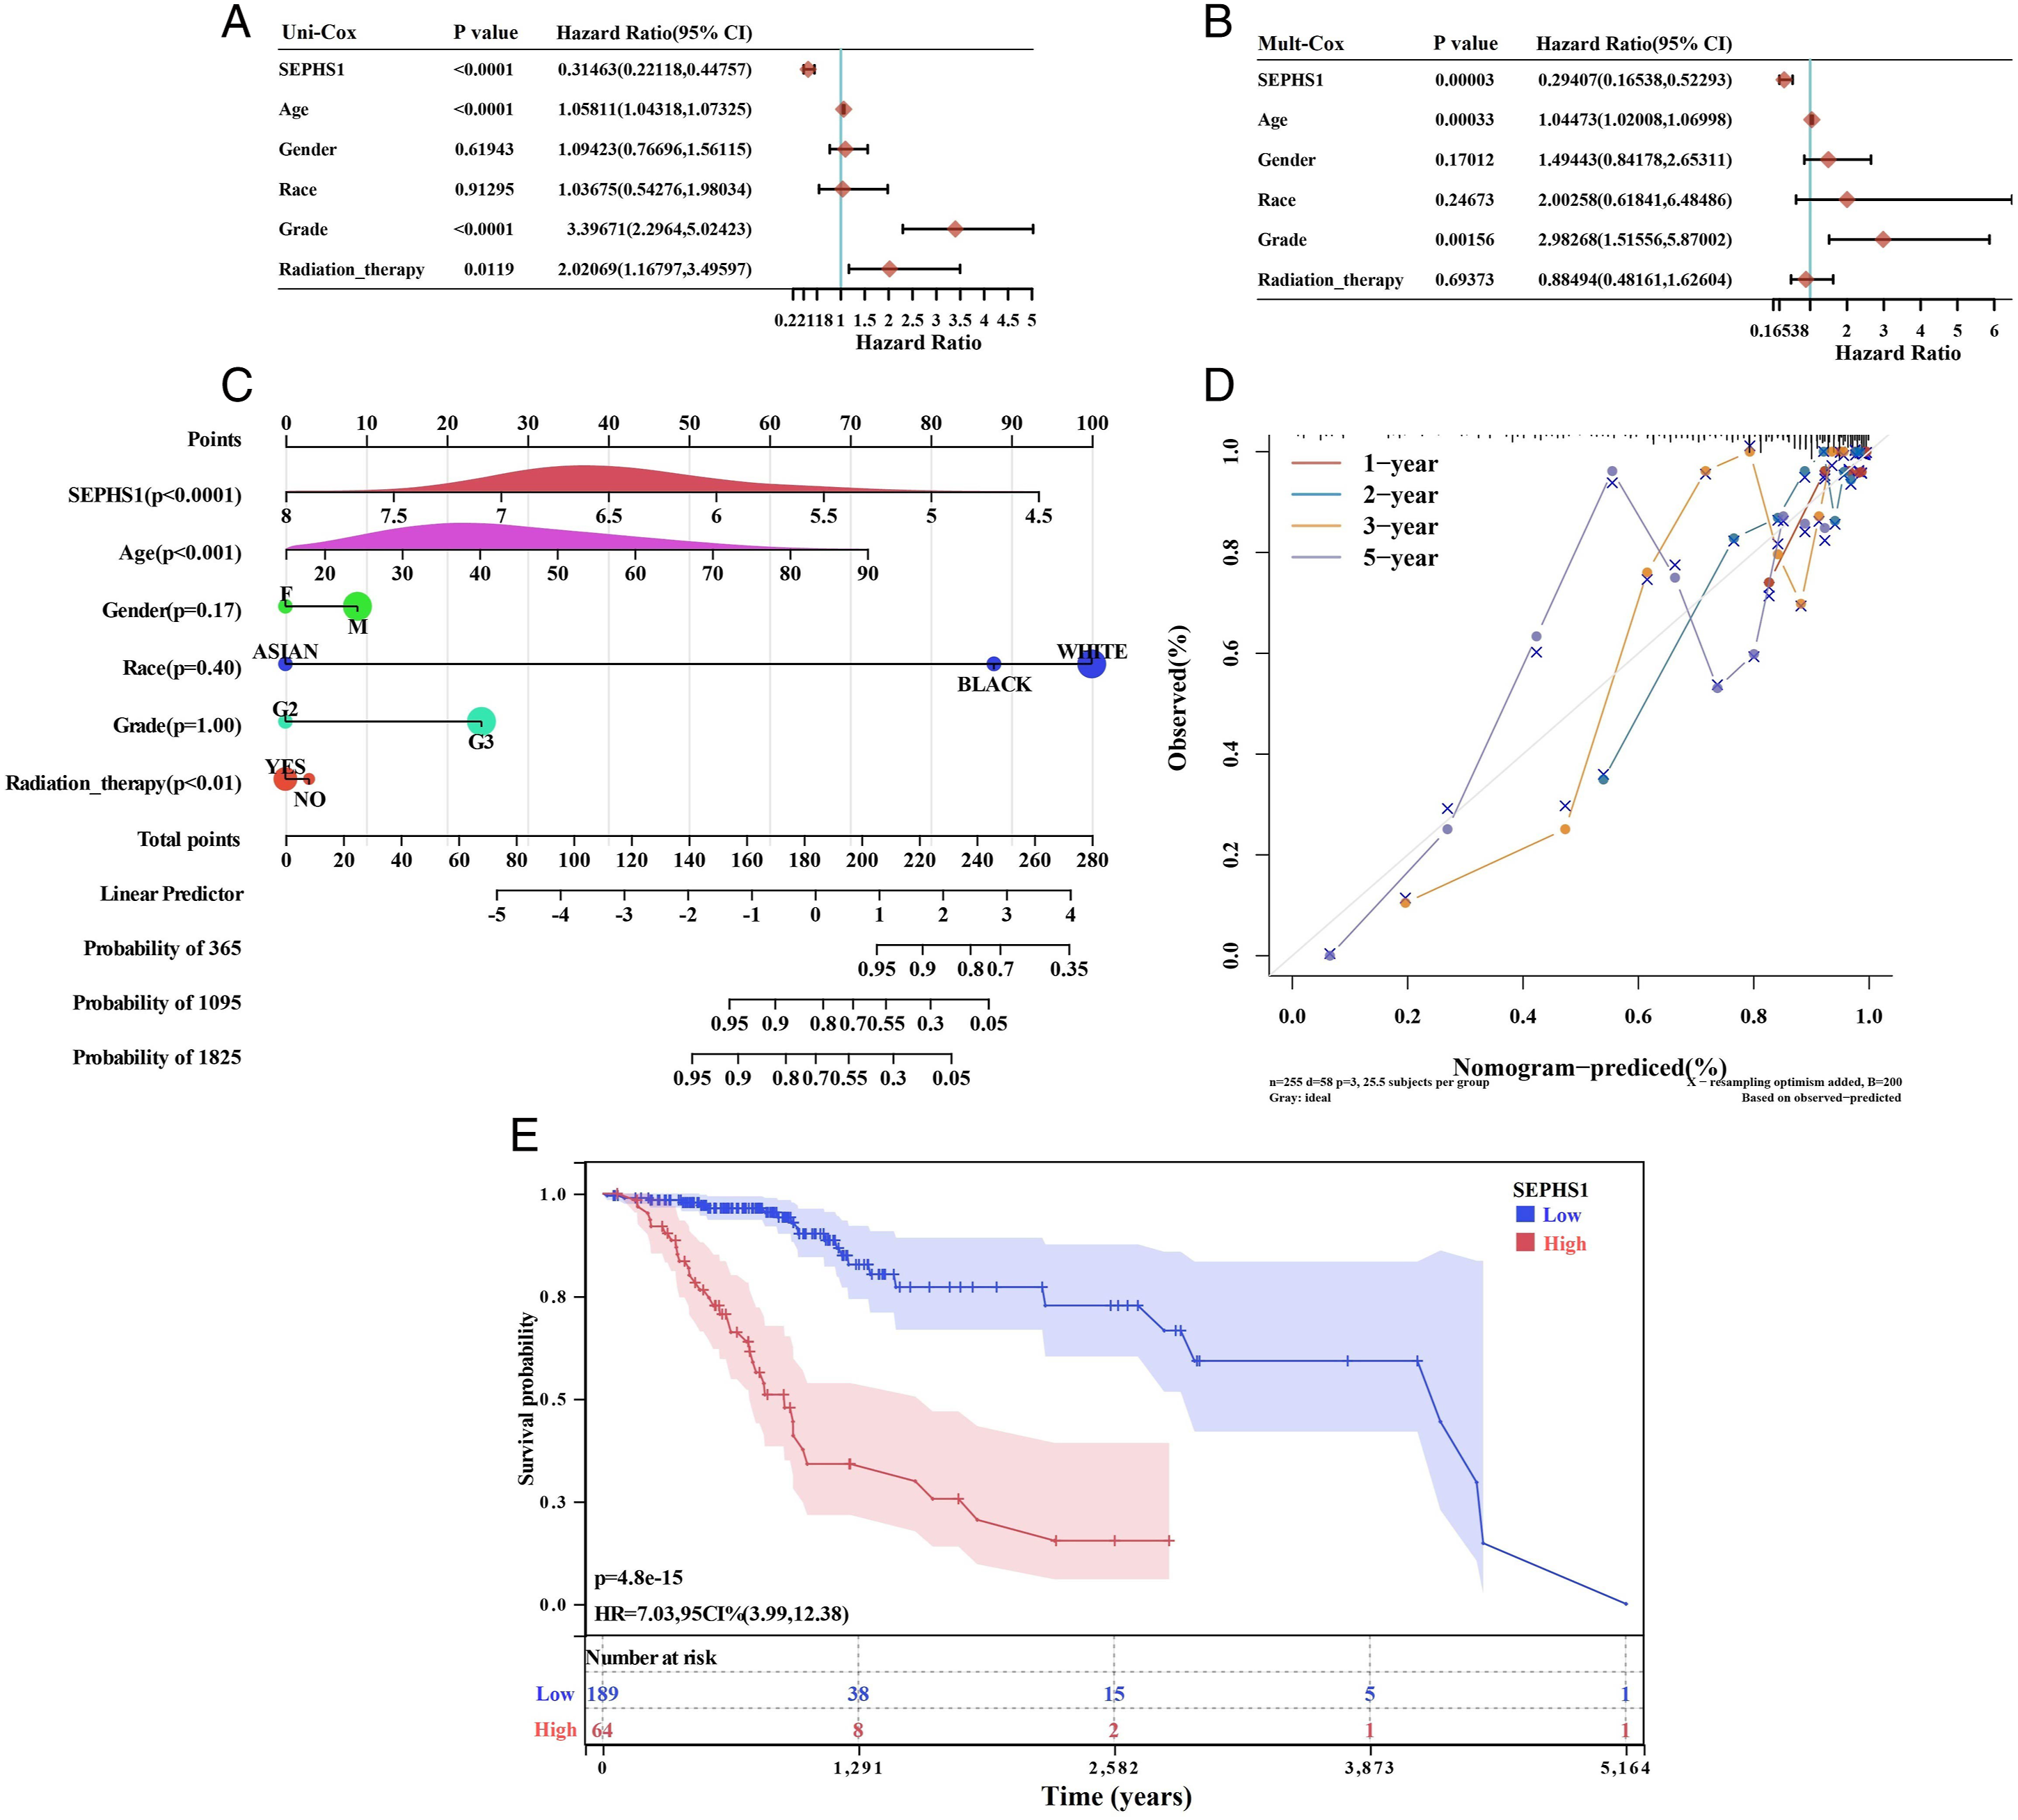
Similarly, univariate COX regression analysis revealed that SEPHS1, patient age, pM-stage, and pTNM-stage were risk factors for OS in LIHC patients (P
s
< .05). SEPHS1 and pTNM-stage were discovered to be independent predictive risk factors for LIHC patients by multivariate Cox regression analysis (P < .05). The prognostic nomogram included 260 LIHC patients and integrated survival time, survival status, and 6 characteristics (SEPHS1, patient age, race, gender, histological tumor grade, and radiotherapy) for forecasting the survival rate of individuals with LIHC. The C-index was .6988 (95% CI: .641-.757, P = .39 × 10−11), which suggested good accuracy and reliable predictions for 1-, 3- and 5-year survival probabilities. For the 1-year, 3-year, and 5-year OS probability, calibration plots demonstrated good concordance between nomogram prediction and actual observation. The risk score’s ideal cutoff value, determined by the R package maxstat, was .225. Depending on their ratings, the patients were split into 2 groups: high and low. Using the log-rank test method, the significance of prognostic differences between different sample groups was evaluated. The outcomes demonstrated that the high-score group’s prognosis was much poorer than that of the low-score group. (P = 4.8 × 10⁻¹⁵) (Figure 8). (A) Univariate Cox regression analysis; (B) Multivariate Cox regression analysis; (C) Nomogram for predicting the 1-year, 3-year, 5-year OS of LIHC patients; (D) External calibration has been performed on the predictive nomogram for the LIHC-OS; (E) OS of LIHC patients.
Validation of the Effect of SEPHS1 on Overall Survival in LIHC and LGG
Using the ideal cutoff value of the risk score generated with the R package maxstat (14.1532), a group of LIHC patients with high SEPHS1 expression and a group of LIHC patients with low SEPHS1 expression were divided. The significance of prognostic features of various sample groupings was assessed using the log-rank test method. The findings revealed that the high-score group’s survival prognosis was considerably poorer than the low-score group’s (P = 1.0 × 10⁻⁶), consistent with the results of the TCGA dataset analysis (Figure 9). Further research was conducted on the impact of SEPHS1 expression on the overall survival rate of patients with various LGG types in the CGGA database. The outcomes revealed that the high expression group had a superior prognosis for LGG (HR = .39, P = 1.2 × 10⁻⁴), GBMLGG (HR = .28, P = 9.4 × 10⁻¹⁴), and GBM (HR = .42, P = 3.0 × 10⁻³) compared to the low expression group (Figure 10). OS of LIHC patients from the ICGC database. OS in different types of LGG from the CGGA database. (A) Of LGG patients; (B) of GBMLGG patients; (C) of GBM patients.

Association Between SEPHS1 and Immune Infiltration in LGG and LIHC
From the TIMER database, we retrieved the score information for 6 immune infiltrating cells from LGG and LIHC, and we compared SEPHS1 expression to these immune cell scores. We discovered an intriguing correlation between strong immune infiltration in LGG and LIHC and SEPHS1 expression levels. Infiltrating levels of CD8+ T cells (r = −.123, P = .00465) and neutrophils (r = −.092, P = .0355, respectively) are significantly inversely correlated with SEPHS1 expression level in LGG (Figure 11A). In the same way, there were close associations with infiltrating levels of B cells (r = .295, P = 7.88 × 10⁻⁹), CD4+ T cells (r = .276, P = 6.98 × 10⁻⁸), CD8+ T cells (r = .156, P = .00262), neutrophils (r = .233, P = 5.67 × 10⁻⁶), macrophages (r = .342, P = 1.08 × 10⁻¹¹), and DCs (r = .267, P = 61.94 × 10⁻⁷) in LIHC (Figure 11B). These results overwhelmingly support the idea that SEPHS1 specifically contributes to immune infiltration in LIHC. Association between SEPHS1 expression and the level of immune infiltration. (A) In LGG; (B) in LIHC.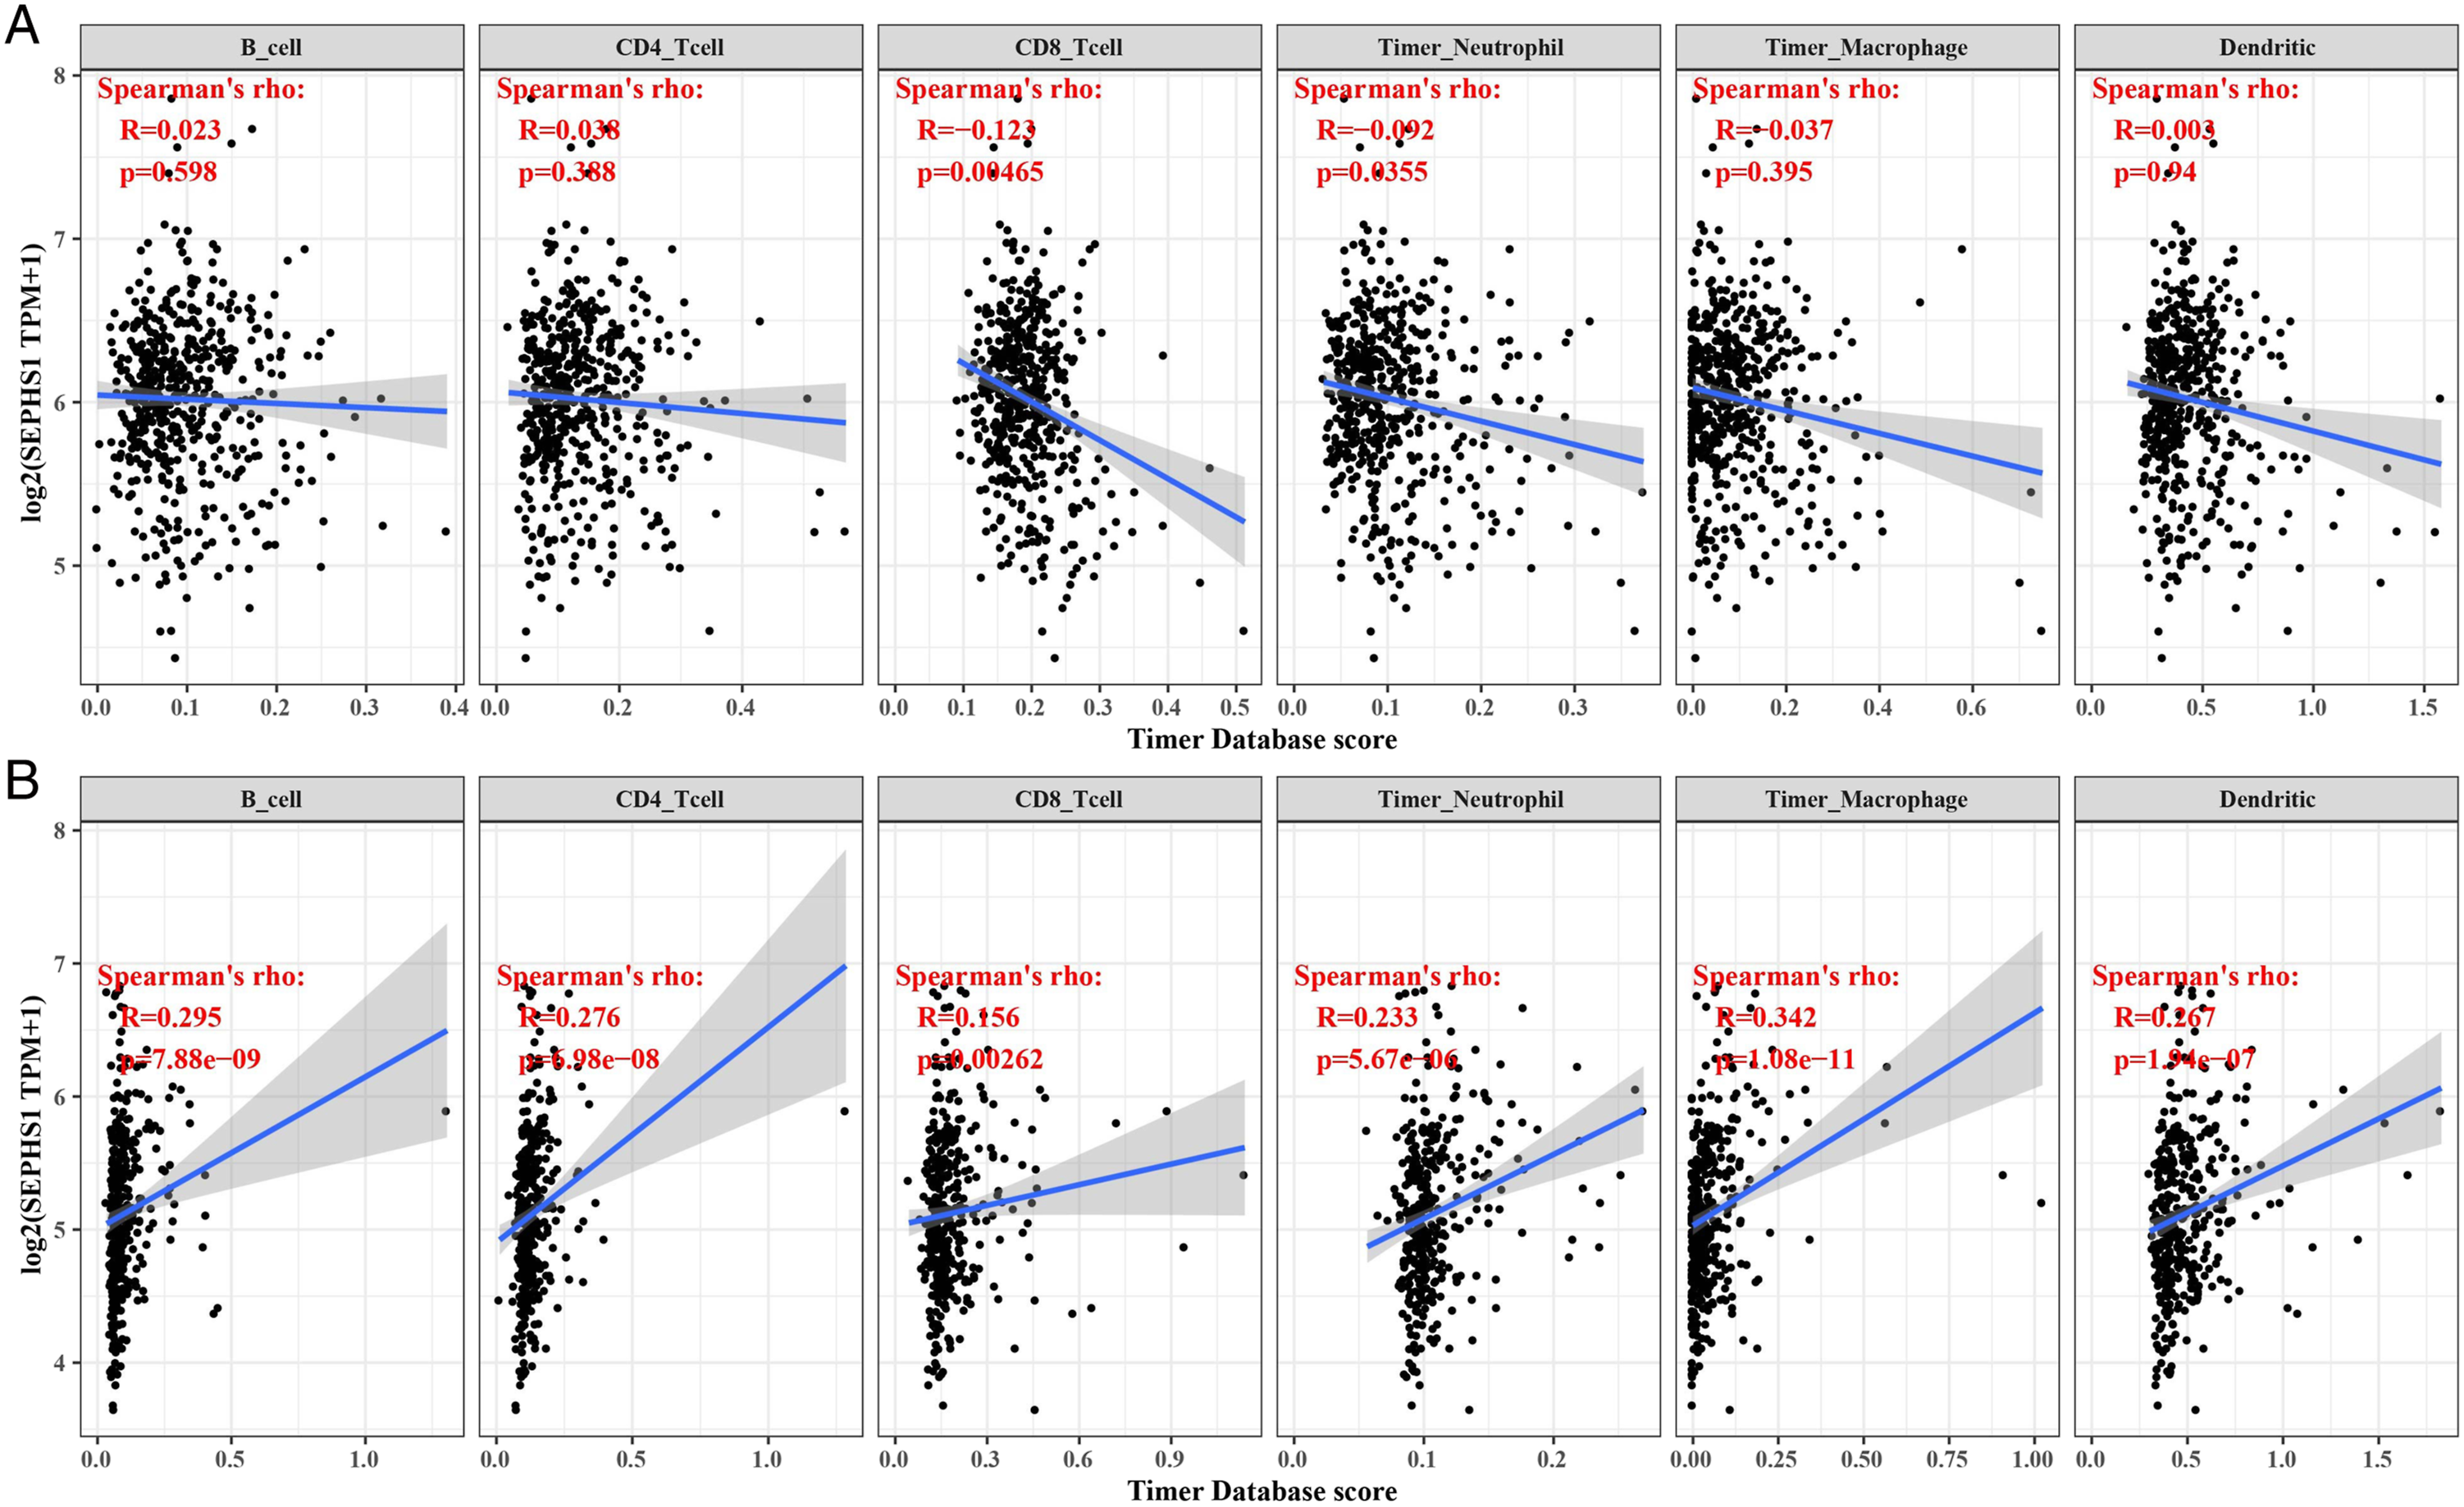
Correlation Between SEPHS1 and Tumor Pathway Scores in LGG and LIHC
In LGG, SEPHS1 expression was negatively correlated with upregulation of reactive oxygen species, extracellular matrix deterioration, collagen formation, angiogenesis, and P53 signaling, while in LIHC, SEPHS1 expression showed a positive correlation with G2/M checkpoint, MYC signaling, P13K/AKT signaling, DNA replication, and tumor value-added characteristics (Figure 12). Association between SEPHS1 expression and signaling pathway in LGG (A-E); in LIHC (F-L).
Interaction Between SEPHS1 With Chemotherapy and Radiotherapy on OS in LGG Patients
In LGG patients, the chemotherapy group’s survival rate was noticeably higher than the non-chemotherapy group’s. (P = 7.6 × 10⁻⁴, HR = 2.05) (Figure 13A). In the treatment group, higher SEPHS1 expression was linked to a higher survival rate than lower SEPHS1 expression. (P = 9.6 × 10⁻¹⁰, HR = .21) (Figure 13B). In the treatment group, higher SEPHS1 expression was linked to a higher survival rate than lower SEPHS1 expression. (Figure 13C). Patients with LGG who had radiotherapy had a decreased chance of survival than those who did not receive radiotherapy (P = .01, HR = 2.02) (Figure 13D). Importantly, in both the radiotherapy group (P = 1.2 × 10⁻¹⁰, HR = .14) (Figure 13E) and the non-radiotherapy group (P = 7.1 × 10⁻³, HR = .31) (Figure 13F), SEPHS1 expression was still linked to a greater survival rate than low SEPHS1 expression. Cross-over interaction of SEPHS1 with Chemotherapy and Radiotherapy on OS of LGG. (A) Effect of SEPHS1 expression on the survival status of patients in the chemotherapy and the non-chemotherapy patients; (B) in the chemotherapy group; (C) in the non-chemotherapy group; (D) Effect of SEPHS1 expression on survival probability of patients in radiotherapy and non-radiotherapy patients; (E) in the radiotherapy group; (F) in the non-radiotherapy group.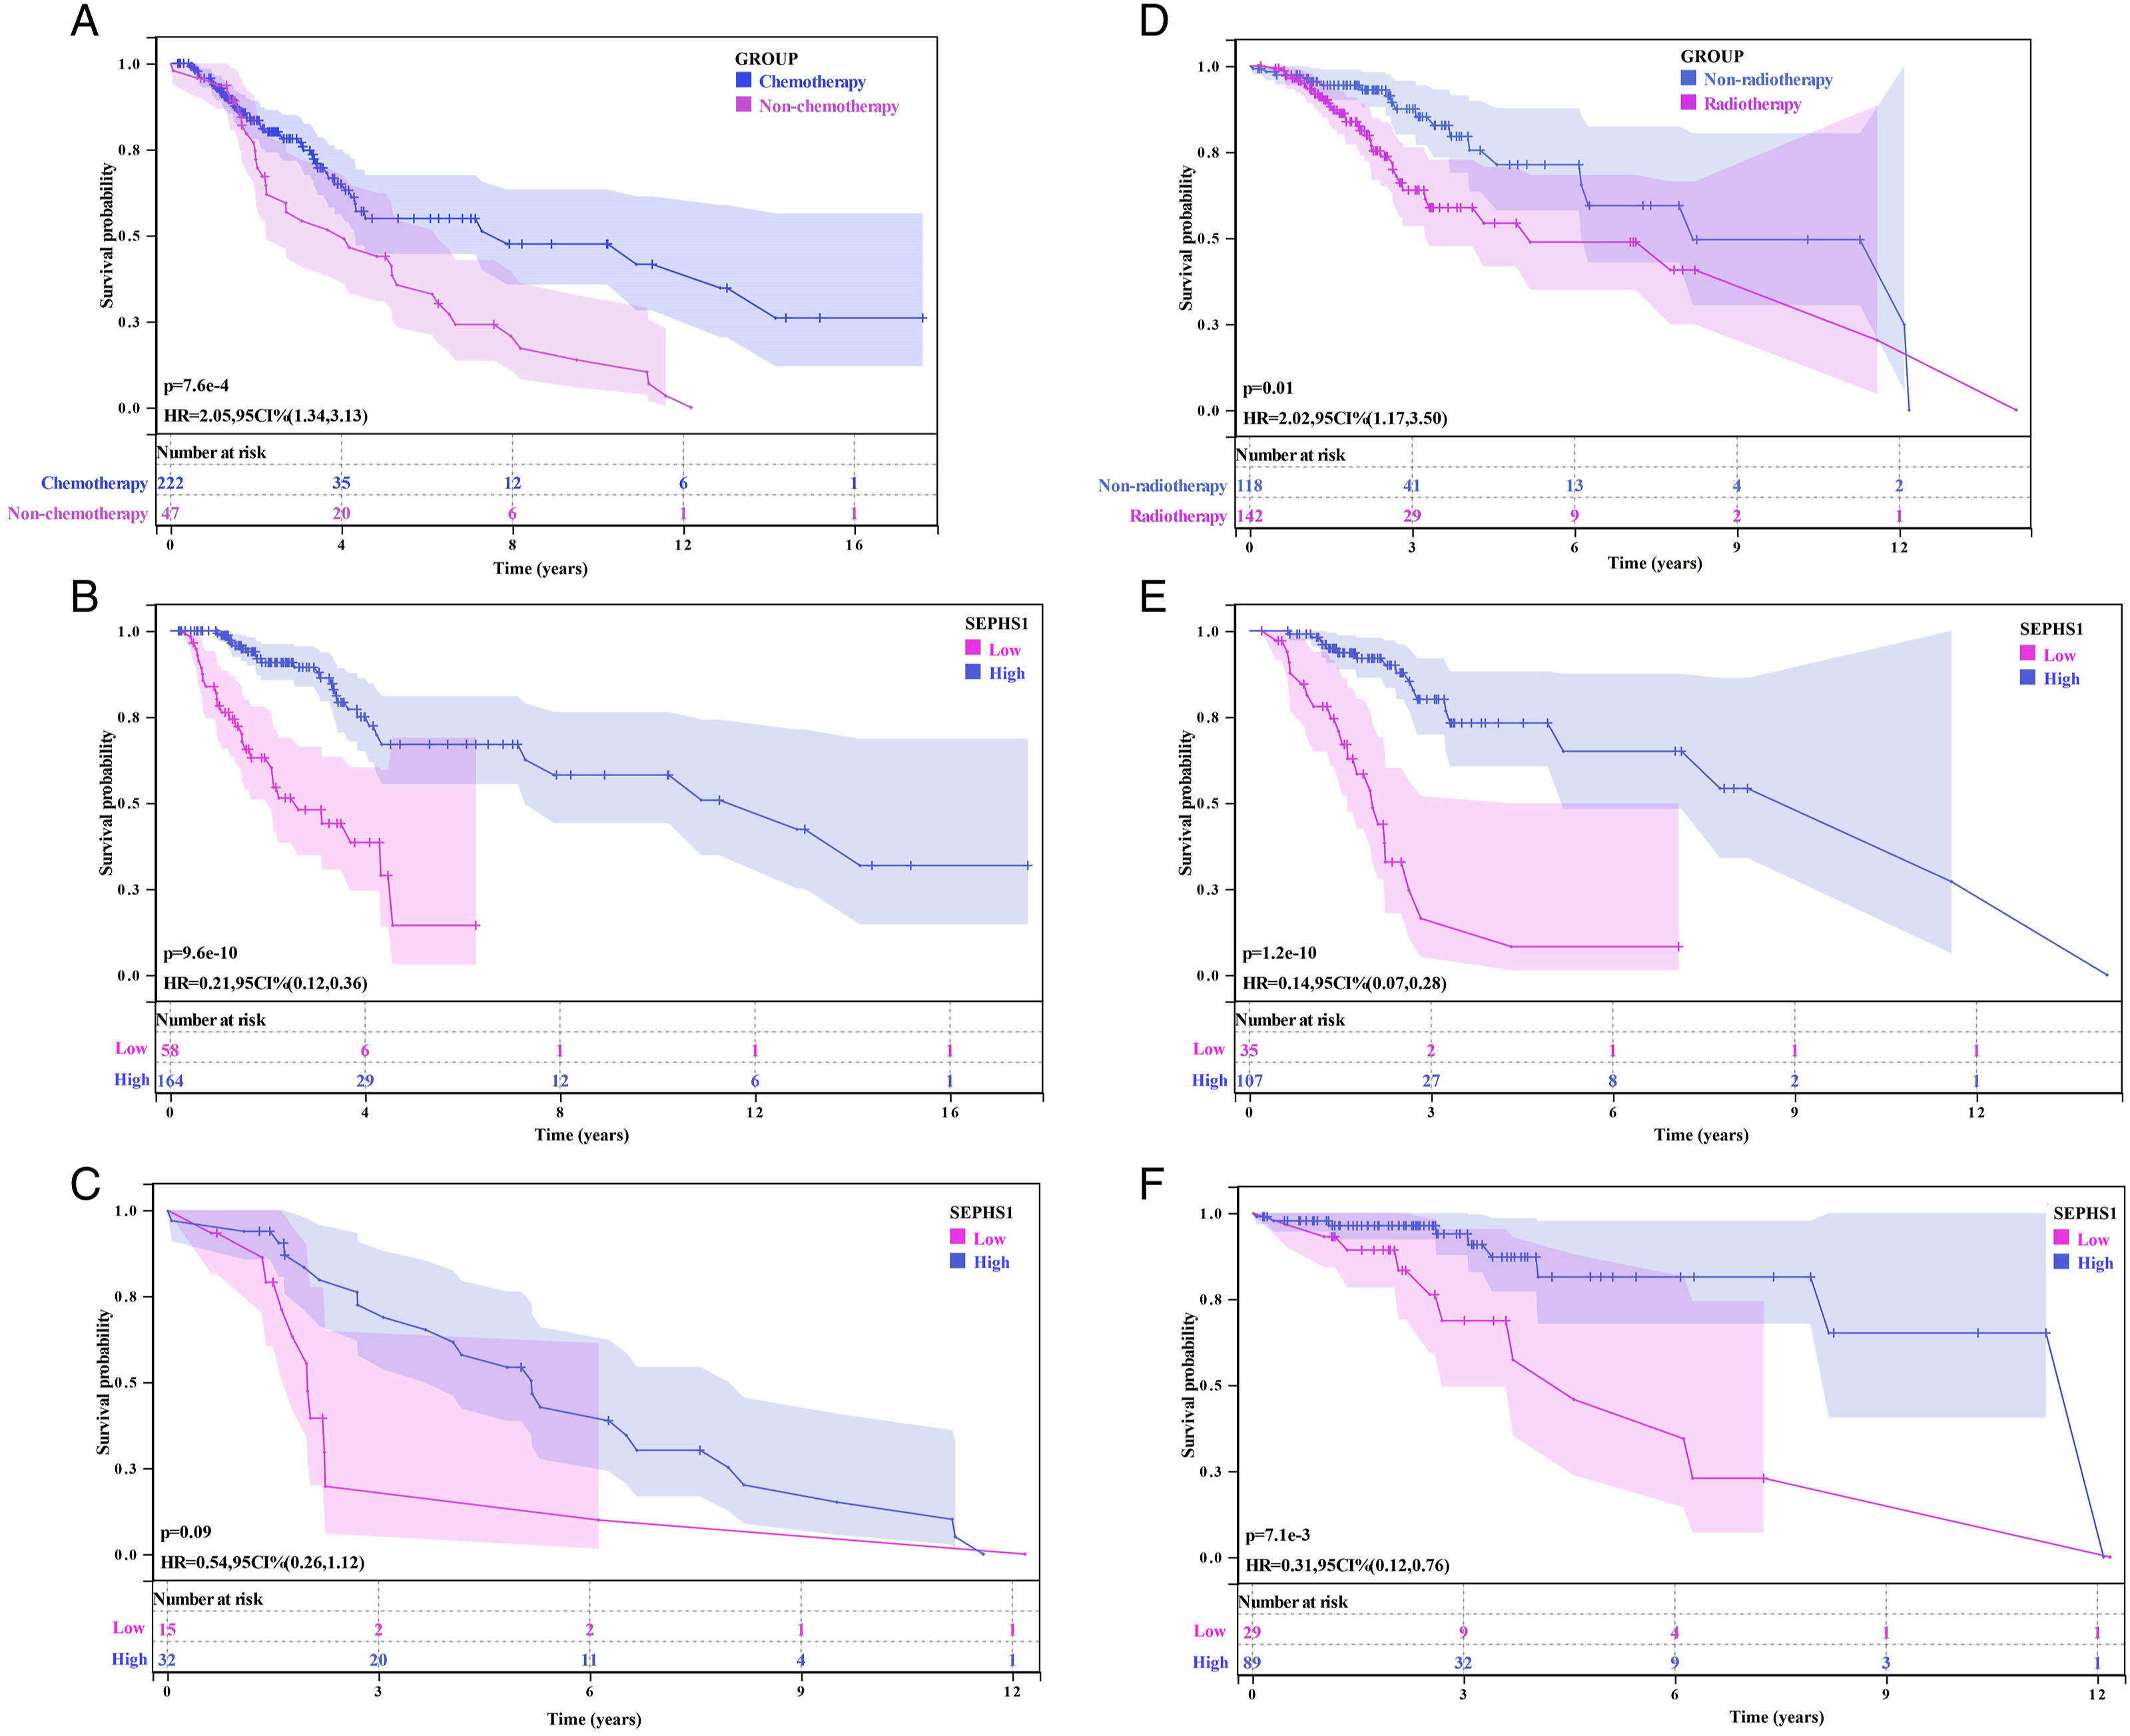
Interaction Between SEPHS1 and Chemoradiotherapy for LGG.

Interaction Between SEPHS1 With Hepatitis B and Hepatitis C on OS in LIHC Patients
Patients with LIHC had a poorer overall survival rate for those who had HBV than those who did not. (P = 7.4 × 10⁻⁴, HR = 1.80) (Figure 14A). Low SEPHS1 expression correlated with a better prognosis than high SEPHS1 expression in the HBV-infected group (P = 8.6 × 10⁻⁶, HR = 3.15) (Figure 14B) and the HBV-uninfected group (P = 7.5 × 10⁻³, HR = 1.95) (Figure 14C). Similarly, the overall survival rate of the HCV-infected group was lower than the HCV-uninfected group in LIHC patients (P = 8.5 × 10⁻⁷, HR = 2.44) (Figure 14D). Low SEPHS1 expression has a better survival prognosis than high SEPHS1 expression in the HCV-infected group (P = 5.3 × 10⁻⁵, HR = 3.32) (Figure 14E) and the HCV-uninfected group (P = .02, HR = 1.71) (Figure 14F). Cross-over interaction of SEPHS1 with HBV and HCV on OS of LIHC. (A) Effect of SEPHS1 expression on survival prognosis of HBV-infected and uninfected patients; (B) in HBV-infected group; (C) expression of HBV-uninfected group; (D) Effect of SEPHS1 expression on survival prognosis of HCV-infected and uninfected patients; (E) in HCV-infected group; (F) in HCV-uninfected group.
Likewise, we established multivariate-adjusted associations to explore the multiplicative interaction among SEPHS1, HBV infection, and HCV infection (Table 2). Taking the survival status of LIHC patients as the dependent variable, SEPHS1, HBV, and HBV*SEPHS1 were introduced into the logistic regression analysis model for interaction analysis. We found that SEPHS1 (P = .004, OR = 1.791) and HBV*SEPHS1 (P = .019, OR = 1.107) were risk factors for LIHC, and there was a significant interaction between HBV and SEPHS1 in LIHC. Similarly, with the survival status of LIHC patients as the dependent variable, SEPHS1, HCV, HCV * SEPHS1 were introduced into the logistic regression analysis model for interaction analysis, and the results showed that SEPHS1 (P = .005, OR = 1.787) and HCV * SEPHS1 (P = .021, OR = 1.105) were risk factors for LIHC, and there was a significant interaction between HCV and SEPHS1 in LIHC. Drug sensitivity analysis of SEPHS1. (A) Correlation between SEPHS1 expression level and IC50 of Sorafenib in LIHC; (B) 5-Fluorouracil in LIHC; (C) Temozolomide in LGG. Interaction Between SEPHS1 and Infected HBV or HCV for LIHC.

Sensitivity of SEPHS1 to Chemotherapy
The pharmacological effects of medicines on LIHC patients with high SEPHS1 expression were predicted using the GDSC database. Research revealed a strong negative correlation between high SEPHS1 expression and Sorafenib’s half-maximal inhibitory concentration (IC50) (P = 5.94 × 10⁻², = −0.49) (Figure 15A). The pharmacological effects of drugs on LGG patients with high SEPHS1 expression were subsequently predicted. We discovered that the IC50 of 5-Fluorouracil (P = 4.74 × 10-12,0.35) (Figure 15B) and Temozolomide (P = 1.73 × 10⁻⁶, 0.21) (Figure 15C) was adversely linked with increased SEPHS1 expression respectively.
Discussion
It is known that some selenoproteins may express themselves abnormally in a variety of human malignancies. 30 Interestingly, the documented association between SEPHS1 expression and the stage and differentiation of osteosarcoma suggests that SEPHS1 expression affects the occurrence and development of osteosarcoma. 31 Moreover, SEPHS1 expression has been linked to bad prognosis in liver cancer patients, suggesting it may be a biomarker for predicting prognosis in this patient population. 32 Besides, loss of SEPHS1 expression in mouse cells can reportedly affect cell growth and proliferation. 17 Deletion of SEPHS1 impairs redox homeostasis, impairs glutathione system protein production, and reverses several malignant phenotypes in mouse embryonic cancer cells, indicating that SEPHS1 may be implicated in carcinogenesis. 33 However, the expression and function of SEPHS1 in other tumors have hitherto been rarely reported. Accordingly, investigating SEPHS1’s function in tumor prognosis and prevention is crucial. Surgery, radiation, chemotherapy, targeted therapy, and immunotherapy are the primary cancer treatments. Given that tumor recurrence and prognosis are strongly influenced by the immune system, 34 immunomodulation of the tumor microenvironment has been applied during clinical practice as a new type of treatment. 35 Overall, the evidence at hand suggests that these methods considerably enhance the treatment of LGG, proving that immunotherapy is an important component of the management of LGG. 36 Interestingly, some cancers have the ability to control immunological checkpoints to defend themselves against host attacks. 3 Therefore, the study of tumor immunity is of great significance. In this study, we looked into how immunological correlation, TMB, and MSI were correlated with SEPHS1 expression in diverse cancers, and examined the TCGA database’s 33 tumor SEPHS1 RNA-seq data. To support the function of SEPHS1 in diverse malignancies, univariate and multivariate Cox regression analysis, prognostic nomogram models, and calibration curves were created. The effect of SEPHS1 with HBV and HCV on OS of LIHC was further investigated, as was the cross-over interaction of SEPHS1 with chemotherapy and radiotherapy on OS of LGG. Finally, the relationship between sensitivity to drugs and SEPHS1 expression was investigated.
Herein, using the GTEx dataset, we discovered that SEPHS1 was expressed in healthy human tissues. SEPHS1 was also widely expressed in various tumor cell lines used in the CCLE database. To examine the differential expression of SEPHS1 in 27 different types of cancers, the data of normal tissues in the GTEx database and the data of TCGA tumor tissues were combined. We discovered that SEPHS1 was expressed more strongly in the majority of tumor tissues than in normal tissues. Overwhelming evidence substantiates that SEPHS1 is highly expressed in various tumors, indicating that SEPHS1 might be a proto-oncogene.
The importance of the immune system in the occurrence, development, and therapy of cancer was generally recognised. 37 An essential component of the complex microenvironment that controls the onset and course of various malignancies are tumor-infiltrating immune cells (TIICs). 38 TIICs have been reported to independently predict tumor metastasis and prognosis. 39 The number and activity status of TIICs are important predictors of tumor survival time. 40 It was discovered that SEPHS1 may have a role in immunological tolerance, tumor progression, the tumor microenvironment, and tumor genesis by examining the association between immune checkpoint gene expression and SEPHS1 expression in different types of cancers.
The relationship between microsatellite instability and tumor prognosis has been supported by numerous clinical observations, retrospective studies, and meta-analyses. 41 Moreover, we found that SEPHS1 expression had a positive connection with TMB in BLCA, STAD, SKCM, LUAD, GBM, and BRCA. Besides, the expression of SEPHS1 in STAD, OV, LIHC, and KIRC was significantly positively correlated with MSI. SEPHS1 was highly linked with TMB and MSI, indicating that SEPHS1’s prognostic utility in different malignancies is not only dependent on the tumor’s clinical stage. Indeed, mutations may be an important factor affecting the prognosis of this patient population. Additionally, it was discovered that SEPHS1 expression positively connected with the majority of MMRs, suggesting that SEPHS1 may be able to preserve tumor cell viability via genes associated with DNA mismatch repair. By modifying the epigenetic state of human pan-cancer, correlation analysis revealed a strong connection between the expression levels of methyltransferases and SEPHS1 in all malignancies, indicating that SEPHS1 can control tumor genesis and progression.
When we looked at the association between the expression of SEPHS1 in 33 malignancies from the TCGA dataset and the prognosis of OS, DSS, DFI, and PFI, we found that it was substantially connected with the prognosis of LGG, LIHC, and ACC. In order to forecast the OS survival probability in LGG and LIHC, survival analysis was done. The findings demonstrated a correlation between SEPHS1 and a poor prognosis in LGG and LIHC. There was a transcriptome analysis showed that SEPHS1 deficiency in the liver significantly affected the expressionofalarge number ofgenesinvolved in cancer, development, and the redox regulation system, 42 consistent with our findings.
Traditional factors including TNM staging, vascular invasion, and AFP partially aid in tumor prognosis prediction. In this investigation, we found that the LIHC and LGG patient prognosis had the strongest correlation with abnormal SEPHS1 expression. SEPHS1 is an independent predictive factor for LIHC and LGG patients, according to COX regression analysis utilizing an external data set, which is consistent with our prior findings. Additionally, ROC results indicate that SEPHS1 has great predictability. These findings showed that the nomogram integrating clinical Stage and SEPHS1 expression had greater prediction value for the overall survival of LIHC and LGG patients, which may help in determining patient management and efficacy assessment.
Moreover, the effect of SEPHS1 expression in the CGGA database on the overall survival rate of patients with different LGG types was analyzed. The outcomes demonstrated that the prognosis for the high SEPHS1 expression group was superior to the low expression group in LGG, GBM-LGG, and GBM. According to the validation of SEPHS1’s impact on overall survival in LIHC, SEPHS1’s diagnostic values for LIHC were consistent across the ICGC and TCGA databases, and SEPHS1 yielded a good diagnostic performance for LIHC. According to our research, SEPHS1 may be a diagnostic marker for LGG and LIHC.
According to reports, the tumor microenvironment (TME), which is made up of tumor cells as well as several other cells, is critical to the development of cancer and may have a big impact on clinical outcomes. 43 Tumor-infiltrating immune cells make up a significant portion of the TME and are linked to the development, invasion, and metastasis of almost all malignancies.44,45 The numerous immune cells that advanced tumors draw in may trigger an inflammatory environment and encourage the release of cytokines and chemokines, which aid in the growth, invasion, and pathological angiogenesis of the tumor. 46 We confirmed that aberrant SEPHS1 expression was associated with immune cells infiltration of B cells, CD4+ T cells, CD8+ T cells, neutrophils, macrophages, and DCs in LIHC and LGG. These results suggest aberrant SEPHS1 expression may alter tumor immune microenvironment.
The main role of SEPHS1 is its involvement in the control of cellular redox homeostasis. Instability in the expression of genes involved in redox homeostasis is caused by SEPHS1 deficiency. In LGG, SEPHS1 expression was negatively correlated with reactive oxygen species upregulation, extracellular matrix deterioration, collagen formation, angiogenesis, and P53 signaling, while in LIHC, SEPHS1 expression was positively correlated with G2/M checkpoints, MYC signaling, P13K/AKT signaling, DNA replication, and tumor proliferation signatures.
In many cases, LGG are slow-growing tumors that, if left untreated, can lead to serious morbidity and even endanger life. Chemotherapy is an effective therapeutic option for unresectable, progressive LGG, according to more than 20 years of clinical research, it can be said with certainty. By delaying tumor growth and delaying radiotherapy, it spares a developing brain from the harmful consequences of radiation exposure. 47 Initial evidence indicating acceptable blood-brain barrier penetration, simplicity of administration, and generally good tolerability helped temozolomide (TMZ) gain prominence in the field of neuro-oncology. TMZ is now the treatment of choice in cases of glioblastoma as a result of the findings of randomized trials in this disease. 48 As per the cross-over interaction between SEPHS1 and chemotherapy on OS in LGG patients, greater SEPHS1 expression in the chemotherapy group was linked to a higher survival rate than low SEPHS1 expression. Interestingly, in both the radiation and control groups, high SEPHS1 expression was linked to a greater survival rate. Chemotherapy was advised for LGG patients, particularly for those with high SEPHS1 expression because it can predict how responsive patients will be to 5-Fluorouracil and Temozolomide. This interaction between SEPHS1 and chemoradiotherapy has a positive clinical impact and may be used as evidence for chemotherapy. It is now understood that the most significant risk factors for LIHC are HBV and HCV infections. In LIHC patients, the cross-over interaction of SEPHS1 with HBV and HCV on OS found that low SEPHS1 expression was linked to a better prognosis and survival than high SEPHS1 expression. According to these results, patients with LIHC may have a better prognosis if their SEPHS1 expression is lowered.
We studied the interaction between radiotherapy or chemotherapy with the expression of SEPHS1 on the survival and prognosis of LGG patients, and also investigated whether HBV or HCV infection interacted with SEPHS1 expression on the survival and prognosis of LIHC patients, which was not involved in previous studies. However, there were still 2 main limitations. Firstly, the present study is mainly based on bioinformatics technologies, and independent verification experiments have not been carried out; Secondly, due to no follow-up were carried out in this study, the causal relationship between the influencing factors and LGG or LIHC could not be determined.
Conclusion
The growth and prognosis of different cancers are strongly correlated with SEPHS1. Low expression of SEPHS1 is a risk factor for worse OS in LGG patients, and chemotherapy is recommended for this patient population in clinical practice. Besides, high SEPHS1 expression can predict TMZ sensitivity in LGG, providing potential evidence for chemotherapy. Irrespective of the HBV and HCV infection status, low SEPHS1 expression had a better survival prognosis than patients with high SEPHS1 expression in LIHC. The biological function of SEPHS1 is relatively complex and warrants further exploration and research in the mechanism of resisting disease and promoting human health.
Supplemental Material
Supplemental Material - Pan-Cancer Study of the Prognosistic Value of Selenium Phosphate Synthase 1
Supplemental Material for Pan-Cancer Study of the Prognosistic Value of Selenium Phosphate Synthase 1 by Jie Hao, H Ao-Yue, Xu Zhao, Xue-Qin Chen, Qi-Ling Liu, Na Sun, Rong-Qiang Zhang, and Ping-Ping Li in Cancer Control
Footnotes
Acknowledgments
We thank those who participated in the preparation and maintenance of the databases used in this study. We thank the School of Public Health, Shaanxi University of Chinese Medicine for assistance.
Author Contributions
Study design and conception: Jie Hao, Rongqiang Zhang
Acquisition of the data: Xu Zhao, Xueqin Chen, Na Sun, Pingping Li
Analysis and interpretation of the data: Aoyue He, Qiling Liu
All authors were involved in reading and revising the draft and approved the final version for publication.
Declaration of Conflicting Interests
The author(s) declared no potential conflicts of interest with respect to the research, authorship, and/or publication of this article.
Funding
The author(s) disclosed receipt of the following financial support for the research, authorship, and/or publication of this article: This work was supported by this study was supported by Special R&D Program Project of Chinese Academy of Se-enriched Industry (2020FXZX05-01) and Subject Innovation Team of Shaanxi University of Chinese Medicine (132041933).
Ethical Approval
This study does not require ethical approval, because all the obtained data were used according to the public resources, including TCGA, GTEx and TIMER, as well as GDSC. Both mRNA profile data and clinical information are publicly available and open-access. This study does not involve animal studies. Therefore, the study does not need to be approved by the local ethics committee.
Supplemental Material
Supplemental material for this article is available online.
References
Supplementary Material
Please find the following supplemental material available below.
For Open Access articles published under a Creative Commons License, all supplemental material carries the same license as the article it is associated with.
For non-Open Access articles published, all supplemental material carries a non-exclusive license, and permission requests for re-use of supplemental material or any part of supplemental material shall be sent directly to the copyright owner as specified in the copyright notice associated with the article.