
Abstract
Objectives
The abnormal expression of immune-related genes (IRGs) plays an important role in the occurrence and progression of ovarian cancer (OC), which is the main cause of mortality among gynecological cancer patients. This study aims to establish a prognostic risk model and comprehensively analyze the relationship between OC risk score and prognosis, immune cell infiltration (ICI) and therapeutic sensitivity in OC.
Methods
We retrospectively evaluated the clinicopathological characteristics of consecutive OC patients in the Cancer Genome Atlas (TCGA) database. First, the prognostic risk model was constructed by bioinformatics methods. And then, we systematically assessed model robustness, and correlations between risk score and prognosis, and immune cell infiltration. The ICGC cohort was used to verify the prognostic risk model. Finally, we evaluated their value in the treatment of OC immunotherapy and chemotherapy.
Results
A total of 10 IRGs were identified to construct the prognostic risk model. Survival analysis revealed that patients in the low-risk group had a better prognosis (P < .01), and the risk score might be considered an independent predictor for predicting the prognosis. In addition, risk scores and patient clinical information were used to construct clinical nomograms, improving the prediction’s precision. We also explored the relationship between the risk score and ICI, immunotherapy and drug sensitivity.
Conclusions
Collectively, we identified a novel ten IRGs signature that may be applied as a prognostic predictor of OC, thereby benefiting clinical decision-making and personalized treatment of patients.
Introduction
As 1 of the most common malignancies of the female reproductive system, ovarian cancer (OC) carries the highest mortality. 1 Due to the unclear etiology and no effective early diagnosis method, 70% of OC patients are diagnosed at an advanced stage, leading to an extremely low 5-year survival rate. 2 Although OC has a variety of treatments including debulking surgery, targeted agents, platinum-based chemotherapy and immunotherapy, OC is prone to develop drug resistance to most treatments. 3 Even with the most promising immunotherapy, in the treatment of OC, the objective remission rate is less than 20%. 4 At present, clinicopathological information 5 and some common serum biomarkers, 6 such as carbohydrate antigen 125 (CA125), 7 are used to evaluate the prognosis and treatment effect of each patient. However, the prediction effect of these markers is unsatisfactory. Therefore, it is necessary to explore new biomarkers of OC to predict prognosis and treatment response.
The accumulated evidence shows that the surveillance and defence of the immune system are closely related to the occurrence and progress of various cancers, including OC.8-10 The tumor immune microenvironment (TME) in OC is a complex heterogeneous structure, including different kinds of immune cells, endothelial cells, fibroblasts cells and metabolites. Recently, people have more and more realized the key role of TME in the occurrence and development of OC and the anti-tumor treatment.11-13 Several research works have reported that tumor-infiltrating macrophages and T cells in OC were also related to the response of OC to immunotherapy and chemotherapy, and high generalized tumor inflammatory infiltrating could be an excellent marker for OC prognosis.14,15
However, recent studies have shown that the key parameter affecting cancer immunity is the phenotype of tumor-specific T cells, not just the absolute number of T cells.16-18 Studies have shown that CD8+TRM cells contribute to the local immune protection of early HGSOC tumors, and are significantly related to improving the survival rate of patients. The difference is that CD8+TEX has no such effect. 19 Even for the same cell type, different subtypes will lead to different gene expression profiles. Therefore, it seems more valuable to predict the prognosis and curative effect of patients by IRGs.
In this study, we identified differentially expressed IRGs in OC. Then, the IRGs were integrated to construct immune-related prognostic models. In addition, we verified that the risk model may be used as an effective independent prognostic indicator for OC. Immune-related risk signatures might serve as diagnostic and therapeutic biomarkers.
Material and Methods
The flowchart of this study is shown in Figure 1. Flow chart of this study.
Data Set Selection
Clinicopathological Features of Ovarian Cancer Patients.

Differential Gene Analysis and Functional Enrichment of IRGs
Differential expression genes (DEG) were identified with FDR <.05,|log2FC|>1 as the threshold. A total of 2483 immune genes were downloaded from the Import database (https://www.immport.org/). The cluster analysis package of gene ontology (GO), Kyoto Gene and Genome Encyclopedia (KEGG) were used to explore the biological functions of differential immune genes. In addition, ggplot2 and Cytascape software are performed for visualization.
Construction and Validation of the Prognostic Risk Model
Univariate Cox regression and lasso Cox analysis were performed to determine the most important prognostic genes, and then the prognostic risk model was established by multivariate Cox regression analysis. The formula for calculating the risk score was as follows
Coefi represents the coefficient and xi represents the relative expression value of each risk signature.
The predictive ability of the prognostic risk model is visualized through the Kaplan-Meier (K-M) curve and receiver operating characteristic (ROC) curve, and the accuracy is evaluated through the calibration curve. Univariate and multivariate Cox regression analyses were conducted to investigate whether risk score could be regarded as independent predictors of OS in OC.
Tumor-Infiltrating Immune Cells Fraction Calculation
CIBERSORT is a universal calculation method for quantifying cell fractions from bulk tissue gene expression profiles, which was used to estimate the relative proportion of immune cells. 21 ESTIMATE is an algorithm that infers the ratio of stromal cells and immune cells in tumor samples based on gene expression characteristics.
Estimation of the Immunoreactivity
Immunophenoscore (IPS) was evaluated by 4 types of MHC molecules (MHC), checkpoints or immunomodulators (CP), effector cells (EC) and suppressor cells (SC), and was calculated and normalized with a range of 0 to 10. Higher scores were correlated with higher immunoreactivity. IPS was downloaded from The Cancer ImmunomeAtlas.
Detection of the Diagnostic Values of Risk Indicators in OC
The diagnostic values of the risk indicators for OS were assessed using ROC curve analysis based on the SPSS 26.
Drug Susceptibility Testing
The Connectivity Map (CMap) database containing 138 chemotherapeutic drugs (https://portals.broadinstitute.org/cmap/) was used to screen out chemotherapy drugs. We used R package “pRRophetic” to explore the relationship between the semi maximum inhibitory concentration (IC50) and the model, and to evaluate drug sensitivity. 22
Patient and Public Involvement
No patient involved.
Statistical Analysis
GraphPad Prism 8.0.2 was used for paired t-test and correlation analysis. All graphs were drawn using R 3.5.3, GraphPad Prism 8.0.2 and SPSS 26.0. We took two-sided P < .05 as the threshold of statistical significance.
Results
Data Processing and Functional Annotation of Differential IRGs
In OC, a total of 5777 differential genes were identified, of which 419 genes were related to immunity (Figure 2A-B). Among the 419 differential genes, there are 156 down-regulated genes and 263 up-regulated genes. Functional enrichment analysis was performed to explore the biological functions and pathways of the above 419 IRGs in OC. Specifically, GO analysis showed that differential immune genes were involved in functions and pathways related with cytokine and growth factors (Figure 2C). KEGG pathway enrichment analysis showed that differential immune genes were enriched in the “chemokine signaling pathway,” “Th17 cell differentiation” and “antigen presentation pathway” (Figure 2D). In addition, the PPI network analyzed the interaction of these proteins in biological systems, we customized the confidence of .95 as the screening criteria to retain highly associated proteins (Figure 2E). GRB2 had the most association with other proteins, which could provide a reference for the subsequent screening of target genes (Figure S1B). Identification and functional annotation of differently expressed immune-related genes (IRGs) in OC patients. (A). Volcano plot for differently expressed genes in the tumor and normal samples. (B). Venn diagram of differentially expressed immune genes (DEIRGs). (C). GO analysis to predict the function of DEIRGs. (D). KEGG pathway enrichment analysis to predict pathways of DEIRGs. (E). PPI network of DEIRGs.
Identification of Immune-Related Genes for Prognostic Risk Model
The univariate Cox regression analysis was performed to select characteristic genes for predicting patient prognosis, and 30 differential IRGs with P < .05 were retained for further analysis (Figure 3A). In order to avoid overfitting, Lasso Cox regression was employed to further screen variables (Figure 3B-C). A total of 22 genes were screened for multivariate Cox analysis, and finally, 10 genes were identified to construct an immune prognosis model. The 10 genes were IL27RA, OBP2A, PI3, HSP90AB1, AKT2, CSPG5, CD3D, TEC, ISG20 and FGF7 (Figure 3D, the coefficients were shown in Table 2). In addition, IL27RA, OBP2A, PI3, AKT2, and FGF7 were highly expressed in the high-risk group, CSPG5, CD3D, TEC and ISG20 were low expressed in the high-risk group (all P < .001), and HSP90AB1 had a low expression trend in the high-risk group (Figure 3E, P = .0726). THE HUMAN PROTEIN ATLAS (HPA, https://www.proteinatlas.org/) is the open access resource for human proteins, we found the protein levels of 8 model genes in normal ovarian samples and OC (Figure S2A-H). The expression of biomarkers at RNA and protein level was not identical, suggesting that post-transcriptional regulation and translation modification were worthy of further study. Construction of OS risk prognostic models in OC. (A). Univariate Cox regression analysis of the risk signatures for OS. (B, C). Lasso Cox regression model for OS. (D). Multivariate Cox regression analysis of the risk signatures for OS. (E). Violin diagram for expression of 10 model genes in high and low-risk groups. Coefficients of Prognostic Risk Model Genes.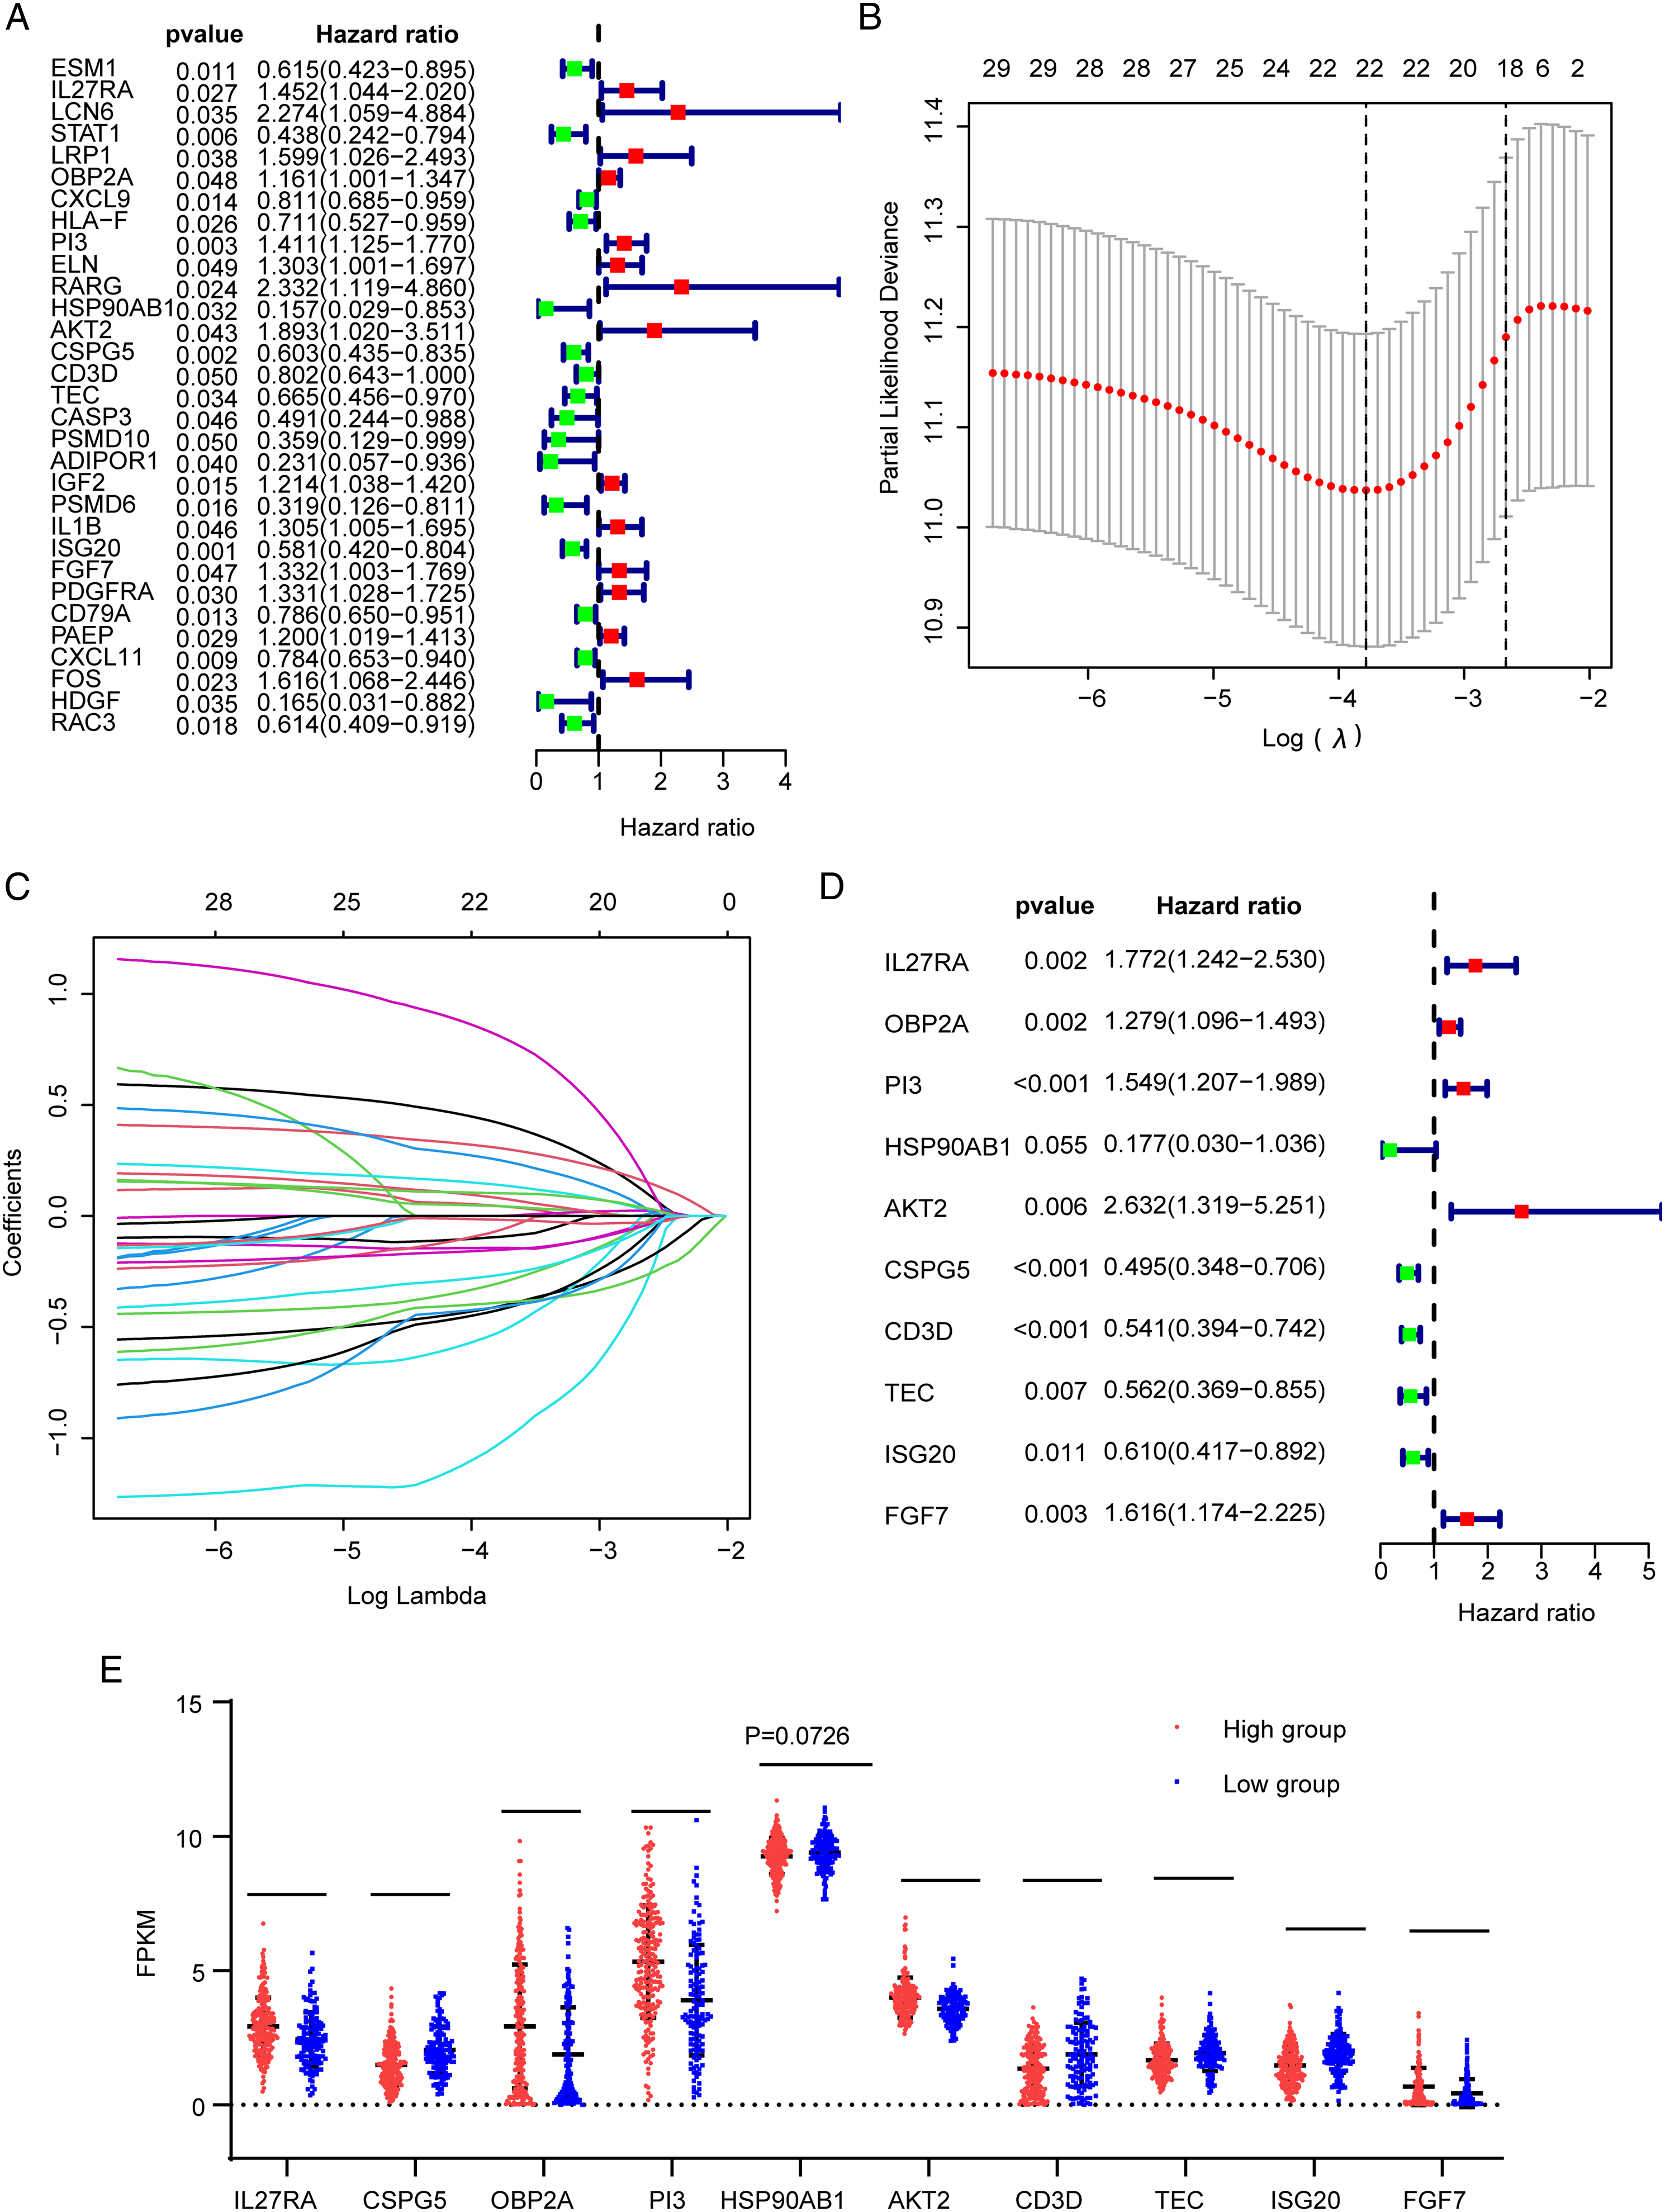

In order to evaluate the ability of the 10-mRNA model to predict OC survival, we divided the cases into high-risk groups (n = 229) and low-risk groups (n = 131) through the “maxstat” package (Figure 4A). Overall survival analysis results showed a significant difference between the 2 groups, and a lower risk score predicted a better survival prognosis (Figure 4B, P < .01). Data of OC in the ICGC database was verified. Similarly, samples were divided into high-risk groups and low-risk groups (Figure 4D), and the results were consistent with the above findings, with P < .01 (Figure 4E). Besides, ROC curves of 1, 3, and 5 years were drawn to estimate the predictive ability of the risk model in OC, and the AUC values for 1, 3, and 5 years of OS were .632, .702, and .760, respectively (Figure 4C). In the validation set of OC, the AUC were .615 (Figure 4F). Characteristics of prognostic gene signatures. (A). Case distribution and grouping based on risk score in the test set. (B). K-M curves for OS in the high- and low-risk groups in the test set. (C). ROC curve of risk score at 1, 3, 5 years for OS in the test set. (D). Case distribution and grouping based on the data of OC from ICGC database. (E). K-M curves for OS in the high- and low-risk groups based on the data of OC from ICGC database. (F). ROC curve of risk score at 1 years for OS based on the data of OC from ICGC database.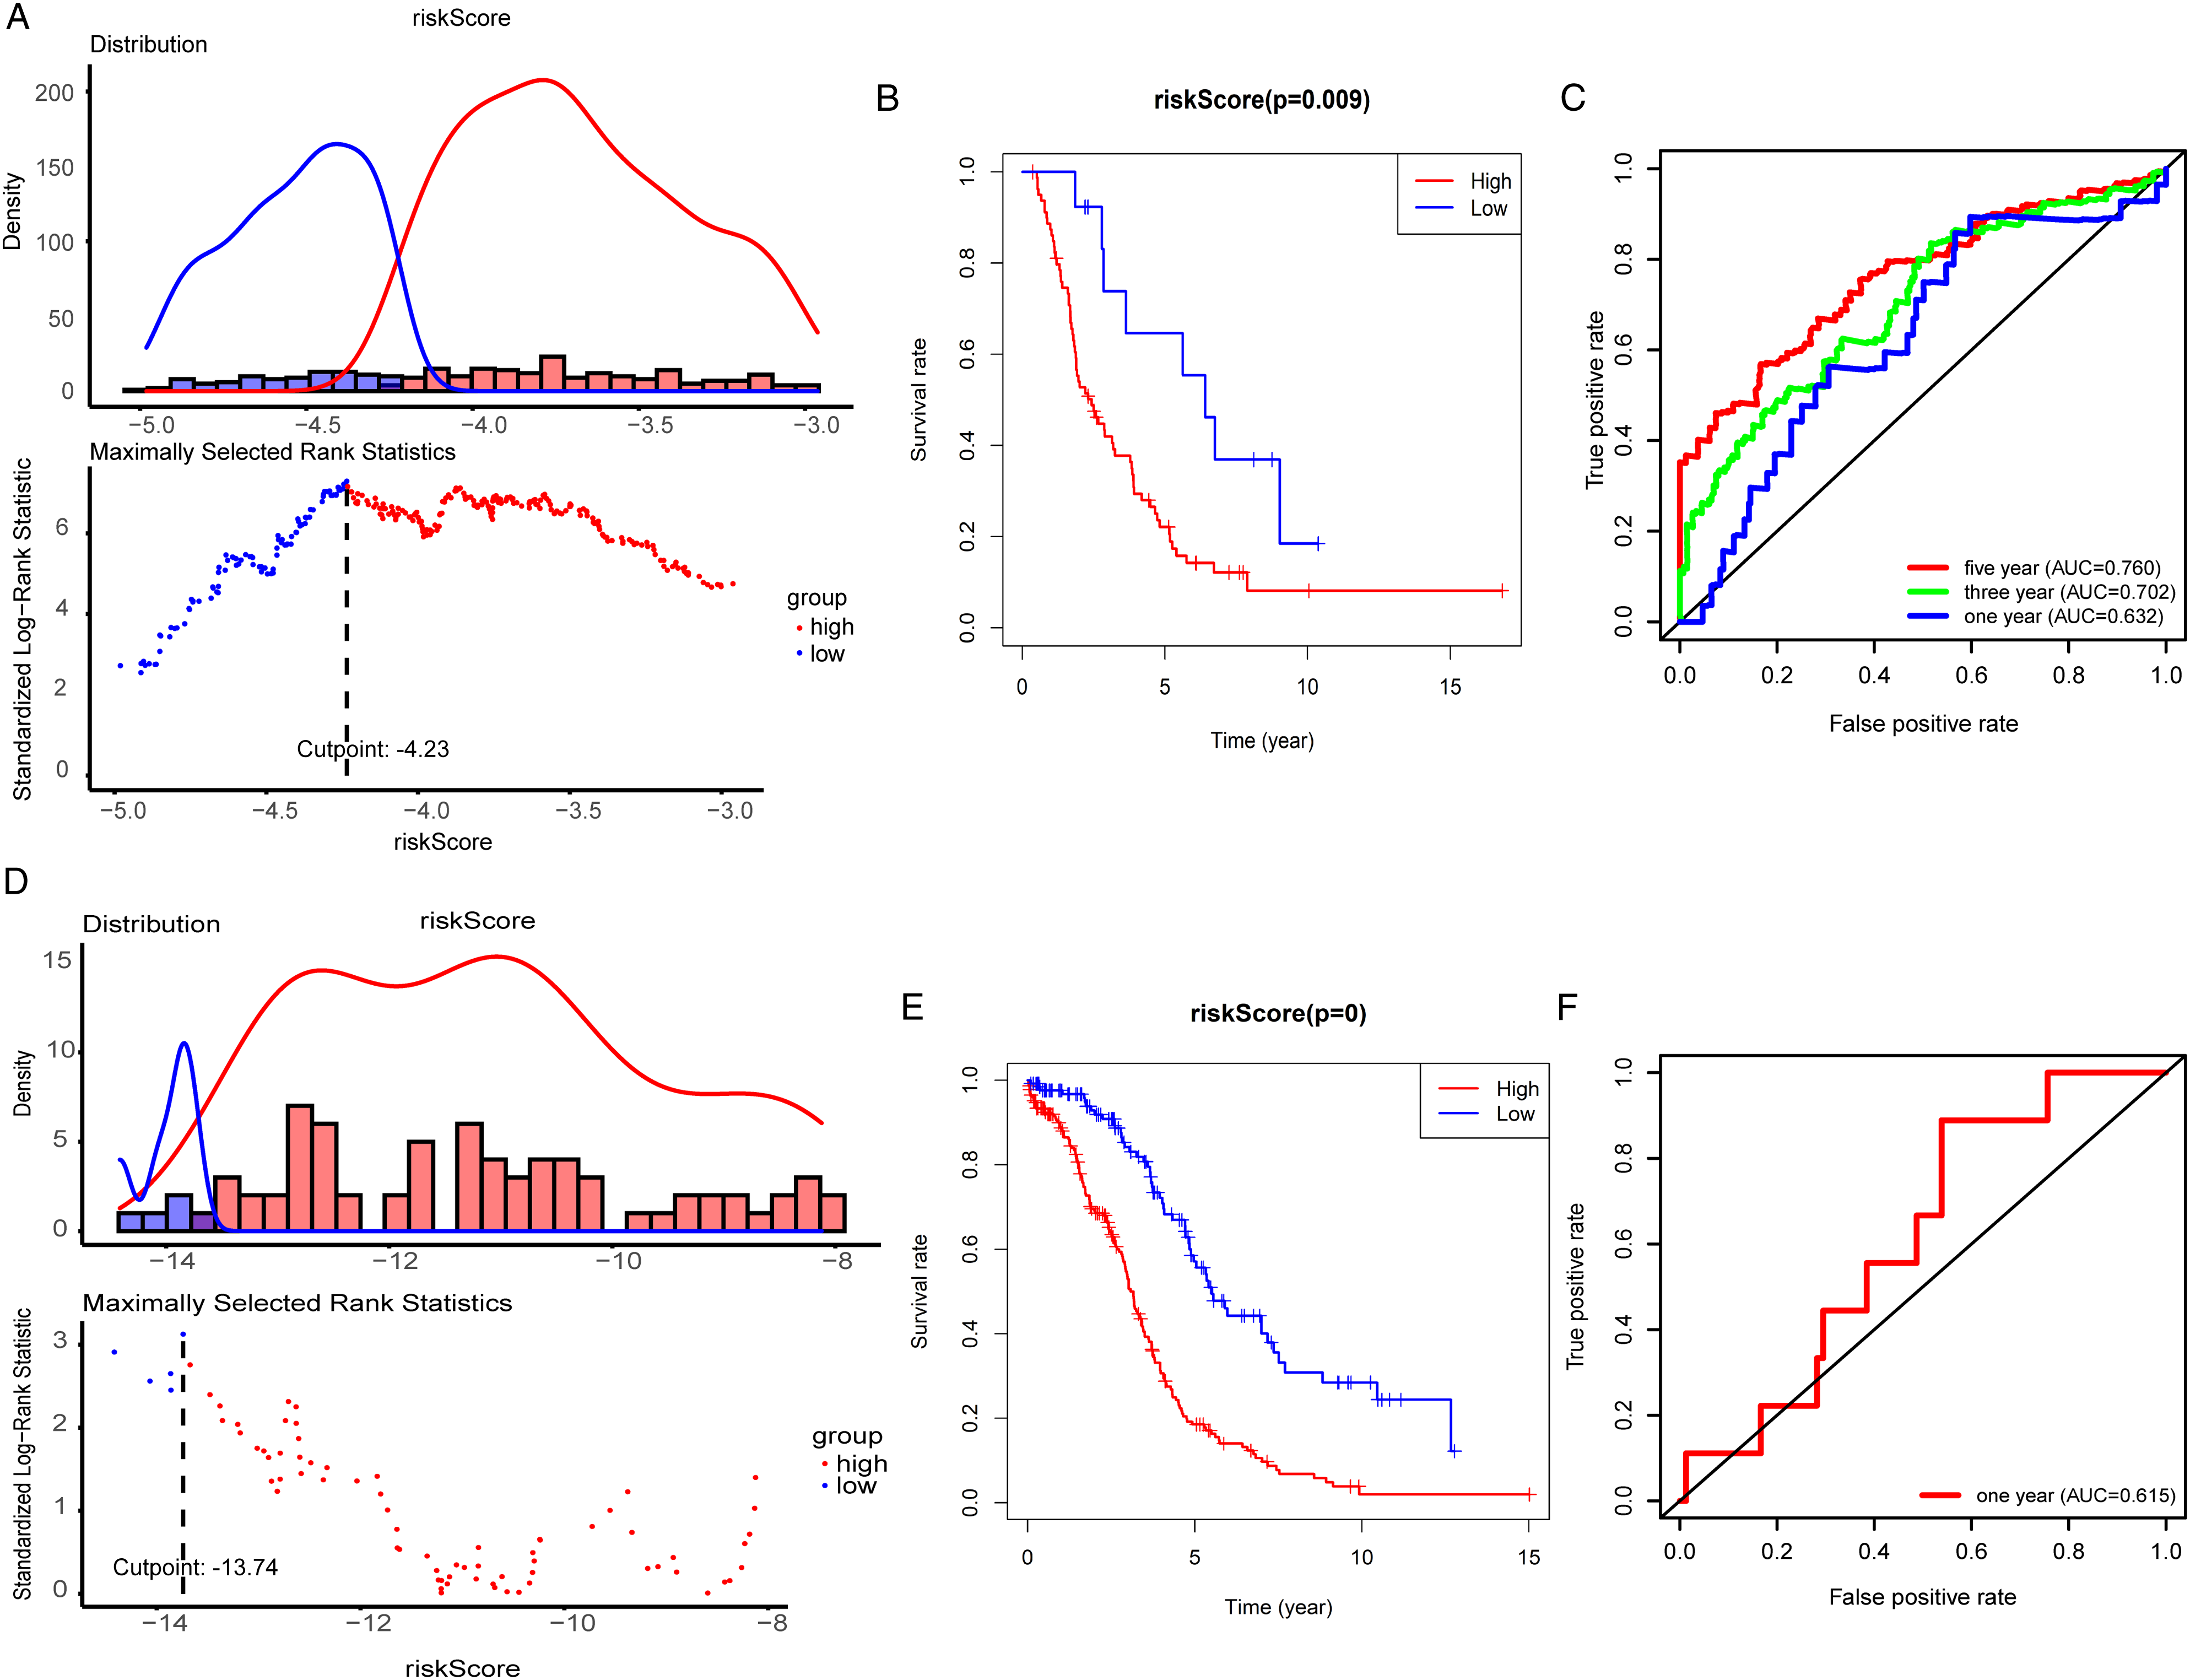
Validation of the Immune-Related Risk Model
We further analyzed whether the risk score could be used as an independent predictor of OC patients. Univariate Cox regression analysis showed that age (P < .001, HR = 1.024), stage (P = .040, HR = 1.371) and risk score (P < .001, HR = 2.736) were associated with OS in OC patients (Figure 5A). Furthermore, we used the above clinical parameters and risk scores to perform a multivariate Cox regression analysis. The results showed that age (P < .001, HR = 1.025), grade (P = .036, HR = 1.579) and prognostic risk model (P < .001, HR = 2.759) could be used as independent prognostic indicators to predict the patient’s OS (Figure 5B). Next, we developed a nomogram using risk score, pathological staging, histological grade, and age to predict 1-year, 3-year, and 5-year overall survival rates (Figure 5C). The consistency index (C-index) of the nomogram was .706, which increased the predictive ability of OS compared with the 10-mRNA classifier (C-index = .675). The calibration curves of 1-year, 3-year, and 5-year overall survival indicated that OS corresponded to the actual outcome closely (Figure 5D-F). Independent prognostic analysis and nomogram diagram. (A). Univariate independent prognostic analysis. (B). Multivariate independent prognostic analysis. (C). A nomogram of the OC cohort was used to predict the OS. (D-F). Calibration curve of nomogram diagram.
Pathway Enrichment Analysis of Different Groups
In order to study the potential molecular mechanism of the 10 mRNA classifier in OC, we conducted gene set enrichment analysis (GSEA) for high-risk and low-risk groups. The results showed that angiogenesis and translation regulation were activated in the high-risk group, which showed that the high-risk group was in an active state of cell proliferation. In addition, MAPK pathway and Ras pathway are activated, which are related to OC progression, indicating that the high-risk group has stronger metastatic ability (Figure S3A-3B). Next, we selected the top 500 genes related to risk-core characteristics for enrichment analysis and found that these genes were enriched in some important immune-inflammatory related pathways, including transendothelial migration of leukocytes pathway and TNF signaling pathway (Figure S3C).
Correlation Between 10-mRNA Characteristics and Immune Cell Infiltration
Subsequently, the “ESTIMATE” algorithm was performed to calculate the stromal score, immune score, and estimate score for each OC sample. Compared with the low-risk group, the high-risk group had a higher stromal score (−343.5 vs −532.2, P = .0146) and a lower immune score (260.9 vs 432.5, P = .0564) (Figure 6A-B). Furthermore, correlations between 22 kinds of tumor-infiltrating immune cells’ abundance were discussed in the 2 groups. The results exhibited higher infiltration of plasma cells, CD8+ T cells, T follicular helper cells, M1 macrophage and resting mast cells in the low-risk group, while the high-risk group was presented with higher naive B cells, CD4+ memory resting and M0 macrophage infiltration (Figure 6C). In addition, we found that higher plasma cells, T follicular helper cells, M0 macrophage, M1 macrophage and resting mast cells infiltration tended to have a better prognosis, while low CD4+ memory resting immune cell infiltration suggested good prognosis (Figure 6D-G). As shown in Figure 6H-J, clinicopathological features including tumor grade (P = .6259) and pathological stage (P = .1298) showed no significant difference between the low- and high-risk groups, but patients with high pathological stage tend to have a higher risk score. These findings demonstrated that the specific changes of tumor-infiltrating immune cells might be associated with the OS of OC patients. Correlation between 10-mRNA characteristics and immune cell infiltration. (A, B). Stromal scores and Immune scores were calculate with “ESTIMATE” algorithm in high- and low-risk group. (C). Tumor-infiltrating immune cells’ abundance were discussed in the 2 groups. (D-G). Relation between different tumor-infiltrating immune cells status and survival. (H-J). Relation between clinicopathological features stromal score.
The Potential of 10-mRNA Labeling as an Indicator of Immunotherapy Response
To explore the immunogenicity of patients, the expression of immune genes (PD1, PDL1, and CTLA4) in different groups were analyzed. As shown in Figure 7A-C, the low-risk group exhibited higher expression of PD1 (P < .0001), PDL1 (P = .0031) and CTLA4 (P = .0001), suggesting higher immunogenicity of the low-risk group. We further assessed the relation between IPS scores and risk groups. The scores of IPS, IPS + PD1, IPS + CTLA4, and IPS + PD1 + CTLA4 increased significantly in the low-risk group (Figure 7D-G). What’s more, we performed evaluated the correlation between mRNA characteristics and PD1, PDL1, and CTLA4. The results indicated a significant negative correlation between risk score and the expression of PD1 (r = −.2461, P = .0009), PDL (r = −.2775, P = .0002) and CTLA4 (r = −.2534, P = .0006) in the high-risk group, indicating that OC patients in the high-risk group were less likely would benefit from immunotherapy (Figure 7H-J). Estimation of the Immunoreactivity. (A-C). The expression PD1, PDL1 and CTLA4 in the high- and low-risk group. (D-G). The scores of IPS, IPS + PD1, IPS + CTLA4, and IPS + PD1+CTLA4 in the high- and low-risk groups. (H-J). The relation of risk score and the expression of PD1, PDL1 and CTLA4 in high-risk group.
Diagnostic Value of 10 Prognostic Model Genes
We utilized SPSS 26 through ROC curve analysis, and 10 prognostic model genes were identified to distinguish 379 OC patients and 88 normal ovarian samples. The AUC for IL27RA, OBP2A, PI3, AKT2, ISG20, and HSP90AB1 were .979, .928, .979, .901, .900 and .992 respectively (95% CI = .968-.991, .903-.953, .955-1.000, .874-.928, .868-.932 and .987-.998) (Figure 8A-F). Other prognostic markers that did not show diagnostic value in this study were shown in Figure S4A-D. Discrimination of diagnostic value in OC. (A-F). AUC of risk signature with diagnostic value (IL27RA, OBP2A, PI3, AKT2, ISG20, HSP90AB1).
Drug Susceptibility Testing to Screen Chemotherapeutic Drugs
Drug susceptibility test results identified twelve chemotherapeutics that were screened by estimating IC50 in the 2 risk groups. High-risk patients showed lower drug sensitivity to some commonly used chemotherapy for OC, including ABT.888 (P = .015; Figure 9A), Cisplatin (P = .0045; Figure 9B), Etoposide (P = .0028; Figure 9C), Methotrexate (P = .0011; Figure 9D). In addition, MK.2206 (P = .0032; Figure 9E) and Lenalidomide (P = .038; Figure 9F) were also included. On the contrary, high-risk OC patients showed marked sensitivity to 6 targeted therapeutic drugs, including Erlotinib (P = .011; Figure 9G), Imatinib (P < .001; Figure 9H), Nilotinib (P = .032; Figure 9I), BMS.536924 (P < .001; Figure 9J), PHA.665752 (P < .001; Figure 9K), AZD.0530 (P < .001; Figure 9L). Drug susceptibility testing results. (A-F). 6 lower sensitive chemotherapeutics were screened by estimating IC50 in high-risk groups, the order is ABT.888, Cisplatin, Etoposide, Methotrexate, MK.2206, Lenalidomide. (G-L). Six higher sensitive chemotherapeutics in high-risk groups, the order is Erlotinib, Imatinib, Nilotinib, BMS.536924, PHA.665752, AZD.0530.
Discussion
OC has the characteristics of concealed onset, early metastasis and high recurrence rate. Studies have shown that as an important component of tumor microenvironment, the number and subtype of immune cells affect the progression, metastasis and treatment of OC.23,24 At present, studies have found that mature plasma cells secreting IgG have anti-tumor activity through single-cell sequencing, which is related to the improvement of OC survival rate. 25 In addition, the high infiltration of CD8+TOX+ and CD4+GNLY+T cells may be a good indicator of the survival rate of OC patients. 26 Immunotherapy has become the first-line treatment for many kinds of cancer, however, the response rate of most patients is not high.27,28 There is an urgent need to develop new biomarkers to predict the efficacy of immunotherapy. Based on this, researchers were committed to establishing immune-related models to predict the survival of patients. However, the accuracy of the existing model for 5-year survival prediction was less than 70%, or the model included more than 20 genes, which greatly increased the detection cost of patients.29,30 Therefore, it’s necessary to develop simpler and more robust models to predict prognosis and even drug sensitivity.
In this study, we screened the differentially expressed IRGs and constructed a prognostic risk model including ten genes (IL27RA, OBP2A, PI3, HSP90AB1, AKT2, CSPG5, CD3D, TEC, ISG20 and FGF7) through univariate, LASSO and multivariate Cox regression analysis. Among them, IL27RA, HSP90AB1, AKT2 and FGF7 have been reported in OC development through multiple molecular pathways. Interleukin receptors IL27RA were involved in the regulation of the microenvironment of OC. 31 HSP90AB1, an ATP-dependent molecular chaperone protein, could affect the maturation, stability, and activation of several diverse client proteins, and then promote persistent activation of various OC-related cellular kinases and transcription factors. 32 AKT2 might promote OC invasion through increased expression of β1 integrins and activation of PI3K-dependent pathway. 33 FGF7 modulated growth and platinum sensitivity in OC by decreasing cisplatin 50% inhibiting concentration (IC50). 34 In addition to these 4 mRNAs, our study also screened out 6 less studied mRNAs that were also closely related to OC prognosis, including OBP2A, PI3, CSPG5, CD3D, TEC and ISG20. The underlying mechanisms of abnormal mRNAs expression of these genes still need to be confirmed by further studies. At the same time, we observed that the expression level of 6 genes (IL27RA, OBP2A, PI3, AKT2, ISG20, and HSP90AB1) in OC may accurately distinguish normal ovarian tissue and OC tissue. Therefore, these 6 genes might be used as diagnostic biomarkers for early diagnosis of OC. The risk prediction model showed a good ability to predict the prognosis. The higher the risk score, the worse the prognosis. ICGC cohort verified the accuracy of the model. After controlling the confounding parameters, the results showed that the risk score was an independent predictor of the survival of OC patients, and the ROC verified its robustness in predicting 5-year OS (AUC = .760). These results provided a reliable basis for the practical application of OC. In addition, a nomograph had been created to facilitate clinical application.
GSEA results showed that MAPK pathway and Ras pathway were activated in the high-risk group, while the low-risk group was associated with immune activation and antigen presentation. Previous studies have shown that MAPK pathway and Ras pathway are related to tumor proliferation, migration and cisplatin sensitivity.35-37 TME plays an important role in tumor immunity. 38 TILs, a component of the TME, have been shown to correlate with the overall survival of OC. In our study, the composition of tumor-infiltrating immune cells was estimated by ESTIMATE and CIBERSORT for each sample. Abundance of plasma cells, CD8+ T cells, T follicular helper cells, M1 macrophages and resting mast cells were found in the low-risk group and was correlated with a favorable prognosis, which was consistent with previous investigations.
In view of the importance of immunotherapy in cancer treatment, we analyzed the relationship between the expression of risk groups and immune checkpoint genes (ICGs) and IPS. On this basis, we found that the low risk may benefit from anti-PD1 and anti-CTLA-4 treatment, which may be caused by the high expression level of ICGs, strong immunogenicity and TME in the state of immune activation. However, high-risk patients seem to be insensitive to immunotherapy. For such patients, we try to find better chemotherapy strategies. Chemotherapy is 1 of the main treatment methods for OC. Most OC patients respond to the initial platinum-based chemotherapy. However, in the follow-up treatment, patients often have disease recurrence and become resistant to platinum-based chemotherapy. 39 In this study, we identified the potentially sensitive drugs of different groups of patients. The results showed that high-risk patients were more sensitive to targeted drugs (Erlotinib, Imatinib, and Nilotinib), suggesting that these drugs might help reduce drug resistance and improve clinical results. The above results may provide a new direction for OC patients in clinical practice and provide reasonable treatment strategies for accurate and individualized treatment of OC patients.
This study has some limitations. First of all, this study is a retrospective study, which still need to collect data from multi-center clinical studies for verification. Secondly, due to the lack of immunotherapy and chemotherapy data of OC patients, it is impossible to verify the prediction of prognosis risk model on drug sensitivity. In addition, it is necessary to confirm the relationship between risk score and TME by supplementing in vivo and in vitro experiments.
Conclusion
In conclusion, this study constructed a prognostic risk model based on IRGs, which might help effectively distinguish the clinical prognosis and immune infiltration of OC patients. In addition, this study suggested that low-risk patients may be more sensitive to immunotherapy, while high-risk patients might have better effects of chemotherapy. This provided new insights for personalized treatments of OC patients.
Supplemental Material
Supplemental Material - Immune-Related Genes’ Prognostic, Therapeutic and Diagnostic Value in Ovarian Cancer Immune-Related Gene Biomarker in Ovarian Cancer
Supplemental Material for Immune-Related Genes’ Prognostic, Therapeutic and Diagnostic Value in Ovarian Cancer Immune-Related Gene Biomarker in Ovarian Cancer by Bo Ding, Wenjing Yan, Siyuan Shen, Dan Meng, Xue Chen, Shizhi Wang, and Yang Shen in Cancer Control
Footnotes
Author Contributions
BD and WY conceived and designed the study. SW and YS was responsible for materials. BD and WY drafted the article. WY, SY, DM, SW and YS revised the article critically. All authors had final approval of the submitted versions.
Declaration of Conflicting Interests
The author(s) declared no potential conflicts of interest with respect to the research, authorship, and/or publication of this article.
Funding
The author(s) disclosed receipt of the following financial support for the research, authorship, and/or publication of this article: This work was supported by the grants from research Foundation of Jiangsu Provincial Commission of Health (grant no. M2022016), and Postgraduate Research & Practice Innovation Program of Jiangsu Province (KYCX22_0301).
Data Availability
The datasets analysed during the current study are available from the corresponding author Yang Shen (
Supplemental Material
Supplemental material for this article is available online.
References
Supplementary Material
Please find the following supplemental material available below.
For Open Access articles published under a Creative Commons License, all supplemental material carries the same license as the article it is associated with.
For non-Open Access articles published, all supplemental material carries a non-exclusive license, and permission requests for re-use of supplemental material or any part of supplemental material shall be sent directly to the copyright owner as specified in the copyright notice associated with the article.