
Abstract
Introduction
Gene copy number variations have theranostic impact and require reliable methods for their identification. We aimed to evaluate the reliability of combined next-generation sequencing (NGS) and digital droplet PCR (ddPCR) method for gene amplification evaluation.
Methods
We conducted a retrospective multicentric observational study. MET/ERBB2 amplifications were assessed in patients with lung or colorectal carcinoma (cohort A), from 2016 to 2020, by fluorescence in situ hybridization (FISH)/immunohistochemistry (IHC), NGS and ddPCR. NGS-based script and ddPCR were then used to detect amplifications of 7 additional oncogenes (EGFR, KRAS, BRAF, FGFR1, FGFR2, FGFR3, PIK3CA) in a cohort of patients (cohort B).
Results
55 patients (9 control, 25 ERBB2-amplified and 21 MET-amplified) out of 3779 patients tested were included in cohort A. Correlation coefficient between NGS-based script and FISH/IHC results were .88 for MET (P < .001) and .89 (P < .001) for ERBB2. Using a threshold ratio of 1.56 with the NGS-based script, the sensitivity was 100% for both genes and the specificity 69% for MET and 90% for ERBB2, respectively. With an alternative 1.76 threshold, sensitivity was 94% for MET and 96% for ERBB2, while specificity was 85% for MET and 90% for ERBB2. Correlation coefficient between FISH and ddPCR ratio was .90 for MET and .88 for ERBB2. In both cohorts, NGS-based script and ddPCR results were significantly correlated regarding all genes (P < .001).
Conclusion
Combined NGS-based script and ddPCR method is reliable and easily feasible for the detection of gene amplifications, providing useful data for guided therapy in cancer.
Keywords
Introduction
Aberrations in gene copy number, comprising DNA amplifications and deletions, represent important therapeutic targets or are associated with drug resistance in many cancers.1-3 The amplification of the human epidermal growth factor receptor 2 (ERBB2) oncogene, resulting in ERBB2 overexpression was described 2 decades ago 4 and led to the development of several efficient ERBB2-targeting agents for metastatic or localized ERBB2-positive breast cancer. 5 ERBB2 overexpression or amplification also accounts for about 5% of metastatic KRAS wild-type colorectal cancers and for 1.9%-14.3% of lung adenocarcinomas, mostly in epidermal growth factor receptor (EGFR) inhibitors-resistant cases, with promising targeted therapy in development.6,7 More recently, amplifications have been studied in other oncogenes. MET amplification has been linked to resistance to targeted therapy in non-small cell lung cancers harboring tyrosine kinase inhibitors-sensitive EGFR mutations and may respond to anti-MET therapeutics. 8 PIK3CA gene amplification was found in 8.7% to 38% of cancers including non-small cell lung cancer, breast cancer, and colorectal cancer and may represent a promising therapeutic target.9-11 In addition, KRAS mutations have been associated with resistance to anti-EGFR drugs in colorectal and lung cancer,12,13 but the importance of KRAS and BRAF amplifications is still unclear.14,15 BRAF amplification could be an acquired resistance mechanism in BRAFV600E colorectal and lung cancers patients treated with a combination of MAPK pathway inhibitors. 16 Among other promising new targetable genes are members of the FGFR family like FGFR1, which is amplified in 6% of lung and colorectal cancers. 17
Thus, the comprehensive analysis of copy number variations (CNVs) has become an important component in establishing the therapeutic strategy. To this end, in situ methods such as fluorescent or chromogenic in situ hybridization (FISH or CISH) or immunohistochemistry (IHC) remain gold standards for CNVs evaluation: ERBB2 status in breast cancer is currently routinely assessed by immunohistochemistry (IHC) or FISH in equivocal cases. 18 A similar approach is recommended in colorectal cancer 19 or in gastric cancer. 20 However, these methods are subject to inter- and intra-observers variability and are time-consuming, which may represent an issue for assessing CNVs within a short turnaround time. Moreover, these methods are validated only for a small number of genes in selected organs. All these concerns have prompted the need of reliable methods for the identification of gene amplifications, considering gold standard FISH or IHC methods are not routinely feasible for many genes.
Recently, methods for CNV detection from Formalin-Fixed Paraffin-Embedded (FFPE) samples using next generation sequencing (NGS) or digital droplet PCR (ddPCR) have been described for the detection of CNVs in many types of cancer.21,22 However, although advanced technologies and algorithms have been developed to improve the sensitivity and accuracy of FFPE DNA variant analysis with NGS, 23 CNV calling from FFPE DNA-based tests remains challenging and often needs to be confirmed by more sensitive methods such as ddPCR. ddPCR is a technology allowing the absolute quantification of a target nucleic acid sequence. 24 It represents a good alternative to other molecular biology techniques for the precise quantification of the copy number of a target gene, and has been previously used to detect ERBB2 amplifications in breast or gastric cancer, and MET amplifications in non-small cell lung cancer (NSCLC).25,26
The main goal of our study was to set up a diagnostic strategy for gene amplification detection using a method combining an NGS-based script and ddPCR. To this end, we first assessed MET and ERBB2 amplification by an NGS-based script and ddPCR in a cohort of colorectal and lung adenocarcinomas, in comparison with pathology-based reference methods (FISH and IHC). Then, we evaluated a method using this script and ddPCR in a second cohort, with genes for which no standardized pathology-based methods have been developed.
Materiel and Methods
Patient Cohorts
We retrospectively collected clinical, pathological and molecular data of all patients diagnosed with lung or colorectal carcinoma and molecular analysis performed at Bichat-Claude Bernard or Cochin University Hospitals between 2016 and 2020.
The following data were collected: sex, age, histological diagnosis, percentage of tumoral cells in the FFPE samples, DNA concentration after DNA extraction. Patients were selected according to the results of molecular analysis and divided in 2 cohorts: In the ERBB2/MET cohort (Cohort A), FFPE patient samples with an ERBB2 or MET amplification suspected by routinely performed NGS were obtained from the department of genetics. FISH/IHC and ddPCR were then performed for ERBB2 or MET. FISH and ddPCR for both ERBB2 and MET were performed on these samples. In Cohort B, FFPE samples with an EGFR, KRAS, BRAF, FGFR1, FGFR2, FGFR3 or PIK3CA amplification suspected by routinely performed NGS were obtained from the department of genetics, and ddPCR was performed for the gene of interest. Nine patients with non-amplified samples were also included as controls based on their negative CNV status in NGS. FISH for both ERBB2 and MET were performed on these samples to confirm the absence of amplification. ddPCR was performed for all the 9 genes of interest to define the negative threshold of CN. All patient details have been de-identified. This study has been conducted according to local standards and laws and complies with the Declaration of Helsinki. The reporting of this study conforms to STROBE guidelines. 27
DNA Extraction
DNA from the samples was extracted using a Maxwell® 16 FFPE Plus LEV DNA Purification Kit (Promega, Madison, WI, USA) according to the manufacturer’s instructions and was quantified with a Qubit 2.0 fluorometer (Thermo Fisher Scientific, Waltham, MA, USA).
NGS
Libraries were prepared with the Oncomine solid tumor DNA (OST) panel (Thermo Fisher Scientific, 22 genes and 92 amplicons) with the complementary panel OST+ (for a total of 25 genes and 118 amplicons, including 3 for ERBB2 and 12 for MET). The libraries were sequenced on a S5XL system (Thermo Fisher Scientific), as previously described. 28 Data were analyzed with the Ion Reporter Software (version 5.10) and the Torrent Suite (version 5.10, Thermo Fisher Scientific).
Gene amplifications were identified using an in-house designed script to normalize the number of reads for each amplicon, as described in the supplemental appendix. A particular gene was suspected of being amplified if the mean of the ratios for all its amplicons was superior to a pre-defined cut-off. The sensitivity and specificity of 2 cut-offs, 1.56 and 1.76, were investigated.
MET/ERBB2 amplification Evaluation by FISH or IHC
MET amplification was assessed using the MET/CEP7 dual color probe set from Zytovision (Zytovision, Bremerhaven, Germany), according to the manufacturer’s instructions. Currently, there is no consensus on the number of MET copies/cell to define a gene amplification. Here, MET amplification was defined (1) when the mean MET copy number per cell was ≥ 6 and/or (2) when the MET/CEP7 ratio was > 2 according to previous studies.29-33
ERBB2 amplification was assessed using the ERBB2/CEP17 dual color probe set from Zytolight FISH-Tissue Implementation Kit (Zytovision, Bremerhaven, Germany) according to the manufacturer’s instructions and IHC. ERBB2 IHC analysis was performed on fresh 3-μm sections from FFPE blocks on Leica BOND-MAX (Leica Biosystems, Buffalo Grove, IL) automated staining system. Briefly, slides were deparaffinized and subjected to antigen retrieval in a pH = 6 buffer for 30 min. ERBB2 primary antibody (A0485, Dako; 1:600 dilution) was incubated for 20 min. Revelation was performed with Leica BOND-MAX detection kits.
ERBB2 amplifications were confirmed by IHC or FISH as recommended by the American Society of Clinical Oncology. 18 IHC score 3+ (positive) was defined as complete and uniform strong membrane staining in more than 30% of invasive tumor cells. With FISH, an ERBB2/CEP17 ratio ≥2 or an ERBB2/CEP17 ratio <2 with an ERBB2 copy number ≥6 signals/cell was considered ERBB2 positive.
ddPCR
The 22 μl of the PCR reaction mix were prepared with 11 μl of 2XddPCR Supermix - no dUTP (Bio-Rad, Hercules, CA, USA), 0.9 µl of primer for the target gene (eg ERBB2, MET, etc.) labeled with FAM fluorescent probe, 0.9 µl of primer for 1 of the 3 housekeeping genes labeled with HEX fluorescent probe, 4.2 µl of nuclease-free water and 5 µl of sample DNA. DNA samples were normalized at 2 ng/µl. Reaction mix were pipetted into a 96-wells plate hold at 4°C and droplets were generated with a Bio-Rad QX200 AutoDG droplet generator, then transferred to another 96-wells plate. The plate was sealed with a Bio-Rad PX1 PCR Plate Sealer before PCR amplification on an Applied Biosystems MiniAmp Thermal Cycler (Thermo Fisher Scientific, Waltham, MA, USA), with the following settings: 95°C for 10 min, 40 cycles at 94°C for 30s and 60°C for 60s, 98°C for 10 min, then hold at 4°C. Droplets were read on a Bio-Rad QX200 droplet reader, with the Bio-Rad QuantaSoft software, version 1.7.4.0917. Using a modeling based on a Poisson distribution, the software estimates the concentration of the target and housekeeping genes in units of copies per microliter of amplified mix. An estimate of the target gene copy number is then determined by multiplying by 2 the ratio between the concentrations of the target and the housekeeping gene. Reactions were performed in duplicates for every target and housekeeping genes. A positive and a negative control were used in each plate.
Housekeeping genes used were selected in order to have a housekeeping gene on the same chromosome (housekeeping gene 1) and 2 additional housekeeping genes (housekeeping gene 2 and 3) on 2 different chromosomes for each target gene, allowing polysomy evaluation (a gene/housekeeping gene on same chromosome CNV ratio <4 AND other CNV ratio ≥4 was considered as suspect of polysomy). A list of targeted genes with their respective housekeeping genes and information for primers and probes for all ddPCR is provided in supplemental Table 1 and Table 2. Housekeeping genes were chosen using cBioportal to select genes with the lowest risk of having CNV in colorectal or lung carcinoma.34,35
For MET and ERBB2 genes, the copy number was determined by calculating the mean of the copy number estimated with each housekeeping gene. Samples with a gene copy number ≥6 in ddPCR were considered as “amplified”, those with a gene copy number <4 as “not amplified”. Those with a gene copy number ≥4 and <6 were classified as “equivocal” and required alternative gold standard method (FISH or IHC) for further classification. For gene with no alternative gold standard method (FISH or IHC) routinely available, we did not use the “equivocal” category and used a single ddPCR amplification threshold of ≥6 to define “amplified” vs “not amplified” samples. This latter threshold was set up to increase the number of patients that might best benefit from therapeutic changes (high amplification) while avoiding false positive as no “gold-standard” method is routinely available.
ddPCR results were then compared to those obtained by NGS and IHC/FISH (when available) as shown in the supplemental appendix.
Statistical Analysis
NGS based-script mean ratios and ddPCR mean ratios were compared to FISH ratios by linear regression and Pearson correlation for continuous variable and by Spearman correlation for the monotonous correlation between discrete variable. For this analysis, samples were excluded if the FISH ratio was not available (amplification status determined by IHC) or not assessable (high number of clustered signals for the target or reference region in FISH). The performances of the NGS script and of ddPCR to detect amplification were estimated using FISH/IHC as gold standard methods. For the NGS-based script results, several threshold ratios were evaluated. Those threshold ratios allowed us to set up a diagnostic strategy to select cases with potential gene amplification to confirm with ddPCR. The first threshold was chosen in order to select all the positive cases and avoid false-negative cases. The second threshold was defined to better select negative cases and limit false-positive cases. Negative threshold was defined according to the mean +/− 2 standard deviation of CN results from the control cohort (supplemental Table 3). We did not performed power calculation for estimation of sample size selected for the study.
All statistical analyses were performed with R (version 4.0.1).
Results
Script-Based Results Compared to FISH/IHC in Cohort A
Among 3779 total routine NGS cases (2016 lung cancer and 1763 colorectal cancer) tested for gene amplification, 55 patients were included in cohort A: 9 as non-amplified controls, 25 for ERBB2 and 21 for MET. Characteristics of cohort A are described in supplemental Table 4.
Ratios obtained with the NGS based-script were compared to the MET/chromosome 7 or ERBB2/chromosome 17 ratios determined by FISH using linear regression (Figure 1). A high correlation was found for both target genes, with a correlation coefficient of .88 for MET (P < .001) and of .89 (P < .001) for ERBB2. Linear regression between the ratios obtained with the NGS-based script and the FISH ratios for the target gene (when available). A: MET, B: ERBB2.
All control patients had a script ratio below the 1.56 cut-off, for both MET and ERBB2 (Figure 2). Importantly, no patients with a script value <1.56 had a MET or ERBB2 amplification. Among the 21 patients with a script ratio ≥1.56 for MET, 17 (81%) had a confirmed amplification in FISH; for ERBB2, 24 of the 25 patients (96%) with a script value ≥1.56 had a confirmed amplification in IHC/FISH. NGS-based script average ratios for each individual patient, with the MET and ERBB2 amplification status according to FISH/IHC displayed. A: MET, B: ERBB2.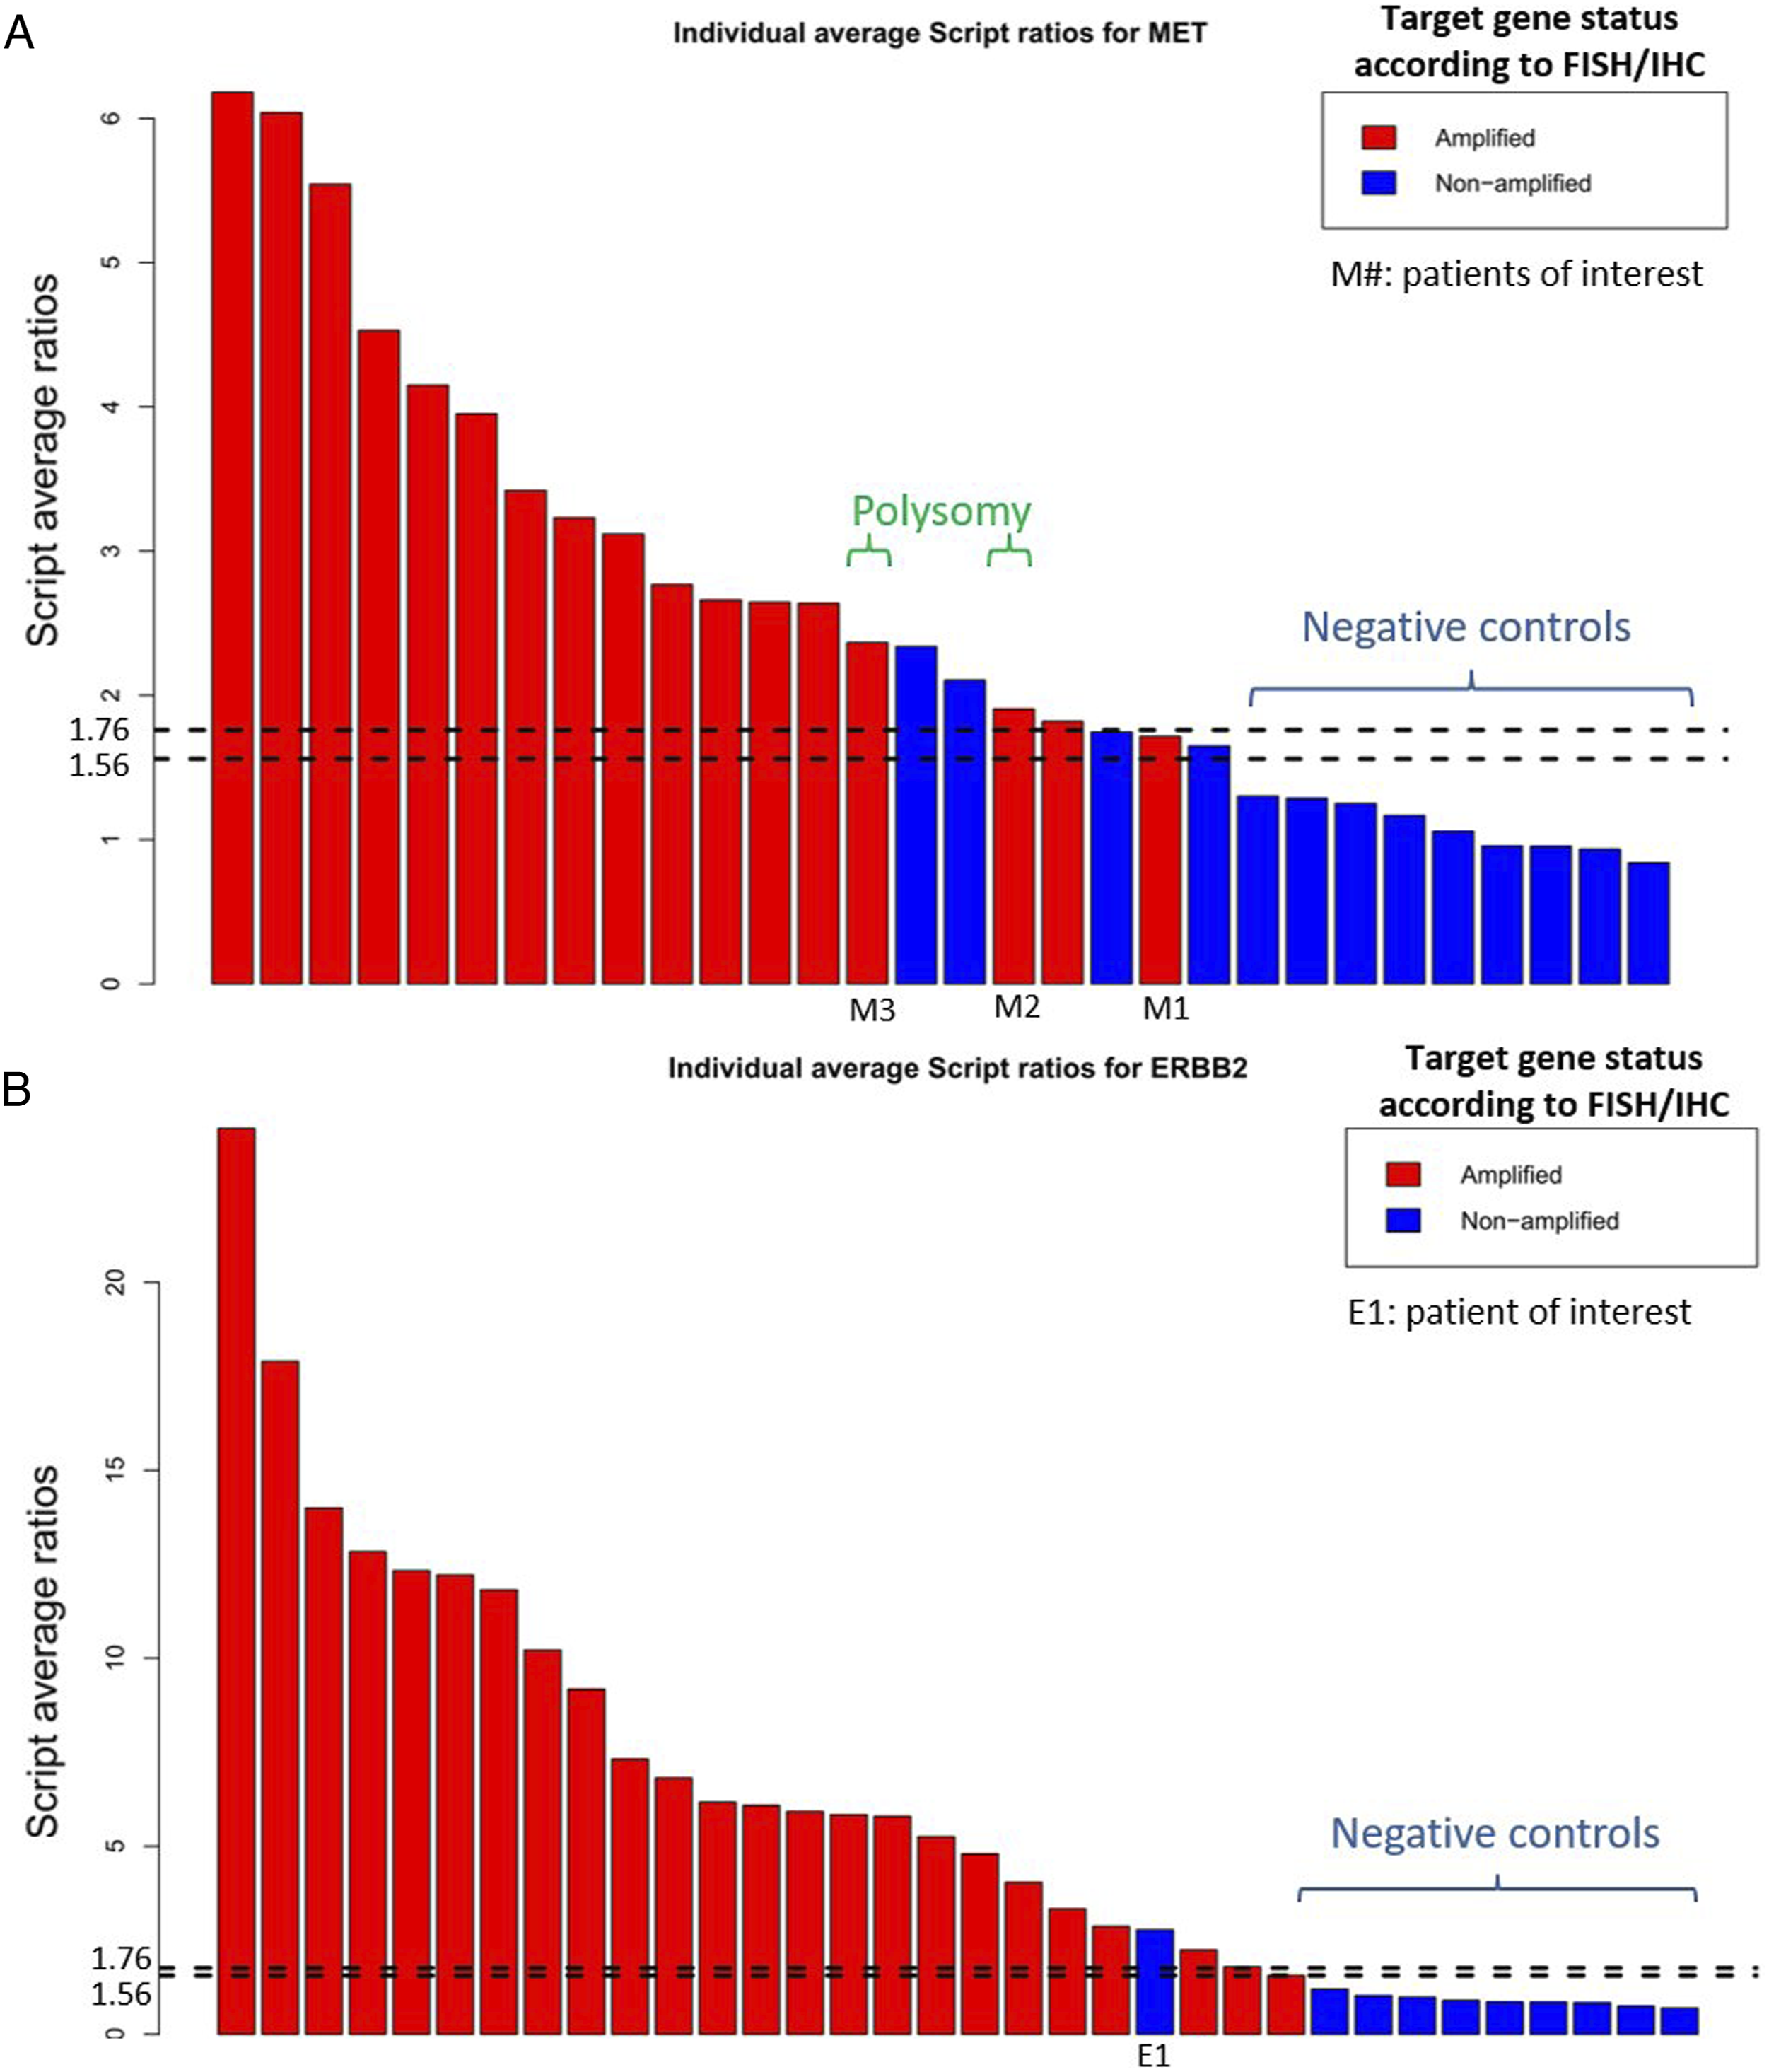
A 1.76 cut-off value was then evaluated to assess if it would allow for a better discrimination of patients with a MET amplification. With this higher threshold, 16 of the 18 patients (89%) with a script value ≥1.76 had a confirmed amplification in FISH, but 1 of the patients (named “M1”) with a script value <1.76 also had a confirmed amplification. In the 30 patients assessed by FISH for MET amplification (9 control patients and 21 with a script value ≥1.56), using the 1.76 cut-off resulted in a sensitivity of 94%, a specificity of 85%, a positive predictive value of 89% and a negative predictive value of 92%, vs a sensitivity of 100%, a specificity of 69%, a positive predictive value of 81% and a negative predictive value of 100% with the 1.56 cut-off. For ERBB2, with the 1.56 and the 1.76 thresholds, the sensitivity was 100% and 96% respectively, the specificity was 90% for both thresholds, the positive predictive value was 96% for both thresholds and the negative predictive value was 100% and 90%, respectively.
ddPCR-Based Results Compared to FISH/IHC in Cohort A
A high correlation was found with linear regression between the mean ddPCR ratio obtained with the housekeeping genes and the ratio determined by FISH (Figure 3), for MET with a correlation coefficient of .90 (P < .001) and for ERBB2 with a correlation coefficient of .88 (P < .001). Unsurprisingly, NGS and ddPCR methods were significantly correlated (supplemental figure 1). Linear regression between average ddPCR ratios and FISH copy numbers for target gene (when available). A: MET, B: ERBB2.
Among the 34 patients assessed by ddPCR for ERBB2 (including negative controls), 21 had an estimated copy number ≥6 and were classified as amplified, 4 had an estimated copy number ≥4 and < 6 and were classified as equivocal, and 9 had an estimated copy number <4 and were classified as non-amplified. Using the same cut-offs with the 30 patients assessed for MET, 14 were amplified, 3 were equivocal and 13 were non-amplified. The estimated copy numbers ranged from 6.1 to 17.4 for MET-amplified samples (57% with >10 estimated copies), and from 6.7 to 83.1 for ERBB2-amplified samples (86% with >10 estimated copies).
For both MET and ERBB2, all patients with an estimated copy number >6 had an amplification confirmed with reference pathology-based methods. For ERBB2, 3 of the 4 equivocal patients had an amplification confirmed by IHC or FISH. The remaining equivocal case (E1) non-amplified for ERBB2 in FISH displayed abnormalities with the housekeeping gene on chromosome 10. If we exclude this gene, CNV result in ddPCR was <4 and thus considered negative in accordance with FISH results. To us, the use of 3 housekeeping gene allows a better characterization of CNV evaluation in cases of tumor with many chromosomal abnormalities. The 9 classified as non-amplified were the 9 control patients.
For MET, 2 of the 3 equivocal patients (M2 and M3) were categorized as amplified by FISH because they had a MET copy number >6 even though FISH MET/CEP7 ratio was 1.21 and 1.75, respectively, suggesting a potential polysomy of chromosome 7. Moreover, the MET/ASL CNV ratio for these patients was <4 while other ratio were >4. These results are in accordance with the diagnostic of polysomy in ddPCR analysis and might suggest false-positive results in FISH analysis. A multianalysis dialogue is needed for such cases. The 13 patients classified as non-amplified comprised the 9 control patients, 3 patients that were non-amplified in FISH but also 1 patient with a MET amplification confirmed by FISH (patient M1, >10 clustered MET copies in FISH), who was the only false-negative. These findings are summarized in Figure 4. Using the >6 cut-off to classify patients as amplified would result in a sensitivity of 82% with a specificity of 100% for MET, and in a sensitivity of 88% with a specificity of 100% for ERBB2. ddPCR mean copy numbers for each individual patient, with the MET and ERBB2 amplification status according to FISH/ICH displayed. A: MET, B: ERBB2.
NGS-Based and ddPCR-Based Results in Cohort B
43 patients were included in cohort B (supplemental Table 5): 4 for BRAF, 9 for EGFR, 7 for FGFR1, 6 for FGFR2, 3 for FGFR3, 10 for KRAS and 4 for PIK3CA. These genes were suspected to be amplified using the NGS-based script with the 1.56 threshold, based on the results of cohort A in which it seemed to yield a very high sensitivity. ddPCR was performed for the gene of interest in these 43 patients. The estimated mean copy number ranged from 1.7 to 181.7; 6 patients (14%) had a ddPCR-estimated copy number <4 and were classified as non-amplified, 23 (53%) had a ddPCR-estimated copy number ≥6, while 14 (33%) had a ddPCR-estimated copy number ≥4 and <6 and were classified as equivocal. The estimated mean copy number for BRAF ranged from 3.6 to 13; for EGFR ranged from 4.8 to 24.7; for FGFR1 ranged from 3.6 to 14; for FGFR2 ranged from 3.8 to 181.7; for FGFR3 ranged from 1.7 to 7.6; for KRAS ranged from 4.2 to 39.4 and for PIK3CA ranged from 5 to 14.5. Since no reference method has been validated to confirm amplifications in these equivocal cases, we investigated higher thresholds for the NGS-based script to better select cases with a ddPCR-estimated copy number ≥6 and thus limit the number of equivocal cases. As only 1 patient was below the 1.76 threshold (for FGFR1, with a script value of 1.59), we investigated a 2.4 cut-off: 28 patients had an NGS-based script value ≥2.4, comprising all 23 (82%) patients with a ddPCR-estimated copy number ≥6, only 4 (14%) equivocal patients and 1 (4%) with a copy number <4. Similarly to cohort A, there was a high correlation between NGS-based script values and mean ddPCR ratios for all patients in cohort B (supplemental figure 2), with a correlation coefficient of .97 (P < .001).
Based on these results, we defined a diagnostic algorithm usable for gene amplifications (Figure 5). Proposed algorithm for the detection of amplifications.
Discussion
The results of our study suggest that an NGS-based script could be used to routinely select patients with a suspicion of gene amplification, with a high sensitivity. We chose the 1.76 cut-off over the 1.56 cut-off for routine use, to select amplified genes with >6 copies. Even though it resulted here in leaving out 1 amplified patient in the ERBB2 (patient E1) and in the MET cohort (M1), we considered it to be an acceptable limit of a molecular biology prescreening method. For patient E1, who had an ERBB2 amplification identified with IHC but not with the NGS-based script using the 1.76 threshold (as the value for E1 was 1.56), a high level of intratumoral heterogeneity was noted by the pathologist. Consistent with this observation, ddPCR classified that sample as “equivocal”.
Furthermore, using a conservative cut-off of 6 copies, the ddPCR-based assessment of gene amplification showed a high correlation with the results of gold standard pathology-based methods, suggesting that it could be used to define gene amplifications for genes without any validated pathology-based method. For cases with an estimated copy number between 4 and 6, verification by FISH/IHC should be considered. Indeed, for M1, the only false-negative patient with a ddPCR-assessed MET copy number estimate <4 and a confirmed MET amplification in FISH, the percentage of tumoral cells in the FFPE block was rather low (30%), which could contribute to an underestimation of the gene copy number. Thus, as usual in molecular biology-based methods, conclusions should be cautious when working with samples with a low tumoral content. Furthermore, for this particular sample, the pathologist estimated that 80% of tumoral cells had >6 MET copies. As a result, a tumor block with only 30% of tumoral cells might contain less than 30% MET-amplified cells, with could be insufficient to detect an amplification with current molecular biology techniques. This issue could be addressed by using macrodissection before DNA extraction. Other factors might explain the discrepancies between FISH/IHC results and NGS or ddPCR results: for M1, these methods were performed on the same biopsy, but the block used for NGS/ddPCR had a 30% cellularity while the block used for FISH had a 40% cellularity. We later performed NGS and ddPCR on the second block (40%) and found a higher script value (2.5 vs 1.72 on the first block) and a higher estimated MET copy number in ddPCR (4.7 vs 3.6), showing the importance of the tumor infiltration on the sample for interpreting ddPCR or NGS results.
On the other hand, gene copy numbers cannot be assessed by IHC and are sometimes difficult to precisely determine with FISH, for instance when the signals from the probes are clustered. This might have an importance for genes like MET, for which the definition of an amplification has not been established. 36 In the recently published GEOMETRY trial, 33 the overall response rate of patients with a MET amplification was 29-41% in patients with a gene copy number ≥10, but only 7-12% in patients with a gene copy number <10; highlighting the importance of a precise evaluation of the MET copy number. Therefore, ddPCR and FISH have their own limitations, but can be combined to detect and then confirm amplifications.
Besides, ddPCR may help detect karyotypic aberrations like polysomy: 2 MET samples (M1 and M2) were classified as polysomy by FISH, but also as amplified, because of a number of MET copies by cell >6. Interestingly, although these patients had an NGS-based script value ≥1.76, they were classified as “equivocal” by ddPCR.
In addition, in contrast with FISH, NGS may provide simultaneous information (mutation and gene amplification) on several genes, which may have clinical applications. For example, pre-clinical data suggest that EGFR amplifications may have different effects on EGFR tyrosine kinase inhibitors depending on whether the amplification affects the wild-type or the mutant allele. 37 NGS/ddPCR can also quantify high levels of amplification for genes like KRAS (39 copy), EGFR (25 copy), ERBB2 (83 copy) or FGFR2 (182 copy), Mutations observed can be associated with amplifications of the same genes or be exclusive.
Our study has some limitations. Firstly, most of the cases from cohort A were selected retrospectively. A study prospectively evaluating all consecutive patient samples routinely analyzed by NGS would be necessary to precisely evaluate the performances (eg sensitivity, specificity) of our diagnostic procedure. Furthermore, a larger cohort would be necessary to properly compare methods based on a similar principle, like the script that we evaluated, although MET amplifications are rare. 38 Statistically, we did not performed power calculation for estimation of sample size selected for the study as the alterations of interest are rare.
Overall, with rapidly emerging data on mechanisms of resistance or molecular targets like genes of the FGFR family, 39 studies evaluating the clinically relevant level of amplification of an oncogene are urgently needed. As shown before, tumor purity can lead to false results. To use an unique threshold in NGS, we propose to consider samples for NGS and ddPCR with a minimal tumor purity of 40%. Otherwise, macrodissection should be performed. If tumor purity is optimal, we showed that no normalization is needed. This statement should be validated in larger cohorts.
In conclusion, ddPCR combined with an NGS-based script does seem to be a reliable method to detect amplifications in various oncogenes. Low-level amplifications and equivocal cases should however be confirmed by pathology-based methods, but ddPCR appears to be an interesting tool to quantify the level of amplification. However, in our hands, a sample with >40% tumoral purity seems to be required for an optimal assessment to avoid missing moderate amplification, and should be integrated to clinical trials evaluating treatments targeting amplification of oncogenes.
Supplemental Material
Supplemental Material - Detection of Nine Oncogenes Amplification in Lung and Colorectal Cancer Formalin-Fixed Paraffin-Embedded Tissue Samples using Combined Next-Generation Sequencing-Based Script and Digital Droplet Polymerase Chain Reaction
Supplemental Material for Detection of Nine Oncogenes Amplification in Lung and Colorectal Cancer Formalin-Fixed Paraffin-Embedded Tissue Samples using Combined Next-Generation Sequencing-Based Script and Digital Droplet Polymerase Chain Reaction by Christophe Bontoux, Alice Guyard, Audrey Lupo, Karim Diallo, Khedidja Rebah, Agathe Hercent, Edouard Guenzi, Jérome Cros, Jérome Lamoril, Karen Leroy, and Nathalie Theou-Anton in Cancer Control
Footnotes
Acknowledgments
We would like to thank Dr Nicolas KIAVUE for his help in this manuscript conception.
Declaration of Conflicting Interests
The author(s) declared no potential conflicts of interest with respect to the research, authorship, and/or publication of this article.
Funding
The author(s) received no financial support for the research, authorship, and/or publication of this article.
Statement of Ethical Approval
This study was carried out in accordance with the principles of the Declaration of Helsinki. The study has been declared to the french national institute concerning health data (INDS) and conducted as part of the care offer according to local standards and laws (MR004 standard and Law Informatique et liberté number 78-1, specifying that retrospective data studies are not considered by French law as involving human subjects and do not require approval by an IRB).
Data Access Statement
Any underlying research materials related to the paper can be accessed upon request to the corresponding author.
Supplemental Material
Supplemental material for this article is available online.
References
Supplementary Material
Please find the following supplemental material available below.
For Open Access articles published under a Creative Commons License, all supplemental material carries the same license as the article it is associated with.
For non-Open Access articles published, all supplemental material carries a non-exclusive license, and permission requests for re-use of supplemental material or any part of supplemental material shall be sent directly to the copyright owner as specified in the copyright notice associated with the article.