
Abstract
Treatment-related toxicities and decreased levels of patient performance during cancer therapy might contribute to body composition changes (BCC) and thereby impact outcomes. This study investigated the association between BCC during transcatheter arterial chemoembolization (TACE) and outcome in patients with hepatocellular carcinoma (HCC), and developed a nomogram for predicting survival in combination with clinical prognostic factors (CPF). Pretreatment and posttreatment computed tomography (CT) images of 75 patients with HCC who were treated between 2015 and 2018 were analyzed. The bone mineral density (BMD), cross-sectional area of paraspinal muscles (CSAmuscle), subcutaneous fat area (SFA), and visceral fat area (VFA) were measured from two sets of CT images. Count the changes in body composition during treatment and sort out the CPF of patients. Using cox regression models, CSAmuscle change, SFA change, VFA change, child-push class, and portal vein thrombosis were independent prognostic factors for overall survival (OS) (HR=5.932, 2.384, 3.140, 1.744, 1.794, respectively. P < 0.05). Receiver operating characteristic curves (ROCs) showed the prediction model combination of BCC and CPF exhibited the highest predictive performance (AUC=0.937). Independent prognostic factors were all contained into the prognostic nomogram, the concordance index (C-index) of prognostic nomogram was 0.787 (95% CI, 0.675−0.887). Decision curve analysis (DCA) demonstrated that the prognostic nomogram was clinically useful. Nomogram-based risk classification systems were also constructed to facilitate risk stratification in HCC for optimization of clinical management. In conclusion, we identified CSAmuscle change, SFA change, VFA change, Child-Pugh class, and portal vein thrombosis were independent prognostic factors for HCC. The prognostic nomogram with a combination of BCC and CPF that can be applied in the individualized prediction of survival in patients with HCC after TACE.
Keywords
Introduction
Hepatocellular carcinoma (HCC) is the main histological subtype of liver cancer, and its incidence continues to rise worldwide, especially in developed countries. 1 The estimated 1-year and 2-year survival of untreated HCC is 17.5% and 7.3%, respectively. 2 Transcatheter arterial chemoembolization (TACE) is the main treatment for HCC patients who are untreatable by resection. 3 Once initial treatment fails, further treatment options are severely limited. Thus, accurate prediction of prognosis as early as possible is critical. Clinical prognostic factors (CPF, including histology, tumor size, and lymph node metastasis) can guide the choice of therapy, but these factors are widely restricted in clinical applications because of tumor heterogeneity. Therefore, a reliable prognostic model must be established to provide opportunities for modifying and improving treatment and follow-up strategies.
Changes in body composition during cancer treatment are related to lack of exercise, malnutrition, chemotherapy-related toxicity, and tumor proliferation, which in turn affect the patient’s prognosis.4-6 Some studies have found a significant decline in bone density during cancer treatment.7,8 Sarcopenia is associated with poor prognosis of cancer patients according to emerging evidence.9-13 Three recent large studies have shown that adiposity was also an independent prognostic factor for cancer patients.14-16 The longitudinal studies of body composition changes (BCC) in patients with HCC during TACE treatment may provide a more comprehensive analysis of the relationship between BCC and prognosis. However, there is still a lack of relevant data regarding the potential impact of changes in bone density, muscle, and adipose tissue during TACE on the prognosis of patients with HCC. Quantitative computed tomography (QCT) can quantitatively measure bone density, muscle, and adipose tissue. In addition, CT images are widely used in the diagnosis and follow-up of patients with HCC. Therefore, CT images are easy to obtain before and after treatment, and hence, can be used as potential imaging biomarkers to predict outcomes in clinical practice.
This study aimed to evaluate the overall predictive value of survival to TACE through the combination of BCC and pretreatment CPF in patients with HCC. A novel predictive paradigm was developed by synergizing the predictive capacity of BCC during TACE and pretreatment CPF.
Methods
Patients
Patients with biopsy-proven HCC who had received definitive TACE with curative intent at our institution between March 2015 and June 2018 were eligible. Patients were included when the following criteria were met: (1) abdominal CT scan was performed before TACE and again after the completion of the TACE course, (2) both CT scans were of sufficient quality for accurate tissue area measurement, (3) complete relevant clinical data could be collected from the patient’s medical chart, and (4) except for TACE, no surgery, radiotherapy, or other treatments were received between pretreatment CT scans and posttreatment CT scans. Patients who received surgery before TACE (n=2) or radiotherapy before TACE (n=2) were excluded. Basic characteristics and clinical prognostic factors were obtained from the patients’ medical records.
Treatment
All patients received TACE once or several times. Fasting for 8 hours before TACE, emptying of urine and feces, training breath holding. Local anesthesia was performed, the right femoral artery was punctured by the Seldinger technique, and a catheter was routinely placed. The distribution of lesions and blood supply arteries were confirmed by digital subtraction angiography (DSA). After the correct positioning of catheter, epirubicin, 5-fluorouracil, and doxorubicin were used as chemotherapy drugs. Thirty milliliters ultra-fluid lipiodol embolic agent and gelatin sponge particles were used for embolization. Review 1 month after TACE, and the next TACE treatment will be decided according to the accumulation of iodized oil in the tumor.
Computed Tomography-Based Body Composition Analysis
Pretreatment and posttreatment CT images were analyzed respectively, the pretreatment CT scan was routinely performed before TACE, and the post-treatment CT scan was routinely performed within 1 month after the end of the TACE course. CT image parameters included the following: whether scans were contrast enhanced or unenhanced, 1.25 mm slice thickness, 120 kVp, 250 mAand 40 cm field of view (DFOV). Images were transferred to a QCT Pro workstation (Mindways Software, Version 4.2.3; Mindways, Austin, TX, USA) by the image transfer utility set up on the CT scanner. The 2013 guidelines of the American College of Radiology on bone mineral density (BMD) measurement by QCT indicated that mean BMD value of first and second lumbar vertebra (L1 and L2) were used to diagnose osteoporosis.
17
Measurement of BMD, on the axial, sagittal, and coronal images, the region of interest (ROI) were located at the center of L1 and L2 (Figure 1A). In order to avoid the partial volume effect of cortical bone, the ROI margin was greater than 3 mm distal the lumbar borders. The area of the ROI was about 250−350 mm2, as large as possible within the selected boundary. BMD value was the mean BMD of L1 and L2 vertebra. We measured the cross-section area (CSA) of paraspinal muscles, including multifidus muscle and erector spinae muscle, and adipose tissue area at the mid-vertebral level slice of L3. The L3 vertebra was selected as a standardized landmark, as the cross-sectional area of muscle and adipose tissue on the CT at the level of the L3 vertebra has a strong correlation with the total body muscle and fat mass.18,19 Measurements of CSA of paraspinal muscles (CSAmuscle) was semiautomatically completed by the commercial software package: “Tissue Composition Module” Beta 1.0 (Mindways, Austin, TX, USA). The QCT Pro “Tissue Composition Module” could define an optional contour around a muscle or group of muscles. A spline was used to constrain the position of the contour, and a “snake” operation to accurately fit the contour to the muscle group (Figure 1B). The user can modify the spline boundary by moving the spline control points as needed. Simultaneously, measurements of subcutaneous fat area (SFA) and visceral fat area (VFA) automatically completed by “Auto Snake” in the function of “Tissue Composition” (Figure 1C). The intra-observer reproducibility of the measurements for BMD, CSAmuscle, SFA, and VFA was high, with pretreatment intraclass correlation coefficients (ICCs) of 0.922, 0.913, 0.896, and 0.912, respectively, and post-treatment ICCs of 0.931, 0.902, 0.908, and 0.905, respectively. Measurement of bone mineral density (BMD) of L1 and L2 vertebrae (A); measurement of cross-sectional area of paraspinal muscles (CSAmuscle) at L3 vertebral layer (B); measurement of subcutaneous fat area (SFA) and visceral fat area (VFA) at L3 vertebral layer (C).
Changes in body composition were evaluated according to the differences between the pretreatment and posttreatment CT images. Taking into account the changes in the interval between two CT scans, changes in the BMD, CSAmuscle, SFA, and VFA between the pretreatment and posttreatment CT images were calculated as the change per 120 days to provide a standardized unit for comparisons between patients. To simulate the definition of cachexia, patients with a reduction or increase in BMD, CSAmuscle, SFA, or VFA of ≥0% were classified as having “loss” or “gain,” respectively.
Statistical Analysis
Classification of categorical variables based on clinical results. In this study, all the optimal cut-off points were evaluated by reference range, and continuous variables were converted into categorical variables. Survival curves were constructed using the Kaplan–Meier method with log-rank tests. All variables with a P < 0.05 on log-rank tests were subjected to multivariate cox regression analysis. Cox proportional hazards models were used to estimate the hazard ratios (HRs) and 95% confidence intervals (CIs) of independent prognostic factors and risk of outcomes. According to the median survival time, the patients were divided into the good and poor prognosis groups. Receiver operating characteristic (ROC) analyses were performed for the independent prognostic factors to determine the overall predictive performance of the BCC model, CPF model, and combination model.
Independent prognostic factors which based on the multivariate cox regression analysis were applied to develop a prognostic model for HCC after TACE. The prognostic nomogram was constructed for predicting 1-year and 2-year OS. To quantify the discrimination performance of the prognostic nomogram, we evaluated the Harrell’s concordance index (C-index). In short, the C-index value greater than 0.75 is considered to have better resolution. The decision curves were also plotted for the model of BCC, CPF, and combined, and the net benefits of probability threshold were quantified to show its clinical application value. Furthermore, we used the prognostic nomogram to calculate the score of each patient. Then a risk classification system was established based on the total score of each patient, and the patients were divided into low-, medium-, or high-risk groups according to the best cut-off values. Kaplan–Meier curve and log-rank test were used to illustrate and compare the OS of patients in different risk groups.
The X-tile program (version 3.6.1) was applied to determine the best cut-off points. Statistical analysis was done using SPSS 19.0 (IBM SPSS, Armonk, New York) and R software (version 3.6.1, http://www.rprobject.org). Statistical significance was fixed at P < 0.05.
Results
We identified 90 patients TACE treated for HCC between 2013 and 2018 (Figure 2). After exclusion of 8 patients (surgery before TACE, radiotherapy before TACE, and/or patients without sufficient clinical data), pretreatment and posttreatment QCT measurements were evaluated in 82 patients. The other 7 patients were excluded because of either missing CT scans after treatment or poor scan quality. Finally, 75 patients were measured with QCT. The age of the patients ranged from 40 to 70 years with a mean age of 54.5 years. Among them, 63 of 75 (84%) were males, and 12 of 75 (16%) were females. The median duration between diagnosis and pretreatment CT scans was 7 days (interquartile range: 4–10 days). The median duration between pretreatment CT scans and TACE was 7 days (interquartile range: 3–11 days). Flow chart for patient inclusion. CT, computed tomography.
Body Composition Changes During Treatment
The median duration between pretreatment CT scans and posttreatment CT scans was 109 days (interquartile range: 51–143 days) for all patients. Among them, the median duration between pretreatment CT scans and posttreatment CT scans for patients with OS of <14 months (n=36) and OS of ≥14 months (n=39) were 115 days (interquartile range: 48–156 days) and 85 days (interquartile range: 57–131 days), respectively, and there was no statistical difference between them (P = 0.311). Supplementary Table S1 summarizes the body composition at baseline and posttreatment and its changes during treatment. Overall, BMD changes during treatment were −8.7% per 120 days, 42 (56%) patients experienced BMD loss, and 33 (44%) patients experienced BMD gain. CSAmuscle changes during treatment were −3.3% per 120 days, 46 (61%) patients experienced CSAmuscle loss, and 29 (39%) patients experienced CSAmuscle gain. SFA changes during treatment were −29.8% per 120 days, 44 (59%) patients experienced SFA loss, and 31 (41%) patients experienced SFA gain. VFA changes during treatment were 20.0% per 120 days, 36 (48%) patients experienced VFA loss, and 39 (52%) patients experienced VFA gain. In addition, Supplementary Table S2 shows the correlation between frequency of TACE, ECOG score, disease recurrence, and body composition changes. The frequency of TACE for CSAmuscle loss was significantly higher than that for CSAmuscle gain (P = 0.007). However, there were no significant differences in BMD, SFA, and VFA (all P > 0.05). The Eastern Cooperative Oncology Group (ECOG) score for VFA gain was significantly higher than that for VFA loss (P = 0.018). However, there were no significant differences in BMD, CSAmuscle, and SFA (all P > 0.05). In addition, there were no significant differences between disease recurrence and body composition changes (all P > 0.05).
Body Composition Changes and Clinical Prognostic Factors for Survival
Kaplan–Meier Survival Analysis of 75 Patients with HCC.

Abbreviations: HCC, hepatic cell carcinoma; BMD, bone mineral density; CSA muscle, cross-sectional area of paraspinal muscles; SFA, subcutaneous fat area; VFA, visceral fat area. AFP, alpha fetal protein; AST, aspartate aminotransferase; ALT, alanine aminotransferase; TBIL, total bilirubin; ALB, albumin; ECOG: Eastern Cooperative Oncology Group; BCLC: Barcelona Clinic Liver Cancer; TACE, transcatheter arterial chemoembolization.
aLog-rank test.
bP < 0.05.

Kaplan–Meier curves demonstrating overall survival according to (A) CSAmuscle change, (B) SFA change, (C) VFA change, (D) portal vein thrombosis, (E) Child-Pugh class, (F) AFP, and (G) Tumor type groups. OS, overall survival; CSAmuscle, cross-sectional area of paraspinal muscles; SFA, subcutaneous fat area; VFA, visceral fat area; AFP, alpha fetal protein.
Cox Multivariate Analysis of 75 Patients with HCC.

Abbreviations: HCC, hepatic cell carcinoma; CI, confidence interval; CSAmuscle, cross-sectional area of paraspinal muscles, SFA: subcutaneous fat area; VFA, visceral fat area.
Predictive Efficacy of Body Composition Changes and Clinical Prognostic Factors
The ROC Analysis for Each Individual Feature, Overall BCC, Overall CPF and BCC with CPF.

Abbreviations: ROC, receiver operating characteristic; BCC, body composition changes; CPF, clinical prognostic factors; AUC, area under curve; CI, confidence interval; CSAmuscle, cross-sectional area of paraspinal muscles; SFA, subcutaneous fat area; VFA, visceral fat area.
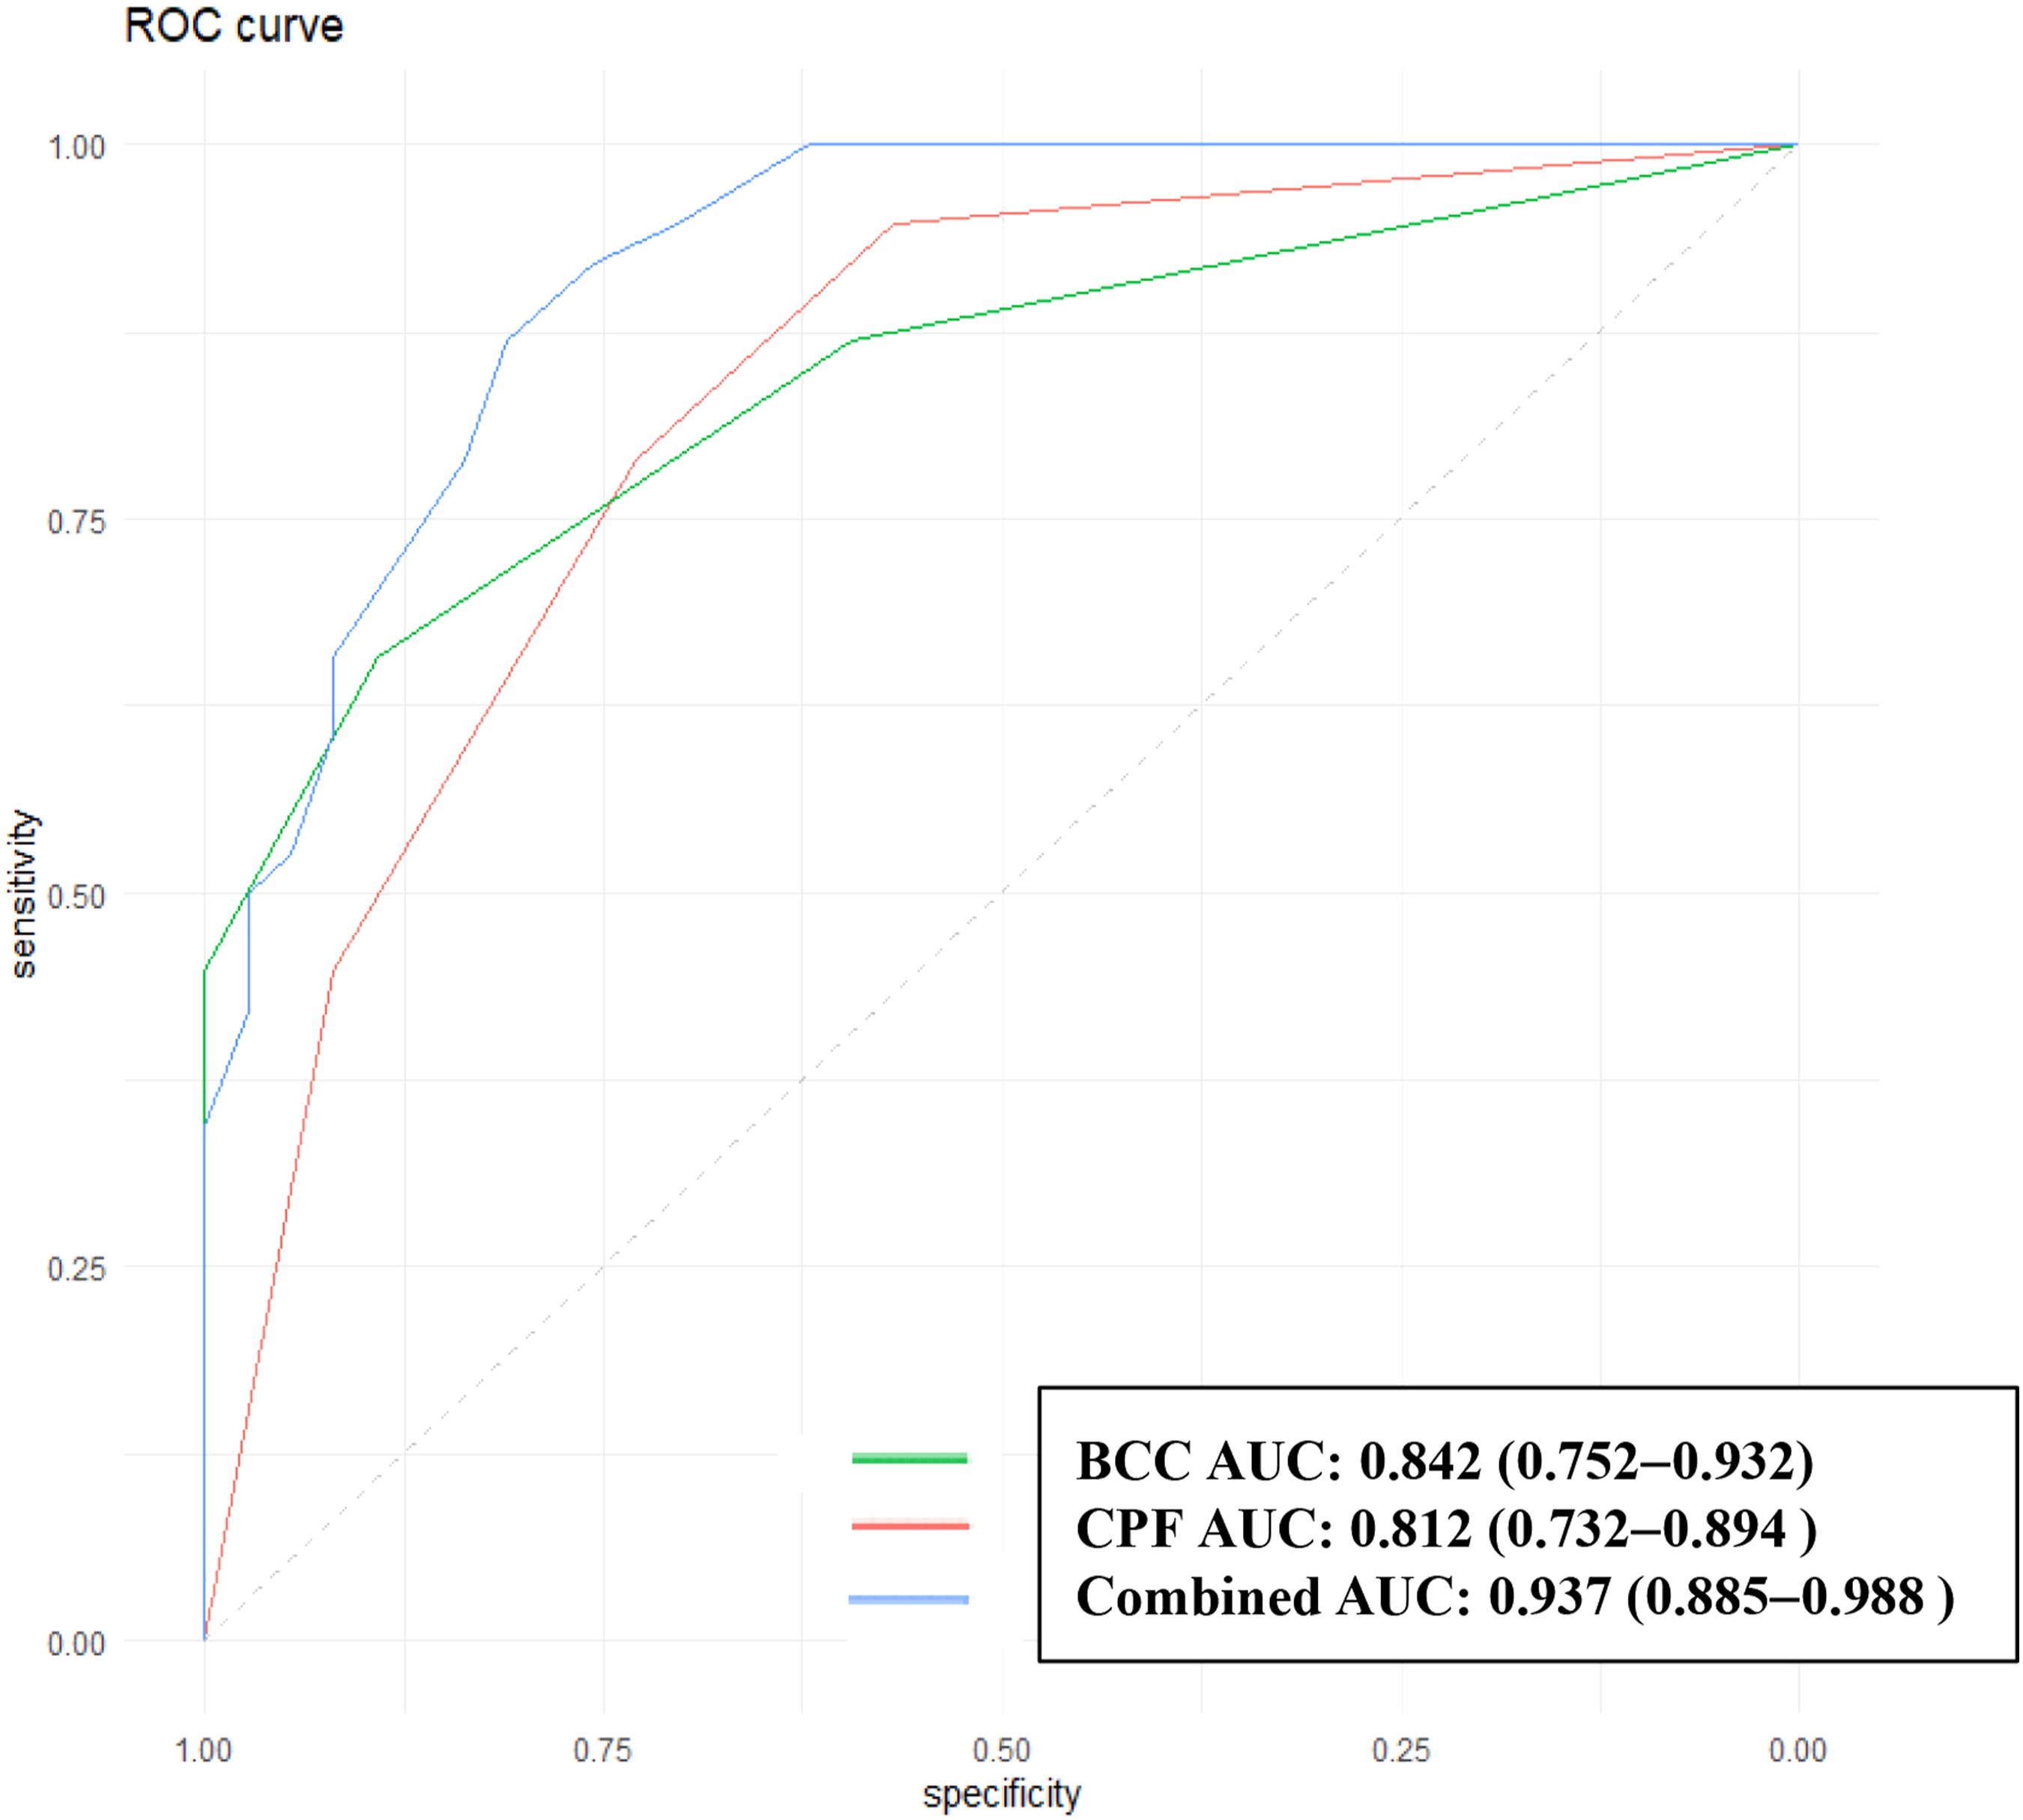
The ROC curves of BCC, CPF, and the combination of the two methods for predicting prognosis in patients with HCC after TACE. BCC, body composition changes; CPF, clinical prognostic factors; AUC, area under curve.
Development and Performance of the Prognostic Nomogram
The prognostic nomogram was based on BCC (CSAmuscle change, SFA change, and VFA change) and CPF (Child-Pugh class and portal vein thrombosis). Each factor was assigned a weighted number of points. The total number of points for each patient was calculated using the prognostic nomogram, and was associated with an estimated probability of 1-year and 2-year OS for HCC after TACE (Figure 5A). The prognostic nomogram yielded a C-index of 0.787 (95% CI, 0.675−0.887). Finally, we used DCA to assess whether this nomogram would help with clinical treatment strategies (Figure 5B). The decision curve showed relatively good performances for the prognostic nomogram with BCC combined with CPF. Across majority of the range of reasonable threshold probabilities, the DCA showed that BCC combined with CPF model had the most net benefit compared with a "treat all" strategy, a "treat none" strategy, and the body composition change model, and clinical prognostic factors model. Nomogram, including CSAmuscle, SFA, VFA, Child-Pugh class and Portal vein thrombosis, for 1-year and 2-year OS in patients with HCC after TACE. The nomogram is valued to obtain the probability of 1-year and 2-year survival by adding up the points identified on the points scale for each variable. CSAmuscle, cross-sectional area of paraspinal muscles; SFA, subcutaneous fat area; VFA, visceral fat area; OS, overall survival (A). Decision curve analysis (DCAs). The net benefit is shown on the y-axis and the threshold probability is shown on the x-axis. Use of the BCC combined with CPF nomogram (blue line) achieves the highest net benefit compared with the BCC (red line), CPF (green line), treat-all strategy (gray line), and the treat none strategy (horizontal black line). BCC, body composition changes; CPF, clinical prognostic factors (B).
Risk Classification System
Score Assignment and Risk Stratification.
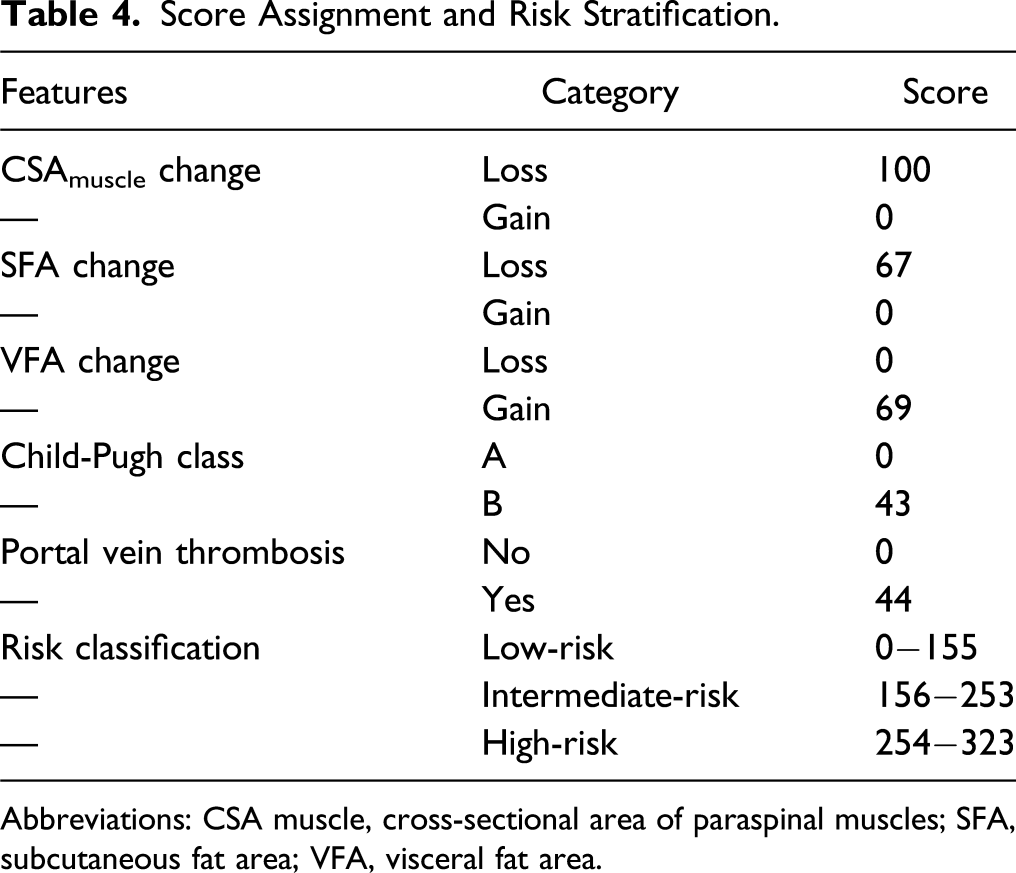
Abbreviations: CSA muscle, cross-sectional area of paraspinal muscles; SFA, subcutaneous fat area; VFA, visceral fat area.

Kaplan–Meier curves of overall survival for the low-, intermediate-, and high-risk patients.
Discussion
This is the first study to examine the longitudinal changes in body composition and their associations with prognoses in patients with HCC who underwent TACE. We found that CSAmuscle loss, SFA loss, and VFA gain during TACE were independent poor prognostic factors associated with reduced OS in patients with HCC. In addition, Child-Pugh class and portal venous thrombosis were independent risk factors. On this basis, we planned to develop and validate a prognostic nomogram, which included BCC and CPF with good predictive efficacy.
Muscle loss is the core manifestation of cachexia. Cachexia occurs in most patients with advanced tumors and causes 20%−60% of cancer patients’ deaths. 20 The present study showed that loss of CSAmuscle during TACE and a shorter OS are closely related (HR: 5.928, 95% CI: 2.464−12.266, P < 0.001), with 1-year and 2-year 0S of 39.1%, 2.2%, which is supported by previous studies. Lee et al 9 revealed that skeletal muscle loss during concurrent chemoradiotherapy was an independent poor prognostic factor associated with reduced OS and cancer-specific survival (CSS) in patients with locally advanced cervical cancer. Lee et al 10 also validated that muscle radiodensity loss during cancer therapy is predictive for poor survival in advanced endometrial cancer. But the direct cause-and-effect relationship is unclear. When cachexia occurs in advanced cancer, its associated metabolic changes, inflammatory responses, and reduced muscle nitrogen stores may be related to the poor prognosis caused by muscle loss. 21 In patients with HCC, reduced activity caused by bed rest and poor nutrition caused by poor appetite during TACE will cause more muscle loss and more likely to have complications.22,23 In a study of older women diagnosed with ovarian cancer, perioperative malnutrition was also associated with poorer tumor reduction surgical outcomes and shorter survival. 24 Furthermore, muscle loss itself is also related to increased chemotherapy toxicity, poor physical fitness, and longer postoperative recovery time.25,26
At present, a large amount of evidence confirms that visceral fat obesity, characterized by visceral fat accumulation and high VFA/SFA ratio, can increase the occurrence of various cancers, postoperative recurrence, and death risks.27,28 Moon et al 29 investigated the prognostic significance of visceral obesity in 161 resectable colorectal cancer patients, and observed that increased visceral adiposity was a significant predictor of disease-free survival (DFS) in patients. Gerard et al 30 studied the VFA and OS of 222 patients with clear cell renal cell carcinoma and found that woman with VFA greater than 30.9% had an increased risk of death (HR: 3.66, 95% CI: 1.64−8.19). Similar to previous studies, this study found that increased visceral fat is a risk factor for the prognosis of HCC patients after TACE (HR: 3.14, 95% CI: 1.53−3.34). One proposal concerning the link between VFA and HCC is as follows. Visceral adipose tissue is a metabolically active organ and not simply fat-storing tissue and secretes or synthesizes many proteins, such as insulin like growth factor-1 and cytokines, such as, tumor necrosis factor-α, interleukin-6, and adiponectin that are known to be associated with insulin resistance. 31 Moreover, visceral obesity is associated with insulin resistance, during which both insulin like growth factor-1 and insulin levels are elevated. In particular, insulin is an important growth factor for liver cancer cells in vitro, and insulin like growth factor-1 inhibits apoptosis and promotes cell-cycle progression, which can lead to the development of cancer.32,33 The results of our study also demonstrate that the risk of death was reduced with the loss of SFA (HR: 2.38, 95% CI: 1.31−3.43). The reason for this could be related to the loss of SFA and cancer cachexia.
The present study showed that the combination of BCC with CPF may create new opportunities for improving prognostic abilities. A combination of BCC and CPF for discriminating prognosis yielded an AUC of 0.937, and the accuracy, sensitivity, and specificity were improved to a certain extent compared to BCC or CPF alone.
Nomograms have been developed and shown to be more accurate than the conventional methods for predicting prognosis in some cancers.34,35 Thus, we sought to develop a prognostic nomogram to help identify HCC patients with poor prognosis after TACE, which combined with BCC (CSAmuscle change, SFA change, and VFA change) and CPF (Child-Push class and portal vein thrombosis). The prognostic nomogram performed well in predicting overall survival, which showed adequate discrimination in the cohort (C-index, 0.787). In addition, the combined prognostic model, with the greatest net benefits across most of the threshold probabilities in DCA, outperformed the single BCC and CPF models. Therefore, to facilitate clinical applications, we constructed a prognostic nomogram combining the changes in body composition during treatment with pretreatment clinical characteristics. The scoring system can generate the 1-year and 2-year survival probability of HCC patients after TACE to realize the individualized prediction of the prognosis of HCC patients by clinicians, which is in line with the current development trend of individualized precision medicine.
This study found the frequency of TACE for CSAmuscle loss was significantly higher than that for CSAmuscle gain. However, in Kaplan–Meier survival analysis, the frequency of TACE was not associated with OS. Analyze the reasons, on the one hand, the increase in the frequency of TACE can lead to malnutrition and lesser physical activity, resulting in CSAmuscle loss, thereby affecting the prognosis, and frequent treatment can cause liver damage and aggravate liver cirrhosis. However, on the other hand, the frequency of TACE may be a protective factor for patients with advanced HCC. Some patients cannot tolerate the treatment or give up the treatment due to their poor general condition during treatment, and most of the patients receiving repeated TACE treatment are sensitive to treatment and have good physical conditions. When the lesion is large, TACE treatment is difficult to completely necrosis the tumor, and the residual tumor may lead to the possibility of tumor recurrence. Therefore, repeated and regular treatment is very important to control the development of tumor, which can further necrosis of residual tumor tissue, increase the necrosis rate of tumor lesions, improve curative effect, and prolong patient survival.
Our study had several limitations. First, only the muscles of a single level of L3 vertebral were measured, not the entire volume of the paraspinal muscles. This study only examined multifidus muscle and erector spinae muscle, excluding psoas major muscle. Second, considering its retrospective design, we were unable to measure food intake and physical activity, which may affect changes in body composition. Therefore, we cannot determine the causal relationship between changes in body composition during treatment and the prognosis of HCC patients, but can only reveal the correlation between them. Third, the nomogram was established based on data obtained from one institution with a small sample size, so multicenter prospective and external validation studies are needed to extend the versatility of the experimental results. Despite these limitations, the strength of our study is that patients received very similar treatments and consistently underwent pretreatment and posttreatment CT. The medical records were complete, and the follow-up period was also adequate. Taken together, our findings contribute strongly to the increasing body of research showing that prognoses are clearly associated with BCC during treatment, and a reliable prognostic model can be established in combination with CPF.
Conclusion
In conclusion, CSAmuscle loss, SFA loss, and VFA gain during TACE, as well as Child-Pugh class and portal vein thrombosis before treatment, were independent risk prognostic factors for HCC. Our study established a prognostic nomogram that combined BCC and CPF, which can be used as an individualized noninvasive tool for predicting survival in patients with HCC after TACE, assisting in clinical treatment decision-making and help improve clinical outcomes.
Supplemental Material
sj-pdf-1-ccx-10.1177_10732748211038445 – Supplemental Material for What Makes a Military Professional? Evaluating Norm Socialization in West Point Cadets
Supplemental Material, sj-pdf-1-ccx-10.1177_10732748211038445 for Body Composition Changes in Hepatocellular Carcinoma: Prediction of Survival to Transcatheter Arterial Chemoembolization in Combination With Clinical Prognostic Factors by Xiaomin Zheng, Feng Cao, Liting Qian and Jiangning Dong in Cancer Control
Footnotes
Acknowledgments
We thank all staffs involved in the acquisition of data. We are grateful to all involved cancer patients for their participation to the study.
Declaration of Conflicting Interests
The author(s) declared no potential conflicts of interest with respect to the research, authorship, and/or publication of this article.
Funding
The author(s) received no financial support for the research, authorship, and/or publication of this article: This study was supported by Youth Fund Project of Anhui Provincial Cancer Hospital (No. 2020YJQN010).
Ethical approval
This retrospective study was approved by the First Affiliated Hospital of University of Science and Technology of China (approval number: 2020-FLK-02). Because this was a retrospective review of imaging examinations and electronic medical records, the requirement for informed consent was waived.
Supplemental Material
Supplemental material for this article is available online.
Appendix A
Abbreviations
References
Supplementary Material
Please find the following supplemental material available below.
For Open Access articles published under a Creative Commons License, all supplemental material carries the same license as the article it is associated with.
For non-Open Access articles published, all supplemental material carries a non-exclusive license, and permission requests for re-use of supplemental material or any part of supplemental material shall be sent directly to the copyright owner as specified in the copyright notice associated with the article.