
Abstract
Objective
It is debatable whether BCR-ABL1 transcript type has an impact on outcome of treatment of patients with CML, and it is not widely studied whether body weight influences response to treatment. In this study, we tried to find out if any of these factors has an impact on response to treatment and outcome.
Methodology
We conducted a retrospective analysis of the files of 79 patients being treated in our center for CML with known BCR-ABL1 breakpoints, and patients’ management and response assessment was done based on ELN 2013 guidelines. The analysis was performed based on two main groups, obese vs. normal BMI, and then based on BCR-ABL1 transcripts: e13a2 vs. e14a2. Cumulative incidence of MMR, CCyR, and DMR were estimated using the Kaplan–Meier survival curve method, and comparisons between groups were performed by the Log-rank/Gray test methods.
Results/conclusion
In the patient-cohort studied, there was no statistically significant difference in molecular response between patients with CML based on body weight or transcript type although patients in the obesity group achieved higher and faster MMR with no statistical significance.
Introduction
Chronic myeloid leukemia (CML, also known as chronic myelocytic, chronic myelogenous, or chronic granulocytic leukemia) is a myeloproliferative neoplasm characterized by the dysregulated production and uncontrolled proliferation of mature and maturing granulocytes with normal differentiation. It accounts for approximately 15%–20% of leukemias in adults. 1 It has an annual incidence of 1–2 cases per 100,000, with a slight male predominance. 2 The median age at presentation in Western countries is approximately 50 years for patients enrolled in clinical studies, but the actual median age from cancer registry data may be 10 years older. Exposure to ionizing radiation is the only known risk factor. 3
The hallmark of CML is BCR-ABL1 (breakpoint cluster region gene-Abelson murine leukemia viral oncogene homolog 1) on Philadelphia chromosome, which is the result of a reciprocal translocation between the long arms of chromosomes 9 and 22 (t[9,22][q34;q11]). 4
Chromosome 22 breakpoints influence the BCR portions preserved in the BCL-ABL1 fusion mRNA and protein and are mainly localized to one of three BCRs, namely major-BCR (M-BCR), minor BCR (m-BCR), and micro-BCR (μ-BCR). In comparison, breaks in chromosome 9 arise most frequently by alternative splicing of the two first ABL1 exons and can also be generated in a large genetic region, upstream of exon Ib at the 5’ end, or downstream of exon Ia at the 3’ end. Most commonly, splicing results in fusion mRNAs involving exons 2–11. 5 The resultant p190BCR-ABL and e1a2 fusion mRNA from minor BCR (m-BCR) breakpoints is prevalent in two-thirds of patients with Philadelphia-positive acute lymphoblastic leukemia (Ph+ ALL). CML cases expressing the rare isoform p190BCR-ABL often exhibit prominent monocytosis and are associated with an aggressive course of disease. 6 In the majority of CML cases, the breakpoint lies within the M-BCR and gives rise to e13a2 or e14a2 fusion mRNAs (previously denoted as b2a2 and b3a2) and a p210BCR-ABL fusion protein. Breakpoints in the μ-BCR region generate the e19a2 fusion mRNA transcript, the largest BCR-ABL fusion protein p230BCR-ABL and correspond to predominant neutrophilic leukocytosis and a less aggressive clinical course.7,8
Obesity is defined as abnormal or excessive fat accumulation that presents a risk to health. A crude population measure of obesity is the body mass index (BMI), a person’s weight (in kilograms) divided by the square of his or her height (in meters). According to current WHO classification, a person with a BMI of <18.50 is considered underweight, a BMI of 18.50–24.99 is considered normal, whereas a person with a BMI of 25.00–29.99 is considered overweight, and a BMI of 30 or more is considered obese, with further subclassification as follows: BMI of 30.00–34.99 is obese class I, BMI of 35.00–39.99 is obese class II, and BMI of ≥40.00 is obese class III. 9 It has been reported that obesity in adulthood and early adulthood may increase the risk of almost all types of hematopoietic malignancies, 10 while a study done in MD Anderson found that obesity and adult weight gain are independent risk factors for CML. 11
Molecular monitoring of BCR-ABL1 transcript levels at 3, 6, and 12 months after initiation of tyrosine kinase inhibitors (TKIs) is important to assess response and efficacy of treatment by achieving key milestones, allowing for early intervention if needed. 12
It has been reported that increased body fat content in early adulthood may increase the risk of hematologic malignancies, while a study done in MD Anderson found that obesity and adult weight gain are independent risk factors for CML; however, no study evaluated the role of obesity in the disease progression while more studies investigate the impact of translocation types. The purpose of this study is to explore the impact of obesity and BCR-ABL1 transcript type on the outcome.
Methodology
We conducted a retrospective analysis of the files of 79 patients being treated in our center for CML with known BCR-ABL1 breakpoints; there were few more patients with known transcript type but excluded because they either traveled immediately on diagnosis or had a failure due to confirmed compliance issues. Patients’ management and response assessment was done based on ELN 2013 guidelines. The analysis is done based on two main groups, obese versus normal BMI, and then based on BCR-ABL1 transcripts: e13a2 versus e14a2. Ethical approval was obtained from Medical Research Center for Hamad Medical Corporation (MRC-01-18-337).
Our study included patients of different ages and diverse ethnicities: ages between 22 and 73 years; 62 males and 17 females; and nationalities (by more to less frequent): Indian, Egyptian, Bangladeshi, Filipino, Pakistani, Qatari, Nepalese, Yemeni, Omani, Saudi, Sudanese, Ugandan, Kenyan, Sri Lankan, Iranian, Iraqi, Tunisian, Syrian, Indonesian, Myanmar, Afghan, Eritrean, and Bahraini.
Single step end-point reverse transcription PCR (RT-PCR) is used to exclude or detect and characterize BCR-ABL1 fusions in diagnostic samples. A multiplex PCR assay is used and includes primers for an internal control fragment that enables cDNA quality to be assessed. The test can detect e19a2, e13a2 (previously b2a2), e13a3 (b2a3), e14a2 (b3a2), e14a3 (b3a3), e1a2, and e1a3 variants which account for >99% of leukemia patients with a t (9; 22) BCR-ABL1 rearrangement. The primers used may not detect some very rare BCR-ABL1 fusions. It is essential to characterize the variant as this determines the method and means of future monitoring. For patients with e1a2, e13a2, and e14a2 fusions, disease levels can be monitored by real-time quantitative PCR (RQ-PCR). Other rare variants are monitored using non-quantitative RT-PCR.
A complete cytogenetic response (CCyR) is defined by no Ph+ metaphases detected, major molecular response (MMR) is defined by ≥3-log reduction of BCR-ABL mRNA (or BCR-ABL1 ≤0.1%), and deep molecular response (DMR) is defined by ≥4-log reduction of BCR-ABL mRNA (or BCR-ABL1 ≤0.01%).
Descriptive statistics were used to summarize demographic, anthropometric, hematological, and clinicopathological characteristics of the patients. The normally distributed data and results were reported with mean and standard deviation (SD); the remaining results were reported with median and range. Categorical data were summarized using frequencies and percentages. Preliminary statistical analyses were conducted to examine the distribution of the data variables using the Kolmogorov–Smirnov test. Associations between two or more qualitative variables were assessed using Chi-square (χ2) test, Fisher Exact or Yates corrected Chi-square tests as appropriate. Quantitative data and outcome measures between the two independent groups were analyzed using an unpaired t-test (or Mann–Whitney U-test for skewed data). Survival functions were estimated with the Kaplan–Meier survival curve method followed by Log-rank test. For response parameters (CCyR, MMR, and DMR), cumulative incidences were calculated and comparisons between cumulative incidences were performed by the Log-rank/Gray tests. Pictorial presentations of the key results were made using statistical graphs: Box plots and Bar diagrams. All p-values presented were two-tailed, and p-values <0.05 was considered as statistically significant. All statistical analyses were done using statistical packages SPSS 27.0 (Armonk, NY: IBM Corp) and Epi-info (Centers for Disease Control and Prevention, Atlanta, GA) software.
Results
In our present study, we attempted to evaluate the transcript distribution across the various demographics, anthropometric, hematological, and clinicopathological characteristics. Patients included 62 males (78.5%) and 17 females (21.5%) with the mean age at diagnosis 38.8 ± 11.8 years (median, 38; range 21 to 69 years). Box plots depict the distribution of WBC, platelet counts, spleen size, and Sokal scores at diagnosis across both transcripts e13a2 and e14a2, and it indicates that for all these four parameters both median and inter-quartile range (IQR) were not significantly different (Figure 1). Figure 2 shows the same (WBC, platelet counts, spleen size measured at diagnosis, and Sokal score). Also, there were no significant differences between obese patients compared to patients with normal weight group. Box plots depicts distribution of (A) WBC at diagnosis, (B) platelet counts at diagnosis, (C) spleen size, and (D) Sokal scores at diagnosis across transcript types e13a2 and e14a2. Box plots depicts distribution of (A) WBC at diagnosis, (B) platelet counts at diagnosis, (C) spleen size, and (D) Sokal scores at diagnosis across Obese and normal weight groups.

Comparison and Association of Patient Characteristics at Diagnosis With Transcript Types and Obesity.
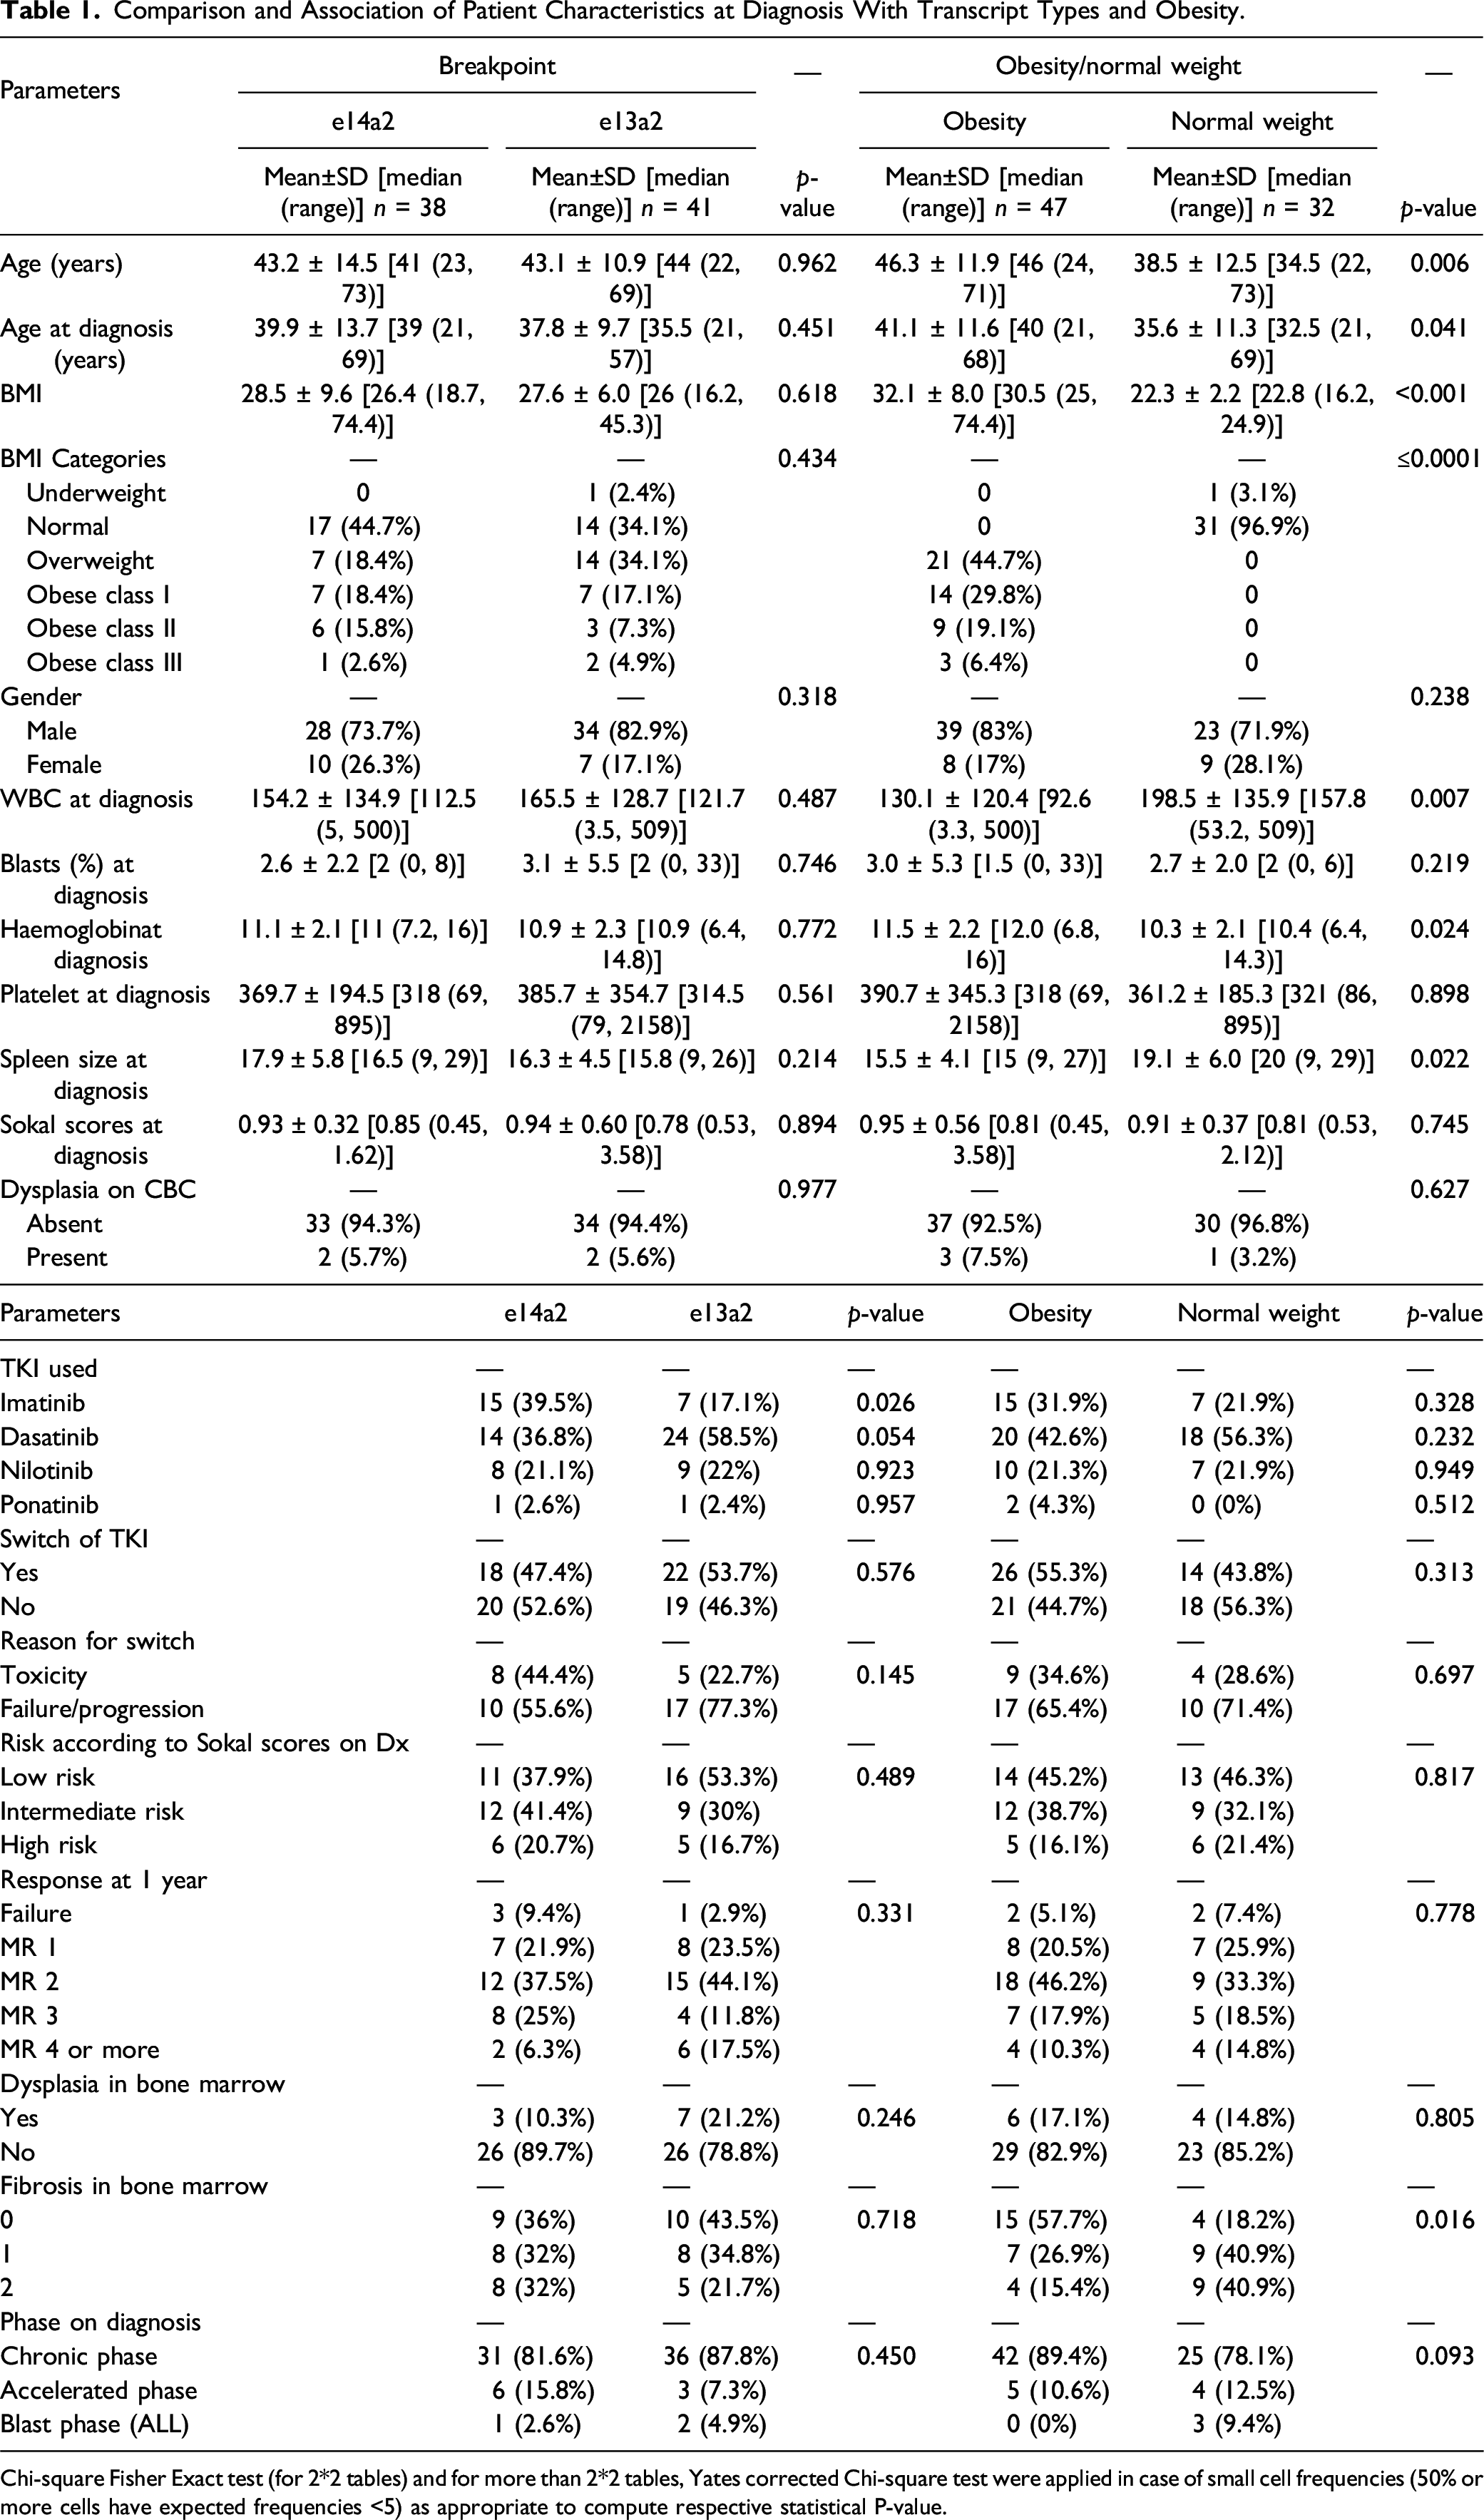
Chi-square Fisher Exact test (for 2*2 tables) and for more than 2*2 tables, Yates corrected Chi-square test were applied in case of small cell frequencies (50% or more cells have expected frequencies <5) as appropriate to compute respective statistical P-value.
Patient Outcomes, Cytogenetic, and Molecular Responses
The median follow-up was 30 months (range 6 to 196 months) and 38 months (range 3 to 192 months) in normal weight and obesity groups, respectively. The median follow-up was 28 months (range 3 to 196 months) and 39 months (range 10 to 192 months) in e14a2 and e13a2 patients, respectively. A total of 22 patients distributed among different groups ended up leaving the country (censored) after a variable duration of follow-up (6–196 months), 18 of them CML-CP, and 4 CML-AP.
Three patients died in our cohort, all of them had e14a2 transcript, one of them was in the normal weight/BMI group, and two were in the obesity group. - The first patient was a Kenyan gentleman who died at the age of 22 years, around 8 months after diagnosis with CML-CP, karyotype on diagnosis showed a clone with deletion of Y chromosome: 45,X,-Y,t(9;22)(q34;q11.2)9/46,XY,t(9;22)(q34;q11.2)
26
, he was intolerant for nilotinib then dasatinib, and ended with progression to blast phase then passed away. - The second patient was an Egyptian gentleman who died at the age of 56 years, around 15 months after diagnosis with CML-AP, on diagnosis 90% of nuclei analyzed t(9;22) with extra fusion signal probably due to double Philadelphia. He progressed to AML-blast phase 11 months after diagnosis and passed away 4 months later. - The last patient was a 34-year-old Nepalese gentleman, who passed away 3 months after diagnosis with CML-AP due to COVID pneumonia during the first wave of the pandemic.
In e14a2 group, more patients were on imatinib at the time of analysis [15 (39.5%) vs. 7 (17.1%) in e13a2 group, p = 0.026]. The percentage of patients who had to switch TKI was similar in both groups (47.4 vs. 53.7%, p = 0.576). However, less patients in e14a2 group had to switch TKI because of failure/progression [10 (55.6%) vs. 17 (77.3%), p = 0.145); however, this did not translate into a significant difference of achieving MMR at 1 year, where in e14a2 group, 10 patients achieved MMR at 1 year (31.3%), same as in e13a2 group (10 patients = 29.3%) p 0.331 (all shown in Table 1).
When comparing long-term outcomes, there was also no significant difference between groups based on transcript type with regards to MMR (44.7% vs. 46.3% in e14a2 vs. e13a2 respectively) or DMR (26.3% vs. 22% respectively) as shown in Figure 3. Kaplan–Meier curve showed (A) cumulative incidence of major molecular remissions (MMR), (B) cumulative incidence of complete cytogenetic remissions (CCyR), and (C) cumulative incidence of deep molecular remissions (DMR) across transcript types e13a2 and e14a2.
In the obesity group, there were two patients using ponatinib due to T315I mutation, compared to none in normal weight group. However, there were no significant differences in TKI used, switch of TKI, or reason for switch. Same applies for achieving MMR at 1 year, as 11 patients in the obesity group achieved MMR (28.2%) compared to 9 patients in normal weight group (33.3%), p = 0.778 (as shown in Table 1).
Regarding the long-term outcomes, more patients in the obesity group achieved MMR (53.2%) compared to normal weight group (34.3%), and this response was faster, but not statistically significant. This difference was less clear with regards to DMR (25.5% in the obesity group compared to 21.9% in normal weight group) as shown in Figure 4. Kaplan–Meier curve showed (A) cumulative incidence of major molecular remissions (MMR), (B) cumulative incidence of complete cytogenetic remissions (CCyR), and (C) cumulative incidence of deep molecular remissions (DMR) across groups by weight.
Discussion
In our cohort, there was no significant differences in molecular response based on transcript type or body weight/BMI. However, three patients died in this cohort, and they are summarized in the Results section above, still this number is not enough to draw conclusions.
Several studies have been done to find out the prognostic significance of the BCR-ABL1 transcripts, and here, we will follow review for most of the studies comparing the common breakpoints with e14a2 (b3a2) versus e13a2 (b2a2) transcripts with regards to prognosis.
Tefferi A et al in 1990 13 conducted a study on 62 patients with CML-CP, 39 patients with 5′ breakpoints (zones 1–3) and 23 patients with 3′ breakpoints (zones 4 and 5), they found no correlation between the clinical phase of the disease at last follow-up and breakpoint distributions. Presenting clinical features, chronic phase duration, and the rates of lymphoblastic transformation were similar among the subgroups.
Shepherd P et al in 1995 14 conducted an analysis of 219 patients with Ph+ve CML and 15 Ph-ve, BCR+ve CML, 119 cases had the type of BCR/ABL transcript determined. There was no significant difference in age at diagnosis, gender, white-cell count, and platelet count among different breakpoints and transcripts. There was also no difference in survival or cytogenetic response.
Prejzner W in 2002 15 conducted a study on 71 patients with CML-CP, 61 of them with known BCR-ABL1 transcripts. He reported no significant clinical differences between both transcripts, although patients with b3a2 transcript had longer survival.
de Lemos JA et al in 2005 16 conducted an observational cohort study on 22 patients with CML treated with imatinib and were followed for six months during treatment. They found a significant difference in the BCR-ABL transcript levels, so that b2a2 may be more sensitive to imatinib. They assumed that patients with the b2a2 transcript might have a better prognosis.
Vega-Ruiz A et al in 2007 17 published an abstract analysis of 480 patients with CML-CP treated with imatinib, imatinib was given as upfront for 251 patients, and as a second-line after failure of interferon. They concluded that patients with e14a2 had higher rates of MMR and CMR (complete molecular remission).
Lucas CM et al in 2009 18 conducted a study involving 78 patients with CML-CP, age >16, who received imatinib. Seventy-one of them had either e13a2 or e14a2 transcripts. They reported that patients with e14a2 transcript achieved more and faster CCyR (54%) than patients with e13a2 (25%).
Hanfstein B et al in 2014 19 conducted a study on 1105 patients with newly diagnosed CML, all treated with imatinib. A total of 451 expressed e13a2, 496 expressed e14a2, and 157 co-expressed both. There were no significant differences in age, gender, or risk score. Patients with e13a2 had significantly higher WBCs and lower platelets compared to patients with e14a2. The molecular response was inferior in e13a2 patients (P=0.002 for major molecular response; p < 0.001 for MR4) but no difference was observed with regard to cytogenetic response and overall survival. They concluded that no risk prediction can be made according to e13a2 vs. e14a2 BCR-ABL1 transcript type at diagnosis.
Jain P et al in 2016 20 conducted a study involving 481 patients with chronic phase CML. Two hundred patients expressed e13a2 (42%), 196 (41%) expressed e14a2, and 85 (18%) expressed both transcripts. They concluded that patients with e14a2 (alone or with co-expressed e13a2) achieved earlier and deeper responses, compared to e13a2 transcripts, and had longer event-free survival.
Lin HX et al in 2016 21 conducted a retrospective analysis of 166 patients treated with imatinib. They concluded that males with b2a2 transcript have an inferior response to imatinib.
Castagnetti F et al in 2017 22 analyzed 559 patients from 3 prospective studies, treated with imatinib and followed ≥5 years. 52% of the patients had an e14a2 transcript, 37% an e13a2 transcript, 11% co-expressed both transcripts and 1% had other rare transcripts. There was no significant difference in complete cytogenetic response rates. However, molecular response was faster in patients with e14a2 compared to those with e13a2, MR3.0 (6 and 12 months), and MR4.0 (41 and 61 months). And there was a significant difference in overall survival (90% and 83%, p = 0. 017), progression-free survival (89% and 81%, p = 0.005), and failure-free survival (71% and 54%, p < 0.001).
Azad NA et al in 2018 23 conducted a study involving 42 cases of CML treated with imatinib, they had either e13a2 (b2a2) or e14a2 (b3a2) transcripts, they did not find any significant difference in the clinical variables evaluated or overall survival between patients with different transcripts.
D'Adda M et al in 2019 24 conducted a study involving 173 patients with CML, 67 (38.7%) had the e13a2 transcript, and 106 (61.3%) had the e14a2 transcript. There were no significant differences in complete cytogenetic responses or major molecular remissions. However, deep molecular responses were significantly better in patients with e14a2 transcript, giving a higher probability for treatment-free remissions in the future for this group.
Sazawal S et al in 2019 25 conducted a study involving 400 patients with CML-CP, 72% of them had b3a2 transcript, vs. 26% with b2a2 transcript, while 2% had co-expression of both transcripts (b3a2 + b2a2).. They concluded that MMR was significantly higher in patients with b3a2 transcript as compared to patients with b2a2.
Greenfield G et al in 2019 26 conducted a study on 69 patients with CML and known BCR-ABL1 transcript. Patients with e13a2 transcript were younger (45.0 vs. 54.5 years), had a higher white-cell count (189.8 × 10⁹/l vs. 92.40 × 10⁹/l) and lower platelet count (308 × 109/l vs. 644 × 109/l), and they achieved less molecular responses to imatinib when compared to patients with e14a2 group.
Summary of Studies Comparing the Response to Treatment Based on Manuscript Type.
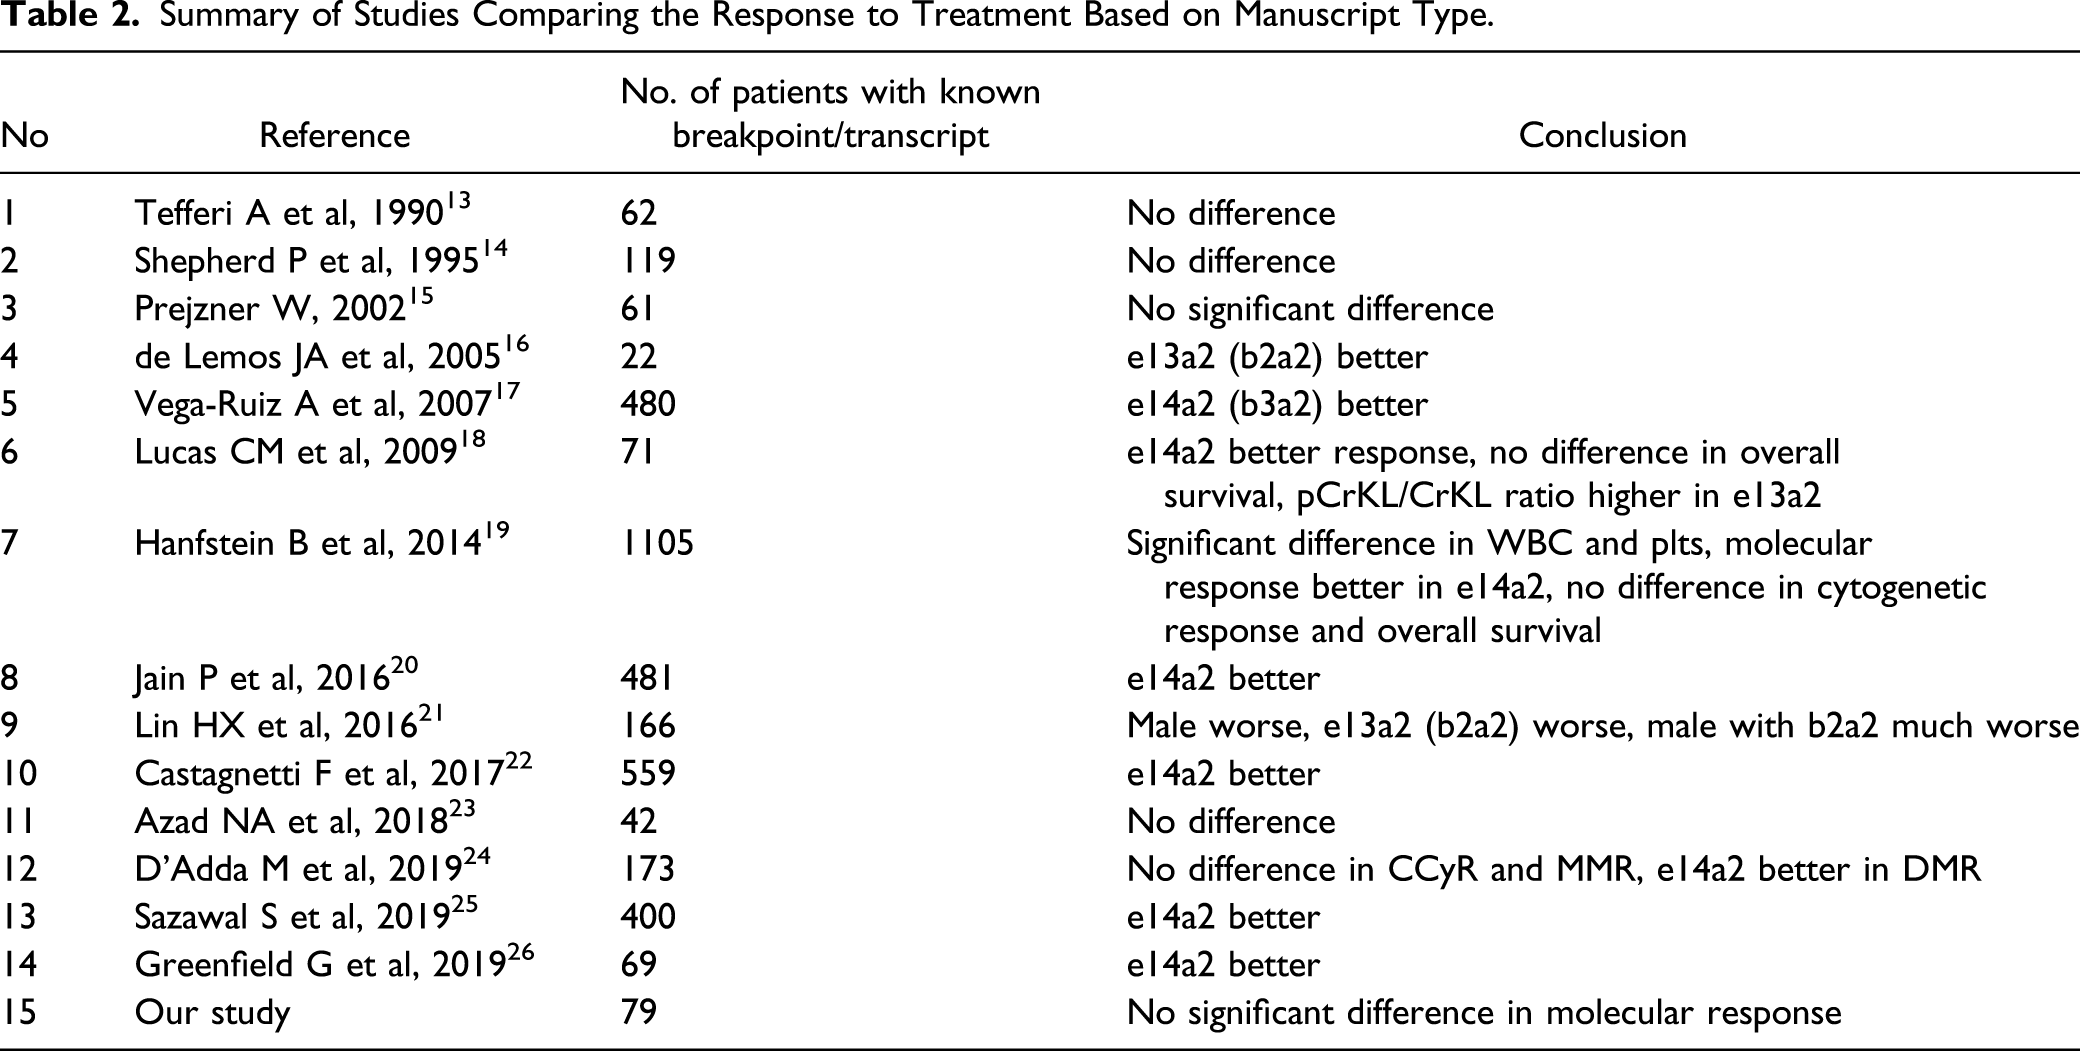
One study 16 reported a better outcome with e13a2, but the number of patients were low and the duration of follow-up was short.
Several studies reported no difference in outcome according to BCR-ABL1 transcript, two of them were relatively old—before the introduction of TKIs13,14 or shortly after that, 15 in addition to one recent study. 23 In addition, the study by Hanfstein B et al 19 which has by far the largest cohort of patients reported no difference in cytogenetic response and overall survival despite those patients with e14a2 had better molecular response. And the study by D’Adda M et al 24 reported no difference in CCyR and MMR between the two groups, but e14a2 better in DMR and this group achieved better treatment-free remission compared with e13a2. Our study concurs with these studies, as there is no difference in CCyR or molecular response (MMR and DMR) between the different groups.
Patients in the obesity group achieved a higher MMR (53.2%) compared to normal weight group (34.3%), and this response was faster, but not statistically significant. This may be related to the observed significant differences in baseline characteristics between these groups, where patients in normal weight group were younger, had a higher WBC count, a lower hemoglobin level, and a larger spleen size on diagnosis with a relatively higher degree of fibrosis in the bone marrow, all as compared to patients in obesity group.
We recognize the limitation of our study being retrospective with some missing data and a relatively small cohort, but it is unique in that it incorporated detailed clinicopathological characteristics and compared the outcome in obese and normal BMI and different transcripts. Even though other authors described obesity as an independent risk factor for CML, 10 ours is the first to study a possible association between obesity and outcome in CML patients. This pilot study lays the basis for others that should include a larger cohort of patients in order to confirm the preliminary findings and gain further insights on the role of obesity and breakpoint regions on the outcome of CML and justify further studies on the molecular basis of the phenomenon.
Our group is studying the unmet clinical needs and unanswered questions like the association OF CML With Tuberculosis, 28 Autoimmune hemolytic anemia, 29 priapism, 30 Reactivation of Hepatitis B, 31 ophthalmic manifestations, 32 as well as Effects of Intermittent Fasting on Response to Tyrosine Kinase Inhibitors (TKIs) in Patients With Chronic Myeloid Leukemia, 33 and with regard to body weight and obesity this project is pilot phase of European leukemiaNet project How I treat obesity and obesity related surgery in patients with chronic myeloid leukemia: An outcome of an ELN project. 34
Aknowlegement European LeukemiaNet.
Conclusion
In the patient-cohort studied, there were no significant differences in molecular response based on transcript type or body weight/BMI.
Footnotes
Author Contributions
Conceptualization, MY; methodology, MAA, MY; software, PC; formal analysis, MAA, PC, MY; data curation, MA, MBA, SSS, AC, MY; writing—original draft preparation, MAA, PC, and SA; writing—review and editing, MAA, MBA, SS, AC, AN, CS, LT, CB, and MY; visualization, MAA, PC; supervision, MY. All authors have read and agreed to the published version of the manuscript.
Declaration of conflicting interests
The author(s) declared no potential conflicts of interest with respect to the research, authorship, and/or publication of this article.
Funding
The author(s) received no financial support for the research, authorship, and/or publication of this article: This study was funded by the Medical Research Center in Hamad Medical Corporation (HMC), Qatar. (Ref. MRC-01-18-337).