
Abstract
This study aimed to establish and validate a comprehensive nomogram for predicting the cause-specific survival (CSS) probability in tonsillar squamous cell carcinoma (TSCC). We screened and extracted data from the SEER (Surveillance, Epidemiology, and End Results) database for the period 2004 to 2016. We randomly divided the 7243 identified patients into a training cohort (70%) for constructing the model and a validation cohort (30%) for evaluating the model using R software. Multivariate Cox stepwise regression was used to select predictive variables. The concordance index (C-index), the area under the time-dependent receiver operating characteristics curve (AUC), the net reclassification improvement (NRI), the integrated discrimination improvement (IDI), calibration plotting, and decision-curve analysis (DCA) were used to evaluate the model. The multivariate Cox stepwise regression analysis successfully established a nomogram for the 1-, 3-, and 5-year CSS probabilities for TSCC patients. The C-index, AUC, NRI, and IDI were all showed that the model has good discrimination. The calibration plots were very close to the standard lines, indicating that the model has a good degree of calibration, and the DCA curve further illustrated that the model has good clinical validity. We have established the first nomogram for predicting the 1-, 3-, and 5-year CSS probabilities for TSCC based on a large retrospective sample. Our rigorous validation and evaluation indicated that the model can provide useful guidance to clinical workers making clinical decisions about individual patients.
Introduction
Head and neck cancer includes many cancers of the oral cavity, oropharynx, and larynx. Tonsil cancer is a type of oropharyngeal cancer, with squamous cell carcinoma (SCC) being the most common histological type, as is also the case for other cancers of the head and neck. 1 According to an epidemiological study, tonsillar squamous cell carcinoma (TSCC) represents about 15 to 20% of all intraoral and oropharyngeal SCCs in the United States. 2 The incidence of oral cancer has declined in most parts of the world in recent years, whereas the incidence of oropharyngeal cancer has increased in several countries. 3 One study found that TSCC represented the largest proportion of cancers at pharyngeal sites. 4 However, the current understanding of tonsil cancer is insufficient, and its increasing incidence and different characteristics from other oropharyngeal cancers make it necessary to analyze it as an entity.
Some researchers have proposed that the etiology of TSCC differs from those of other oropharyngeal cancers, with TSCC patients also having a better prognosis. 5,6 Smoking and heavy drinking are recognized risk factors for head and neck cancer, but the prognostic factors for tonsil cancer remain unclear. Hammarstedt et al. found that while the incidence of lung cancer has decreased in males, the incidence of tonsil cancer is increasing by 2.6% annually. 7 Demographic characteristics such as age, race, and sex have also been identified as prognostic factors. 8,9 Surgery, radiation, and chemotherapy in various combinations are utilized in the management of head and neck squamous cell carcinoma. Limited or early-stage disease usually treated with surgery or radiation alone. For most patients with locally advanced disease, the treatment is multimodal, with either surgery followed by adjuvant radiation or chemoradiation as indicated by pathologic features or definitive chemoradiation. 10,11
The traditional American Joint Committee on Cancer (AJCC) staging system has always been an important reference for cancer treatment. However, the AJCC staging system lacks certain demographic and pathological characteristics, and has specific limitations when applied to the prognosis of TSCC. Therefore, a more-comprehensive and detailed prediction model is needed to provide comprehensive guidance to clinical workers in a convenient manner.
Nomograms are accurate but simple tools that are widely used in tumor prediction models. A nomogram can be used to calculate the survival probability in individual patients. 12 Many researchers have established nomograms of different cancers, such as lung cancer, 13 prostate cancer, 14 and bladder cancer, 15 but a nomogram specifically designed for TSCC has not been reported previously. In order to further explore the prognostic factors for TSCC and individualized treatments, we used relevant data from the Surveillance, Epidemiology, and End Results (SEER) database to establish and evaluate a TSCC nomogram.
This study analyzed some basic characteristics of TSSC patients in the SEER database and the treatment methods applied to them with the aim of establishing a comprehensive nomogram that incorporates the important demographic factors, clinicopathological characteristics, and treatment methods. Our novel nomogram can provide clinical workers with the survival probabilities of patients more comprehensively and on an individual basis, which makes it clinically superior to previous methods.
Patients and Methods
Data Sources and Research Factors
We screened and extracted data from the SEER database using the SEER*Stat software. Part of the SEER database is available to the public, and we additionally applied for access to the specific SEER chemotherapy database. 16 We extracted TSCC patients from the SEER database by selecting the primary sites of TSCC using the terms “C09.0 Tonsillar fossa,” “C09.1 Tonsillar pillar,” “C09.8 Overlapping lesion of tonsil,” and “C09.9 Tonsil, NOS.” Additionally, the following ICD-O-3 (third revision of the International Classification of Diseases for Oncology) histology/behavior codes for TSCC were selected: “8070/3: Squamous cell carcinoma, NOS,” “8071/3: Squamous cell carcinoma, keratinizing, NOS,” “8072/3: Squamous cell carcinoma, large cell, nonkeratinizing, NOS,” and “8083/3: Basaloid squamous cell carcinoma.”
We selected several factors that may be associated with the disease prognosis, including age at diagnosis, race, sex, marital status, tumor grade, tumor size, laterality, AJCC stage, surgery status, radiotherapy status, and chemotherapy status. The AJCC staging system is determined by the TNM staging system, so it includes tumor extension, lymph nodes metastasis, and distant metastasis. If these variables are included in the analysis together, it will lead to severe multicollinearity, so this study only included the AJCC staging system. The outcome variable was cancer-specific survival (CSS). The data obtained in this study from the SEER database do not include personally identifiable information, and so it was not necessary to obtain informed patient consents.
Date Sorting
We selected data on patients for whom complete basic information and information on survival time were available. The tumor grade is divided into 4 levels according to the SEER database. The 4-grade system describes the tumor as Grade I: well-differentiated; Grade II: moderately differentiated; Grade III: poorly differentiated; Grade IV: undifferentiated or anaplastic. 17 We employed the seventh edition of the AJCC staging system. Tumor size was divided into 3 grades: <2 cm, 2 to 4 cm, and >4 cm. Applying the above methods initially identified 9811 TSCC patients for the period 2004 to 2016. After excluding 2100 patients with unclear pathological grading, 38 with unknown AJCC stage, and 430 with unknown tumor size, the study finally included 7243 patients with TSCC. We randomly divided these patients into a training cohort (70%) to construct the model and a validation cohort (30%) to evaluate the model using R software (version 3.4.1, http://www.r-project.org). The data screening process is shown in Figure 1.

Flowchart of sample selection.
Nomogram and Statistical Analysis
A log-rank test performed after allocating all of the subjects to the 2 study groups demonstrated that there were no statistically significant intergroup differences. We then used SPSS Statistics software (version 23.0, IBM SPSS, Chicago, IL, USA) to describe the basic characteristics of all factors for the 2 study cohorts. The age at diagnosis was expressed as median and interquartile range (IQR) values, while other categorical variables were represented as frequencies and percentages. Cox regression was used to identify factors associated with CSS from TSCC (p = 0.05), and these factors were used to establish a nomogram for predicting the 1-, 3-, and 5-year CSS probabilities for TSCC. After establishing the nomogram, we employed a series of indicators to evaluate the model. The concordance index (C-index) and the area under the time-dependent receiver operating characteristics (ROC) curve (AUC) were used to evaluate the discrimination ability of the nomogram. The AUC and C-index are widely used, but their increment is not obvious when comparing 2 present models. Therefore, in order to determine whether the new model was advantageous, we also applied 2 relatively new indicators: the net reclassification improvement (NRI) and integrated discrimination improvement (IDI). The NRI is mainly used to compare the predictive powers of new and old models at a set tangent level, while the IDI considers different tangent lines, which can be used to assess the overall improvement of the model. 18,19 These 2 indicators are easy to calculate and understand in practical clinical applications.
We drew a calibration plot to visually reflect the difference between 2 values. The degree of calibration of a model reflects the degree of consistency between its predicted and actual values. The consistency of a model is better when its calibration curve is closer to the 45-degree standard line. Finally, we used the decision-curve analysis (DCA) curve to evaluate the clinical validity of the model. The abscissa and ordinate of a DCA curve are the threshold probability and net benefit, respectively, of the model. A model with a higher DCA curve provides a greater net benefit. 20
All of the statistical analyses were conducted with the SPSS Statistics and R software packages. SPSS Statistics software was used to describe the basic characteristics of the cohorts, while R software was used to randomly divide the data into training and validation cohorts, and perform the log-rank test. The Cox regression analysis, proportional-risk construction test, and the establishment and evaluation of the nomogram were completed using R software with the following R packages: survival, rms, foreign, survival, survival ROC, nricens, and DCA packages. A bilateral probability value of p < 0.05 was considered to be indicative of statistical significance.
Results
General Characteristics
After randomly dividing 7243 patients into 2 cohorts, we applied the log-rank test, and the obtained probability value (p = 0.8) indicated that there was no significant difference between these cohorts. We then used SPSS to describe the basic demographic and clinical characteristics of 2 cohorts, as listed in Table 1.
Demographic and Clinical Characteristics of the 2 Cohorts of Patients.
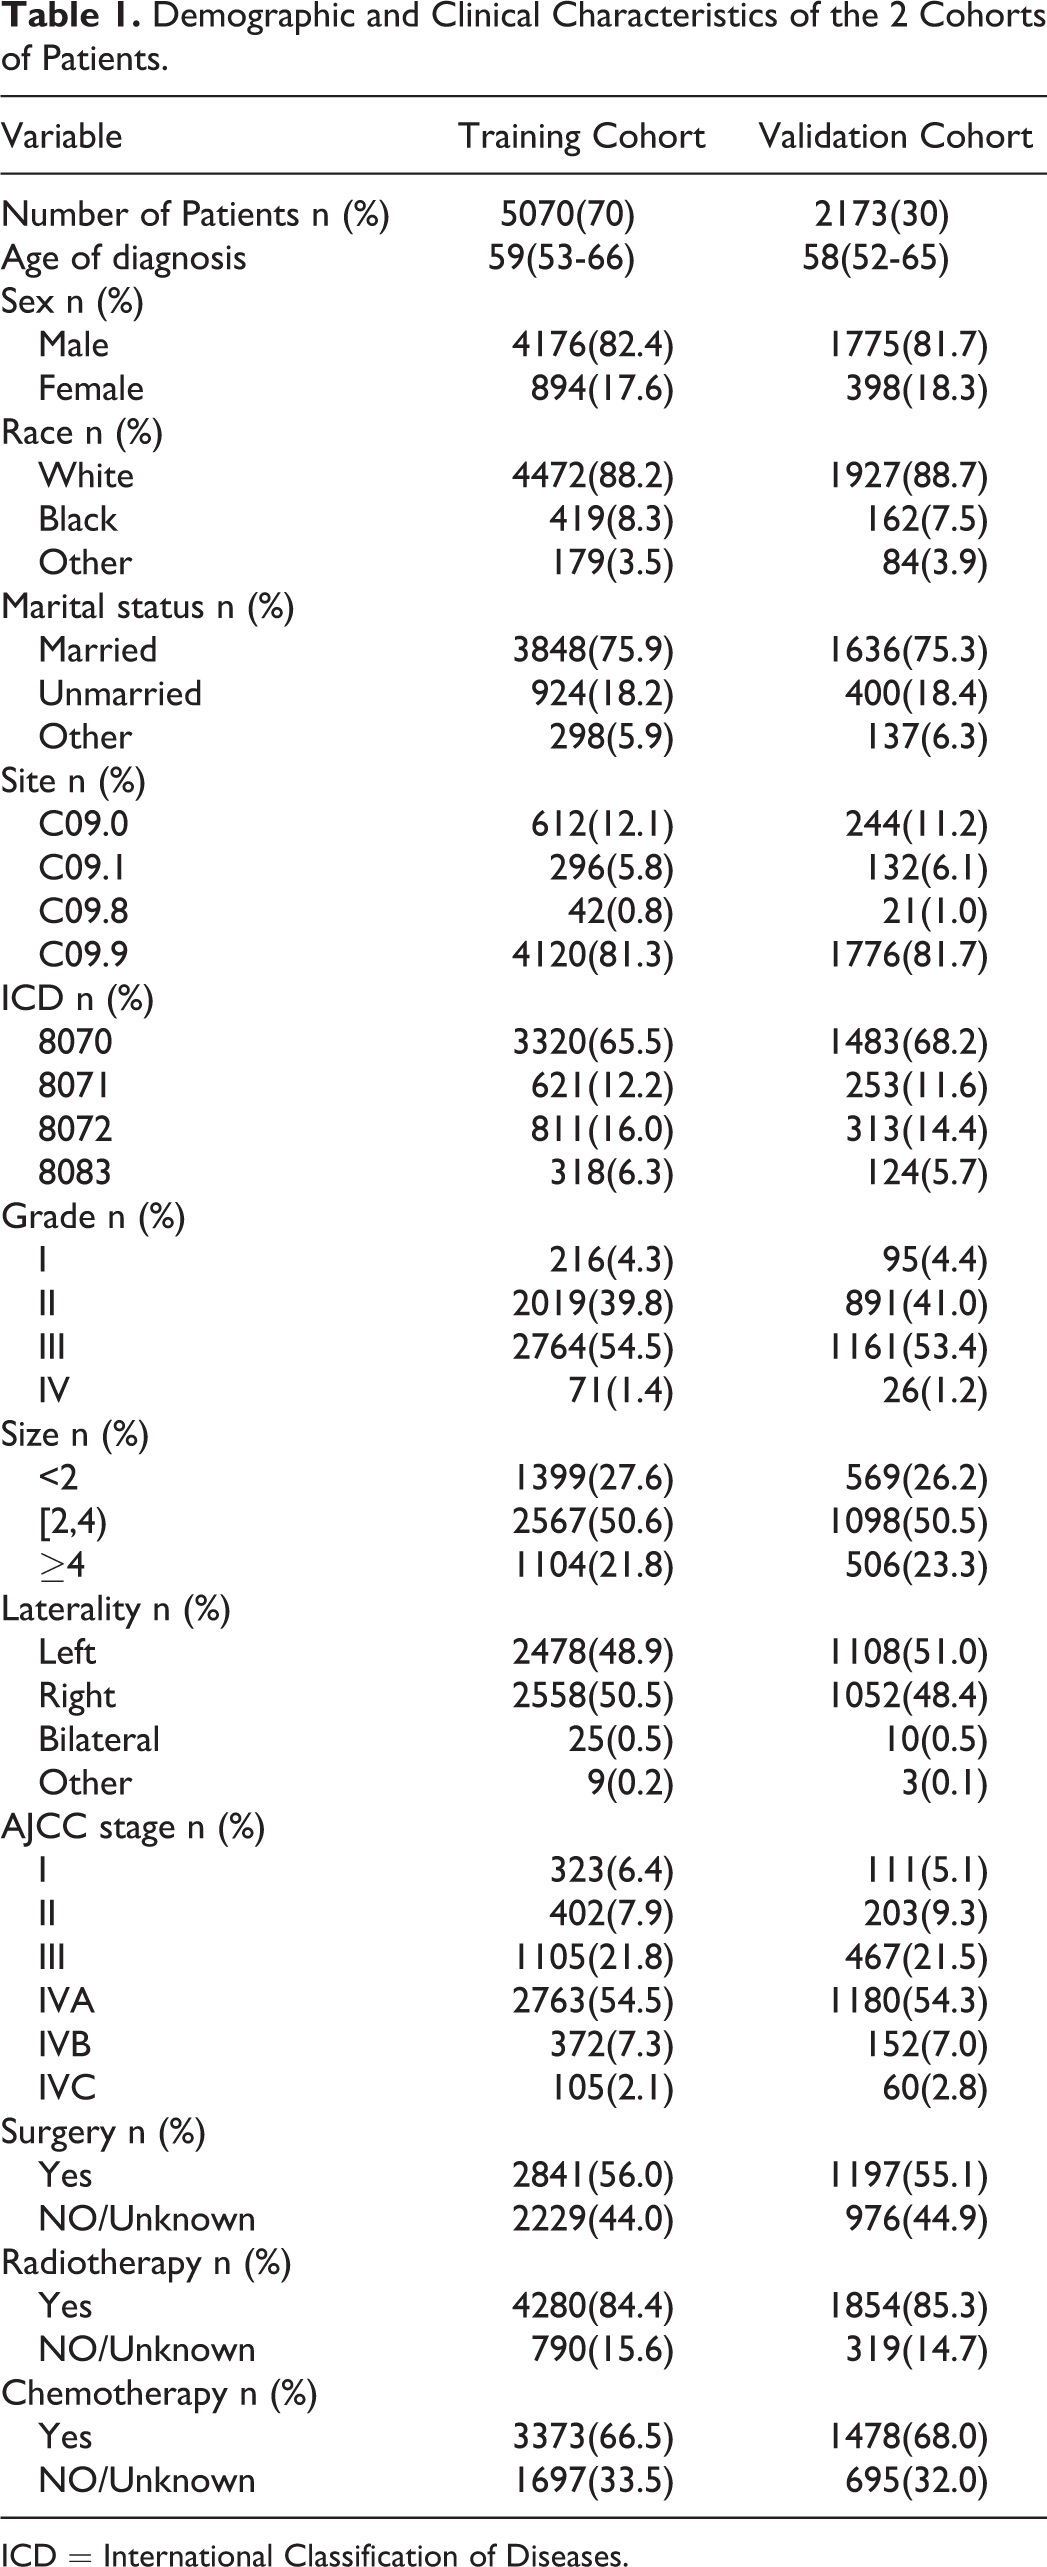
ICD = International Classification of Diseases.
The median age at diagnosis was 59 years (IQR = 53-65 years) in the training cohort and 58 years (IQR = 52-65 years) in the validation cohort. Most of the patients were male (82.4% and 81.7% in the training and validation cohorts, respectively), white (88.2% and 88.7%), and married (75.9% and 75.3%). The primary tumor site in most patients was C09.9, and the predominant histological type was 8070/3. Most patients had tumors of grade II (about 40%) and grade III (about 54%). About half of the patients (50.6% and 50.5% in the training and validation cohorts, respectively) had tumor diameters of 2 to 4 cm. The TSCC was on the left in 48.9% and 51.0% of those in the training and validation cohorts, respectively, and on the right in 50.5% and 48.4%. The AJCC stage for most patients was stage IVA. Most patients had received surgery, radiotherapy, or chemotherapy. The median survival time was 35 years (IQR = 19-55 months) in the training cohort and 34 years (IQR = 18-55 months) in the validation cohort.
Constructing a Nomogram Using the Training Cohort
After performing a multivariate Cox stepwise regression analysis, we screened out the following 8 factors related to CSS (p < 0.05): age at diagnosis, race, marital status, tumor grade, tumor size, AJCC stage, surgery status, and radiotherapy status. Table 2 details the variables that were significant after the multivariate Cox regression analysis, which were age at diagnosis (hazard ratio [HR] = 1.027, p < 0.001), black (HR = 1.549, p < 0.001 versus white), unmarried (HR = 1.340, p < 0.01 versus married), grade III (HR = 0.554, p < 0.001 versus grade I), grade IV (HR = 0.238, p < 0.05 versus grade I), size of 2 to 4 cm (HR = 1.377, p < 0.05 versus <2 cm), size >4 cm (HR = 1.988, p < 0.001 versus <2 cm), AJCC stage III (HR = 1.889, p < 0.05 versus AJCC stage I), AJCC stage IVA (HR = 2.946, p < 0.001 versus AJCC stage I), AJCC stage IVB (HR = 5.268, p < 0.001 versus AJCC stage I), AJCC stage IVC (HR = 14.319, p < 0.001 versus AJCC stage I), no/unknown surgery (HR = 2.460, p < 0.001 versus surgery), and no/unknown radiotherapy (HR = 2.646, p < 0.001 versus radiotherapy).
Selected Variables by Multivariate Cox Stepwise Regression Analysis.

HR = hazard ratio; ∗p < 0.05; ∗∗p < 0.01; ∗∗∗p < 0.001.
Figure 2 shows the nomogram that we finally constructed, which is a simple graph based on the multiple regression model that can be used to comprehensively predict the probability of CSS based on the above related indicators. Figure 2 shows that the AJCC stage has the greatest impact on survival rate, followed by age of diagnosis, surgery status, radiotherapy status, tumor size, and finally tumor grade, marital status, and race. Each factor is included as a line segment on the nomogram, and the numerical scale on the line segment indicates the degree of risk contributed by this factor. Adding the scores for all of the factors for an individual patient yields the total scores corresponding to the 1-, 3-, and 5-year CSS probabilities for that patient.

Nomogram predicting 1-, 3-, and 5-years CSS probability. Mari-marital status; Surg –surgery status; Rad – radiotherapy status.
Evaluating the Nomogram Using the Validation Cohort
The C-index of the nomogram model is 0.766 in the training cohort and 0.751 in the validation cohort. We then plotted the 1-, 3-, and 5-year ROC curves, and calculated the corresponding AUCs. The 1-, 3-, and 5-year AUCs were 0.837, 0.781, and 0.768, respectively, in the training cohort, and 0.788, 0.769, and 0.758 in the validation cohort (Figure 3).

ROC curves. The area under the ROC curve (AUC) for 1-, 3-, and 5-years CSS probability of the training cohort (A) and validation cohort (B).
We used NRI and IDI to evaluate the discrimination ability of the nomogram. The NRI values for 1-, 3-, and 5-year CSS probabilities were 0.370 (95% confidence interval [CI] = 0.306-0.464), 0.511 (95% CI = 0.426-0.599), and 0.487 (95% CI = 0.430-0.627), respectively, in the training cohort, and 0.357 (95% CI = 0.245-0.496), 0.545 (95% CI = 0.419-0.688), and 0.515 (95% CI = 0.345-0.637) in the validation cohort. The IDI values for 1-, 3-, and 5-year CSS probabilities were 0.050, 0.087, and 0.098, respectively (p < 0.001), in the training cohort, and 0.041, 0.071, and 0.082 (p < 0.001) in the validation cohort.
Calibration plots were used to verify the consistency between the actual and ideal values of the model after verifying its discrimination ability. As shown in Figure 4, the calibration plots for 1-, 3-, and 5-year CSS probabilities for the model are very close to the standard lines, indicating that the model has a good degree of calibration.
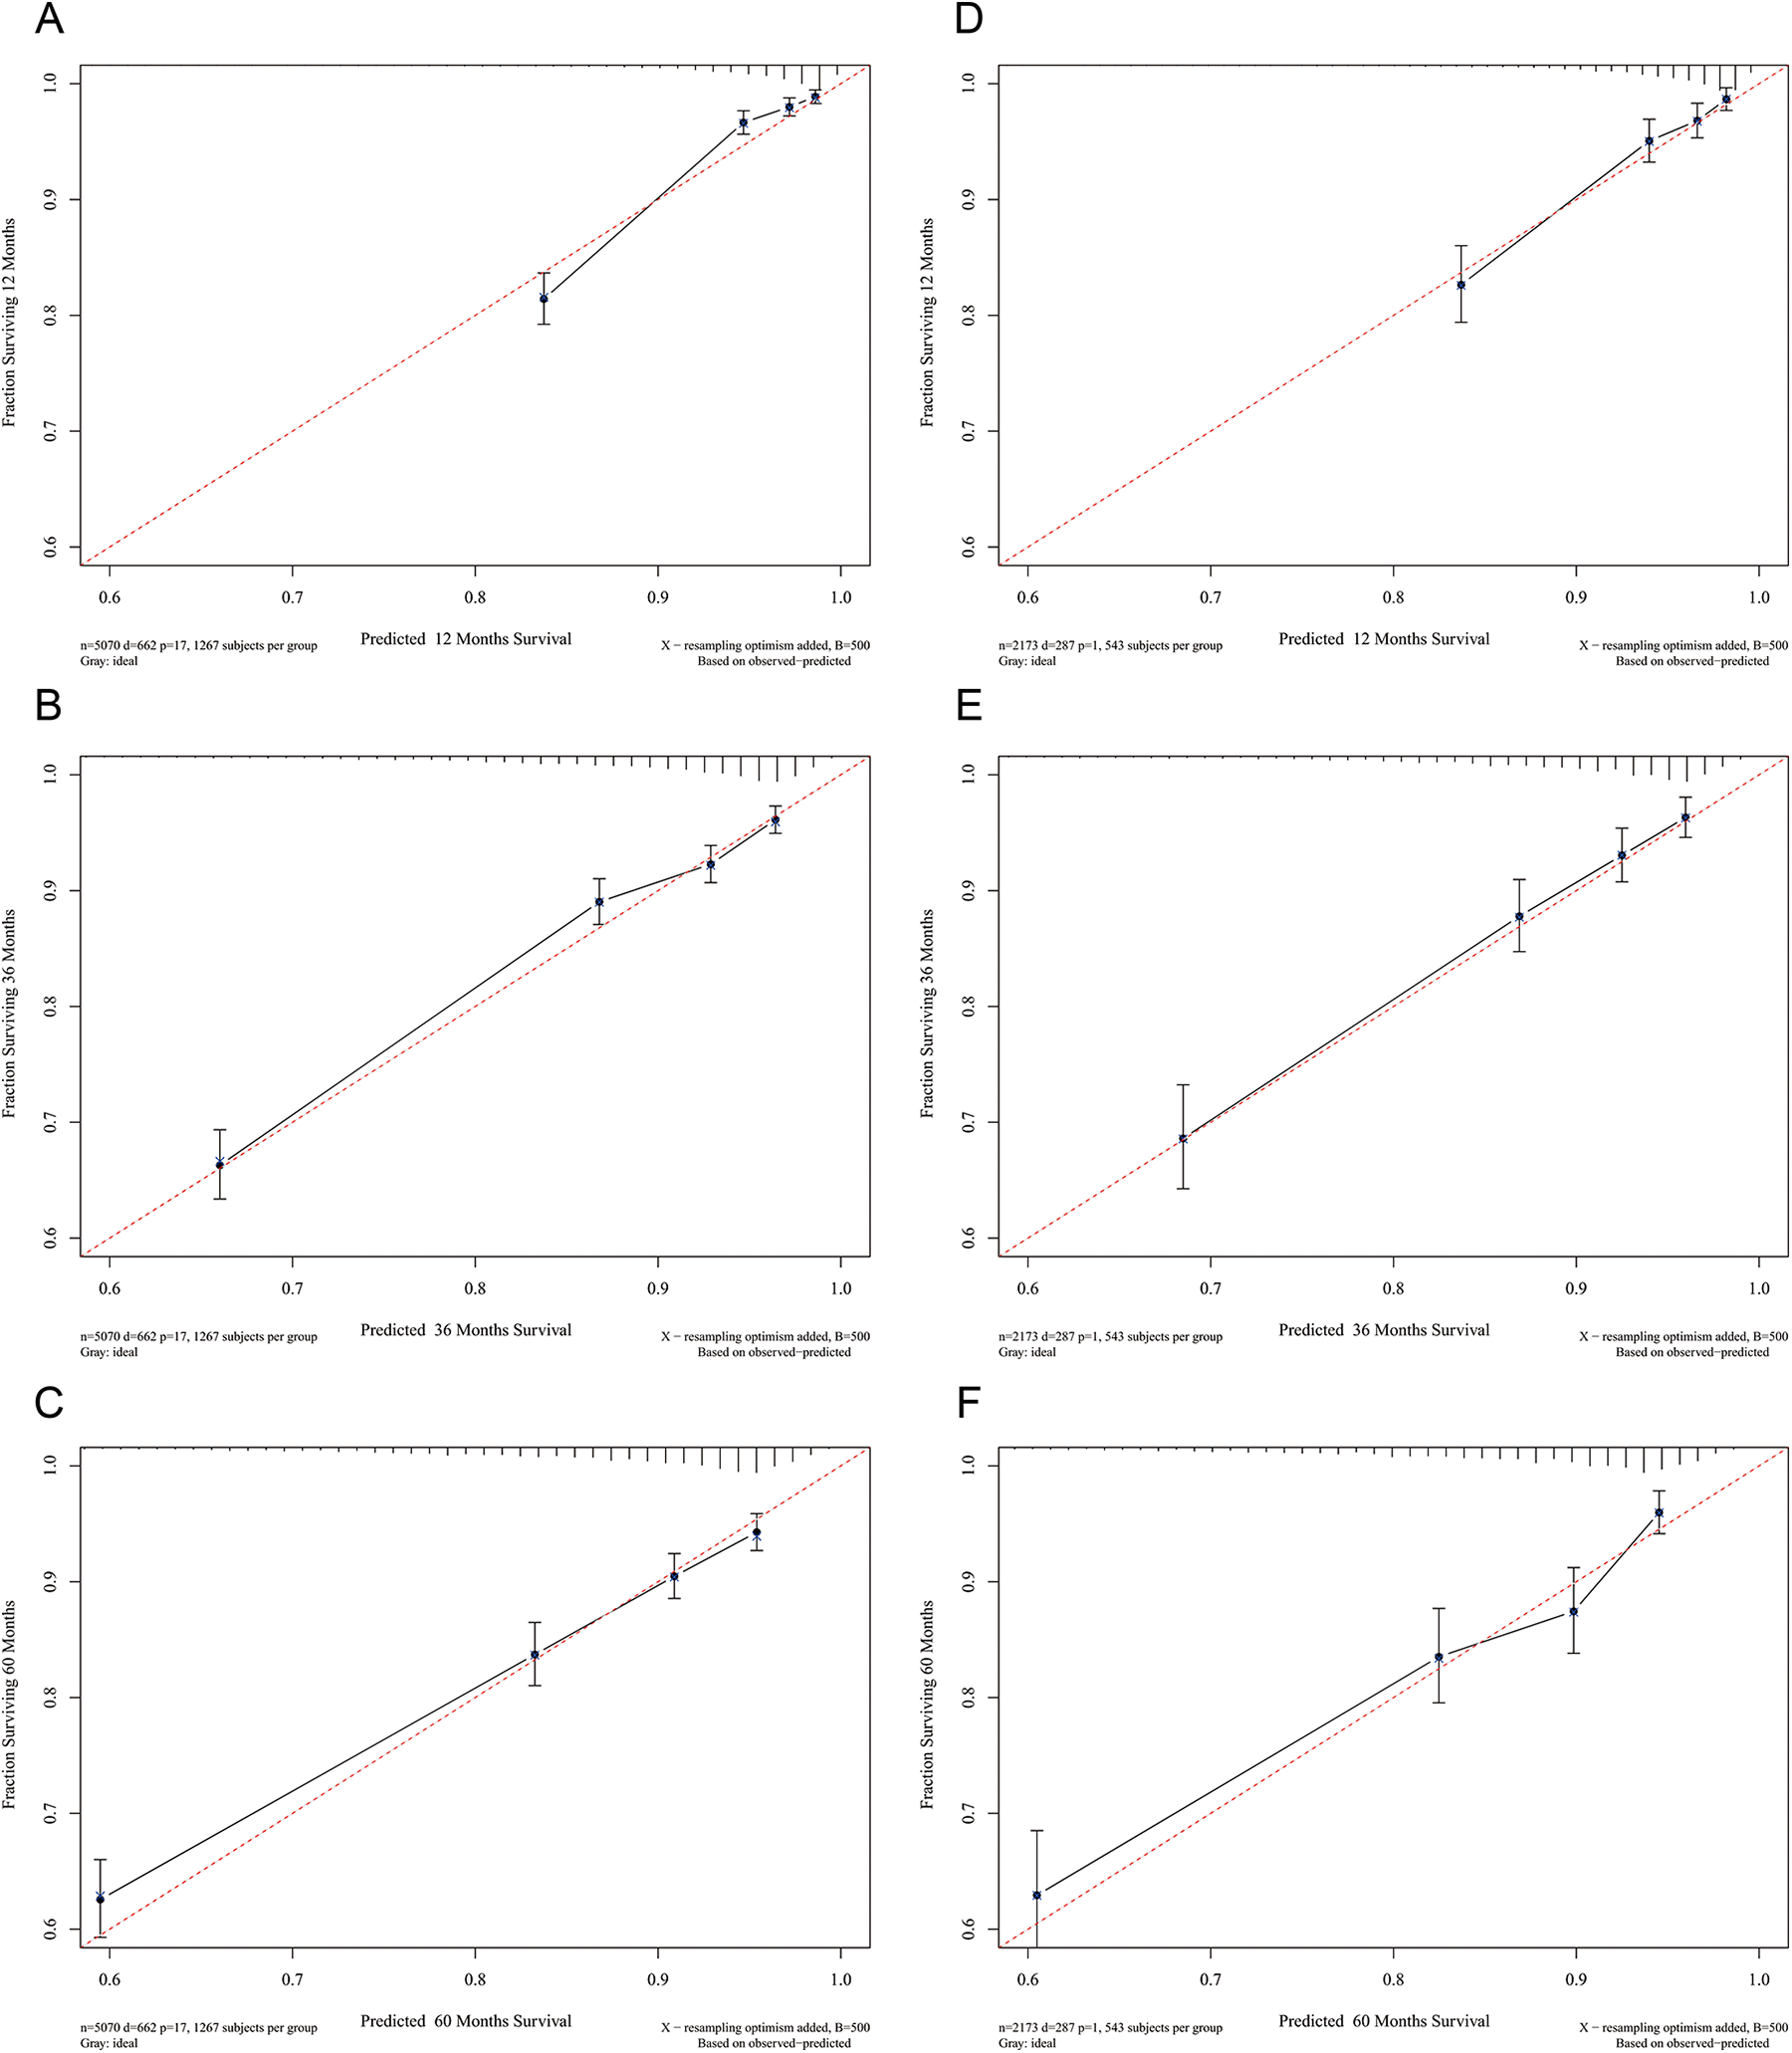
Calibration curves. Calibration curves for 1-, 3-, and 5-years CSS probability depict the calibration of each model in terms of the agreement between the predicted probabilities and observed outcomes of the training cohort (A, B, C) and validation cohort (D, E, F).
Finally, we plotted DCA curves to illustrate the clinical effectiveness of the nomogram. The survival probability curves for the new model in Figure 5 are all higher than those for the AJCC model, which means that the net benefits in using the model to predict the 1-, 3-, and 5-year CSS probabilities are significantly greater than those obtained when using the AJCC model.

Decision curve analysis curves. Decision curve analysis of the training cohort (A, B, C) and validation cohort (D, E, F) for 1-, 3-, and 5-years CSS probability.
Discussion
Head and neck cancer constitutes a complex system of tumors that can occur in many locations. Most of the published research studies have considered it as a single system, but tonsil cancer has characteristics that differ from those of other head and neck tumors, 21 and its incidence has increased recently in some countries. 22,23 In addition, tonsil cancer is more sensitive to radiotherapy and has a better prognosis than some other head and neck cancers. 24 These characteristics indicate the need to establish a specific clinical prediction nomogram for tonsil cancer in order to help clinicians to make better decisions. We therefore used the SEER database to successfully construct a prognosis nomogram based on a comprehensive analysis of the demographic characteristics and clinicopathological features. This study compared our novel model with the AJCC staging system to determine whether it is superior.
The results from the Cox regression as included in the nomogram show that the AJCC stage is the factor that has the greatest influence on the CSS probability, which is mainly due to the AJCC staging system containing information about the regional lymph node metastasis and distant metastasis, both of which are very important prognostic factors for TSCC. 25,26 Among demographic characteristics, age has always been an important prognostic factor for tumors, and the present results are no exception. In addition, being of black race presents a worse prognosis than being white or another race, which is consistent with the findings of a previous study. 27 The incidence of tonsil cancer was previously found to be higher in males than in females, 4 but sex was not a prognostic factor in the present study. A particularly interesting aspect of the present study is that few previous studies have explored the influence of marital status on the prognosis of TSCC, whereas this study found that being unmarried is a risk factor for the prognosis. In terms of clinicopathological features, there was no difference in prognosis between TSCC on the left and right sides. The size of the primary tumor is known to affect the choice of treatment, outcome, and prognosis. 28 Our study found that the tumor size significantly affected the TSCC CSS probability, as did the tumor grade. As can be seen from Figure 2, the prognosis is poor for well-differentiated tumors and good for poorly differentiated tumors, which might be due to poorly differentiated cells being more sensitive to chemotherapy or radiotherapy.
Surgery and radiotherapy treatment were also significant prognostic factors. Radiotherapy exerts different effects on head and neck tumors in different locations. 29,30 Radiotherapy is currently the preferred treatment modality in clinical practice, while the role of chemotherapy has not been report previously. The present study found that chemotherapy was not a prognostic factor for TSCC.
After constructing the nomogram and considering the identified prognostic factors, we performed a series of evaluations on the model, which are essential for any clinical prediction model before it is used in practice. We first verified the discrimination power of the model. The traditional ROC curve is a relatively intuitive method, 31 and Figure 3 shows that the AUC was >0.75 for the nomogram. This indicates that the nomogram has good overall discrimination performance. In addition, for survival data, the C-index is a more-general indicator for predicting the model discrimination ability. 32 The present results also show that the new model has a good discrimination ability. Compared with the AUC and C-index, the NRI focuses more on changes in the number of research objects correctly classified by the 2 models at a certain set of cutoff points, which are often used to compare the accuracies of the prediction abilities of 2 models. 33 The NRI shows that the proportions of correct classifications for the 1-, 3-, and 5-year CSS probabilities increased by 37.0%, 51.1%, and 48.7%, respectively, in the training cohort, and by 35.7%, 54.5%, and 51.5% in the validation cohort (p < 0.001). The IDI is another indicator that considers the situation of different cutoff points, which can be used to reflect the overall improvement of the model, and this to some extent complements the NRI. 34 The IDI values revealed that the new model has an improved prediction ability compared with the AJCC model for the 1-, 3-, and 5-year CSS probabilities, by 5.0%, 8.7%, and 9.8%, respectively, in the training cohort, and by 4.1%, 7.1%, and 8.2% in the validation cohort (p < 0.001).
The above-4 indicators clearly show that the nomogram has a good discrimination ability, and provides preliminarily evidence that the model has the ability to correctly classify the survival probability in TSCC patients. We further verified the calibration degree of the model by drawing a calibration plot. As can be seen in Figure 4, the calibration curve of the model is very close to the standard line and shows an even distribution, indicating that the incidence rates predicted by the model are very close to the actual incidence rates; that is, the model exhibits good consistency. Combined with the evaluation of the discrimination ability and calibration, the good overall performance of the model has been demonstrated, indicating that it can be used to predict the 1-, 3-, and 5-year CSS probabilities for TSCC patients.
Finally, we assessed the clinical effectiveness of the model. DCA is being employed by an increasing number of researchers to assess the net benefit to patients of receiving clinical treatment. The horizontal line in Figure 5 represents the net benefit of treating no males, while the oblique line represents the net benefit of a strategy of treating all males. 19,35 It can be seen from the figure that the overall net benefit of the new model is higher than that of the AJCC staging system, and that the threshold of the survival probability is higher. This indicates that the new model can bring greater net benefits to patients and help clinicians to make better clinical decisions.
This study naturally has some limitations. First of all, it had a retrospective design and analyzed data obtained from the SEER database, which may have resulted in information bias. The second limitation is that the study factors were not sufficiently comprehensive, with some genetic markers, biological markers, behavioral habits, and other factors not being included in the study. A future cohort study is needed to more-accurately identify the significant prognostic factors, especially HPV status or expression of P16. Incorporating more prognostic factors and validating the model with an external cohort to obtain the most-accurate results will be a focus of our future research.
Conclusion
In summary, we have established the first nomogram for predicting the 1-, 3-, and 5-year CSS probabilities for TSCC patients based on a large retrospective population. This nomogram contains both demographic and clinicopathological factors, and the rigorous validation and evaluation indicate that the model can provide useful and straightforward guidance to clinical workers making clinical decisions for individual patients. We look forward to building a more-comprehensive nomogram based on a wider range of data sources in the future.
Footnotes
Authors’ Contributions
Chengzhuo Li and Jin Yang contributed equally to this work. JL and CZL designed the study; JY, SZ, and FSX collected and analyzed the data; YJ collected important background information; CZL drafted the initial manuscript; SPW and JL revised the article critically; DDH, LB, and YLW reviewed and edited the article; CZL and JY are co-first authors; SPW and JL are correspondence authors. All authors approved the final manuscript.
Declaration of Conflicting Interests
The author(s) declared no potential conflicts of interest with respect to the research, authorship, and/or publication of this article.
Ethics Statement
SEER collects cancer incidence data from population-based cancer registries covering approximately 34.6 percent of the U.S. population. SEER releases a standard set of research data every spring based on the previous November’s submission of data from the registries. Because the database used contains publicly available information and no personal identifiers, the study did not require approval of the Institutional Reviewer Board. We accessed these through the SEER*Stat software with additional approvals.
Funding
The author(s) disclosed receipt of the following financial support for the research, authorship, and/or publication of this article: The study was supported by The National Social Science Foundation of China (grant no. 16BGL183).