
Abstract
Low-grade gliomas (LGGs) are a highly heterogeneous group of slow-growing, lethal, diffusive brain tumors. Temozolomide (TMZ) is a frequently used primary chemotherapeutic agent for LGGs. Currently there is no consensus as to the optimal biomarkers to predict the efficacy of TMZ, which calls for decision-making for each patient while considering molecular profiles. Low-grade glioma data sets were retrieved from The Cancer Genome Atlas. Cox regression and survival analyses were applied to identify clinical features significantly associated with survival. Subsequently, Ordinal logistic regression, co-expression, and Cox regression analyses were applied to identify genes that correlate significantly with response rate, disease-free survival, and overall survival of patients receiving TMZ as primary therapy. Finally, gene expression and methylation analyses were exploited to explain the mechanism between these gene expression and TMZ efficacy in LGG patients. Overall survival was significantly correlated with age, Karnofsky Performance Status score, and histological grade, but not with IDH1 mutation status. Using 3 distinct efficacy end points, regression and co-expression analyses further identified a novel 4-gene signature of ASPM, CCNB1, EXO1, and KIF23 which negatively correlated with response to TMZ therapy. In addition, expression of the 4-gene signature was associated with those of genes involved in homologous recombination. Finally, expression and methylation profiling identified a largely unknown olfactory receptor OR51F2 as potential mediator of the roles of the 4-gene signature in reducing TMZ efficacy. Taken together, these findings propose the 4-gene signature as a novel panel of efficacy predictors of TMZ therapy, as well as potential downstream mechanisms, including homologous recombination, OR51F2, and DNA methylation independent of MGMT.
Background
Gliomas account for 80% of primary malignant central nervous system tumors in adults. 1 They represent a widely heterogeneous group of tumors with varying clinical behaviors and prognoses stemming from complex molecular profiles. Gliomas are derived from glial cells and occur primarily in the brain. 2 Previous classification system describes gliomas as astrocytic (ie, astrocytoma), oligodendrocytic (ie, oligodendroglioma), or a mix of these 2 cell types (ie, oligoastrocytoma). A recent update in the World Health Organization (WHO) classification in 2016, necessitated by the heterogeneity of these cancers, have taken into consideration both tumor phenotype and genotypes, such as molecular distinction and prognostic features. 3
Based on WHO grade, gliomas can be grouped into high- and low-grade gliomas (LGGs), the latter representing approximately 15% of primary brain tumors. 4 While high-grade gliomas (HGGs, WHO grade III and IV) have a median survival of 1 to 2 years, median survival time for LGG patients is between 5 and 10 years. 5 Although LGGs display less malignant behavior, malignant transformation occurs in most LGG patients, ultimately leading to death. 6
Molecular characterizations have enabled grouping LGGs into 3 subtypes based on mutation status of IDH1 and IDH2. 6 Low-grade gliomas with a mutated IDH1/2 can harbor 1p/19q codeletion, showing mutations in CIC, NOTCH1, FUBP1, and TERT promoter, and display the most favorable clinical outcome. The IDH1/2-mutant LGGs lacking 1p/19q codeletion mostly harbor TP53 mutation (94%) and ATRX inactivation (86). On the other hand, the majority of LGGs without an IDH1/2 mutation showed highly similar molecular and clinical behavior to those of primary glioblastoma, a major form of HGG, and therefore exhibit the least favorable outcome. 7
To date, surgical resection has been established as the mainstay of first-line treatment options for LGG patients, as a higher extent of resection was shown in several studies to correlate with extended survival. 8 -10 However, the highly infiltrative nature of LGGs often poses challenge to surgery, as larger tumors tend to expand into the eloquent areas of the cortex, thereby hindering gross total resection. Radiotherapy and chemotherapy, administered in combination or as monotherapies, constitute significant complementary options to surgery, although each suffers side effects and limitations, such as toxicity and resistance. As a result, the optimal treatment for LGGs remains controversial. 3,11
Among the chemotherapeutic agents against LGGs, temozolomide (TMZ) has gained growing attention due to potentially lessened side effects 3 1. First introduced as a radiosensitizer, to date TMZ is the most effective first-line chemotherapy option for glioblastomas, and has been shown to elicit response in other tumors such as melanomas, pituitary tumors, and lung cancers. 12,13 Temozolomide functions as an alkylating agent by binding to O6-guanine, leading to DNA mismatch and cell apoptosis. 12 The O6-methylguanine-DNA methyltransferase (MGMT), which removes methyl groups from O6-guanine, can therefore offset the effect of TMZ, leading to resistance after prolonged exposure. 3 However, despite progress made by recent studies and clinical trials, several aspects of TMZ therapy remain to be more thoroughly characterized, including relative efficacy and toxicity in comparison to procarbazine, 1-(2-chloroethyl)3-cyclohexyl-1-nitrosurea (CCNU), and vincristine (procarbazine [PCV]) combined therapy, clinical outcomes of radiation plus TMZ therapy, 6,14 -17 as well as association between response to TMZ treatment and molecular profiles such as, and not limited to, IDH1/2 status. 18 -21
A number of prognostic factors for response to TMZ therapy have been proposed, such as seizure reduction 22 and a model of tumor growth inhibition. 23 Notably, molecular markers supplementary to IDH1/2 status 20 and 1p/19q codeletion 3 have been reported, including intrinsic glioma subtyping based on gene expression profile 24 and methylation on DNA damage response (DDR) genes MGMT, MLH3, RAD21, and SMC4. 25
In this study, we revisited existing data by mining the LGG data sets from The Cancer Genome Atlas (TCGA) with a comprehensive set of bioinformatics analyses. Regression and survival analyses were applied to identify clinical features significantly associated with overall survival (OS). Subsequently, using 3 distinct efficacy end points, regression and co-expression analyses further identified a novel panel of 4 genes, ASPM, CCNB1, EXO1, and KIF23, which correlated significantly with survival of patients who received TMZ therapy. Finally, gene expression and methylation analyses identified a largely unknown olfactory receptor OR51F2 as potential mediator of the 4-gene signature in determining response to TMZ treatment in LGG patients.
Methods
Data Acquisition and Normalization
All operations were conducted with R, a bioinformatics toolset, and relevant packages (TCGAbiolinks). A data set containing information of 512 low-grade glioma cases was downloaded from the TCGA. This data set includes expression levels of a total of 60 484 messenger RNAs
Cox Regression Analysis and Kaplan-Meier Survival Analysis
Cox regression analysis was used to evaluate the association between survival rate and a series of clinical features, including age, sex, pathological subtype, and stage. An association with a significance level of less than .05 (P < .05) was deemed statistically significant.
Kaplan-Meier survival analysis was performed with the R package survival, in order to estimate survival rate and to construct survival curves. Differences among the survival curves of different groups were analyzed with log-rank test. A difference with a P < .05 was considered statistically significant.
Ordinal Logistic Regression
We used cumulative link models to identify correlation between miRNA expression and response to TMZ treatment. A cumulative link model is a model for ordinal-scale observations and can be represented by a random variable Yi that takes a value j, if the ith ordinal observation falls in the jth category, where j = 1,…, J (J ≥ 2). A basic cumulative link model can be expressed as follows:

where

are cumulative probability, ηij the linear predictor, and
Protein–Protein Interaction Network Analysis and Visualization
The STRING database was used for constructing a network of the proteins encoded by genes deemed to be significantly associated with LGG survival after the previous screening. STRING is a database of known and predicted protein–protein interactions. 26 Interactions in the database, including direct (physical) and indirect (functional) associations, stem from a multitude of sources such as computational prediction, reported experiments, and other databases. The resulting network was visualized in Cytoscape (version 3.6.1), an open source software platform for visualizing complex networks.
Gene Co-Expression Network Analysis and Cluster Analysis
The R package pheatmap was used in gene co-expression network analysis on the genes deemed to be significantly associated with LGG survival after the previous screening. Pearson correlation coefficient between expressions of a pair of genes was used to assess the level of co-expression. Correlations with P < .05 were considered statistically significant.
Subsequently, a hierarchical cluster analysis was performed. In brief, hierarchical clustering starts by calculating the distance between every pair of observation points and store it in a distance matrix. It then puts every point in its own cluster. Then it starts merging the closest pairs of points based on the distances from the distance matrix and as a result the amount of clusters goes down by 1. Then it re-computes the distance between the new cluster and the old ones and stores them in a new distance matrix. Lastly, it repeats steps 2 and 3 until all the clusters are merged into one single cluster. To be specific, we use “Euclidean distance” to calculate distance between data points, we use “Complete-linkage” to calculate the maximum distance between clusters before merging.
Differential Expression Analysis and Differentially Methylated Regions Analysis
We used the raw count matrix to identify differentially expressed genes with the R package edge. Briefly, count matrix was first converted into an edgeR object. Then, each gene was assigned with the same dispersion estimate and subjected pair-wise tests for differential expression between 2 groups. Finally, raw P values were adjusted with False Discovery Rate correction.
As for differentially methylated regions (DMR) analysis, β values (methylation values ranging from 0.0-1.0) were used to identify CpG sites differentially methylated in 2 groups. Briefly, for each probe, we calculated the difference between the mean methylation level of each group, which was used to yield a P value, using the Wilcoxon signed-rank test with the Benjamini-Hochberg adjustment method. Results from the differential expression analysis and DMR analyses were visualized in a starburst plot.
Results
Research Workflow
After retrieval from the TCGA database, the data set compiled of cases of primary LGGs, containing expression level of gene (511 cases) and miRNA expression (512 cases), was first sorted by clinical features and subjected to Cox regression analysis to identify factors associated with patient survival after TMZ treatment (Figure 1).
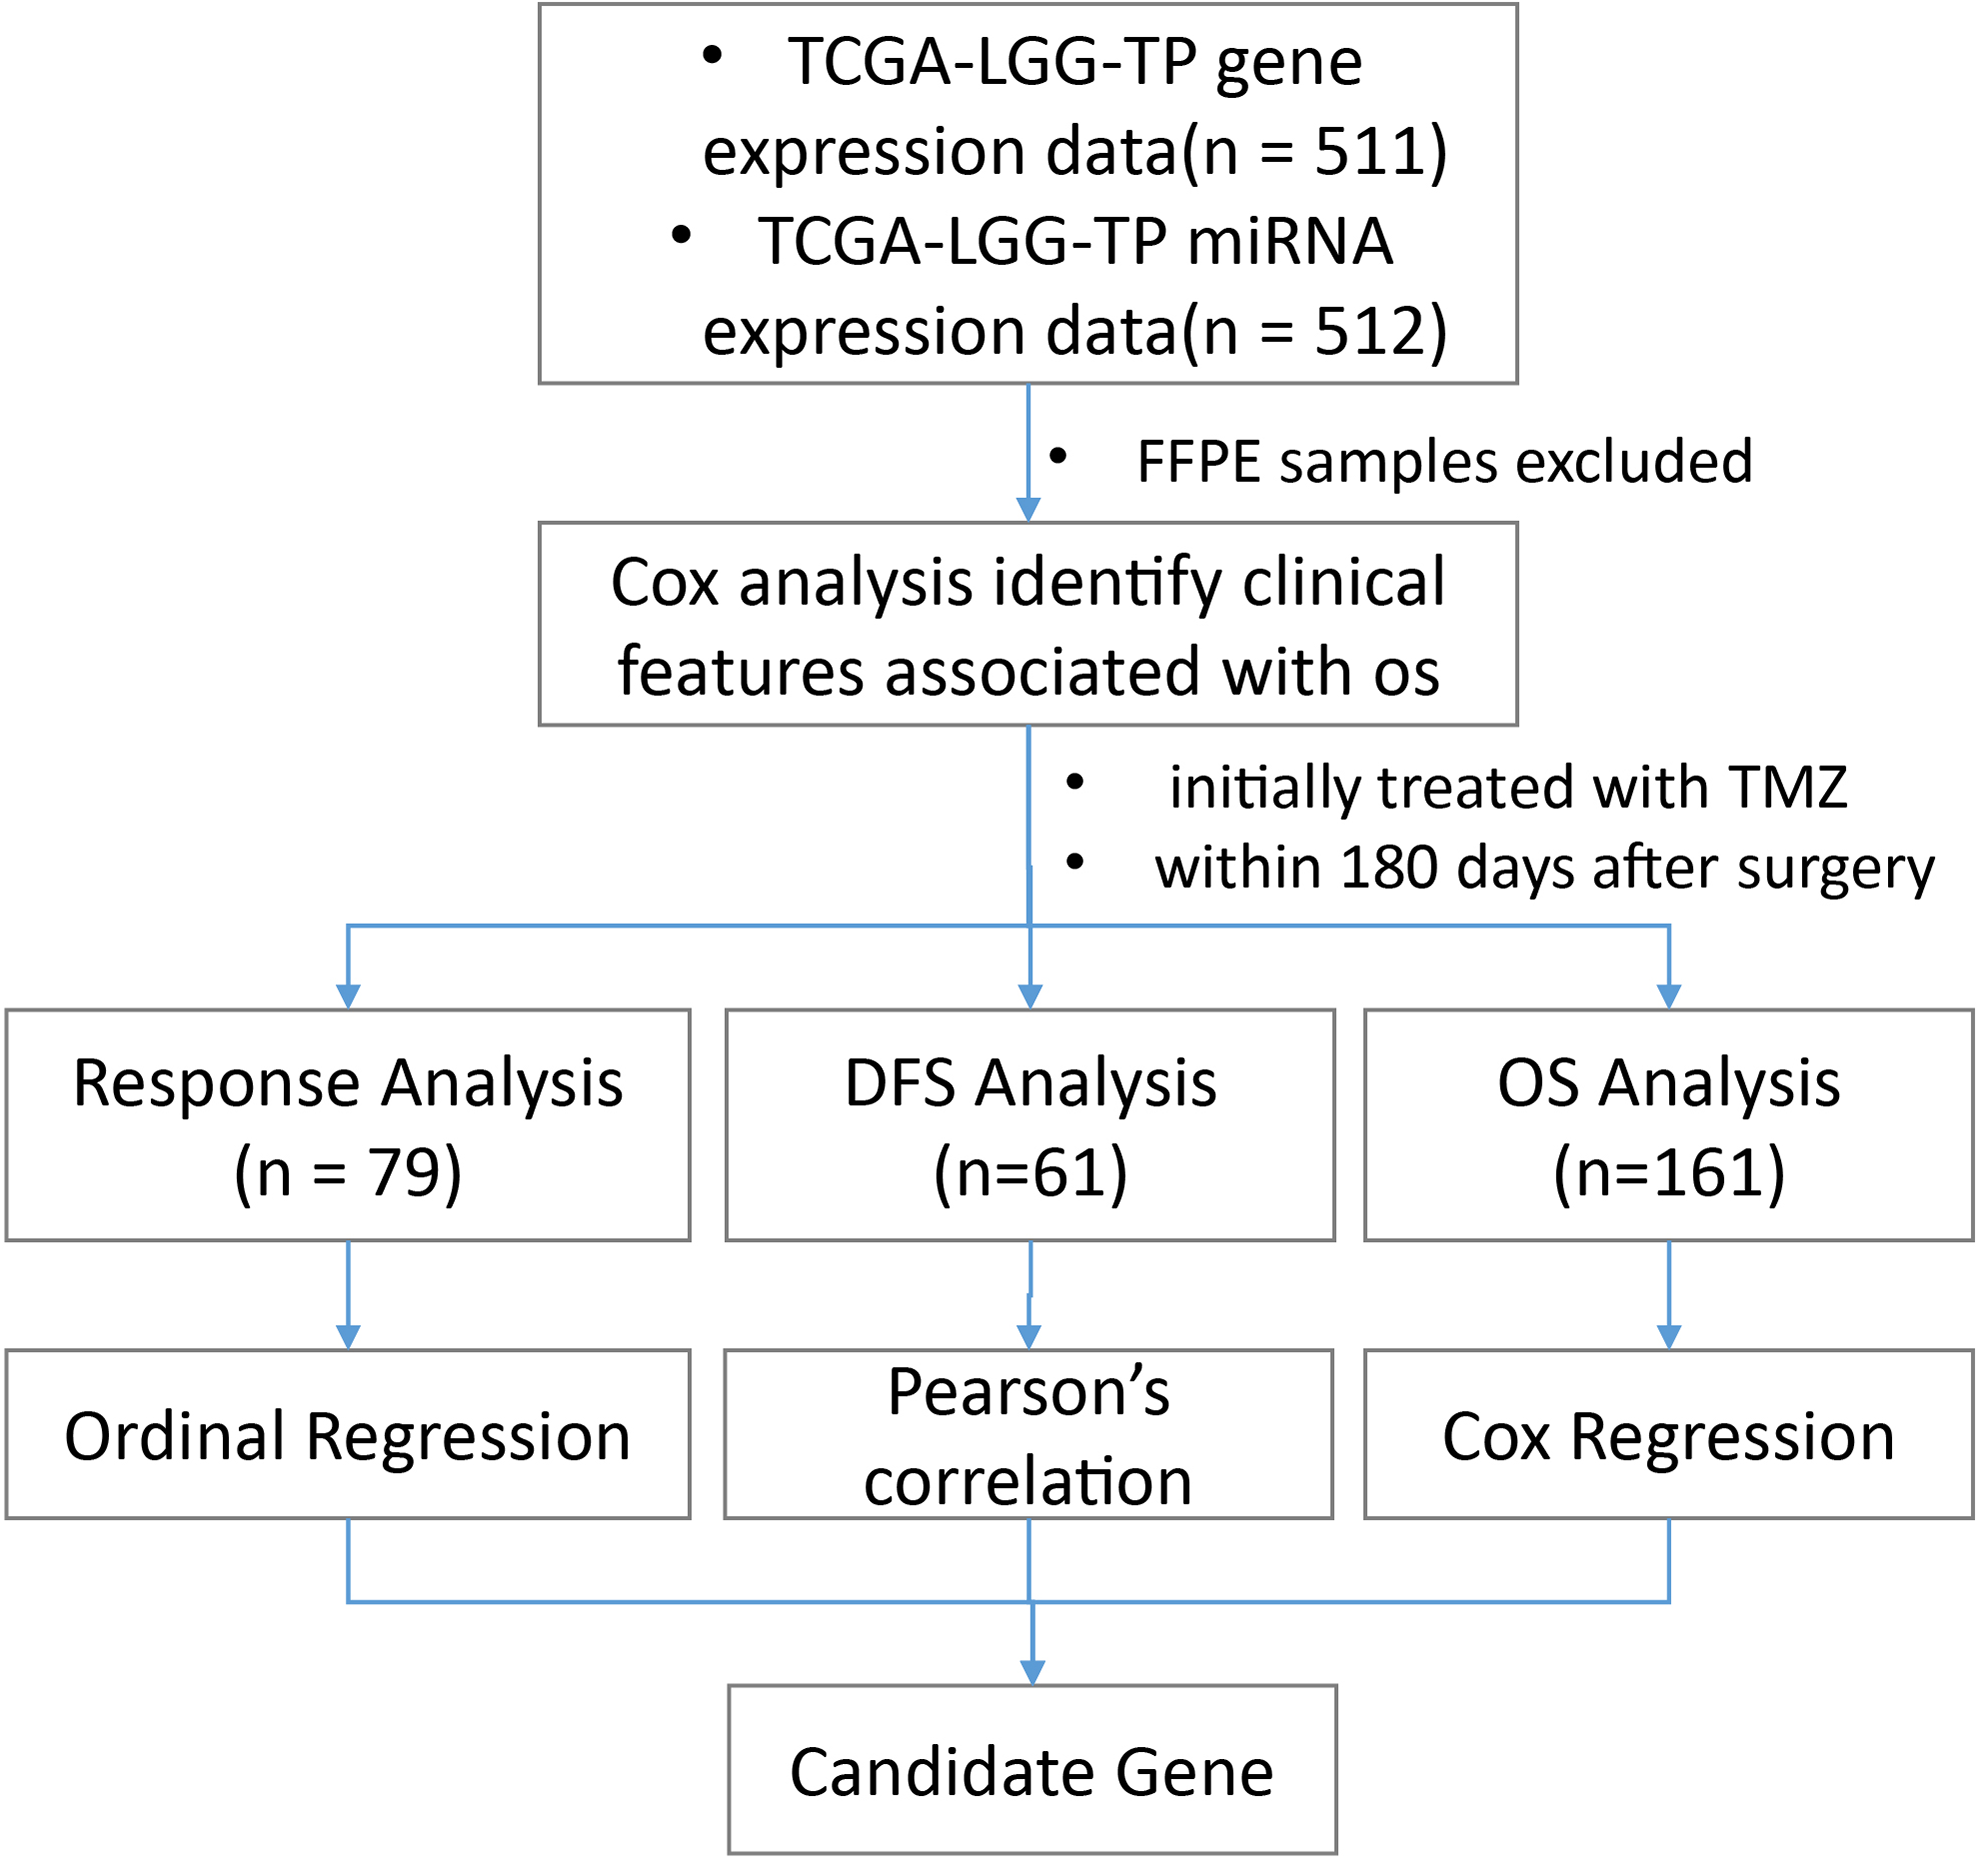
A flowchart showing the strategy adopted in this study. After exclusion of paraffin-embedded samples, patient information data sets were first subjected to Cox regression analysis for identifying clinical features significantly associated with overall survival. Afterward, we selected patients initially treated with TMZ within 180 days after surgery, and examined the correlation between mRNA/miRNA expression and 3 efficacy indicators, response evaluation, DFS, and OS. DFS indicates disease-free survival; OS, overall survival; TMZ, temozolomide; TP, primary tumor.
Then, we selected patients whose initial treatment within 180 days after surgery was with TMZ. We postulate that these patients received TMZ as primary therapy and used their data to identify potential predictor genes (mRNAs and miRNAs) of the efficacy of TMZ treatment. 27
Specifically, we started with Response Evaluation, which was defined as primary_therapy_outcome_success. Most data with a response value fall under the 2 categories of KPS (Karnofsky Performance Status) score <80 to 100 and age <60. Seventy-nine cases with response values, while also fulfilling 2 more criteria (KPS 80 to 100 and age < 60), were selected and subject to ordinal logistic regression to identify mRNAs/miRNAs showing strong correlations with response.
Subsequently, we examined the occurrence of new tumor events after primary therapy, due to the large number of missing disease-free survival (DFS) data points (days_to_new_tumor_event_after_initial_treatment), we chose not to replace them with follow-up data in cases where DFS values were absent. Instead, cases were screened based on the presence of DFS value, and whether there was new tumor event after initial treatment (new_tumor_event_after_initial_treatment = YES). A total of 61 cases were selected for screening for genes (mRNAs and miRNAs) whose expression significantly correlated with DFS intervals.
A third indicator for assessing drug treatment efficacy, OS, was defined as days_to_death for deceased patients, and days_to_last_follow-up for those who were alive at the time of the last follow-up. A total of 161 valid OS data were selected and analyzed with Cox regression for identification of genes significantly correlated with OS.
These correlation analyses resulted in 3 sets of genes, listing mRNAs and miRNAs whose expression levels exhibited significant correlations with response, occurrence of new tumor events interval, and OS, respectively. Genes present in all 3 sets were taken as candidate factors in predicting the outcome of TMZ treatment (Figure 1).
Identification of OS-Associated Clinical Features
Cox regression analysis was performed on 504 cases to examine the association of OS with a series of clinical features. An overview of the results is shown in Table 1. Age, KPS score, and histological grade all showed significant correlation with OS, which was consistent with previous reports. 18,28 As for histological type, patients with oligodendroglioma showed a significantly extended OS than those with astrocytoma. On the other hand, no significant association was observed between OS and several other factors, such as race, tumor location, IDH1 mutation status, and family history of cancer or primary brain tumor (Table 1), partly contrary to previous conclusions associating race and IDH1/2 mutation with prognosis. 7,19
Correlation Between OS and Different Clinical Features in the LGG Patient Data Sets was Examined With Cox Regression Analysis. Age, KPS Score, and Histological Grade Showed Significant Correlation With OS.

Abbreviations: CI, confidence interval; HR, hazard ratio; KPS, Karnofsky performance status; LGG, low-grade gliomas; NA, not available.
Interestingly, type of data collection, namely prospective or retrospective collection, displayed significant correlation with OS in univariate (P = .038) but not in multivariate Cox analysis, suggesting that care should be taken in choosing the type of data and analytical methods to minimize potential interference resulting from selection bias.
Next, we performed Kaplan-Meier survival analysis on cases grouped by age, KPS score, histological grade, and histological type. As shown in Figure 2, consistent with results from Cox analysis, patients grouped by each of the 4 clinical features showed significantly different OS. Specifically, compared to the corresponding groups, the curves indicate significant reduction in OS in patients younger than 60 years old (vs group age > 60), assigned KPS scores less than 80 (vs group KPS 80 to 100), with astrocytoma (vs the oligoastrocytoma and oligodendroglioma groups), or with LGG at stage G3 (vs group G2).

Kaplan-Meier survival curves for overall survival of patients grouped by (A) age, (B) KPS score, (C) histological grade, and (D) histological type. Consistent with results from Cox regression analysis, compared to the corresponding groups, the curves indicate significant reduction in overall survival in patients younger than 60 years old (vs group age >60), assigned KPS scores less than 80 (vs group KPS 80 to 100), with astrocytoma (vs the oligoastrocytoma and oligodendroglioma groups), or with LGG at stage g3 (vs group g2). KPS indicates Karnofsky Performance status; LGG, low-grade gliomas.
Identification of Candidate Predictor mRNAs of TMZ Efficacy
In order to investigate the association between mRNA expression and response to TMZ treatment, patients who received TMZ as initial treatment within 180 days after surgery were selected. Three drug efficacy indicators were used, including Response (79 valid data points), DFS (61 valid data points), and OS (161 data points).
Ordinal logistic regression was applied to examine Response-associated mRNA expression, and identified 6334 mRNAs whose expression levels exhibited significant correlation with Response (P < .05). Similarly, correlation analysis revealed 2794 mRNAs whose expression levels were closely associated with DFS (P < .05). Additionally, univariate Cox regression showed 7940 significantly OS-associated mRNAs. An intersection of these 3 sets contained 798 mRNAs, which were regarded as candidate predictors of TMZ efficacy.
Co-expression among these 798 mRNAs were examined by correlation analysis. The resulting co-expression pairs were clustered based on the strength of the correlation (Figure 3). For further analyses, co-expression pairs with correlation coefficients greater than 0.6 were selected, which amounted to 591 mRNAs.

Heat map diagram of co-expression patterns among the 798 candidate response predictor mRNAs. Pairwise correlation of expression levels of the corresponding mRNAs was conducted and clustered based on strength of correlation. Stronger co-expression, either positive (red) or negative (blue), are presented in darker shades, while pairwise comparisons showing no co-expression are colored yellow (see scale at the top right corner).
Afterward, an interaction network among these 591 mRNAs was constructed using protein–protein interaction data from the STRING database. As indicated in Figure 4, where a larger node represents a larger collection of interacting nodes, several mRNAs play the roles of prominent hubs in the resulting network. For further analysis, nodes with at least 20 interacting partners were selected, resulting in nine mRNAs, namely CCNB1, MYC, EHMT2, ACACB, EXO1, ASPM, HIST3H2BB, KIF23, and IMPDH2. Correlation levels between expression levels of these mRNAs and the 3 indicators used in this study (response, DFS, and OS) is listed in Table 2.

Protein–protein interaction map showing the interactions among the proteins encoded by the 591 genes resulting from the aforementioned rounds of screening. A larger node represents a larger collection of interacting nodes, indicating more interacting partners for the corresponding gene.
Correlation Between Different End Points and Expression Levels of the 9 mRNAs That Play Central Roles in the Interaction Network Shown in Figure 4.
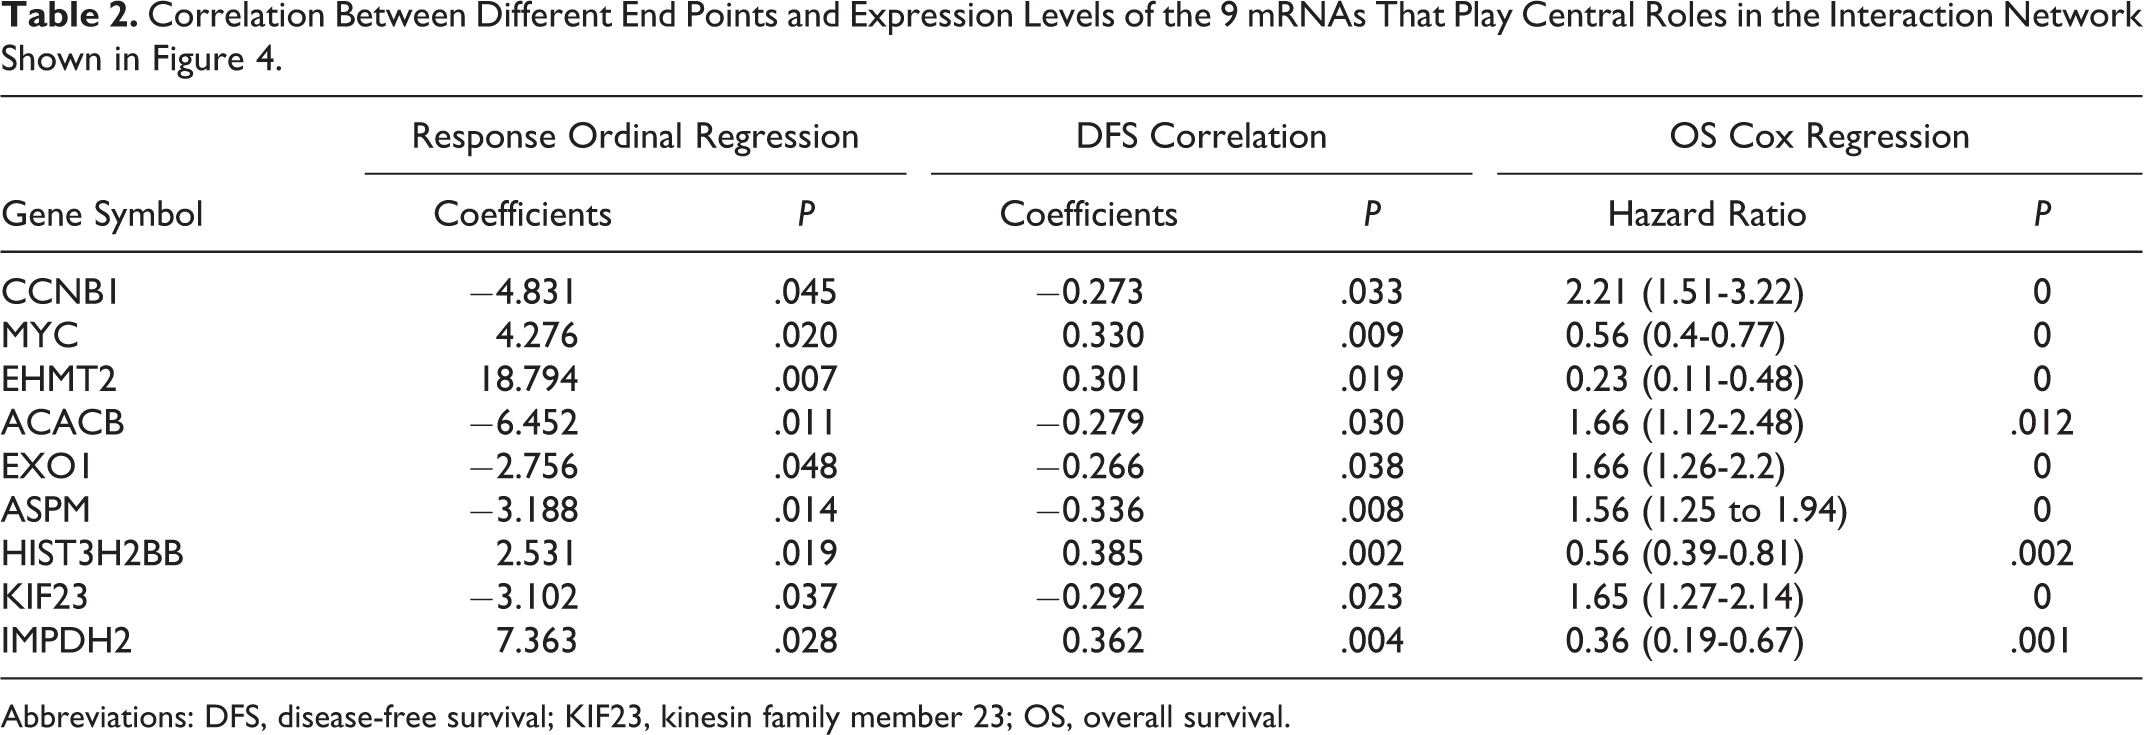
Abbreviations: DFS, disease-free survival; KIF23, kinesin family member 23; OS, overall survival.
Identification of Candidate Predictor miRNAs of TMZ Efficacy
Starting from miRNA expression data from the same cases used in the previous section, we identified 100 miRNAs significantly associated with Response (through ordinal logistic regression, P < .05), 33 with DFS (through correlation analysis, P < .05), and 112 with OS (through univariate Cox regression, P < .05). Eight miRNAs were present in the resulting sets from all 3 analyses, and therefore taken as candidate miRNA predictors of TMZ efficacy. Correlation levels between expression levels of these miRNAs and different end points is shown in Table 3.
Correlation Between Different End Points and Expression Levels of the 8 MiRNA Showing Significant Correlation With all 3 Efficacy End Points.

Abbreviations: DFS, disease-free survival; OS, overall survival.
Co-Expression Between Candidate Predictor mRNAs and miRNAs
A co-expression network was subsequently constructed among the 17 efficacy-associated genes, including 9 mRNAs and 8 miRNAs (Figure 5). Upon closer examination, a set of 4 genes, including ASPM, CCNB1, EXO1, and KIF23, showed strong co-expression (Pearson correlation coefficient > 0.9).

Heat map diagram of co-expression patterns among the 17 candidate TMZ response predictors selected via analyses described above. Pairwise correlation of expression levels of the corresponding genes was conducted and clustered based on strength of correlation. As indicated in the scale bar at the top right corner, complete correlation is represented by red, whereas zero correlation by blue.
Compared to glioblastomas, not much is known about the mechanisms and pathways of the 4 genes in LGGs. However, interestingly, all 4 genes have been implicated in glioblastoma. 29 -32 ASPM and KIF23 were overexpressed in glioblastomas, 29,32 and EXO1 was found upregulated in astrocytomas, 33 while their expression levels all negatively correlated with clinical outcomes. 33 -35 In addition, downregulation of all 4 genes impaired proliferation of glioma cells. 29,31,32,36 Moreover, the 4 genes appear to play closely related roles. Abnormal spindle-like microcephaly associated (ASPM), cyclin B (encoded by CCNB1), and kinesin family member 23 (KIF23) are known to play roles in cell proliferation, 37 and ASPM and EXO1 are essential for DNA damage repair. 33,38 Taken together, these results suggest high relevance of this co-expression cluster in regulating cell cycle progression and DDR in LGGs.
Patient Subgrouping Based on Expression of 4-Gene Signature
Based on expression levels of the 4 highly co-expressed genes identified in the previous section (ASPM, CCNB1, EXO1, and KIF23), we performed hierarchical clustering analysis on all patients in this study, grouping cases based on the expression levels of these 4 genes. As shown in Figure 6, 2 distinct groups of patients were observed (Supplementary Table 1), namely those with low (low expression group, n = 84) and high (high expression group, n = 77).
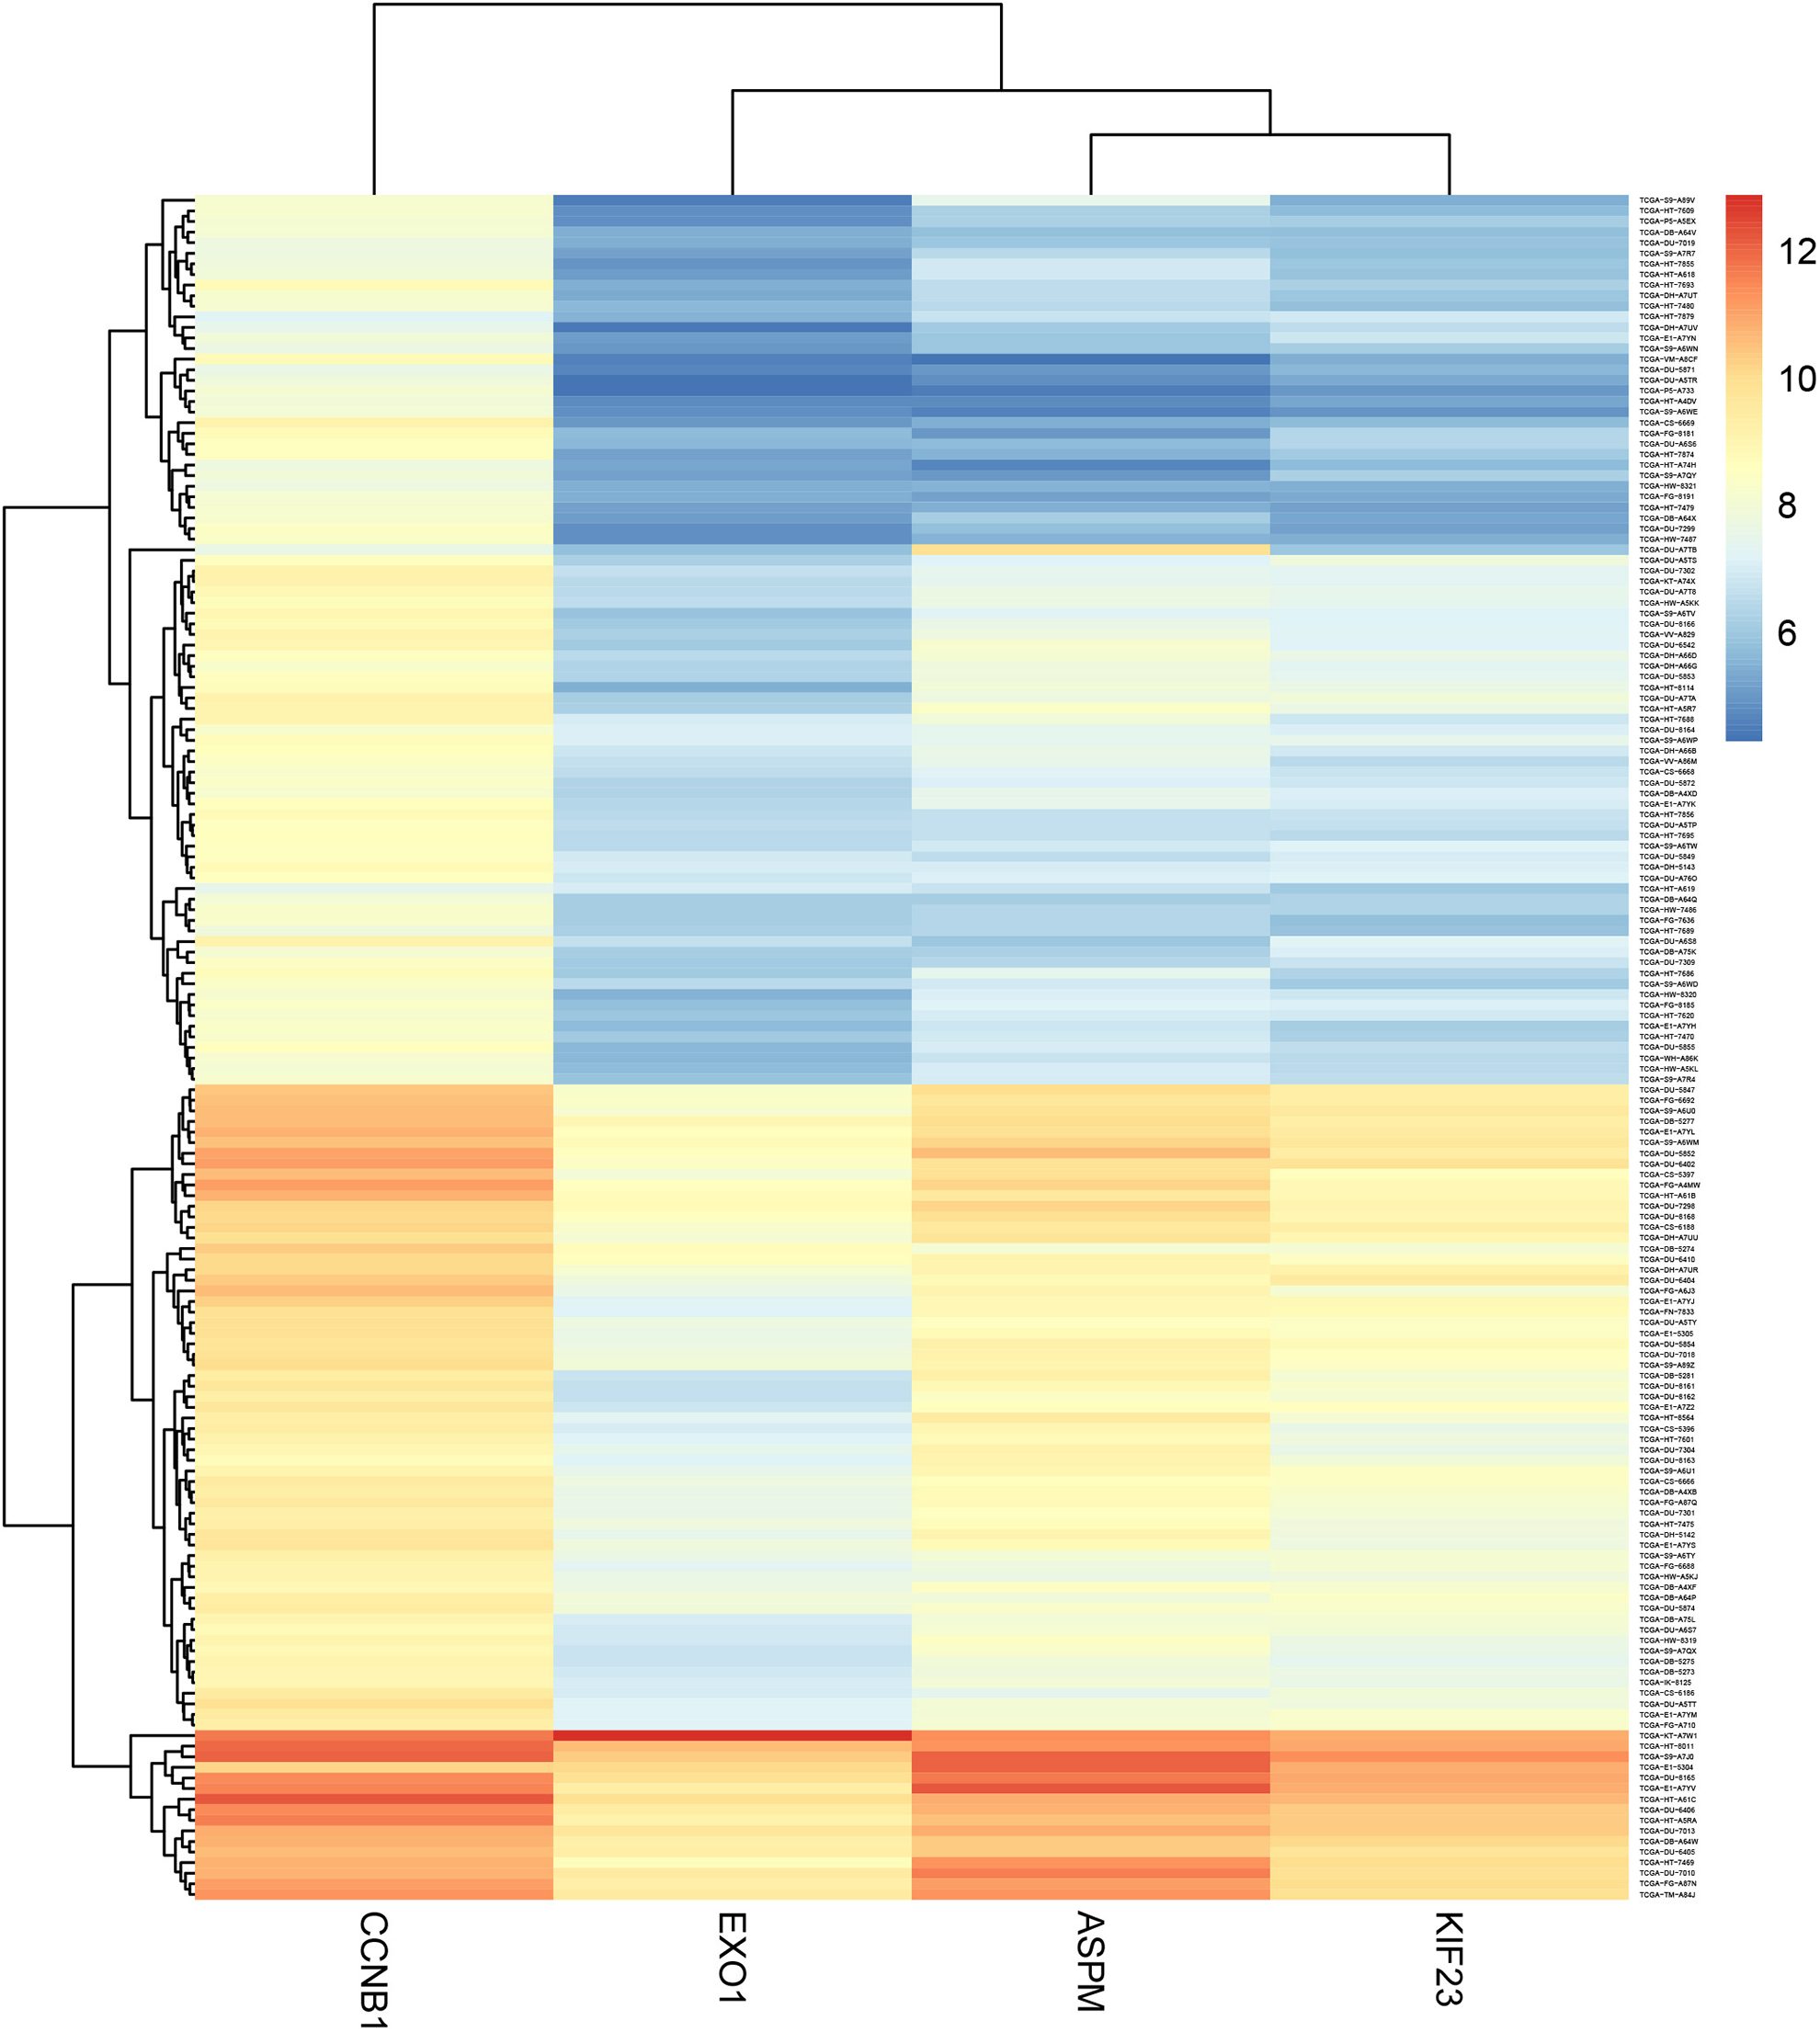
Cluster analysis of all cases included in this study based on the expression levels of ASPM, CCNB1, EXO1, and KIF23, candidate predictors of temozolomide efficacy identified in this study. As indicated by the scale at the top right corner, where expression levels are represented in different shades (red, yellow, and blue), 2 clusters can be identified, expressing low (low expression group) and high levels (high expression group) of these 4 genes, respectively.
After identifying the 4-gene signature, we examined its association with OS-associated clinical features (age, KPS score, histological type, histological grade) identified as aforementioned. A comparison between the low and high expression groups showed comparable indices in all four features (Table 4). In addition, as radiotherapy is also used as a frequent modality in treating LGGs, we also examined and found comparable proportion of patients who also received radiotherapy in low and high expression groups (Table 4), although information of the specific regimen for each patient is needed before further interpretation of this result.
Comparable Baseline Levels of OS-Associated Clinical Features and Proportion of Patients Receiving Radiotherapy in the Low and High Expression Groups. The 2 Groups Were Identified by Cluster Analysis Based on Expression of the 4-Gene Signature.
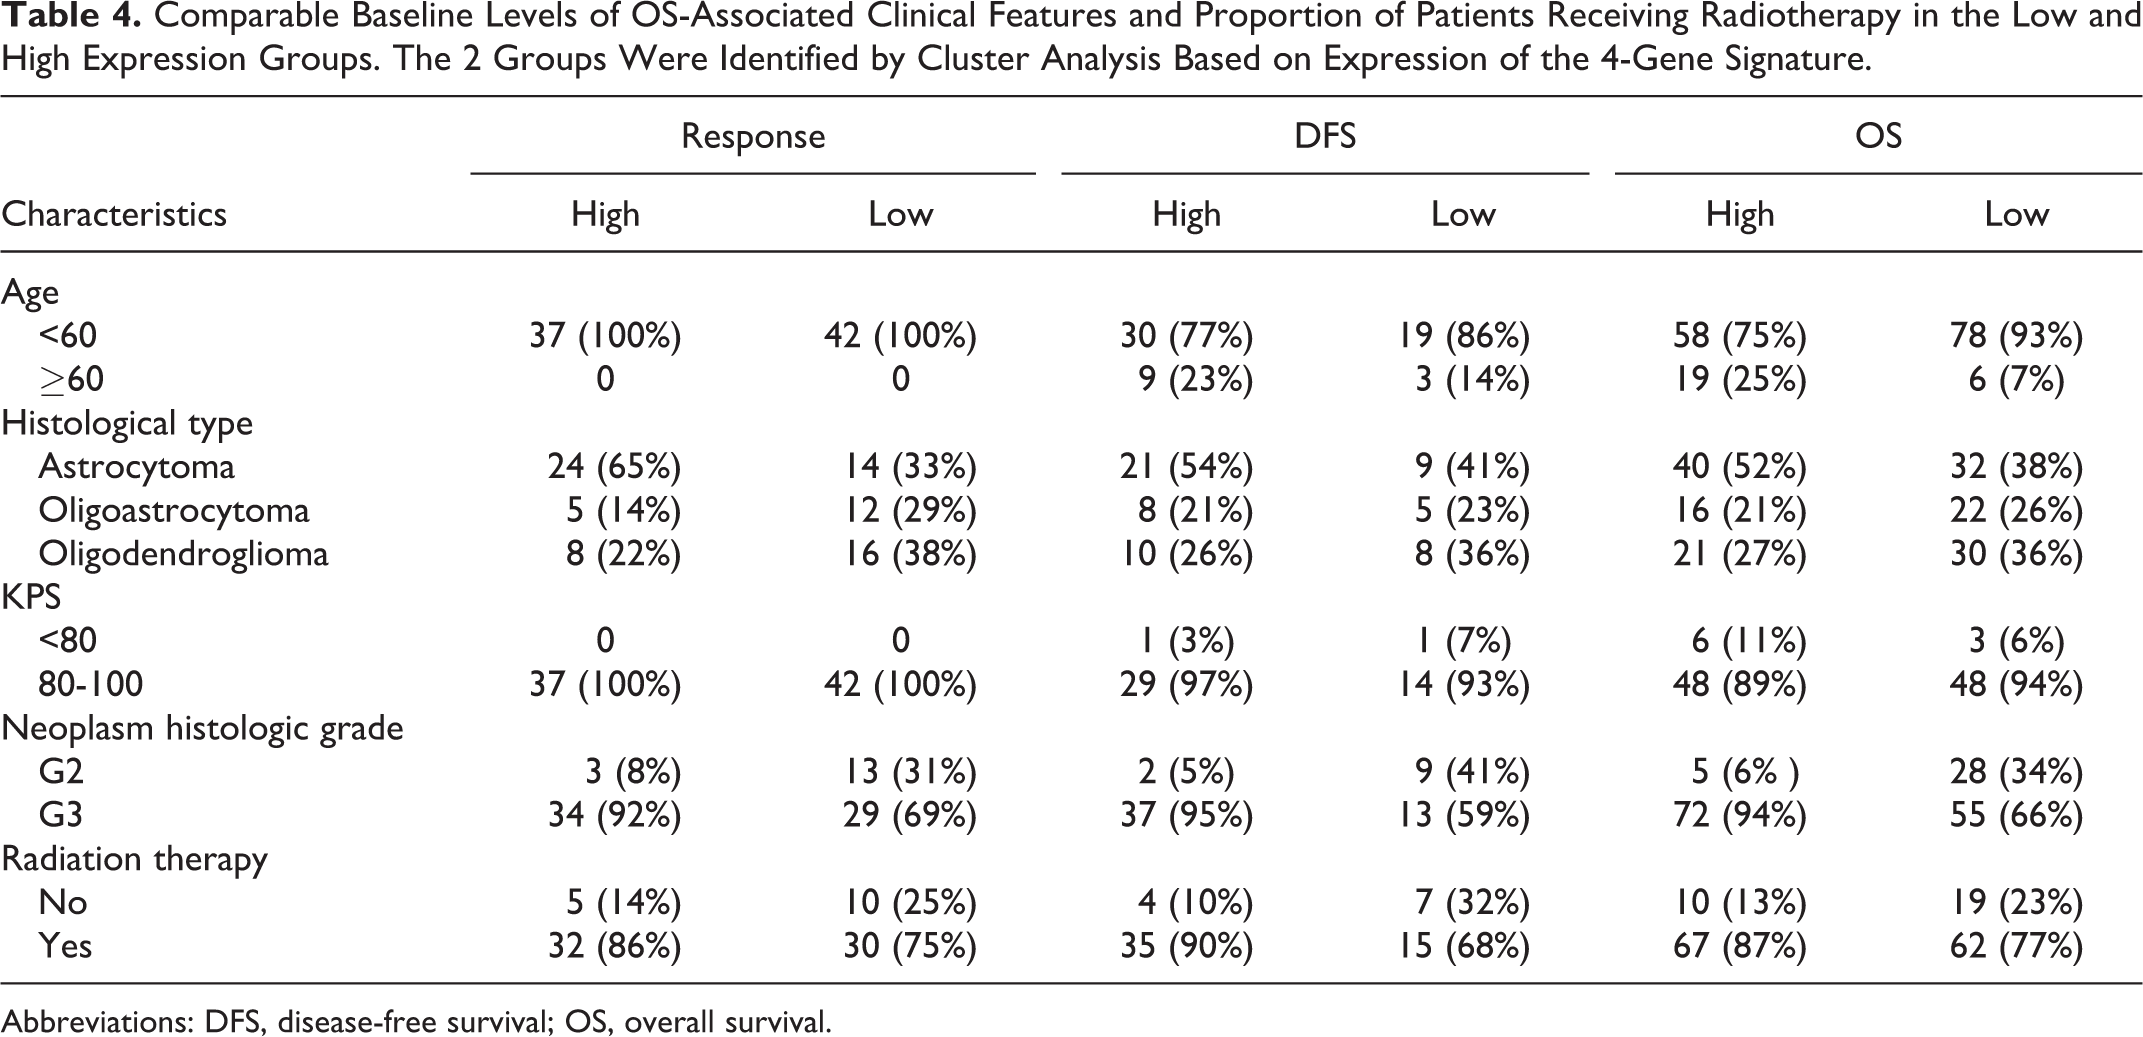
Abbreviations: DFS, disease-free survival; OS, overall survival.
Significant Reduction in Response, DFS, and OS in the High Expression Group
Despite similar levels of OS-associated clinical features, significant difference was observed between the ORR, DFS, and OS of the low and high expression groups. As shown in Figure 7A, for the high expression group, the numbers of cases showing different drug treatment responses were 19 for PD (progressive disease), 7 for SD (stable disease), 6 for PR (partial response), and 5 for complete response, whereas in the low expression group there were 6, 21, 9, and 6 cases, respectively. Therefore, the high expression group showed a markedly higher percentage of PD cases (24.7% vs 7.1% for the low expression group), and lower percentages of SD (9.1% vs 25.0%) and PR (7.8% vs 10.7%) cases.

Expression levels of the 4-gene set (ASPM, CCNB1, EXO, and KIF23) showed strong association with outcome of temozolomide treatment in LGG patients. A, Numbers of patients showing different types of treatment response in the low (green) and high (pink) expression group. B, Higher expression of the 4-gene signature was significantly correlated with DFS and (C) OS. CR indicates complete response; DFS, disease-free survival; LGG, low-grade gliomas; OS, overall survival; PD, progressive disease; PR, partial response; SD, stable disease.
Moreover, survival analysis indicated significant correlation between the expression levels of the 4-gene set (ASPM, CCNB1, EXO1, and KIF23) and survival rate. Compared to patients in the low expression, those in the high-expression group showed significantly reduced DFS (Figure 7B, median DFS 13.4 vs 21.9, P = .04) as well as OS (Figure 7C, hazard ratio [HR]: 0.15, 95% confidence interval: 0.05-0.46, P < .001), suggesting that expression of the 4-gene signature is significantly correlated to TMZ treatment efficacy, and can be used to predict the outcome of TMZ therapy.
We further validated the result by expression data from RTOG-0825 study (GSE84010), which contains a cohort of patients treated with first-line radiotherapy and TMZ. Because this expression data were created by Genentech glioblastoma custom panel GBM_GNE_C1954, only CCNB1 and MGMT expression could be found. So, we first analyzed the correlation between CCNB1 and MGMT. Result revealed no correlation(r = −0.03, Supplementary Figure 1A). We then divided patients into 2 groups according to CCNB1 expression. Cox regression showed the group with low CCNB1 expression had significantly longer OS (HR: 0.71[0.51-0.99], P = .045, Supplementary Figure 1B), which was consistent with our finding.
Effects of the 4-Gene Signature on TMZ Efficacy is Independent of MGMT Silencing and Associated With a Novel Olfactory Receptor Or51f2
As an alkylating agent, TMZ exerts cytotoxic functions through introducing DNA lesions, and can therefore be subject to acquired resistance due to removal of DNA adducts by MGMT. Accordingly, MGMT depletion, either through epigenetic silencing by promoter methylation 39 or use of inhibitor. 40 have been shown to enhance TMZ response in glioblastomas. Therefore, to determine whether correlation between TMZ efficacy and expression of the 4-gene signature was associated with MGMT silencing, we started by comparing the overall DNA methylation level in low and high expression groups. The High expression group exhibited a significantly lower level of overall DNA methylation level compared to the Low expression group (Figure 8A).
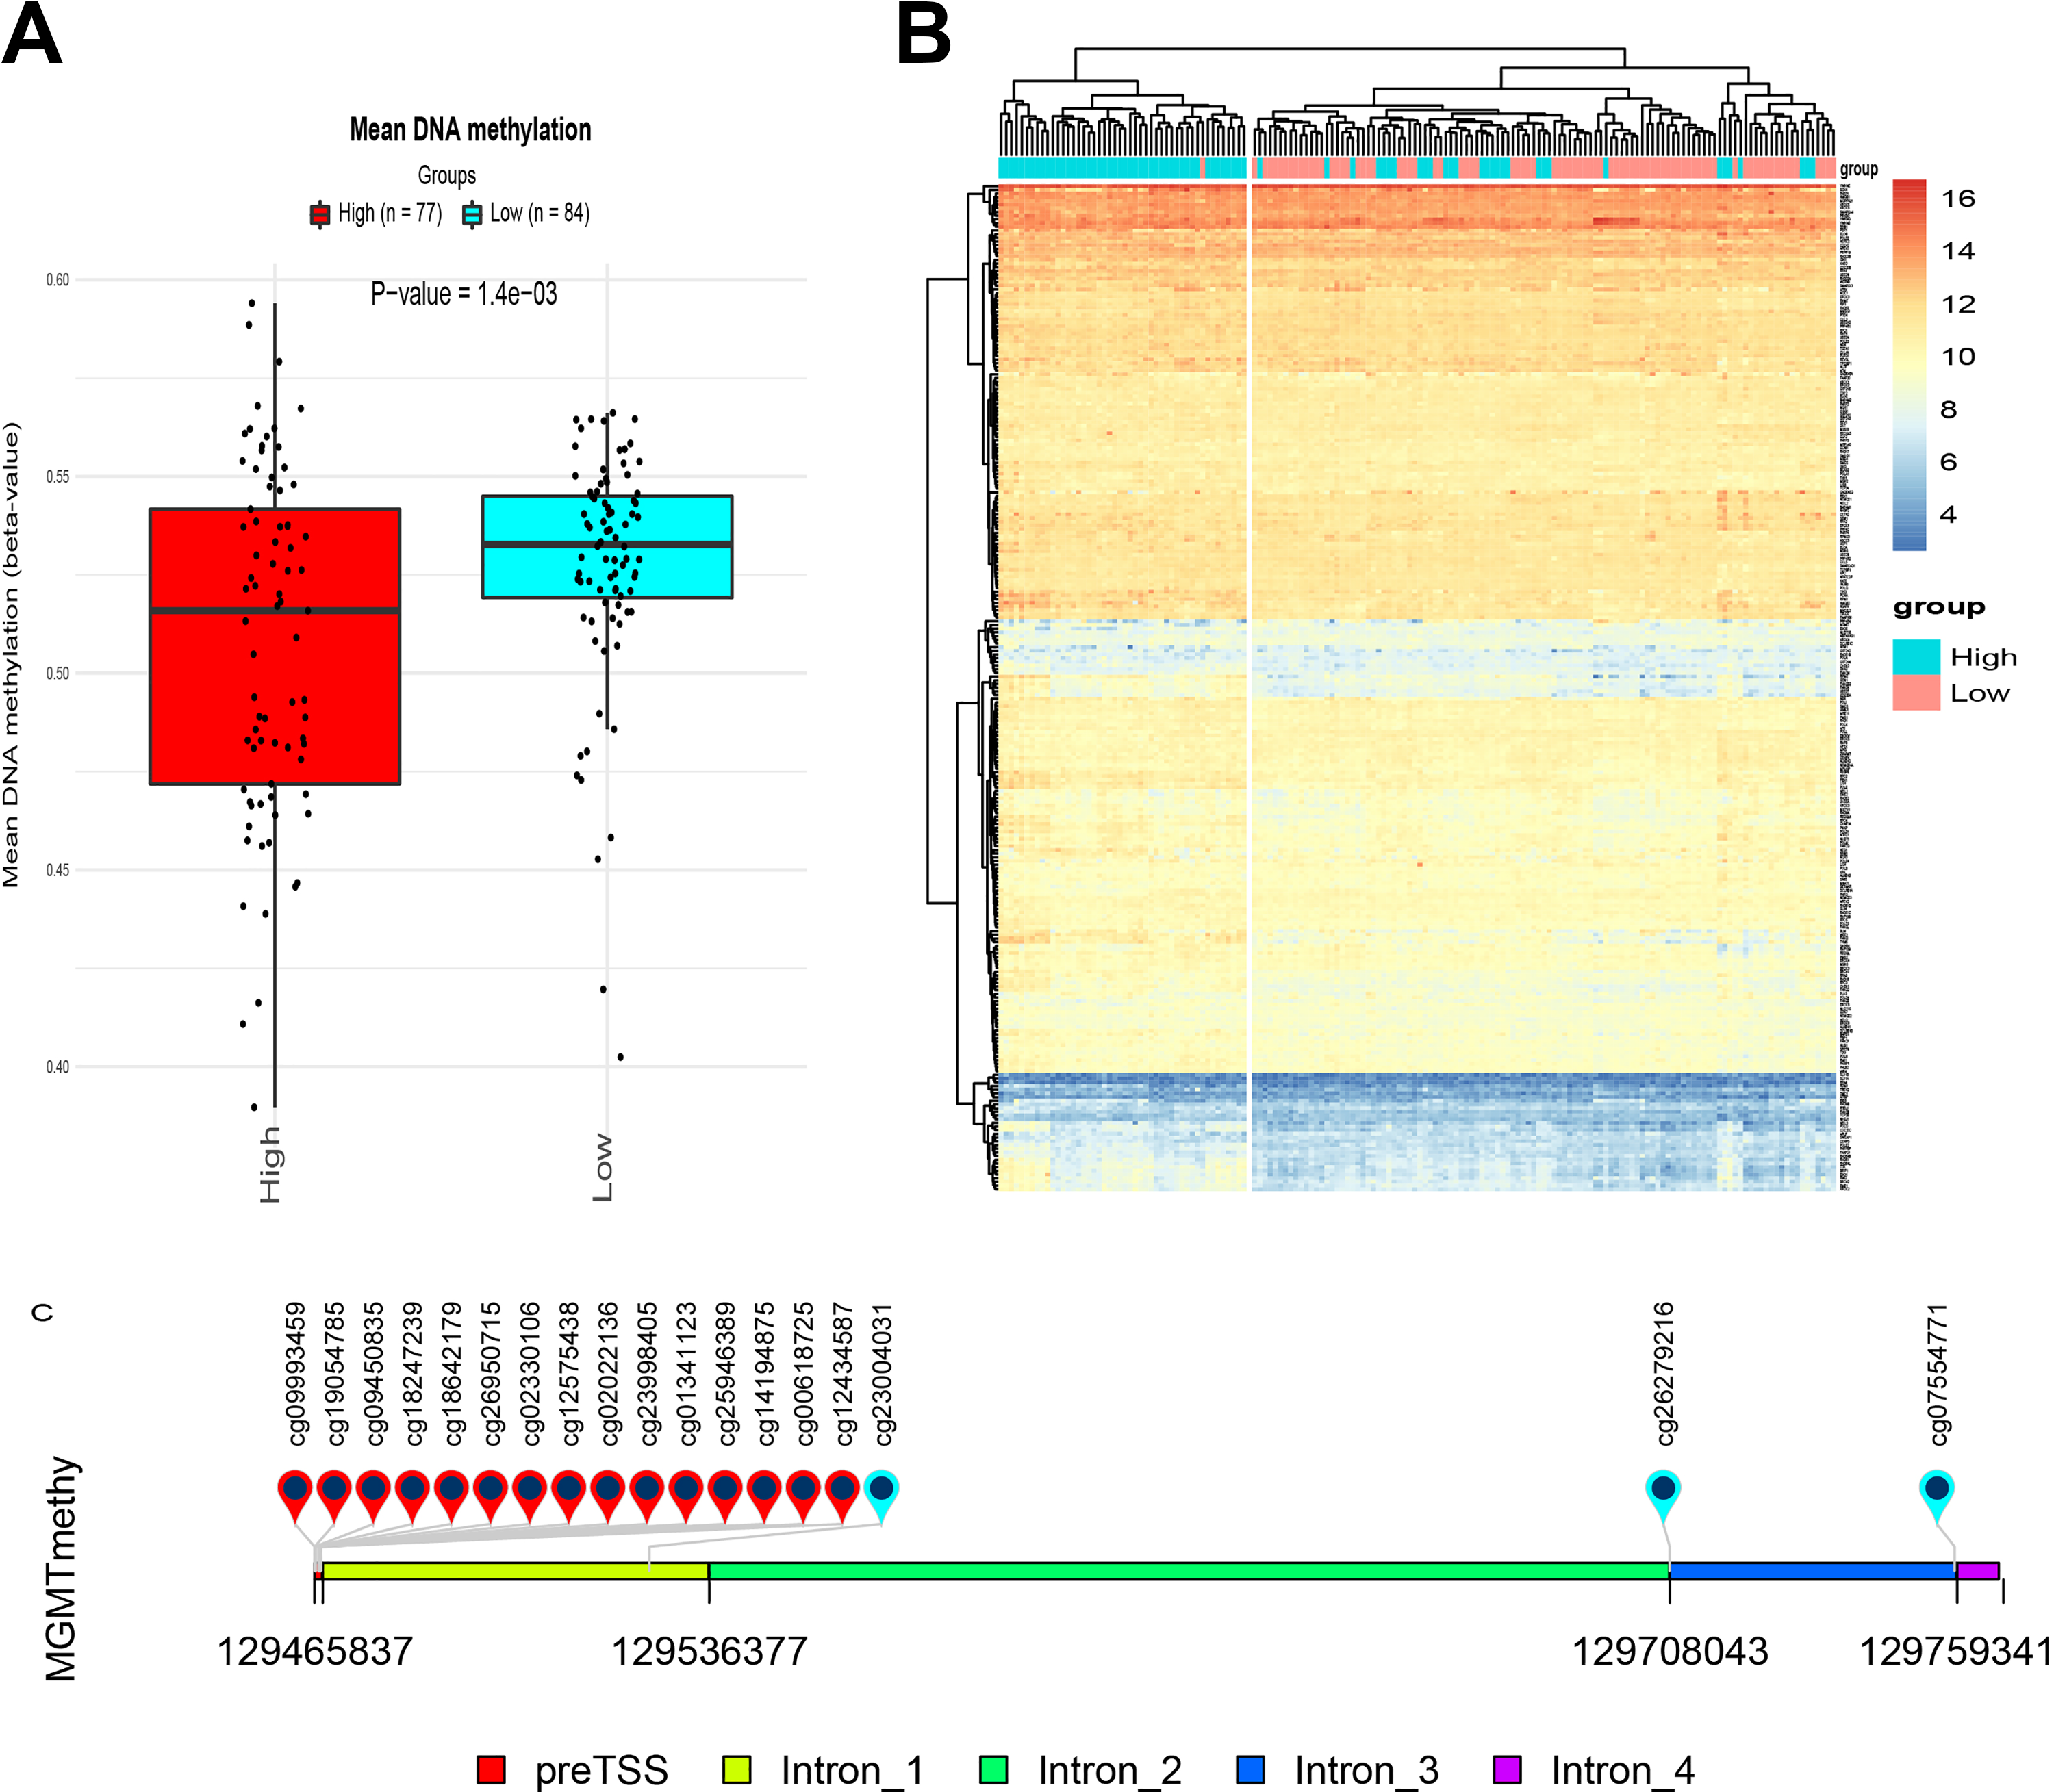
Methylation levels between the low and high expression groups suggest that the 4-gene set mediates TMZ efficacy in an MGMT-independent manner. (A) There was significantly higher level of overall DNA methylation in the high expression group (red) when compared with that of the low expression group (blue). B, Cluster analysis of the expression levels of 276 established DDR-related genes revealed highly similar expression patterns in both expression groups. Each row represents the expression levels of an individual gene, whereas each column represents a case in the low (cyan) or high (pink) expression group. As indicated by the scale bar on the top right corner, highest expression level is shown in red, and the lowest one in blue. C, A diagram showing MGMT regions covered by different probes used in this study. DDR indicates DNA damage response; MGMT, O6-methylguanine-DNA methyltransferase; TMZ, temozolomide.
Next, we examined whether the status of MGMT methylation correlated with the expression of the 4-gene set. Out of the 18 probes used, none of the 15 probes covering the promoter region of MGMT showed significant difference in MGMT methylation levels between low and high expression groups (Figure 8B). O6-methylguanine-DNA methyltransferase expression between the 2 groups were also compared by t test, no significant difference was found (Supplementary Figure 2A). There is no correlation between MGMT expression and the four gene signature either (Supplementary Figure 2B). Univariate Cox analysis showed none of beta value of these 15 probes significantly affect OS (Table 5). Despite exceptions were observed for 3 methylation sites located in intron 1, intro 3, and exon 4, MGMT methylation analysis suggested that difference in TMZ efficacy between low and high expression groups was independent of MGMT methylation level. Cox regression was also conducted between MGMT expression and OS, no significant association was found either (HR: 0.93[0.62-1.42], P = .748).
Univariate Cox Analysis of the 15 MGMT Promoter Sites’ Methylation β Value and OS.

Abbreviations: CI, confidence interval; MGMT, O6-methylguanine-DNA methyltransferase; OS, overall survival.
As TMZ induces DNA damage in tumor cells, it is conceivable that response to TMZ can be enhanced by defective DDR. Indeed, expression of a panel of five DDR-related genes has been proposed to predict TMZ response in glioblastomas. 41 In order to determine whether the DDR machinery mediates the association between the 4-gene signature and response to TMZ therapy, we performed a cluster analysis based on the expression of 276 previously reported DDR-related genes. 42 As shown in Figure 8C, despite a few exceptions, overall, highly similar patterns of expression levels of these genes were observed between the 2 expression groups.
Importantly, genes that displayed differential expression included POLH, RMI1, PAXIP1, PALB2, WRN, BRCA2, EME1, and XRCC2. Most of these genes play roles in homologous recombination, either through dissolution of Holliday junction, a key intermediate (eg, RMI1 and EME1), or through repairing DNA double strand breaks (eg, PALB2, BRCA2, and XRCC2). 43,44 Together, these findings suggest the association between the 4-gene signature and response to TMZ therapy come specifically from alterations in genome stability.
Finally, intersection between the genes showing significant difference in both expression and methylation levels between the low and high expression groups yielded olfactory receptor 51F2 (OR51F2), a largely uncharacterized gene, emerged from (Figure 9). While its expression level increased in the high expression group, hypomethylation on OR51F2 was also observed, suggesting a potential role of this G-protein-coupled receptor in bridging the gap between the 4-gene signature and the clinical outcomes of TMZ treatment.

Starburst plot showing the distribution of gene expression and DNA methylation levels of differentially expressed genes between the low and high expression groups.
Discussion
Optimal management of low-grade gliomas remains under debate at present, largely due to several confounding factors, including marked heterogeneity of this groups of tumors, update in the classification system which renders some earlier data less informative, as well as limited characterization of the clinical outcomes of major therapies and various combinations thereof. Several clinical trials have been launched, which will hopefully yield more insight into the efficacies of standalone and combined therapies, in particular, association between molecular profiles and response to TMZ treatment.
In this study, we revisited LGG data sets deposited in the TCGA database and used a battery of bioinformatics tools to identify potential efficacy predictors of TMZ monotherapy. The scarcity of OS data (161 data points out of a total of 507 suitable cases) posed a challenge to the relevance of potential findings. In order to overcome this shortage, 2 additional frequently used efficacy end points were used, namely overall response rate (79 valid data points) and DFS (61 valid data points), to screen for genes whose expression levels showed significant correlation with alterations in all 3 end points.
Initial regression analyses identified 798 mRNAs and 8 miRNAs significantly associated with OS, ORR, and DFS in LGGs patients receiving TMZ therapy within 180 days after surgery (Figure 3, Table 3). Co-expression and interaction network analysis further highlighted nine mRNAs that displayed high connectivity in the functional interaction network of genes that showed strong co-expression (Figure 4).
A closer examination revealed a 4-gene signature showing strong co-expression (Pearson correlation coefficient > 0.9), including ASPM, CCNB1, EXO1, and KIF23 (Figure 6). Patient subgrouping showed that in addition to shortened OS, ORR, and DFS (Figure 7), a higher expression of these genes was associated with a markedly higher percentage of cases showing progressive disease (24.7% vs. 7.1% for high and low expression groups, respectively), and lower percentages of SD (9.1% vs 25.0%).
Importantly, downregulation of all 4 genes impaired proliferation of glioma cells 29,31,32,36 In addition, ASPM, EXO1, and KIF23 were found overexpressed in glioblastomas, the most common type of high-grade gliomas in adults, where their expression levels all significantly correlated with poor prognosis. 29,32 -35
Abnormal spindle-like microcephaly associated, cyclin B, and KIF23 are well-established cell cycle factors. Poor prognosis of gliomas has long been associated with loss of cyclin-dependent kinase inhibitors. 45 In vitro, cyclin B was reported to mediate cell proliferation inhibition by a number of interventions that target, downregulate, or degrade cyclin B, including microRNA-181, 46 HIF-1α silencing, 47 demethoxycurcumin, 30 and flubendazole. 36
Abnormal spindle-like microcephaly associated is a marker of mitosis essential for mitotic spindle function. 37 In gliomas, there is evidence of an increase in ASPM mRNA and protein levels that corresponded with the histological grade. 48 Kinesin family member 23 is a nuclear protein and play a role in cell division. Acting as a plus-end directed motor protein expressed during mitosis, KIF23 regulates the formation of the cleavage furrow in late anaphase and in cytokinesis. 49
In addition to cell cycle, the 4-gene signature may also mediate effects of TMZ through modulation of DDR. Abnormal spindle-like microcephaly associated, EXO1 are essential in repairing DNA double-strand breaks. ASPM silencing led to inefficient repair of DSBs in irradiated glioblastoma cells in a DNA-PK-dependent pathway. 38 On the other hand, EXO1 depletion promoted faster restoration of DSBs in glioblastoma. 33
Moreover, several DDR-related genes were differentially expressed between groups showing low and high levels of 4-gene signature expression. Noteworthy, most of these genes are players in the HR machinery (RMI1, PAXIP1, PALB2, BRCA2, EME1, and XRCC2). 43,44 Double-strand breaks repair through HR has been reported to contribute to TMZ resistance in glioblastoma cells, and was proposed as therapeutic targets in enhancing TMZ efficacy. 50,51
Apart from HR-related genes, translesion polymerase η was shown to protect glioblastoma cells against interstrand crosslink in a p53-dependent manner. 52 Also, silencing of Werner syndrome helicase, a DNA helicase/exonuclease, sensitized glioma cell lines to O 6 -methylguanine adducts in the absence of MGMT activity. 53 Taken together, these DDR-related genes provides hints regarding the mechanisms by which expression of the 4-gene signature dampens response to TMZ therapy.
Expression of the 4-gene signature also significantly positively correlated with level of overall DNA methylation. Interesting, despite difference in global DNA methylation, association between the 4-gene signature and response to TMZ treatment appeared independent to MGMT (Figure 8). This result awaits further validation, yet could suggest additional mechanisms by which TMZ induces DNA methylation lesions.
Finally, comparison of expression and DNA methylation profiles between the low and high expression groups yielded a candidate downstream effector of the 4-gene signature. Olfactory receptor OR51F2 was upregulated in the high expression group while harboring a lower of level of methylation (Figure 9). Little known is known so far about OR51F2, except that it is a member of the olfactory receptors, which are a subfamily in the G protein-coupled receptor (GPCR) family. Recent discovery of several GPCR candidates for treating glioblastoma has generated interest in studying GPCR as a potential avenue for elucidating cancer biology and drug targets. 54 It is therefore possible that OR51F2 mediates the actions of the 4-gene signature in reducing TMZ efficacy.
Conclusions
Constituting approximately 15% of primary brain tumors in adults, low-grade gliomas are lethal, infiltrative, and heterogeneous. Optimal management plan of LGGs is currently a field of debate and will benefit from insights from several on-going clinical trials comparing the outcomes of mainstay adjuvant therapies, including that of TMZ, a first-line drug that exerts cytotoxicity through inducing DNA damage.
Through mining existing LGG case documentations from the TCGA database in this study, we identified a novel 4-gene signature (ASPM, CCNB1, EXO1, and KIF23) that showed significant negative correlation with response to TMZ treatment. Expression of this 4-gene signature was also associated with that of several genes related to DDR, which highlights potential role of homologous recombination in mediating the inhibiting effects of the 4 gene. Despite absence significant difference in MGMT methylation level, a higher overall methylation level was observed in patients expressing high levels of the 4-gene signature. Furthermore, gene expression and methylation profiling proposes a novel olfactory receptor OR51F2 as a potential downstream effectors.
Altogether, these findings propose the 4-gene signature as a novel panel of efficacy predictors of TMZ therapy, as well as potential downstream mechanisms, including homologous recombination, OR51F2, and DNA methylation independent of MGMT.
Supplemental Material
Supplementary_table_1_(2) - Comprehensive Analysis Reveals a 4-Gene Signature in Predicting Response to Temozolomide in Low-Grade Glioma Patients
Supplementary_table_1_(2) for Comprehensive Analysis Reveals a 4-Gene Signature in Predicting Response to Temozolomide in Low-Grade Glioma Patients by Qi Wang, Zongze He and Yong Chen in Cancer Control
Footnotes
Authors’ Note
Qi Wang, Zongze He, and Yong Chen designed and conducted the work. Zongze He and Yong Chen supervised the work.
Acknowledgments
We thank all the doctors in our department for their help in patients care so that we can have enough time to conduct this study.
Declaration of Conflicting Interests
The author(s) declared no potential conflicts of interest with respect to the research, authorship, and/or publication of this article.
Funding
The author(s) disclosed receipt of the following financial support for the research, authorship, and/or publication of this article: The grant from Health and Family Planning Commission of Sichuan Province, China (No. 18PJ426). The grant from Department of Science and Technology of Sichuan Province, China (No. 2017SZ0203).
Supplemental Material
Supplemental material for this article is available online.
References
Supplementary Material
Please find the following supplemental material available below.
For Open Access articles published under a Creative Commons License, all supplemental material carries the same license as the article it is associated with.
For non-Open Access articles published, all supplemental material carries a non-exclusive license, and permission requests for re-use of supplemental material or any part of supplemental material shall be sent directly to the copyright owner as specified in the copyright notice associated with the article.