
Abstract
This study examines the impact of display type and prior experience with tropical cyclones on user comprehension, decision-making, and perceived ease of use. Responses were compared across three display types depicting tropical cyclone hazards, forecast path, and the combination of hazard and path information. We conducted a 3 (display) × 2 (experience) × 2 (tropical cyclone) between-subject online experiment (N = 344). Results indicate that graphics that integrate tropical cyclone path and hazard information enhance comprehension. Prior experience significantly influenced comprehension and decision-making, with the experienced group exhibiting better performance. Perceived ease of use ratings showed an interaction effect between display type and experience group. This study provides valuable insights into the complex interplay between display type, prior experience, and user interpretation of tropical cyclone-related information, warranting further exploration.
Introduction
In geographic regions that are susceptible to tropical cyclones, clear and effective communication of all associated threats is critical for successful risk reduction. In the face of impending tropical cyclones, both the public and officials frequently turn to the National Hurricane Center’s Tropical Cyclone Track and Watch/Warning Graphic (Millet et al., 2020). This tool, commonly known as the “cone of uncertainty” (COU), serves as a critical resource for planning and preparation activities. The COU provides a visual representation of the potential trajectory of the cyclone’s center and its uncertainty, thereby aiding in decision-making processes. However, additional information may be more helpful for preparation, such as the expected hazards, which are not all currently presented in the graphic.
Weather organizations have recently extended their graphical forecast product suite to include more hazard-specific information, such as the National Weather Service’s (NWS) Hurricane Threats and Impacts (HTI) graphics. These graphics present potentially hazardous conditions and provide brief descriptions of the likely impacts (National Weather Service (NWS), n.d.). Each of the four HTI graphics is dedicated to a specific tropical cyclone hazard: wind, storm surge, flooding rain, and tornadoes. Despite their operational status at NWS since 2015, these graphics are not as widely recognized or utilized as the COU. Furthermore, there is limited research evaluating the efficacy of the HTI graphics or other graphics that portray individual tropical cyclone hazards and their simultaneous occurrences (Millet et al., 2022a). In contrast, there is significant evidence that the COU and other graphics depicting tropical cyclone forecast paths are poorly understood by the public (Broad et al., 2007; Evans et al., 2022; Millet et al., 2020). Moreover, researchers have not examined how hazard information presented in combination with the forecast path affects user comprehension and decision-making.
In this work, we investigated the impact of display type and prior tropical cyclone experience on user comprehension and preparatory decision-making. We compared responses across three display types depicting: (a) tropical cyclone hazard risks, (b) forecast path, and (c) the combination of hazard and path information. This research represents a step toward identifying how tropical cyclone forecast information can be presented to better support comprehension and decision making by the general public. The findings from this study will be useful for informing redesign efforts of tropical cyclone risk communication products.
Methods
The study employed a 3 (display) × 2 (experience) × 2 (tropical cyclone) between-subject design, online experiment with a total of 344 participants. The expirement was conducted using the Qualtrics online survey platform, and participants were recruited through Qualtrics’ panel services. Display type consisted of three levels: the HTI, the COU, and a display including both (HTI + COU). The HTI and COU graphics were developed as described in our previous work (Millet et al., 2022a; Millet et al., 2022b, respectively); see Figures 1 and 2. The HTI+COU display combined the HTI and COU graphics. Participants were categorized into two experience levels: experienced (Florida residents with a minimum of 5 years residency and prior tropical cyclone experience) and novice (never lived in a state threatened by tropical cyclones and had no prior experience with tropical cyclones). The tropical cyclone factor consisted of two levels: Hurricane Irma (2017) and Hurricane Michael (2018).
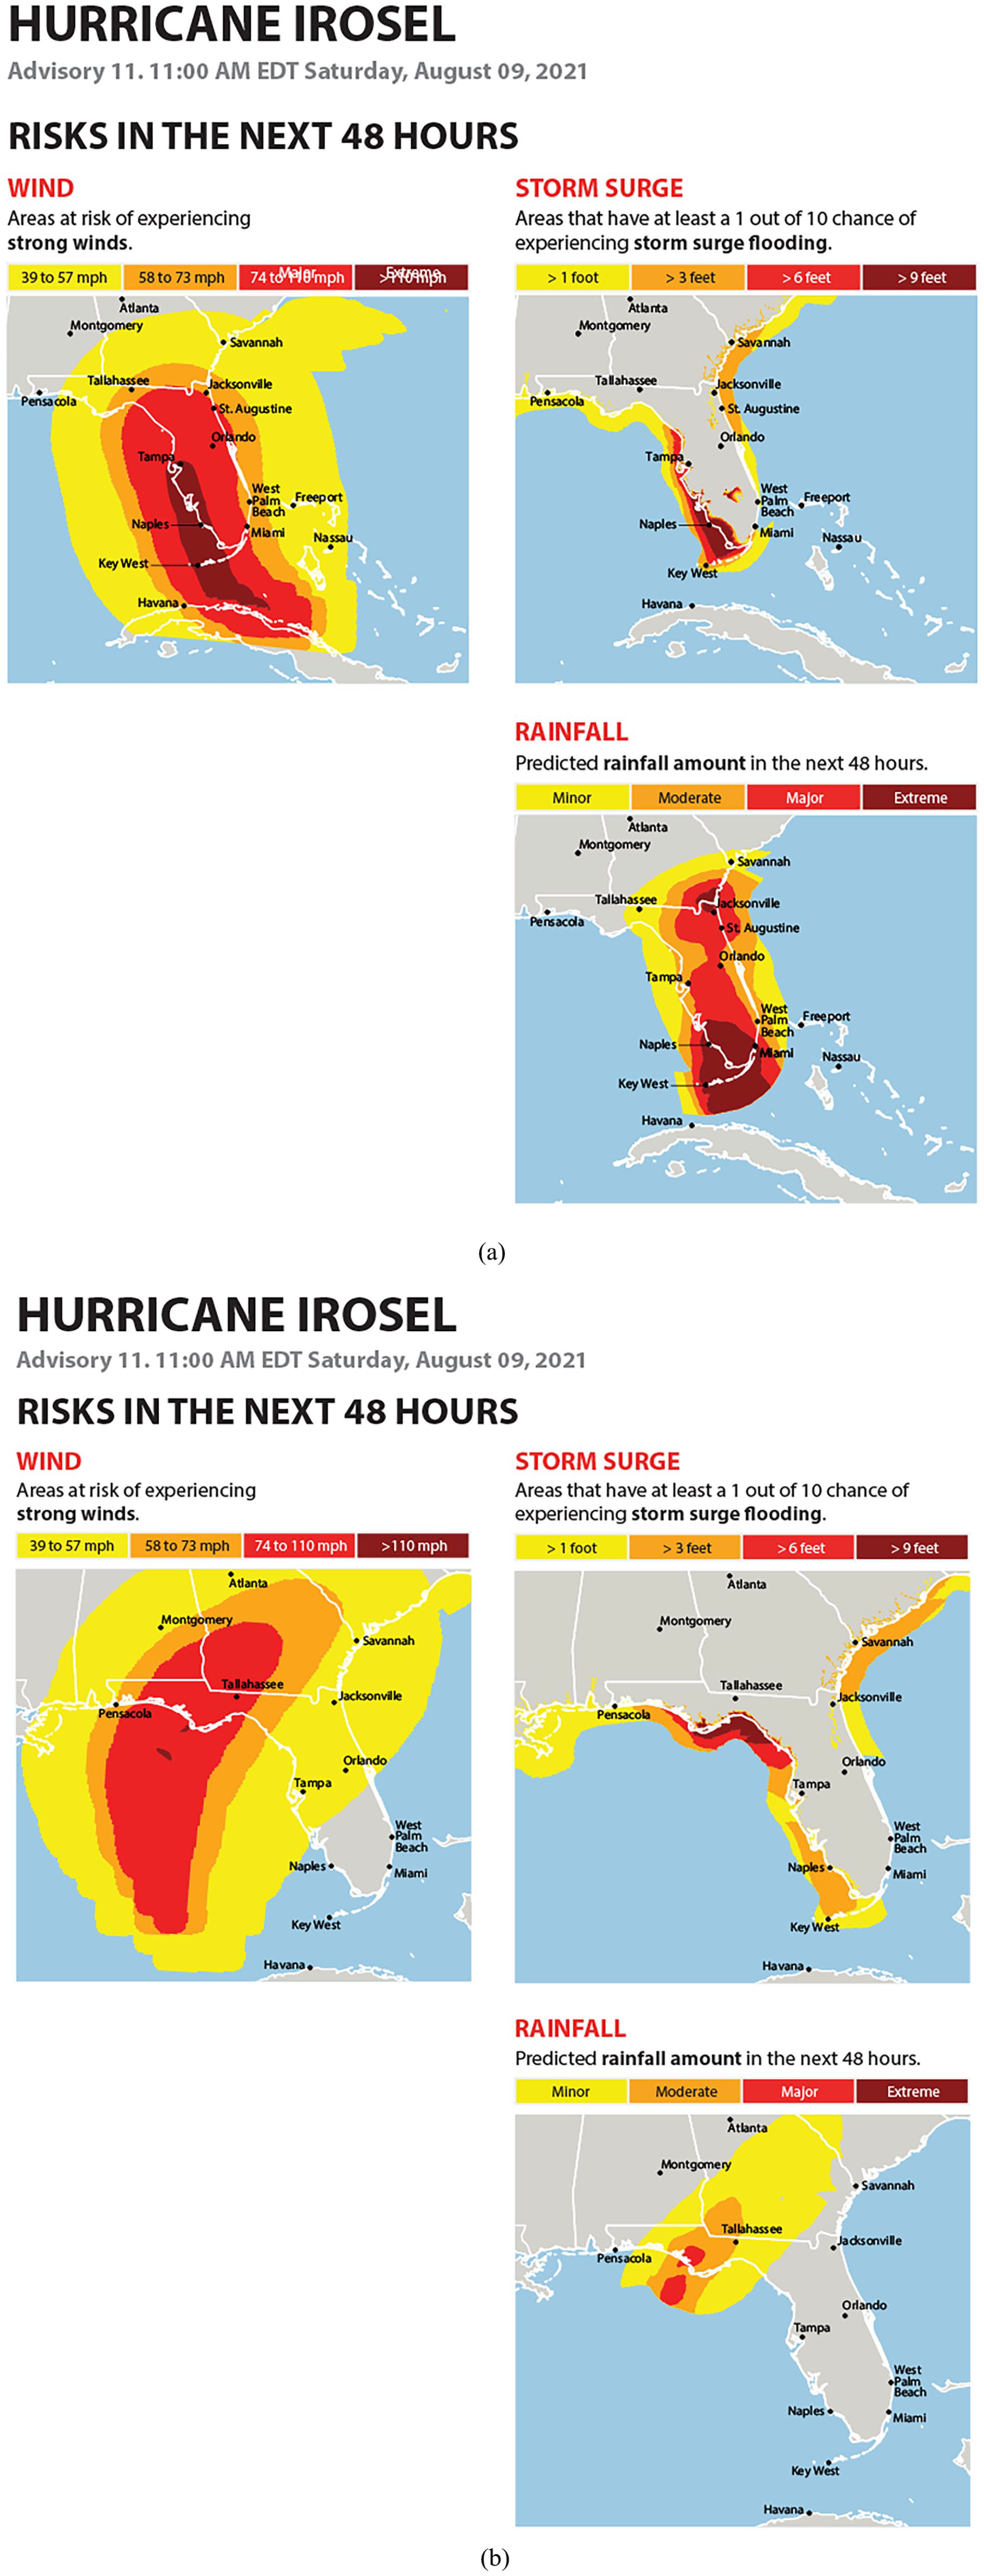
HTI graphics for Hurricane Irma (a) and Hurricane Michael (b).
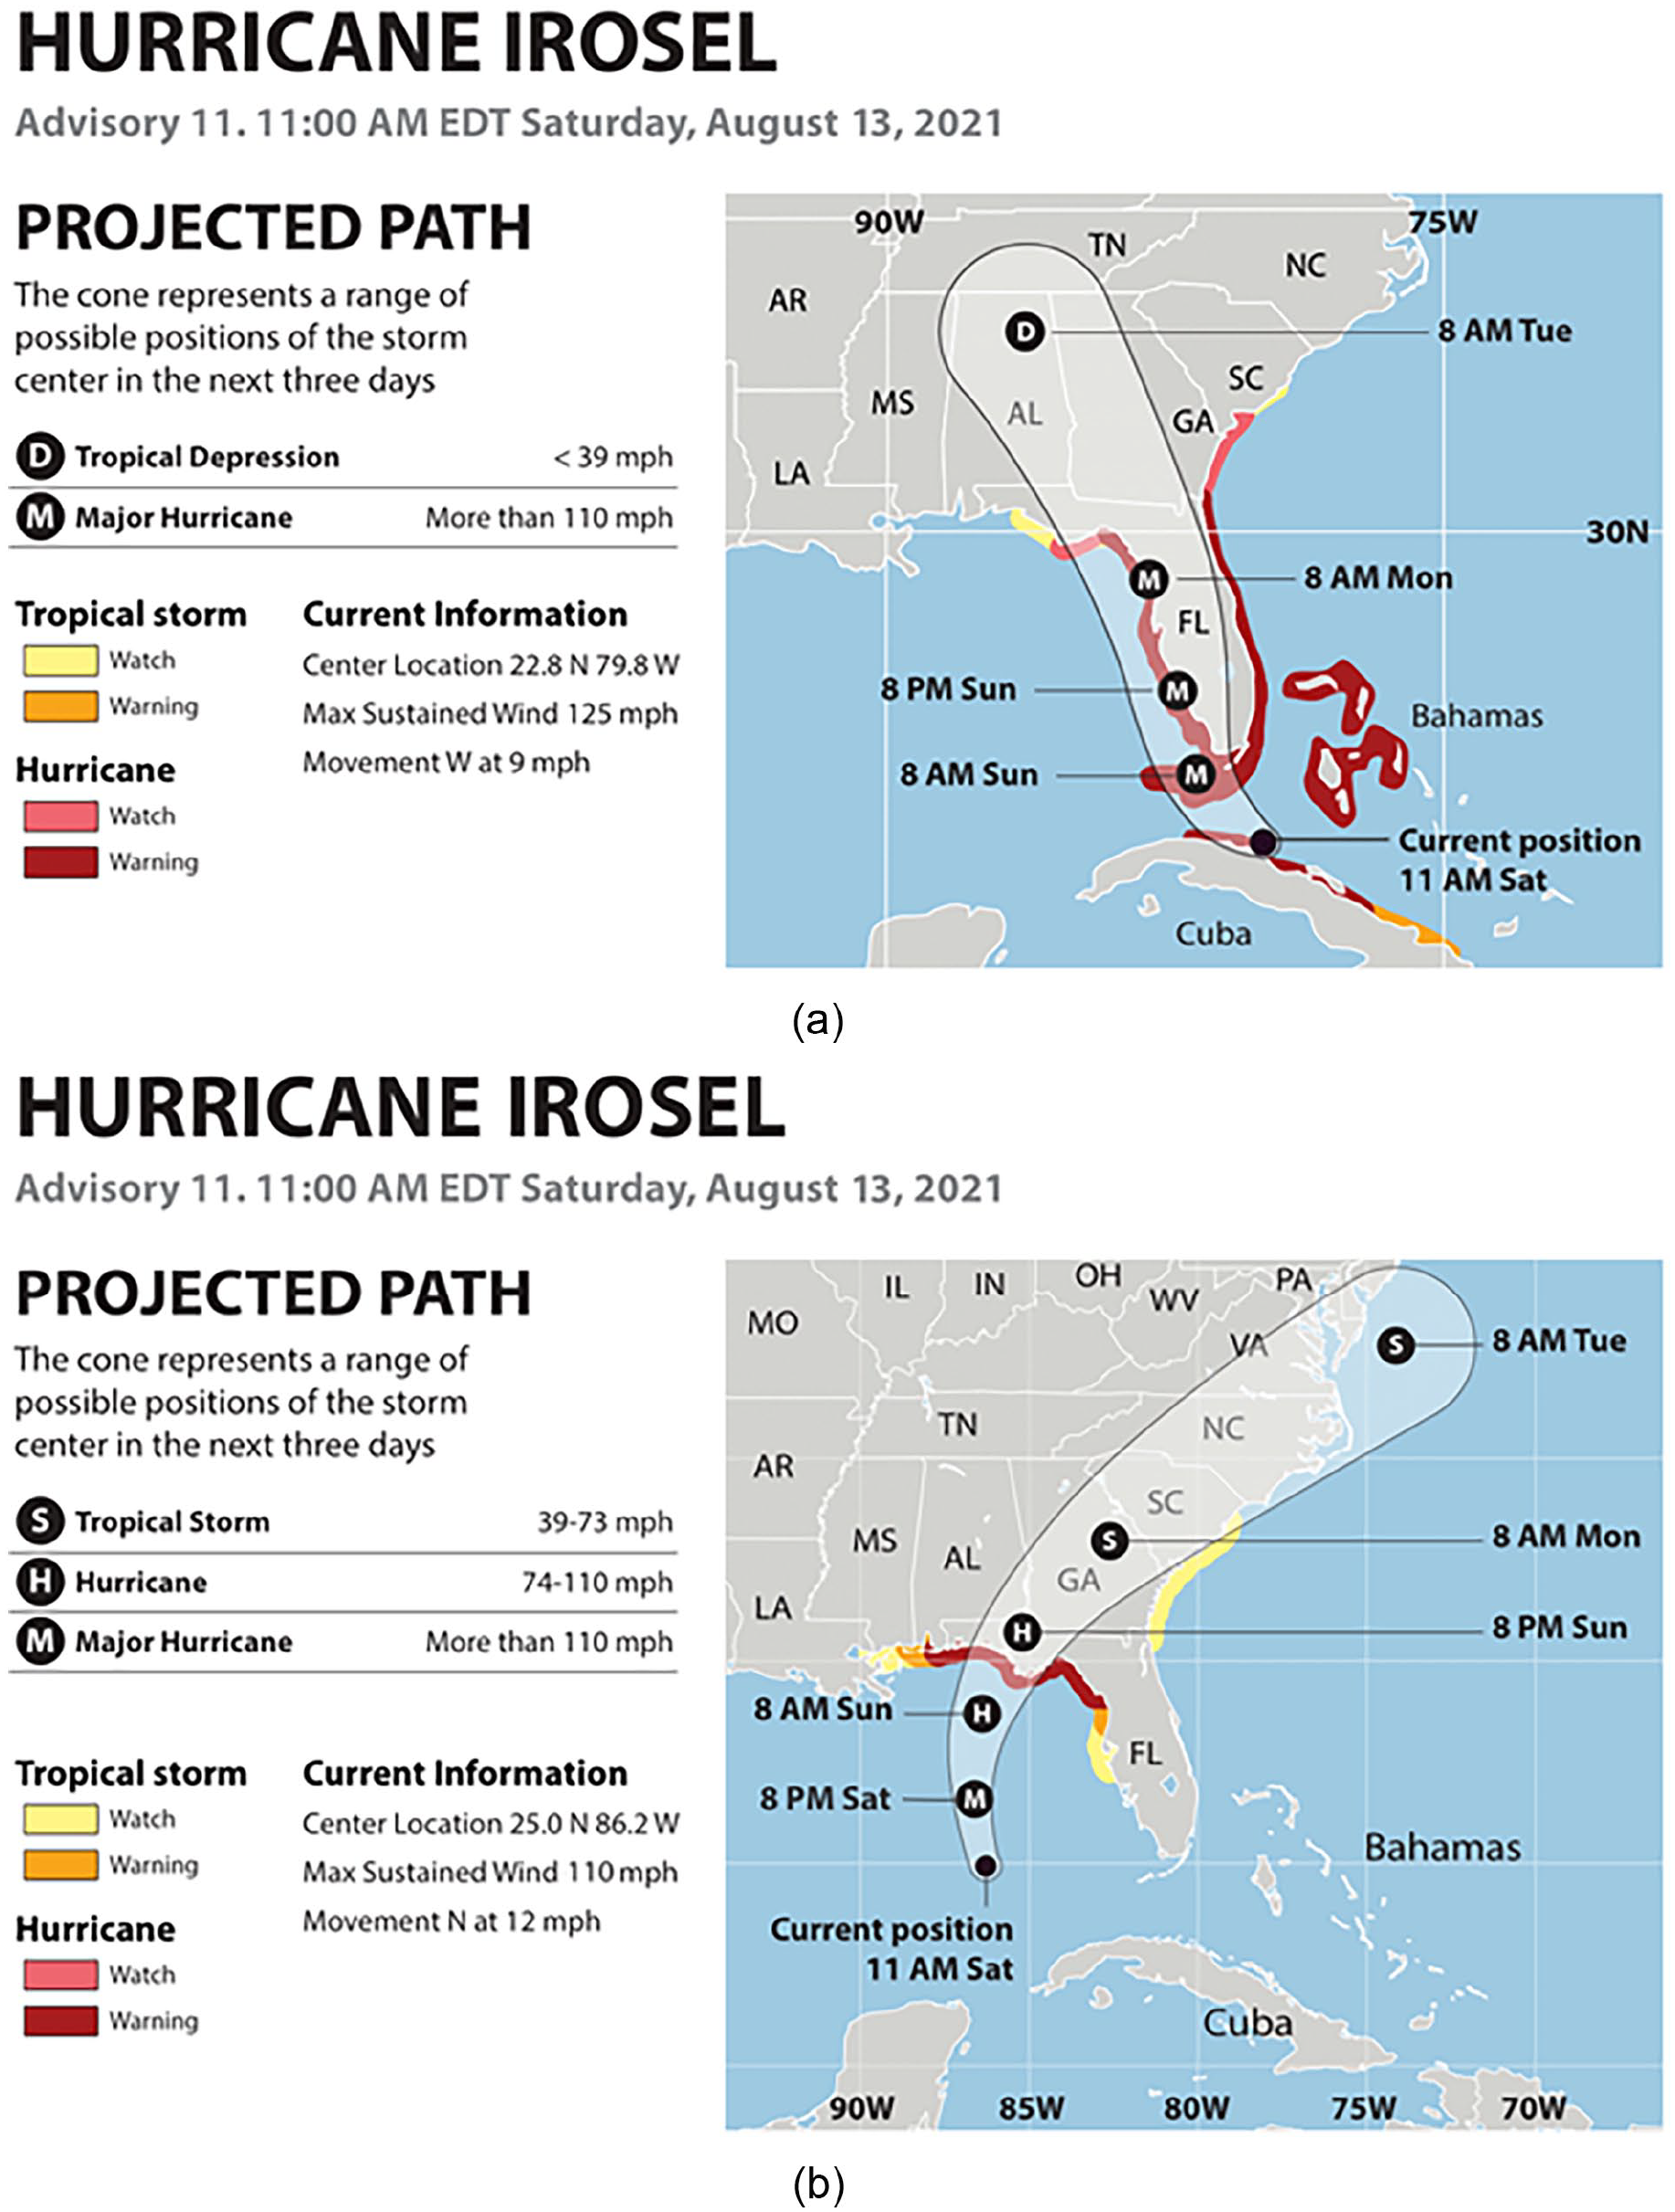
COU graphics for Hurricane Irma (a) and Hurricane Michael (b).
Participants completed two types of tasks: comprehension and decision-making. For the comprehension task, participants were asked to study the assigned display and respond to a set of 13 questions, adapted from Bostrom et al. (2018). These questions pertained to the nature of information presented in the display. In the decision-making task, participants were presented with a list of 10 preparatory actions, adapted from prior research (Miran et al., 2019; Morss et al., 2016; Sherman-Morris et al., 2015, 2020).
The dependent variables were task comprehension, decision-making, and ease of use. Comprehension was measured as the percentage of correct responses to questions about the information presented in the display. Decision making was measured by the number of actions recommended in preparing for the tropical cyclone, as indicated by the participants. Ease of use was measured using the UMUX-Lite questionnaire (Lewis et al., 2013). Participants completed comprehension and decision-making tasks using one of the three display types for either Hurricane Irma or Hurricane Michael.
After respondents consented to participate, they completed a baseline questionnaire that collected demographic information and prior experience with hurricanes and hurricane information. For the comprehension task, participants were shown a randomly assigned display and tropical cyclone condition and responded to questions about a fictitiously named storm approaching Florida. For the decision-making task, participants were shown the same display and tropical cyclone as before; this time, however, a specific location was marked on the map with a blue dot. Each blue dot represented a location that corresponded to one of the four risk categories: minor, moderate, major, and extreme. Participants were assigned to provide recommended actions for only one of these marked locations. After finishing both tasks, participants completed the ease-of-use questions. Participants were paid for their time commensurate with the Qualtrics pay schedule.
Statistical analyses were conducted using analysis of variance (ANOVA) to examine the effects of display type, experience level, and tropical cyclone on comprehension scores and decision-making. Post-hoc tests were used for pairwise comparisons where significant main effects or interactions were found. For the ease-of-use ratings, we employed a two-way ANOVA to investigate the interaction between display type and experience level.
Results
Participants achieved the highest comprehension scores with combined HTI + COU display (M = 0.62, SD = 0.23), followed by COU (M = 0.59, SD = 0.24), and HTI (M = 0.52, SD = 0.25). These scores were significantly higher for the HTI+COU display (F [2, 332] = 3.18, p = .043), particularly among experienced participants (F [1, 332] = 13.61, p < .001). Comprehension scores were also significantly higher for Hurricane Irma (F [1, 332] = 8.15, p = .005), especially for the experienced group. In terms of decision-making, the number of actions participants said they would take when faced with the hurricane varied across display types and experience levels. For experienced participants, COU led to the most reported actions (M = 6.93, SD = 2.0), followed by HTI + COU (M = 6.21, SD = 2.8), and HTI (M = 6.09, SD = 2.7). For novice participants, HTI resulted in the most reported actions (M = 6.28, SD = 2.6), followed by HTI+COU (M = 5.67, SD = 2.9), and COU (M = 5.15, SD = 2.9). Experienced participants indicated significantly more precautionary actions than novices (F [1, 338] = 6.04, p = .014), particularly when using the COU (p < .001). Ease of use ratings showed a statistically significant interaction effect between display type and experience (F [2, 338] = 5.14, p = .006), with the experienced group rating HTI (M = 73.83, SD = 20.98) and COU (M = 73.39, SD = 24.62) higher than the novice group (MHTI = 57.02, SDHTI = 29.16; MCOU = 49.70, SDCOU = 31.05). However, no difference was detected for the HTI+COU display between the experienced (M = 65.80, SD = 28.51) and novice (M = 65.42, SD = 28.74) groups.
Discussion
The study highlights the importance of integrating multiple types of information (hazard and path) to enhance user comprehension of tropical cyclone risks. The combined display (HTI + COU) led to higher comprehension scores, particularly among experienced participants, suggesting that integrating hazard and path information can improve understanding of the risks associated with tropical cyclones. Prior experience, in particular, played a significant role in both comprehension and decision making, with experienced participants performing better and indicating more precautionary actions. This finding emphasizes the influence of prior experience on risk perception and preparedness. Interestingly, while experienced participants found the individual display formats (HTI and COU) easier to use, the combined display (HTI+COU) was perceived similarly by both experienced and novice users.
This study also underscores the need for researchers to consider storm characteristics when evaluating weather risk communication graphics. Comprehension scores varied significantly between experienced and novice groups for Hurricane Irma, which threatened a larger area, but not for Hurricane Michael, which threatened a smaller region. This finding highlights the potential influence of storm characteristics on risk perceptions and decision-making processes, emphasizing the importance of including diverse storm scenarios in the evaluation of risk communication graphics.
Future research should focus on several key areas. First, researchers should work on improving the design of integrated displays that combine multiple types of information, such as the HTI + COU format used in this study. This could involve experimenting with different visual elements, layout designs, or interactive features to make the combined hazard and path information more intuitive and easier to understand for all users, regardless of their prior experience with tropical cyclones. Second, a more in-depth investigation into the influence of specific storm characteristics on risk perception and decision-making is warranted, given the differences in participant responses for Hurricane Irma and Hurricane Michael. Finally, developing targeted strategies to address misinterpretations and support informed decision-making across diverse user groups is crucial for improving overall public safety during tropical cyclone events. By continuing to explore these areas, researchers and meteorologists can work toward creating more effective and universally understood tropical cyclone forecast graphics, ultimately improving public preparedness and response to these potentially devastating weather events.
Conclusion
This research contributes to understanding the complex interplay between display type, prior experience, and user interpretation of tropical cyclone forecast information. The findings show the benefits of integrating hazard information alongside forecast paths, as demonstrated by enhanced comprehension scores with the combined display (HTI + COU). While this study has provided valuable insights into the effectiveness of different tropical cyclone warning displays, challenges remain in addressing misinterpretations of the information depicted in the graphics, particularly among users with different levels of prior experience. These findings underscore the need for further research to improve the effectiveness of tropical cyclone communication graphics and empower individuals to take proactive measures in mitigating the impact of these events.
Footnotes
Declaration of Conflicting Interests
The author(s) declared no potential conflicts of interest with respect to the research, authorship, and/or publication of this article.
Funding
The author(s) disclosed receipt of the following financial support for the research, authorship, and/or publication of this article: This project was funded by a grant from U-LINK, the University of Miami Laboratory for Integrative Knowledge.