
Abstract
Objective
We investigate the impact of event uncertainty, decision support (DS) display format, and DS sensitivity on participants’ behavior, performance, subjective workload, and perception of DS usefulness and performance in a classification task.
Background
DS systems can positively and negatively affect decision accuracy, performance time, and workload. The ability to access DS selectively, based on informational needs, might improve DS effectiveness.
Method
Participants performed a sensory classification task in which they were allowed to request DS on a trial-by-trial basis. DS was presented in separated-binary (SB), separated-likelihood (SL), or integrated-likelihood (IL) formats. Access preferences, task performance, performance time, subjective workload, and perceived DS usefulness and performance were recorded.
Results
Participants accessed DS more often when it was highly sensitive, stimulus information was highly uncertain, or the DS cue and stimulus information were perceptually integrated. Effective sensitivity was highest with the integrated likelihood DS. Although the separated likelihood DS provided more information than the binary likelihood DS, it was accessed less often, leading to lower sensitivity.
Conclusion
Participants are most likely to access DS when raw stimulus information is highly uncertain and appear to make effective use of likelihood DS only when DS cues are integrated with raw stimulus information within a display.
Application
Results suggest that DS use will be most effective when likelihood DS cues and raw stimulus information are perceptually integrated. When DS cues and raw stimuli cannot be perceptually integrated, binary cues from the DS will be more effective than likelihood cues.
Introduction
Studies on the use of decision support (DS) typically manipulate the availability of support between blocks of experimental trials. Consequently, participants have DS in situations in which the decision was difficult and in situations in which it was easy to decide even without the DS. Here, we examine the decision to use DS at the single-trial level as a function of trial difficulty, the quality of the information provided by the DS, and the DS display format.
The performance of a DS system is determined by the information the DS receives and the DS algorithm. Responses to DS depend not only on the performance of the DS but also on its display format. For example, it was more difficult for decision makers to ignore unhelpful cues from a DS when they were integrated with the raw data than when they were spatially separated (Meyer, 2001). This pattern is consistent with the Proximity Compatibility Principle (PCP) of display design (Wickens & Carswell, 1995), which holds that the perceptual grouping of display channels facilitates the integration of information from multiple sources (see also, Ayres & Sweller, 2005; Moreno & Mayer, 1999).
A related aspect of DS design is whether the DS judgment should be shown as a simple binary cue or in a finer grain. Sorkin et al. (1988) proposed the idea of likelihood alarms, diagnostic DS systems, initially explored within industrial process control settings, highlighting the potential of graded measures. In theory, DS systems that provide confidence estimates should engender better human performance than binary DS systems because they provide more information (Bahrami et al., 2010; Bartlett & McCarley, 2017). However, empirical comparisons of binary and likelihood DS have produced mixed results. Several studies compared the effectiveness of graded decision support (DS) cues to binary ones, finding no significant advantage. Bartlett and McCarley (2017) had participants act as geologists sorting fictional minerals by identifying the dominant color in orange and blue random-dot images, aided by a DS that provided judgments in binary or likelihood display forms. Carragher and Hancock (2023) tasked participants with face matching; they manipulated the existence of an Automated Facial Recognition System with binary or likelihood output from the system. Pharmer et al. (2022) conducted a controlled experiment to assess the influence of DS transparency in a maritime collision avoidance scenario. Participants either received recommendations from a collision avoidance system or the same recommendations alongside confidence ratings, revealing the system’s certainty in its suggestions. Wickens and Colcombe (2007) assessed pilots managing a dual task of tracking and conflict detection with binary or likelihood alerts.
Other research, though, has suggested the superiority of graded DS cues over binary. Zirk et al. (2020) presented a control room operation task requiring the management of two simultaneous tasks with the support of a binary or a likelihood alarm system. Participants showed improved decision making strategies with graded DS. Similarly, Meyer et al. (2020) engaged participants in distinguishing between malicious and innocuous downloads, finding that graded DS cues led to quicker decisions and greater trust in the system. These mixed results can be attributed to a range of factors. The effectiveness of binary versus likelihood cues may vary significantly depending on the complexity of the task and the context in which it is applied. For simpler tasks, binary cues might suffice, whereas more complex decision making scenarios could benefit from the nuanced information from likelihood cues (Sorkin et al., 1988). The cognitive load can also be a significant factor; users might prefer binary cues as they are easier to process. However, when users can manage cognitive demands, likelihood cues could offer advantages by enabling more informed decision making (Sorkin et al., 1988). An additional factor might be individual differences. This complexity emphasizes the importance of tailoring DS to their intended use cases’ specific needs and conditions to support optimal decision making.
When users choose whether to consult DS support, they often choose nonoptimally. As expected, they consult a reliable DS more often than a less reliable one (Montanari & Nunnari, 2019) and can generally distinguish when it is worth purchasing information (Ben Yaakov et al., 2019; Pescetelli et al., 2021). However, they sometimes access information that is not worth the cost and sometimes decline information that would benefit them (Ben-Yaakov et al., 2021). A possible explanation for this nonoptimal behavior is “confirmation bias,” a tendency for people to gather information supporting their beliefs even when the additional information is worthless (Baron & Hershey, 1988). Evidence of “confirmation bias” can be seen in recent studies where operators seek confirmation when using DS, preferring to consult systems that are biased to agree with them (Montanari & Nunnari, 2019). We predict that participants will adapt their decision in response to raw information quality, showing a higher tendency to use DS in ambiguous events. This prediction aligns with the idea that individuals are more inclined to seek external support when faced with high uncertainty (Pescetelli et al., 2021).
Studies have also addressed the effect of using DS on different aspects of performance. Many (e.g., Bartlett & McCarley, 2017, 2019; Ben Yaakov et al., 2020; Boskemper et al., 2022; Munoz et al., 2022; Wang et al., 2009) found that DS improved decision accuracy in signal detection tasks and could reduce operator workload (Rottger et al., 2009; Todd & Benbasat, 1992) and shorten decision times (Botzer et al., 2013). However, DS is not guaranteed to be helpful (Parasuraman & Manzey, 2010) and can even compromise performance (Wickens & Dixon, 2007). In a previous study, we found that participants could identify when to acquire additional information but did not invest optimally. Overinvestment occurred when the expected benefit was low, and underinvestment happened when benefits were high. This suboptimal investment behavior extended to DS utilization, suggesting a discrepancy between actual and optimal use (Ben Yaakov et al., 2019).
This study introduces a novel approach to DS implementation by allowing users to access DS on a trial-by-trial basis, diverging from traditional block design methodologies where DS is either constantly available (e.g., Bartlett & McCarley, 2017; Meyer et al., 2020; Pharmer et al., 2022) or its usage is predetermined by users at the start of a block (Ben Yaakov et al., 2019; Ben-Yaakov et al., 2021). Our trial-by-trial design requires users to consider whether to actively seek additional information, unlike traditional block designs where users decide whether to use or ignore available information. This innovation seeks to mimic real-world decision making scenarios more closely, where the need for additional information can vary significantly from one situation to another, depending on, among other things, the uncertainty users encounter. By employing the trial-by-trial approach, the study explores how DS Display Format and event uncertainty affect access decisions to use DS, task performance, performance time, perception of DS usefulness and performance, and cognitive workload. This contribution bridges a gap in the literature regarding the dynamics of DS utilization, offering theoretical insights into how and in which conditions individuals choose to engage with DS actively, as the current literature does not differentiate when DS information is used or ignored. The approach can potentially inform the design of more effective DS systems better aligned with users’ decision making needs, ultimately enhancing performance in complex tasks.
Method
Participants
We recruited 171 participants (mean age = 59.71 years, SD = 16.67, range = 18–99, 94 female and 77 male) from the sourcing platform Cloud Research. Participants were paid according to the platform’s payment systems and received a base payment of US$1.5 for their participation. In a pilot study, we examined the effect of stimulus strength and DS Format on DS access, revealing an interaction odds ratio of 5.26. We then converted this odds ratio to Cohen’s d effect size, resulting in a computed effect size of 0.91 (Cohen, 1988). For the main study’s sample size determination, we conducted a power analysis using R (version 4.2.2) software with the “pwr” package (version 1.30) for a two-sample t-test. We used the computed effect size of .91, alpha = .05, and power = .8. The analysis, based on a two-sample t-test, suggested a sample size of 20 participants per group. Additionally, we conducted a power analysis using G*Power (3.1.9.4) for ANOVA: Fixed effects, special, main effects, and interactions. With a Cohen’s f effect size of .46, and maintaining the same alpha (.05) and power (.80) settings, the analysis indicated a required sample size of 9 participants per group. However, to ensure robust results across our study’s various conditions, we opted to adhere to the more conservative sample size estimate derived from the two-sample t-test analysis. Therefore, we set the minimum number of participants in each condition at 20.
Apparatus
We developed the experiment as a web-based system with a back-end side implemented with a Python infrastructure (using the Django library), a database (MySQL), and a front-end side developed in HTML. Participants performed the experiment on their own devices, which were restricted to desktop or laptop computers. The research complied with the American Psychological Association Code of Ethics and was approved by the Tel Aviv University Ethics Committee for Research with Human Participants. Informed consent was obtained from each participant.
Stimuli
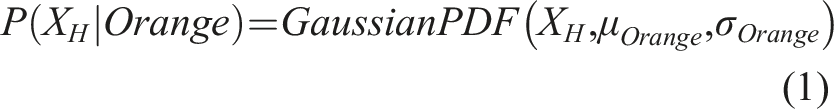
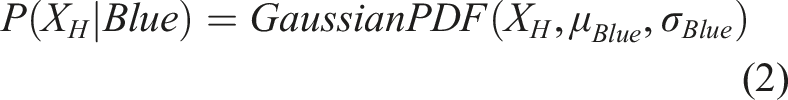
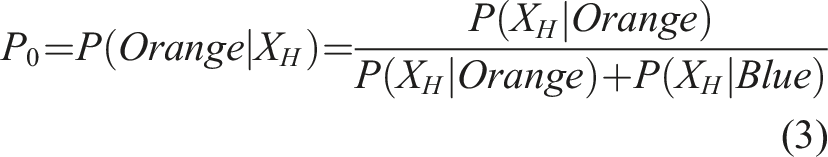
Stimuli were 426 × 426 orange and blue random-dot images, where each dot was assigned the color orange with probability pO and the color blue with probability 1-pO. The value of pO in each trial was determined by randomly sampling a value XH from a Gaussian distribution, computing the Probability Density Function (PDF) under the Orange and Blue hypothesis, and then computing the posterior probability of orange given XH using Bayes’ theorem, as can be seen in equations (1)–(3):
Values of XH images were sampled with equal probability from distributions with μ = −.75 for the orange-dominant stimuli and μ = .75 for the blue-dominant stimuli with σ = 1 for both distributions. As described below, the participant’s task was to discriminate orange-dominant from blue-dominant stimuli. The best-achievable d', as determined by the variability in the stimuli, was approximately 1.5.
Procedure
In each trial, participants decided whether the stimulus image reflected a blue-dominant or orange-dominant distribution (see Bartlett & McCarley, 2017; Voss et al., 2004). A cover story asked them to imagine themselves as geologists sorting samples of a fictional mineral, vibranium, into blue and orange strains. They were instructed: “Unfortunately, the two strains are difficult to tell apart. Both are speckled blue and orange. The only visual difference is that one strain tends to have a little more orange, and the other tends to have a little more blue. For simplicity, we will call them VBN-ORANGE and VBN-BLUE. However, there is a lot of overlap in their appearance, and it is almost impossible to sort them with 100% accuracy by eye.”
A point system was used to incentivize performance. Participants began the experiment with 30 points and were awarded 2 points for each correct response and penalized 2 points for each incorrect response.
Participants could request assistance from DS for 0.1 points per trial. The DS displayed its cue in one of three formats, as shown in Figure 1: Separated-Binary (SB), Separated-Likelihood (SL), or Integrated-Likelihood (IL). The sensitivity of the DS was low (d' = .75; accuracy = 65% for unbiased binary judgments) or high (d’ = 2.25; accuracy = 87% for unbiased binary judgments). All DS systems operated by first sampling an evidence value XDS from a normal distribution with σ = 1. For the low-sensitivity DS, evidence values were sampled from a distribution with μ = −0.375 for orange and μ = 0.375 for blue-dominant trials. For the high-sensitivity DS, evidence values were sampled from a distribution with μ = −1.125 for orange-dominant trials and μ = 1.125 for blue-dominant trials. Using an unbiased response criterion, the SB DS rendered a binary orange or blue judgment. Binary cues were displayed as an orange or blue colored bar beneath the random dot stimulus. The SL DS rendered its judgment as a random dot image in which Original stimulus (panels A and B) and the DS display formats for the SB (panel C), IL (panel D), and SL (panel E) formats. Stimuli are represented as smaller in the SL condition in this figure for clarity and do not reflect actual experimental sizes. (a) A sample orange-dominant stimulus image (p = .4); (b) a sample blue-dominant stimulus image (p = .4); (c) a sample orange-dominant stimulus image (p = .4), with the SB display format; (d) IL display format, orange-dominant stimulus image (p = .3), based on the orange-dominant stimuli in (a) and (b) and the DS informations; (e) SL sample orange-dominant stimulus image (p = .4) for the human stimulus (left) and (p = .2) for the DS stimulus (right).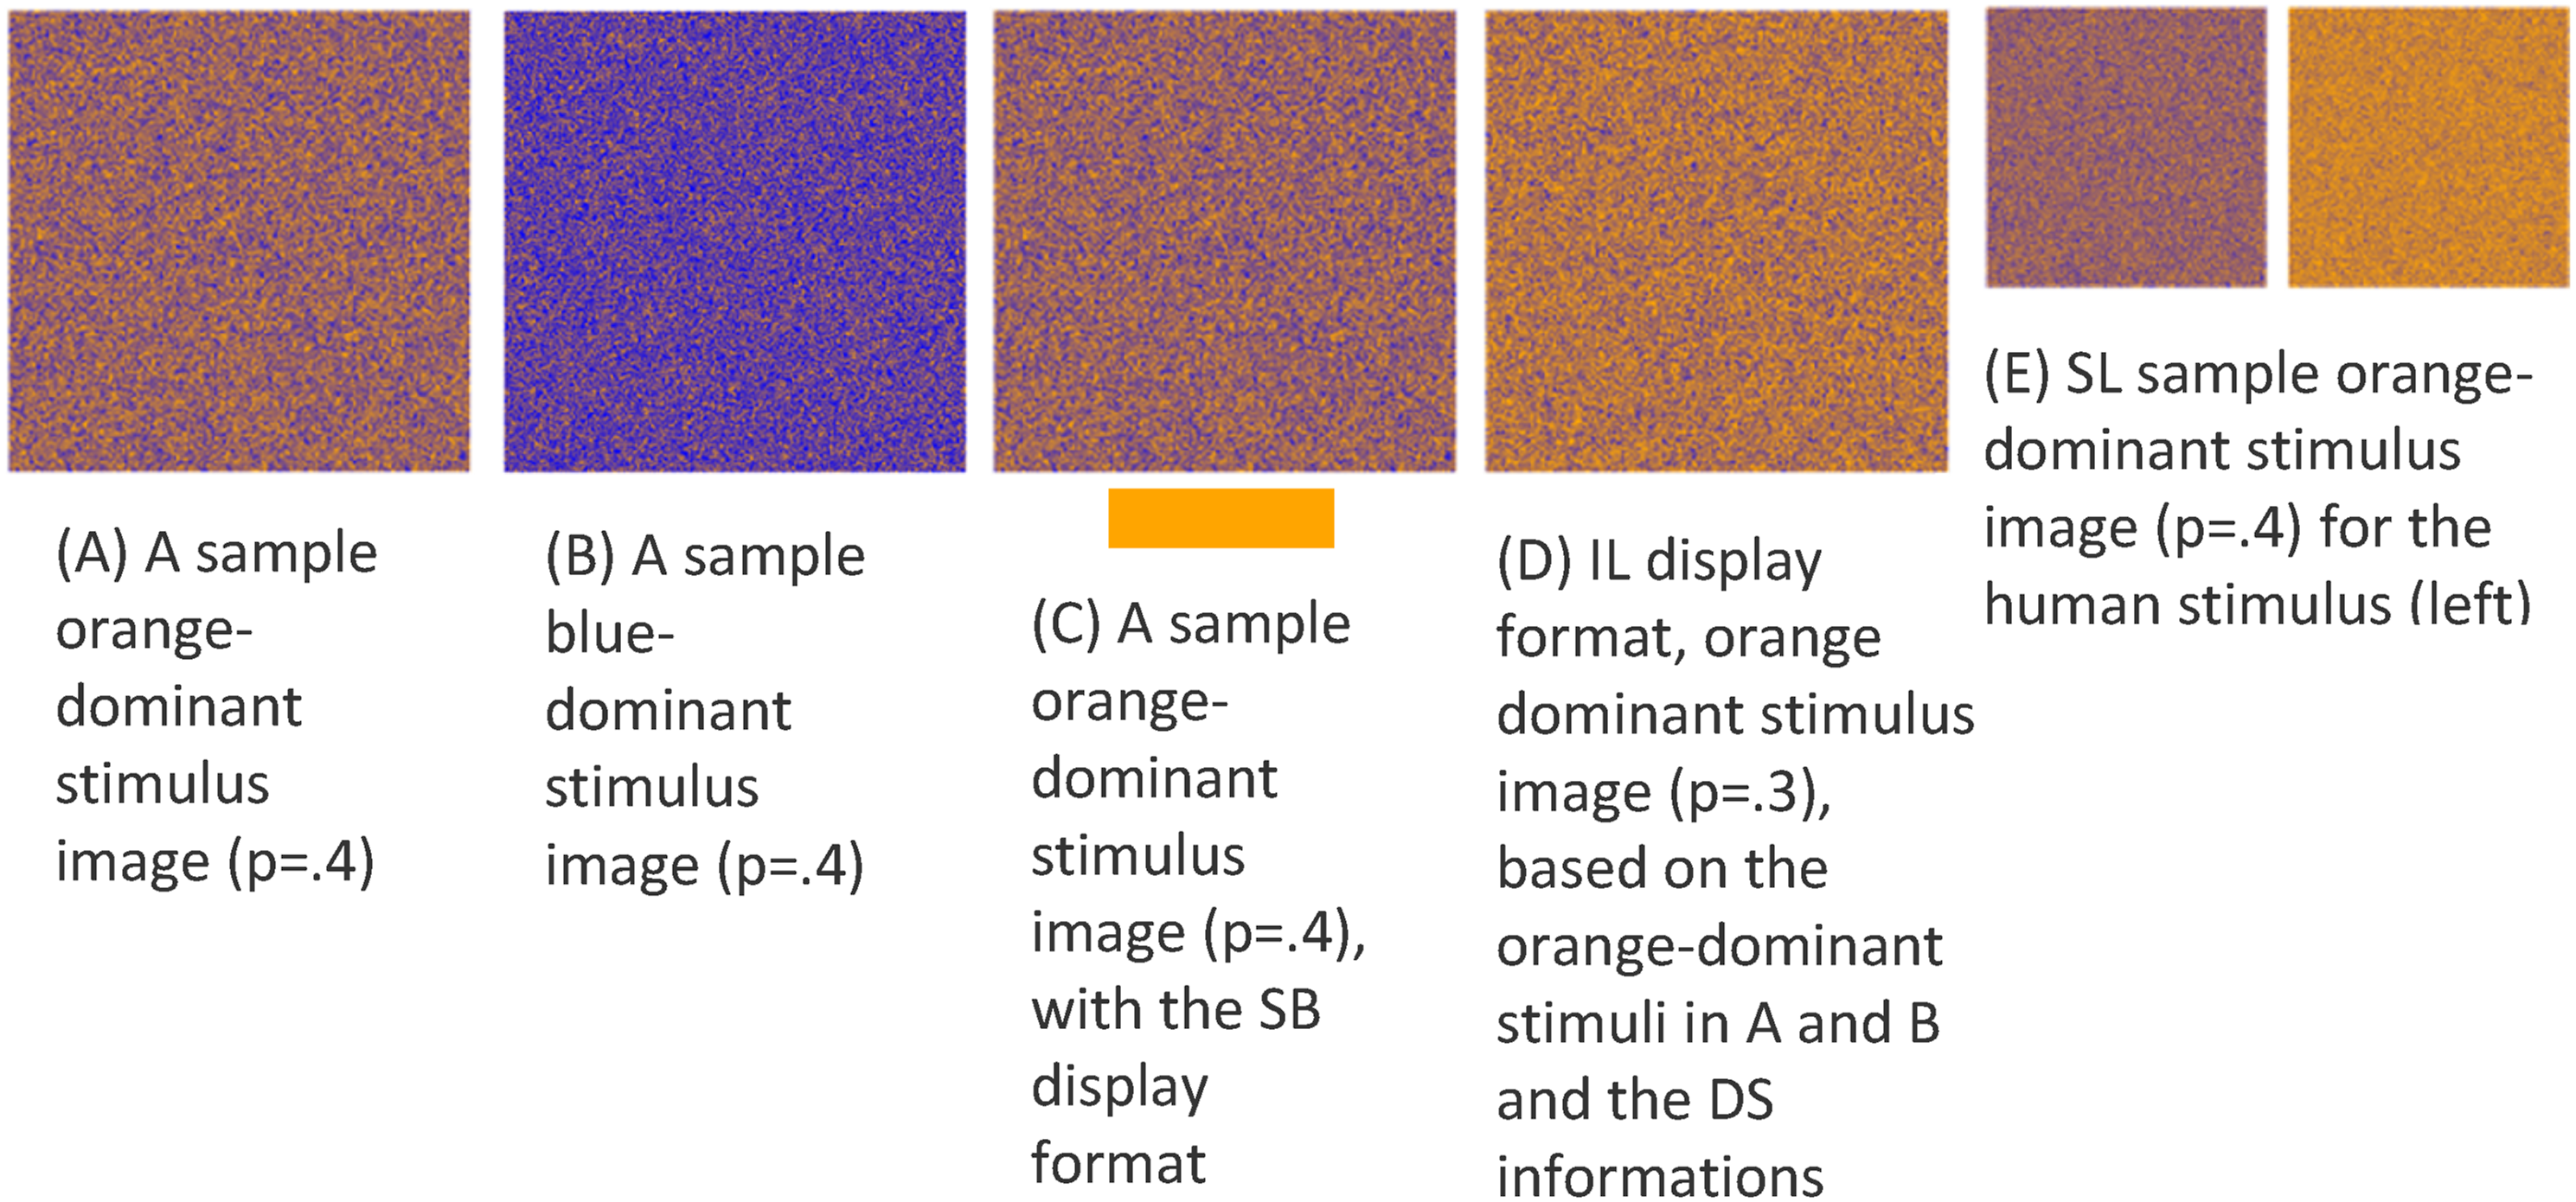
The IL DS integrated the aid’s evidence value with the human’s evidence by updating the random dot display, shifting the proportion of blue dots in the direction suggested by the aid’s observation. As illustrated in Figure 1(c), the proportion of orange dots in the IL display is increased relative to the original stimulus shown in Figure 1(a), reflecting the DS’s judgment. The proportion of blue dots in the IL display was determined by using the probability of XH as the prior probability for a Bayesian calculation of the posterior probability in light of XDS, as shown in equation (4). Here,

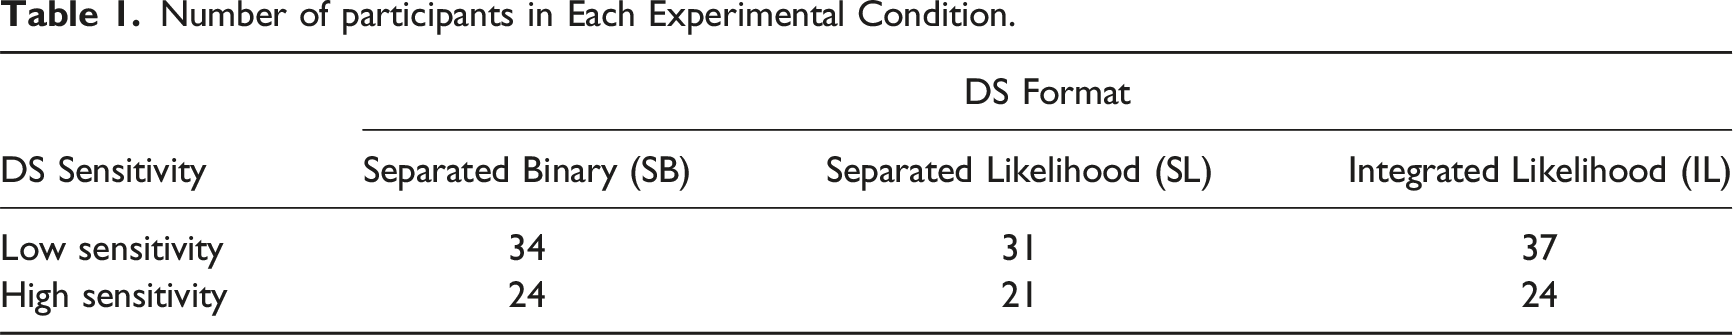
Number of participants in Each Experimental Condition.
Participants performed the task in 3 blocks. During the first 2 blocks, each consisting of 16 trials, the participants familiarized themselves with the task and the system. The first block was without the DS aid. In the second block, the aid was available by default on all trials. We did not analyze the results of these blocks. The third block consisted of 50 trials, half sampled from the distribution with more blue and the other half with more orange dots. Values of XH and XDS for all trials were pregenerated. Values of XH were similar for all participants, and values of XDS were the same for all participants within a given level of DS sensitivity. The order of trials was randomized between subjects.
We recorded DS access choice (yes or no), classification decisions (blue or orange), and classification time for each trial. At the end of the experiment, participants reported their subjective workload by completing the NASA-TLX questionnaire separately for events for which they had and had not used the DS. They also answered two questions regarding their perception of DS’s usefulness and performance on a 1-10 scale: (1) How much did the automation help you in the task? (2) How good was the automation in distinguishing between blue and orange Vibranium strains?
Results
To address the unbalanced design in our data analyses, we employed Type III sums of squares in our ANOVA. For post-hoc comparisons, we used Tukey’s HSD test, which is robust to unbalanced designs and effectively controls the family-wise error rate. We also used mixed regressions which efficiently address unbalanced group sizes.
Tendency to access DS
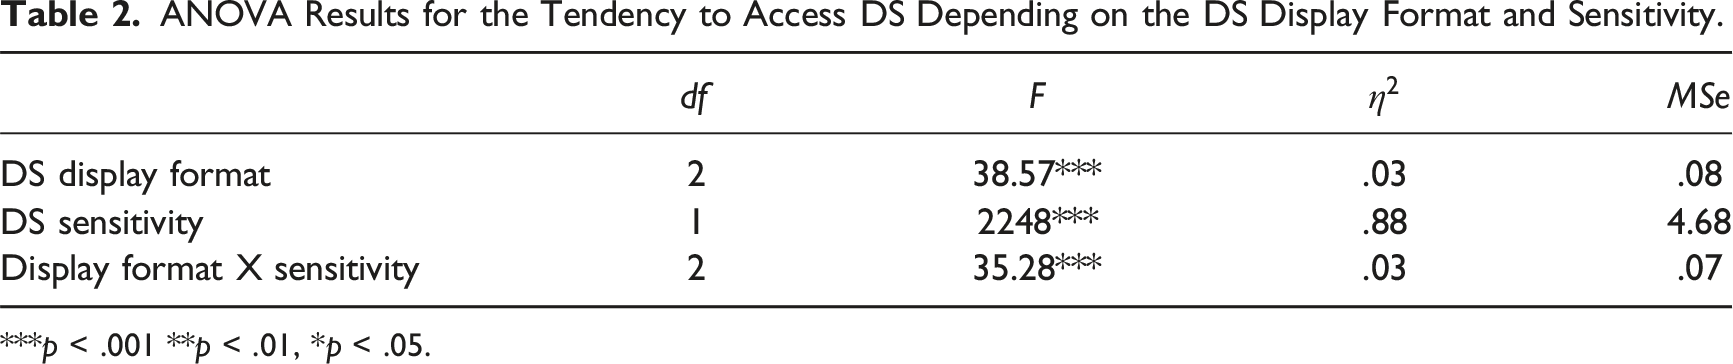
We conducted a two-way analysis of variance (ANOVA) to compare the effects of the DS format (SB, SL, or IL) and Sensitivity (low or high) on the tendency to access the DS. Figure 2 and Table 2 present the data and results of the analysis. Both main effects and the interaction were significant. Simple-effects ANOVAs for each level DS sensitivity showed that the DS format had no significant effect when DS sensitivity was low, Tendency to access DS as a function of the DS format and Sensitivity. Note: In this and other data figures, violin plots represent distributions of empirical scores. Violin width is scaled to the number of observations. ANOVA Results for the Tendency to Access DS Depending on the DS Display Format and Sensitivity. ***p < .001 **p < .01, *p < .05.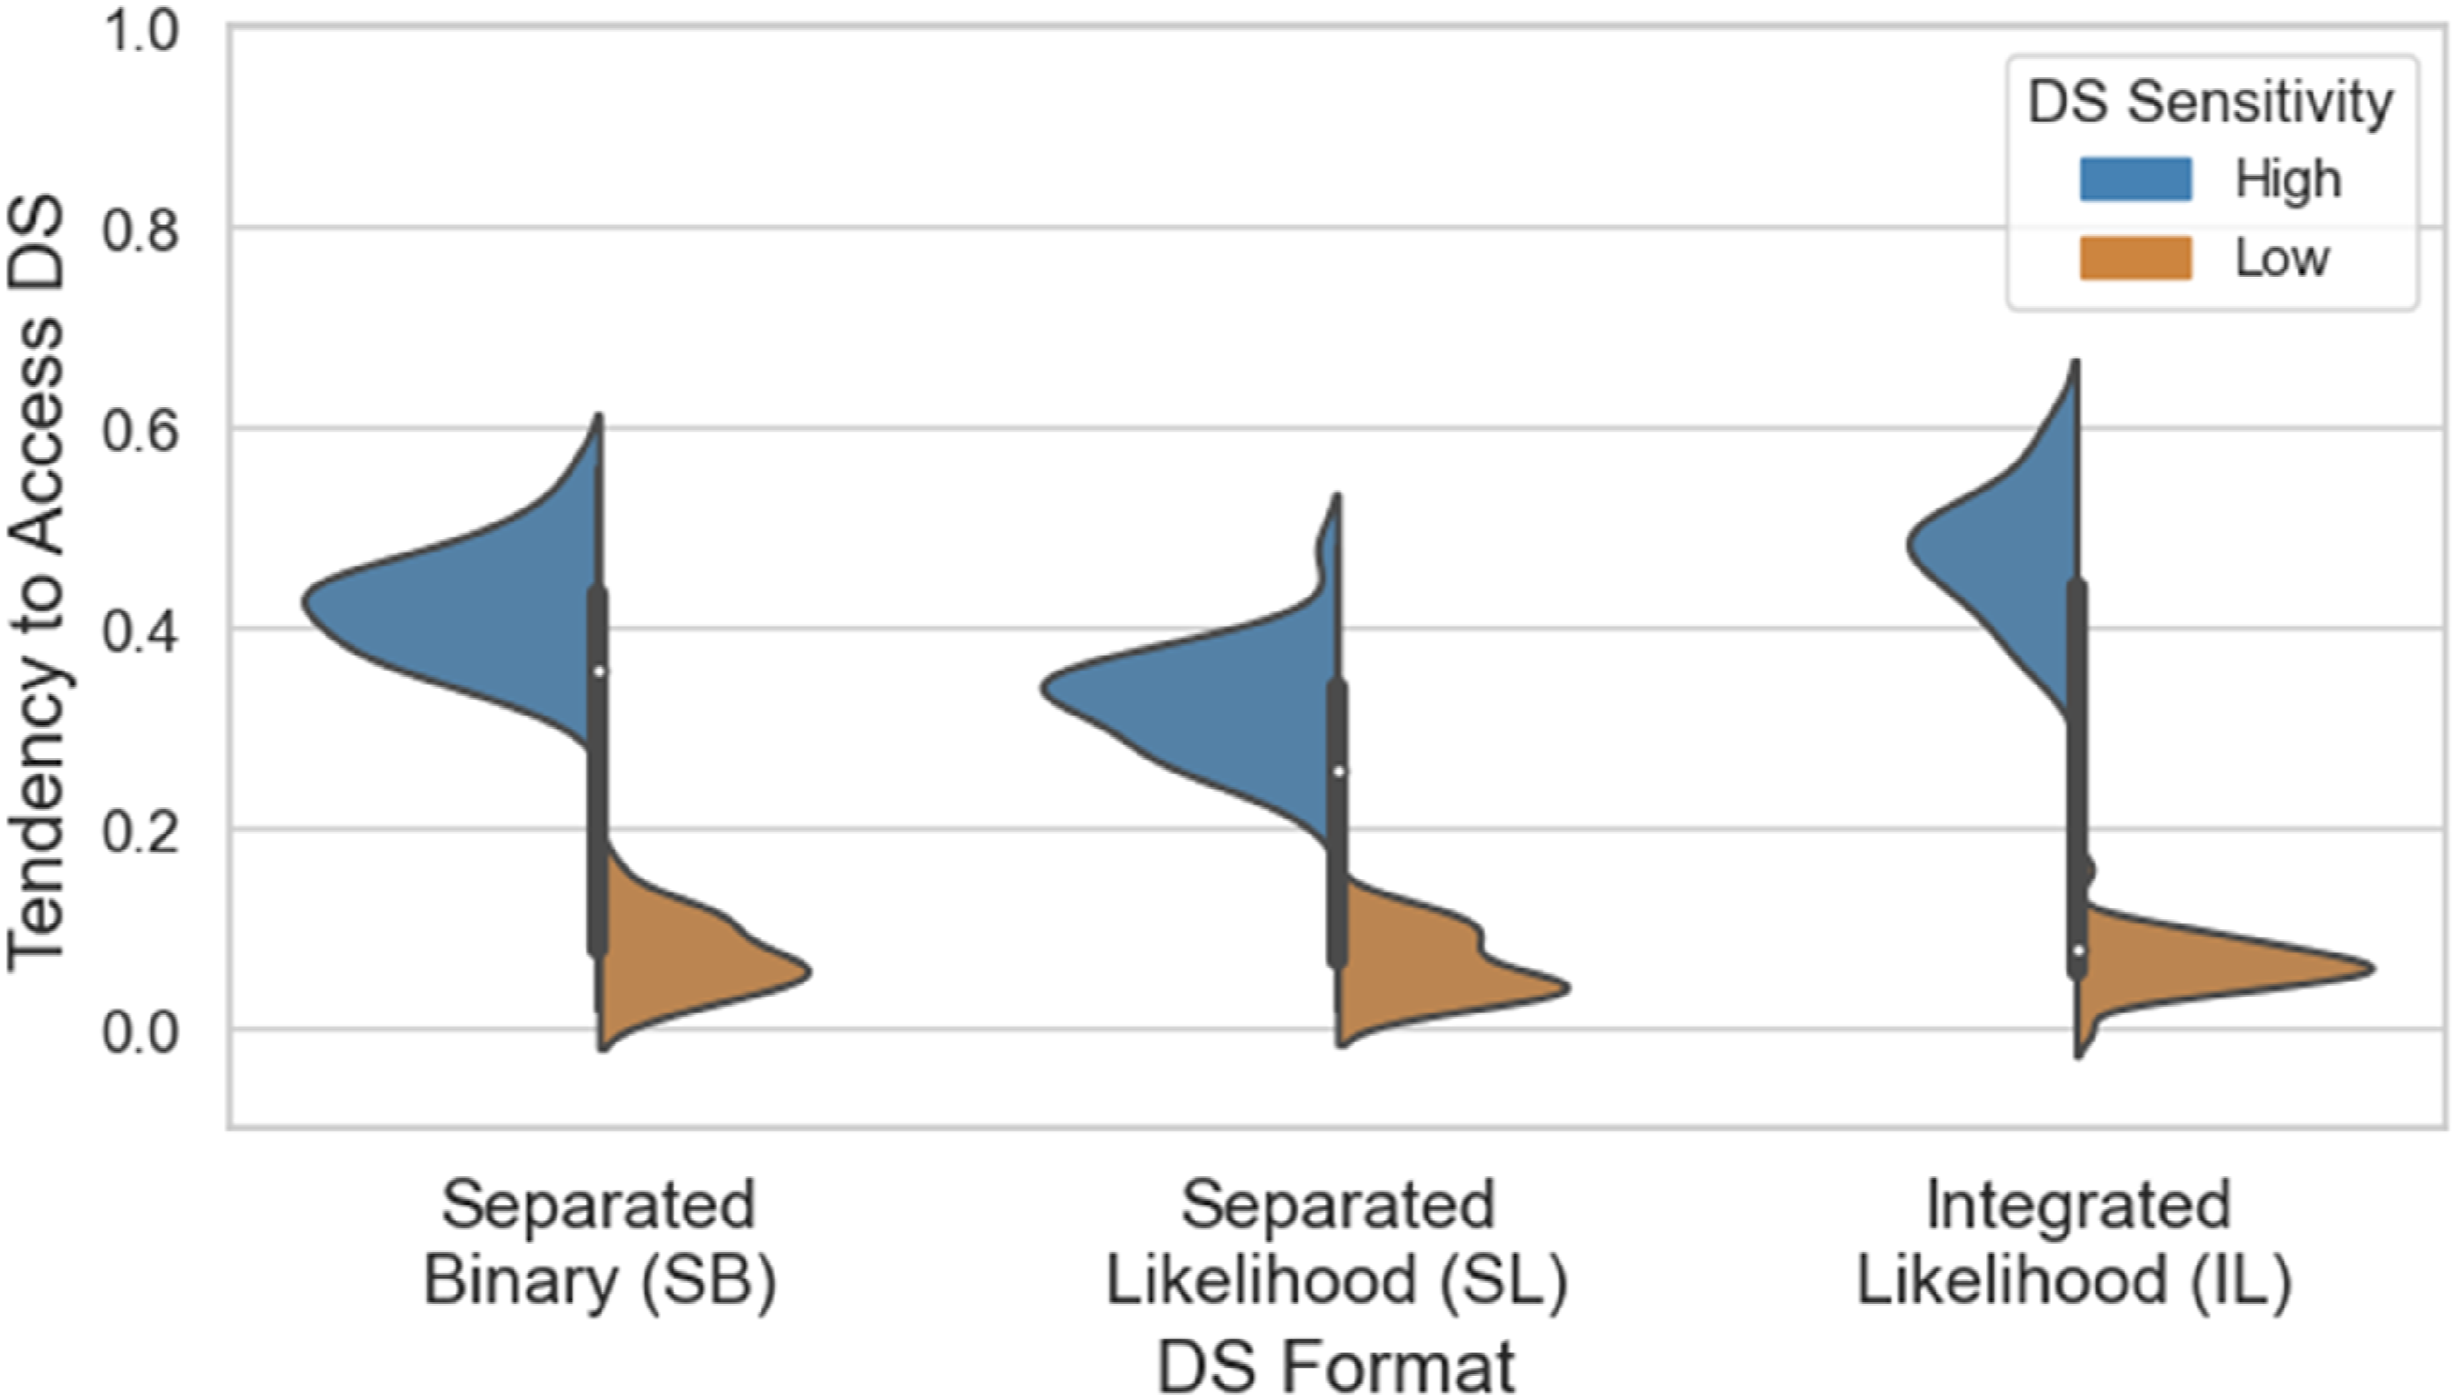
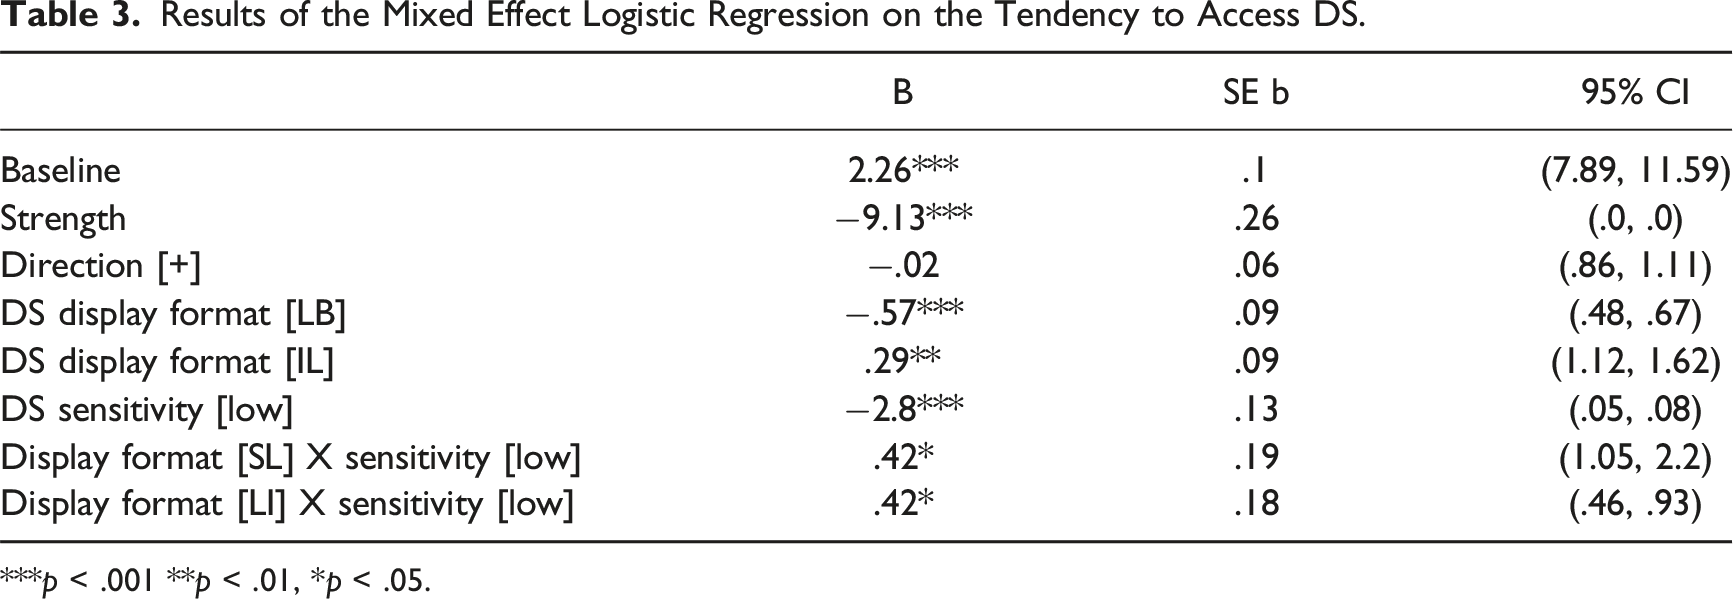
To analyze data at the single-trial level, we computed two independent variables for each trial: the strength of the signal, measured as the absolute difference of the proportion of dominant-color dots from 0.5, and the direction of the deviation, either Blue or Orange. We analyzed the decision to access the DS as a function of the strength and direction of the signal, display format, and DS sensitivity using mixed effects logistic regression. Participants served as a random effect, and display format, sensitivity, strength, and direction and the two-way interaction of Display format × DS Sensitivity were fixed effects. Figure 3 and Table 3 present the data and results of the model. Tendency to Access DS as a function of the DS Sensitivity, DS Format, Signal Strength, and Signal Direction. Note: Data from the low and high DS sensitivity conditions are presented in the left and right panels, respectively. Results of the Mixed Effect Logistic Regression on the Tendency to Access DS. ***p < .001 **p < .01, *p < .05.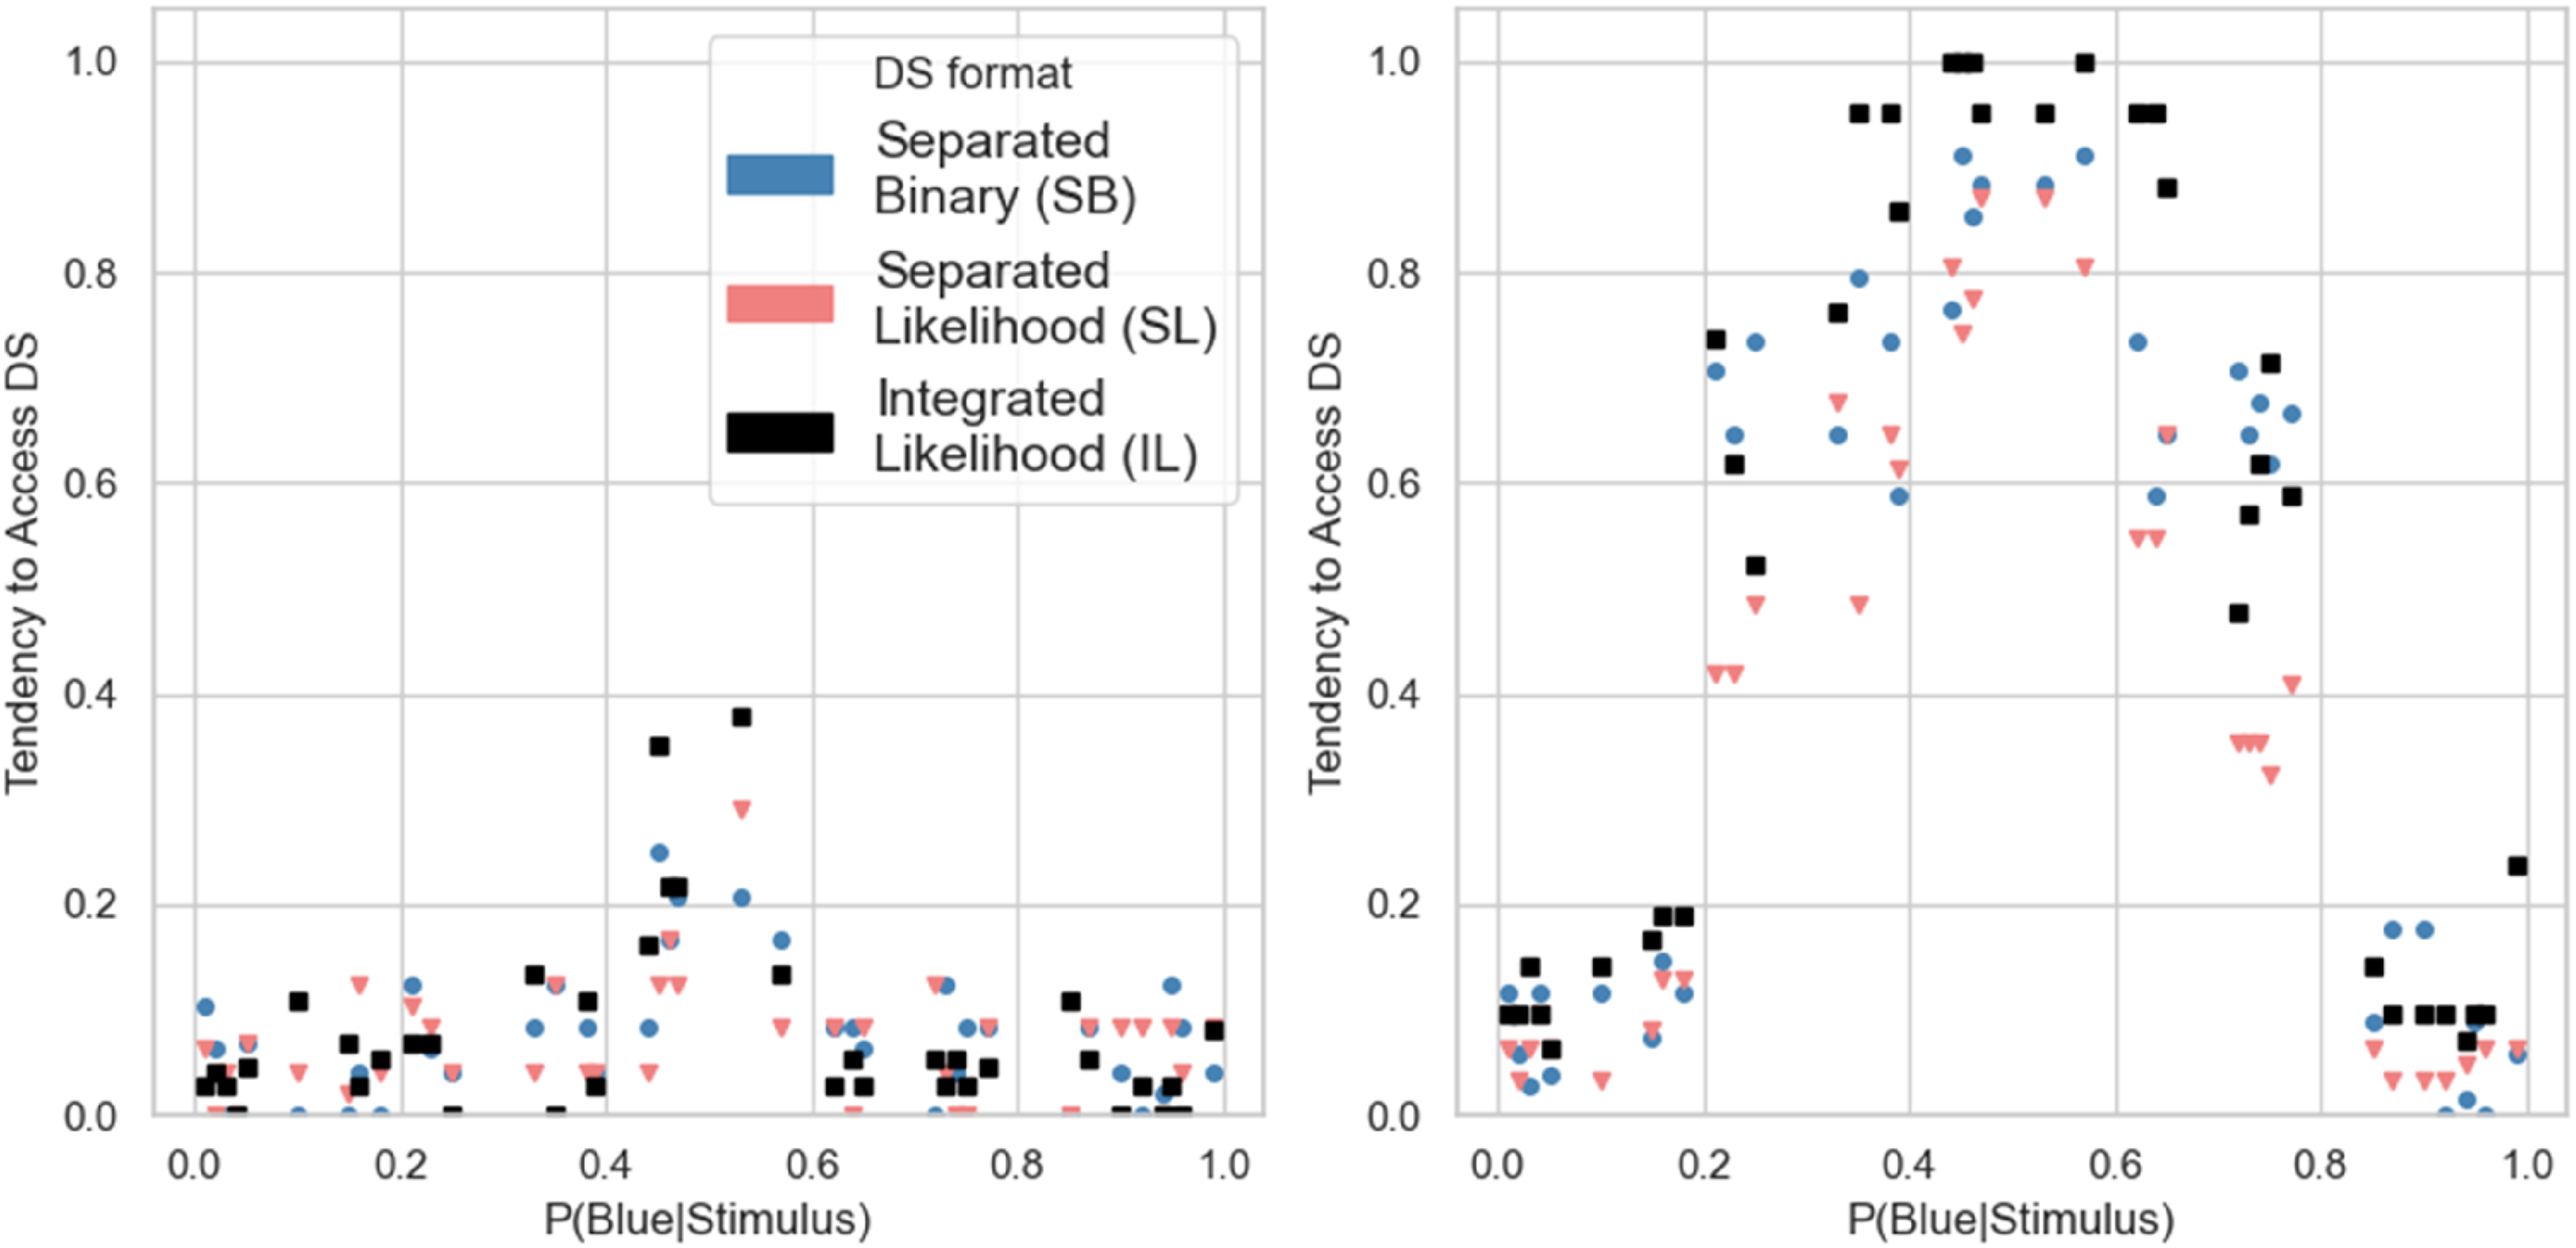
Performance
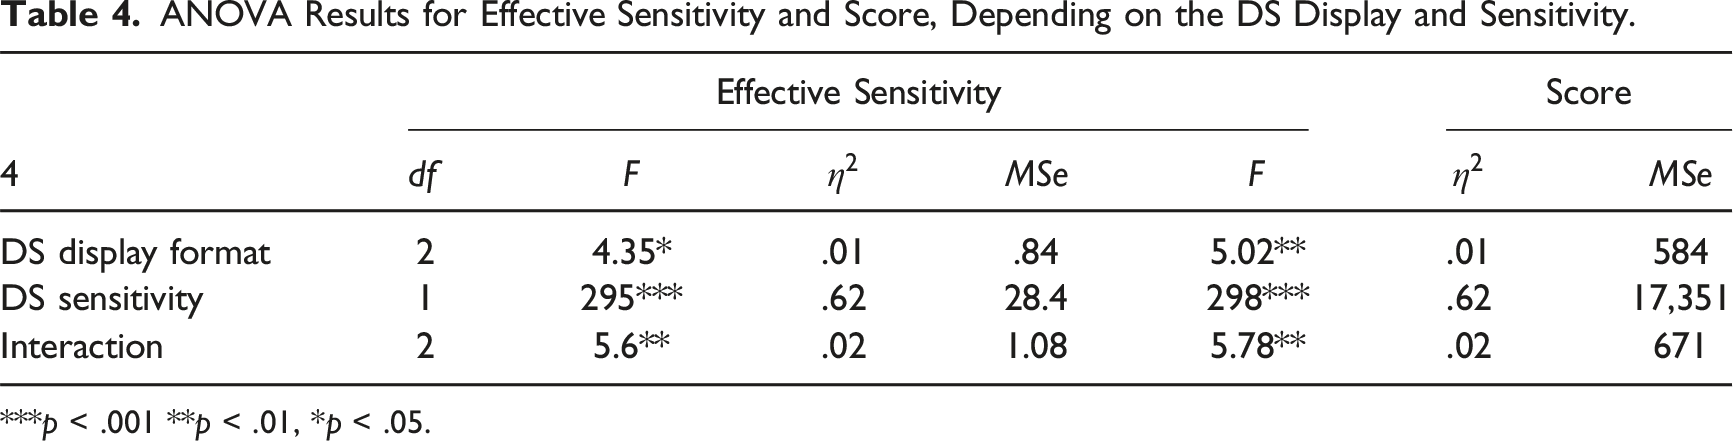
We computed the effective sensitivity (d') and the participants’ total scores to compare the performance between DS formats and sensitivity levels. We analyzed them with the same ANOVA as before. Figure 4 and Table 4 present data and results of the model. Both main effects and the interaction were significant for both measures. Separate one-way ANOVAs for each level of DS sensitivity showed that for participants working with the low-sensitivity DS, the format had no significant effect on the effective sensitivity, Distributions of Effective Sensitivity (left) and Score (right) as a function of the DS display format and sensitivity. ANOVA Results for Effective Sensitivity and Score, Depending on the DS Display and Sensitivity. ***p < .001 **p < .01, *p < .05.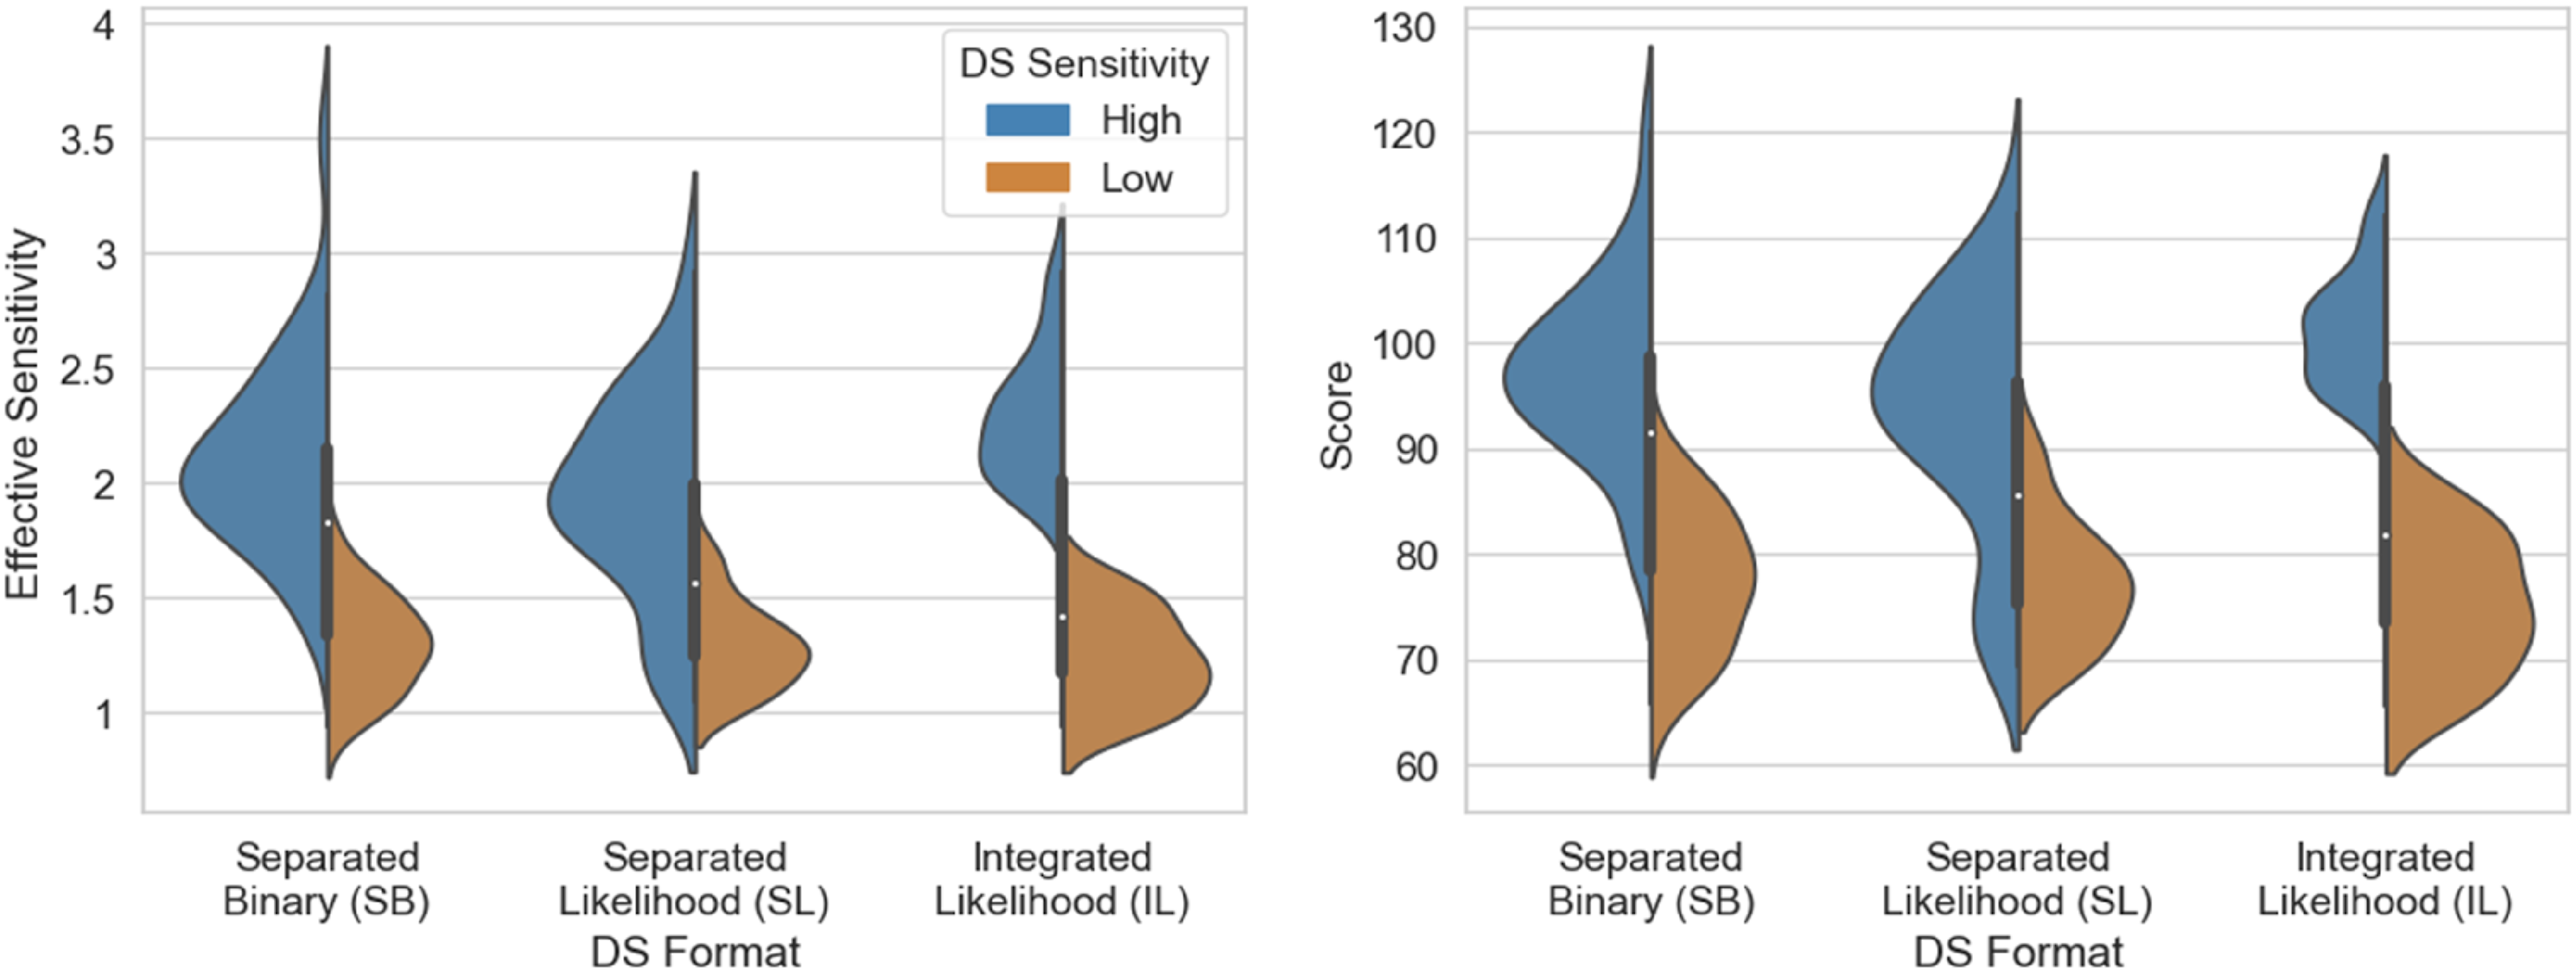
Classification time
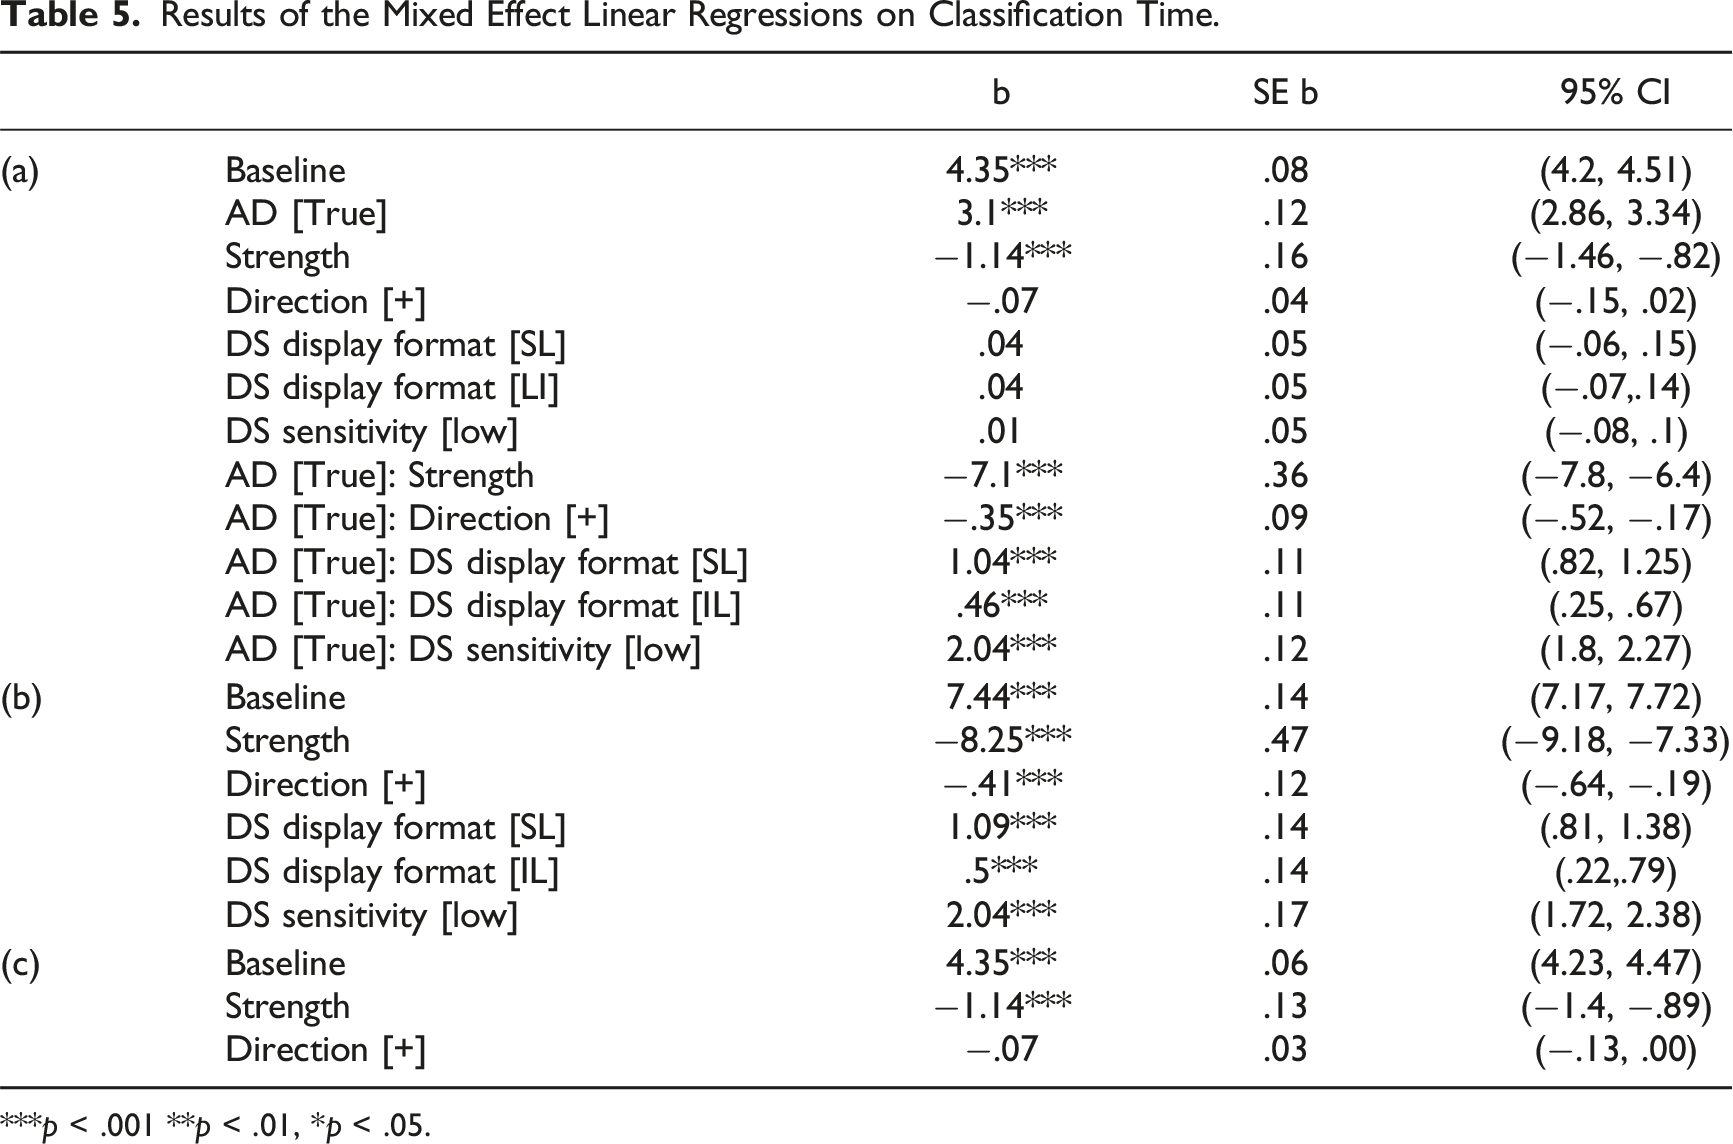
We analyzed the classification time, measured from stimulus onset to the execution of the classification response, including the decision whether to access DS, at the single-trial level. For each trial, we computed the strength of the signal and the direction of the deviation as defined above. We used mixed effects linear regression to analyze the relationship between classification time and the strength and direction of the signal, display format, DS sensitivity, and the participants’ decision on whether to access the DS. Participants served as a random effect, and the AD, display format, DS sensitivity, strength, direction, and all two-way interactions of AD with the other factors were fixed effects. Figure 5 and Table 5(a) present data and results of the model. Classification time was longer when participants accessed the DS Classification time distributions as a function of display format and DS sensitivity for events on which DS was accessed (left) and not accessed (right). Results of the Mixed Effect Linear Regressions on Classification Time. ***p < .001 **p < .01, *p < .05.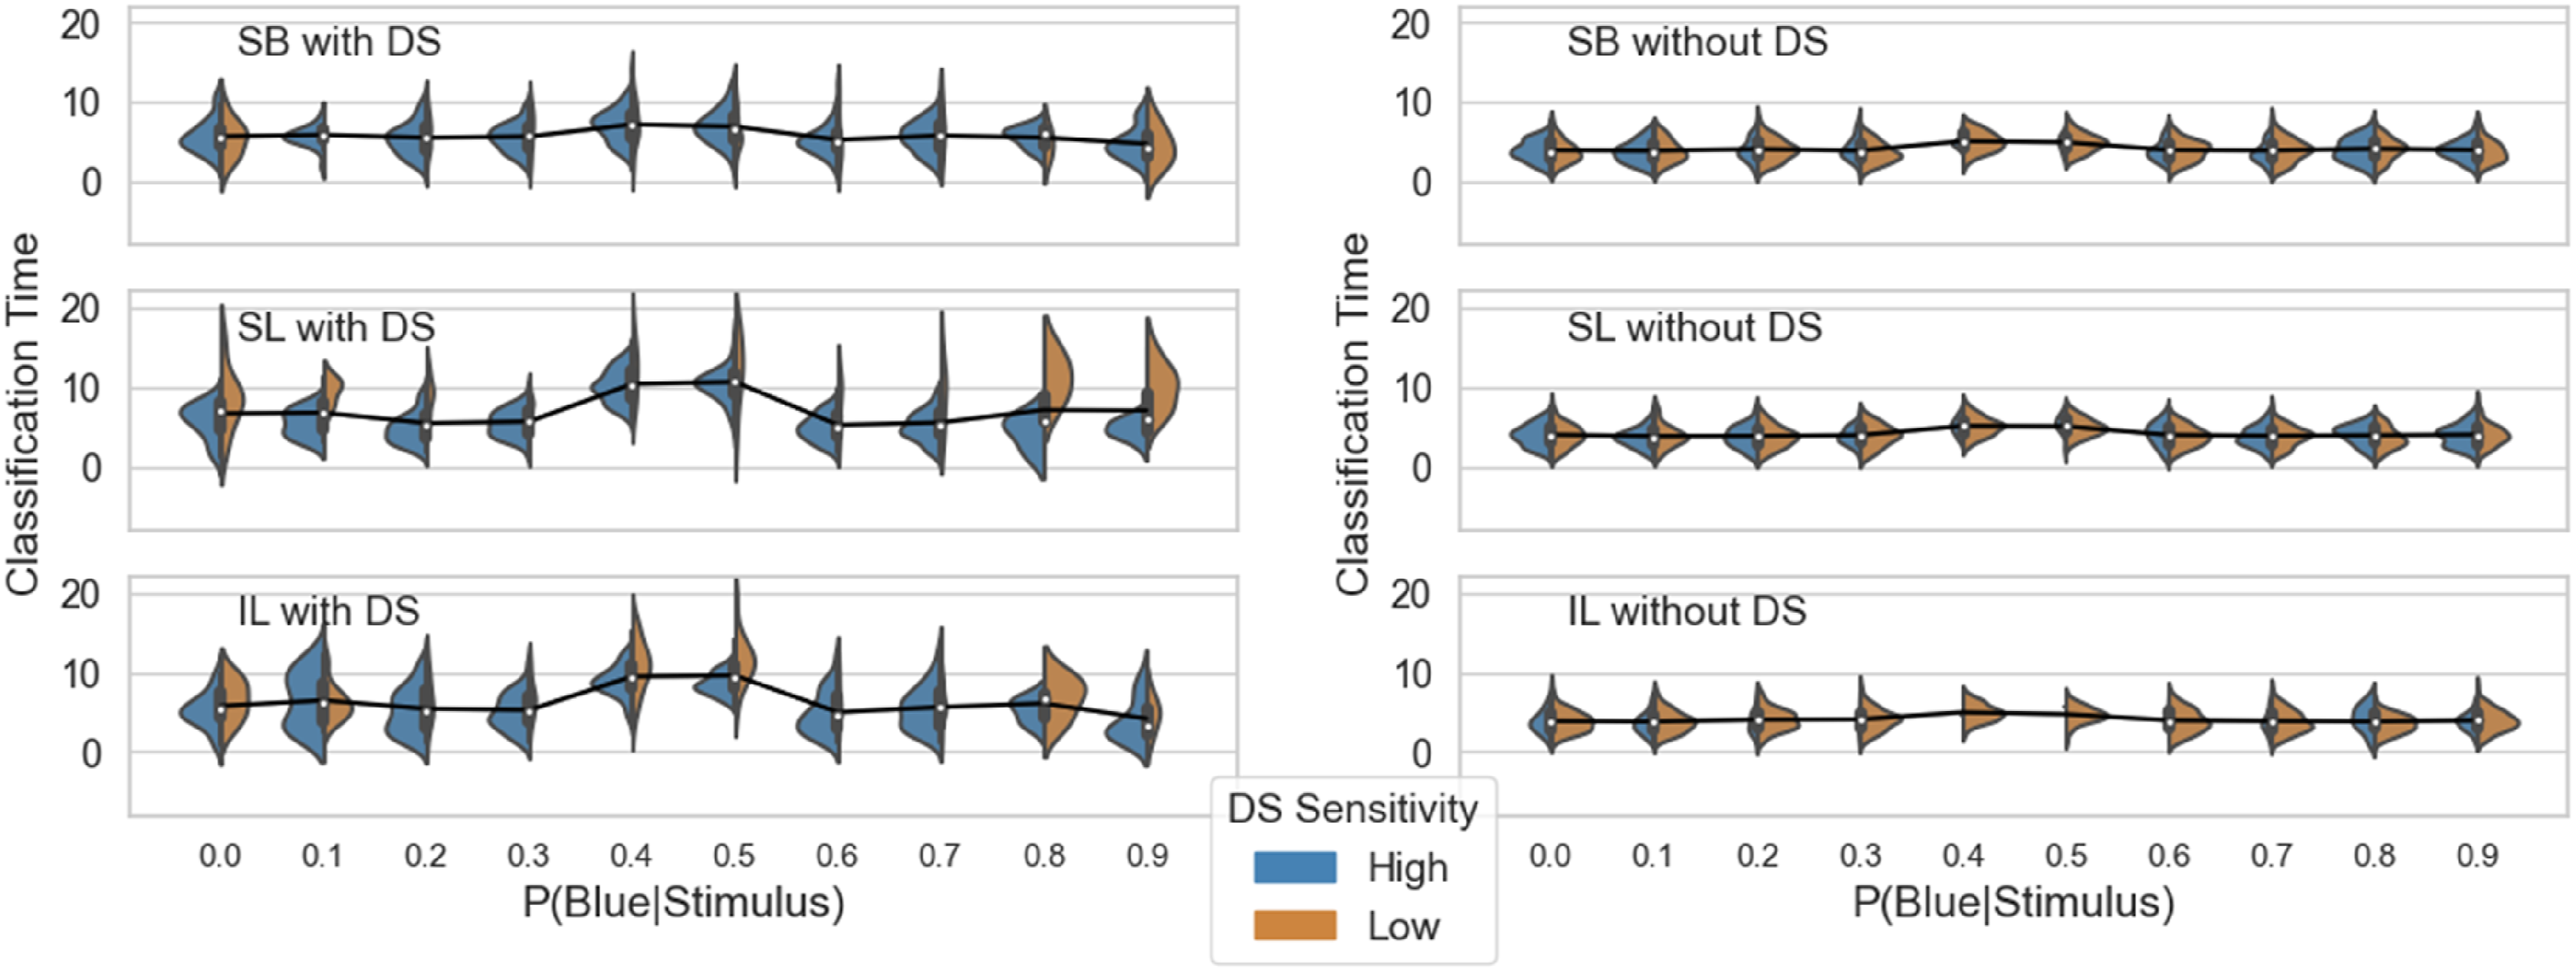
Subjective workload
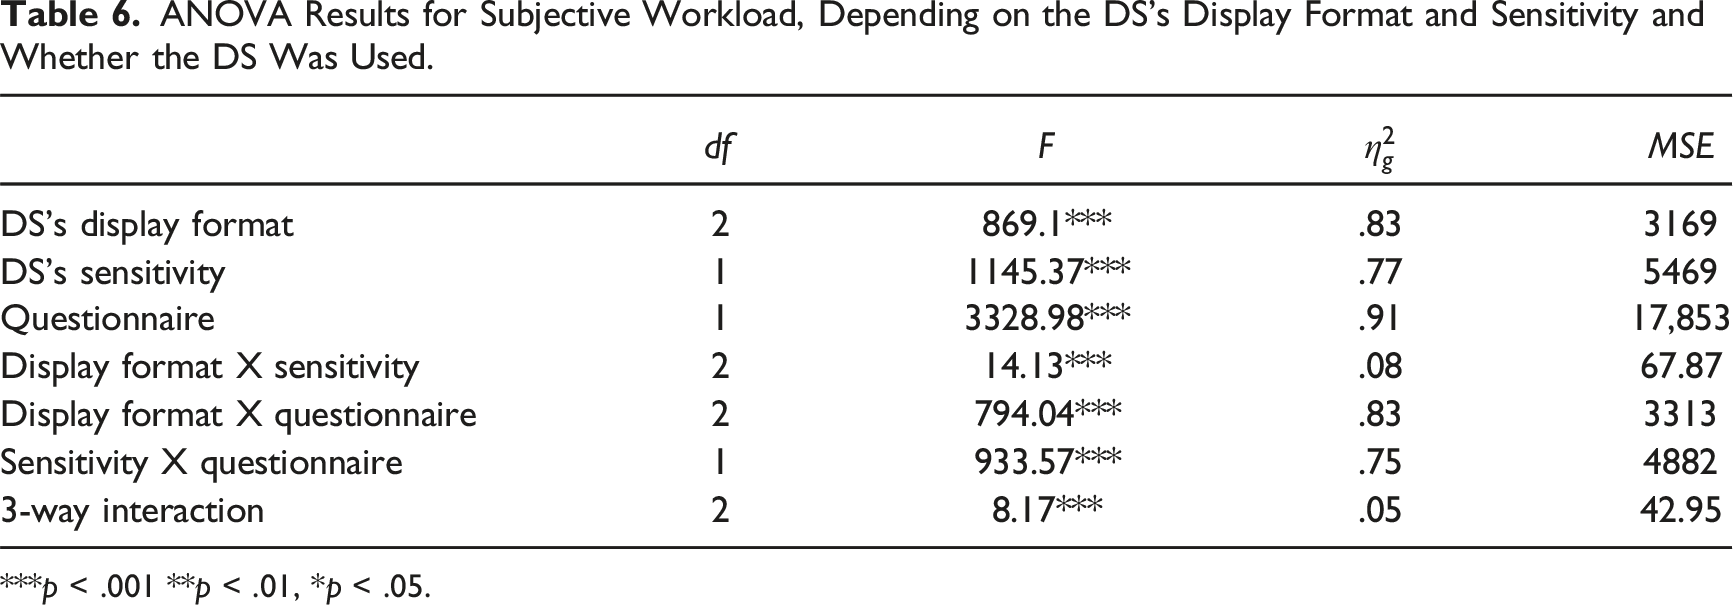
A three-way Mixed ANOVA was performed to test for differences in the NASA-TLX ratings between display formats and DS sensitivity levels (between-subject variables) and the questionnaire (within-subject variable). Figure 6 and Table 6 present the data and results of the model. All effects were statistically significant. Subjective workload distributions for the DS display formats and Sensitivity with, and without the DS. ANOVA Results for Subjective Workload, Depending on the DS’s Display Format and Sensitivity and Whether the DS Was Used. ***p < .001 **p < .01, *p < .05.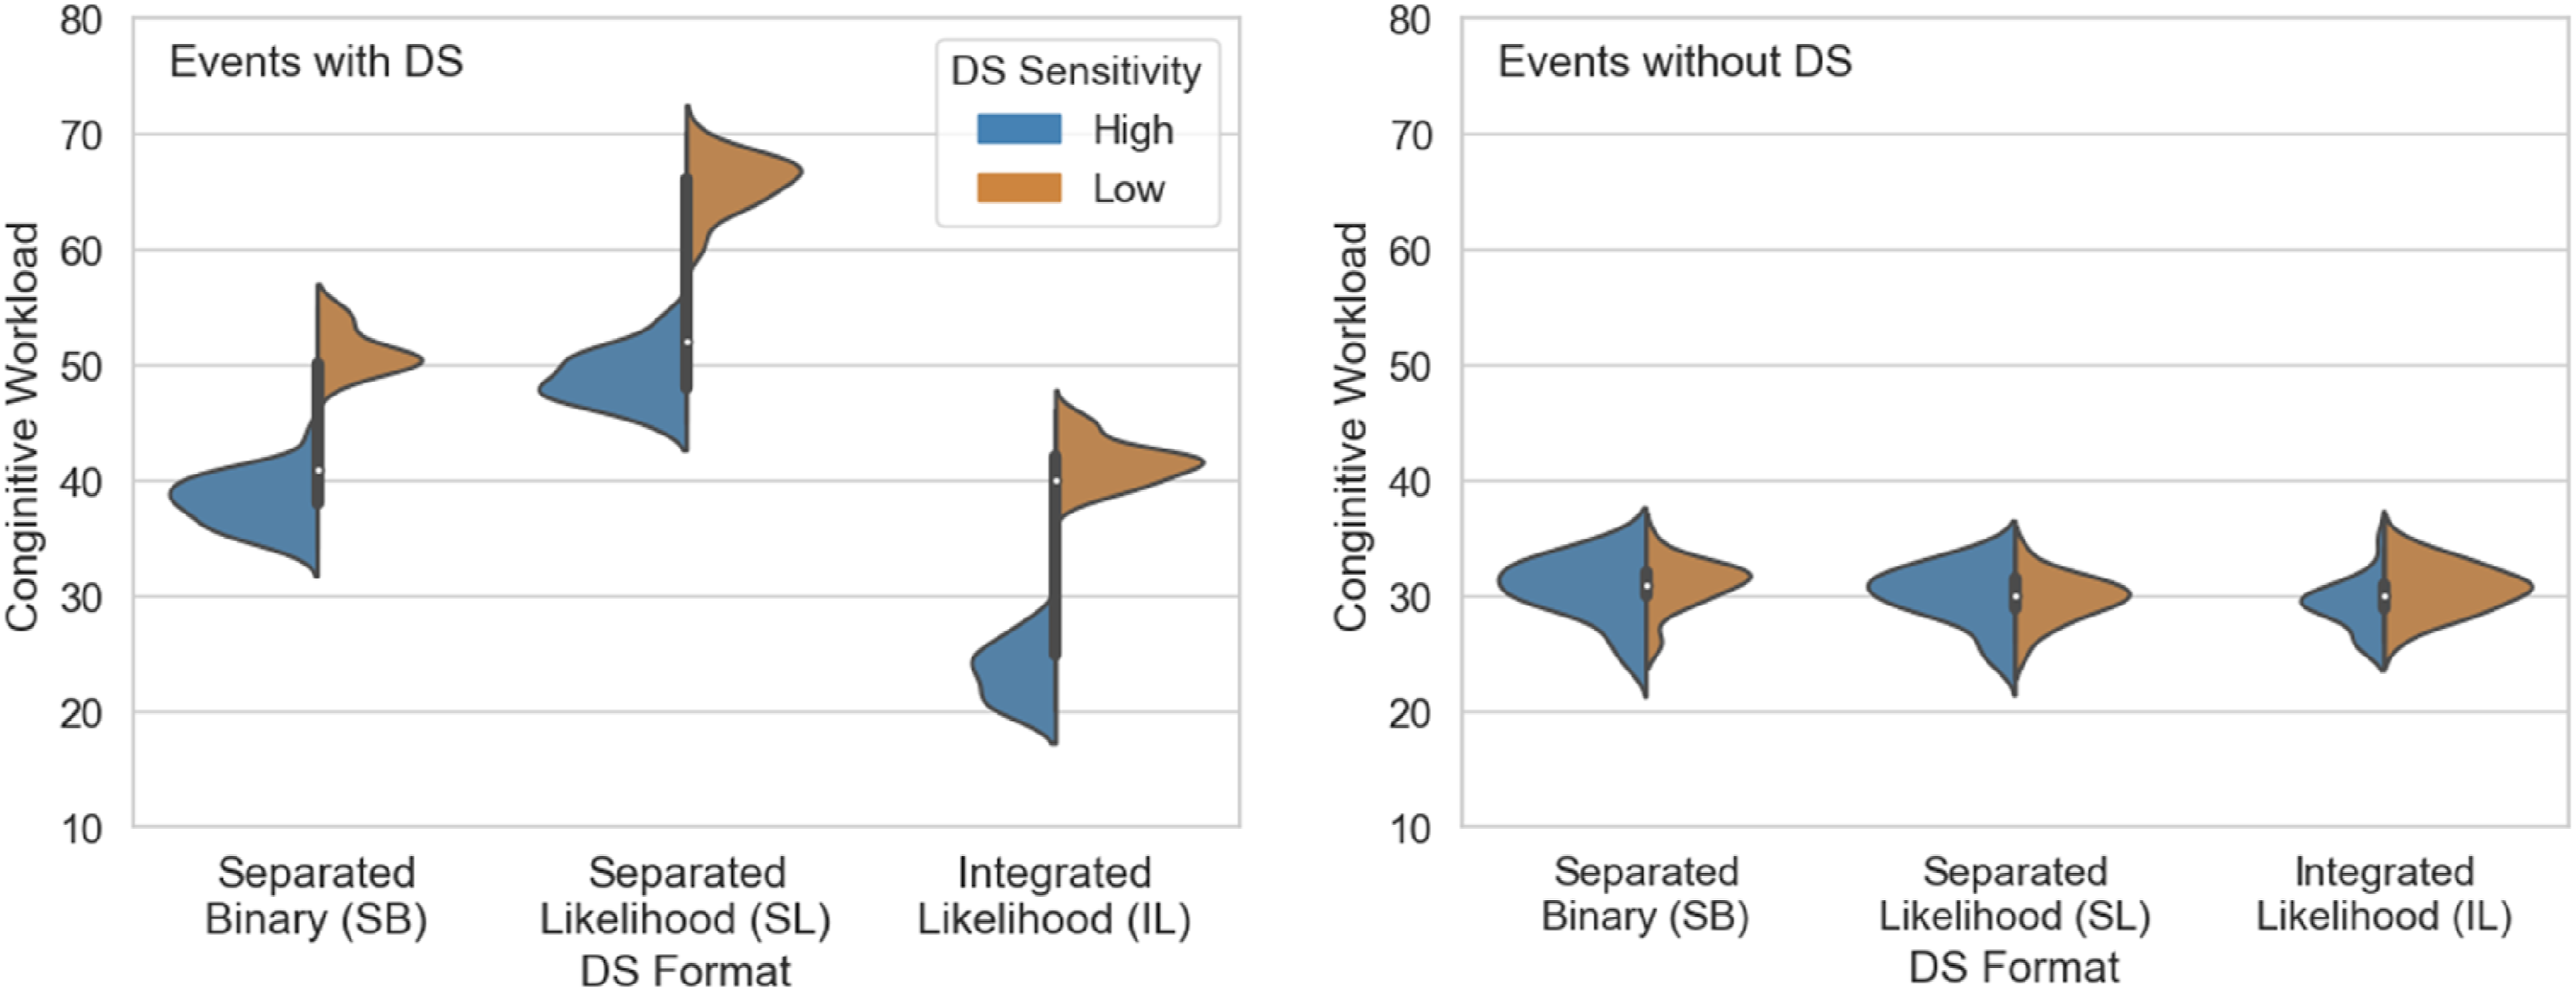
ANOVA Results for Subjective Workload When Using DS.
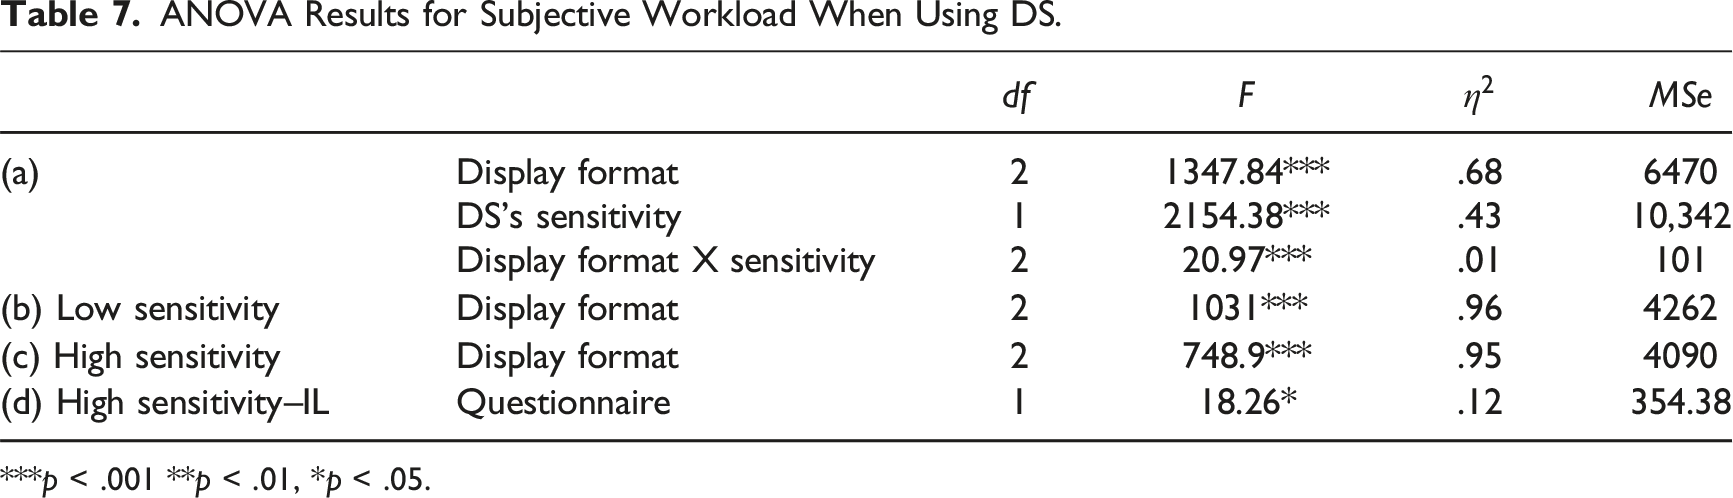
***p < .001 **p < .01, *p < .05.
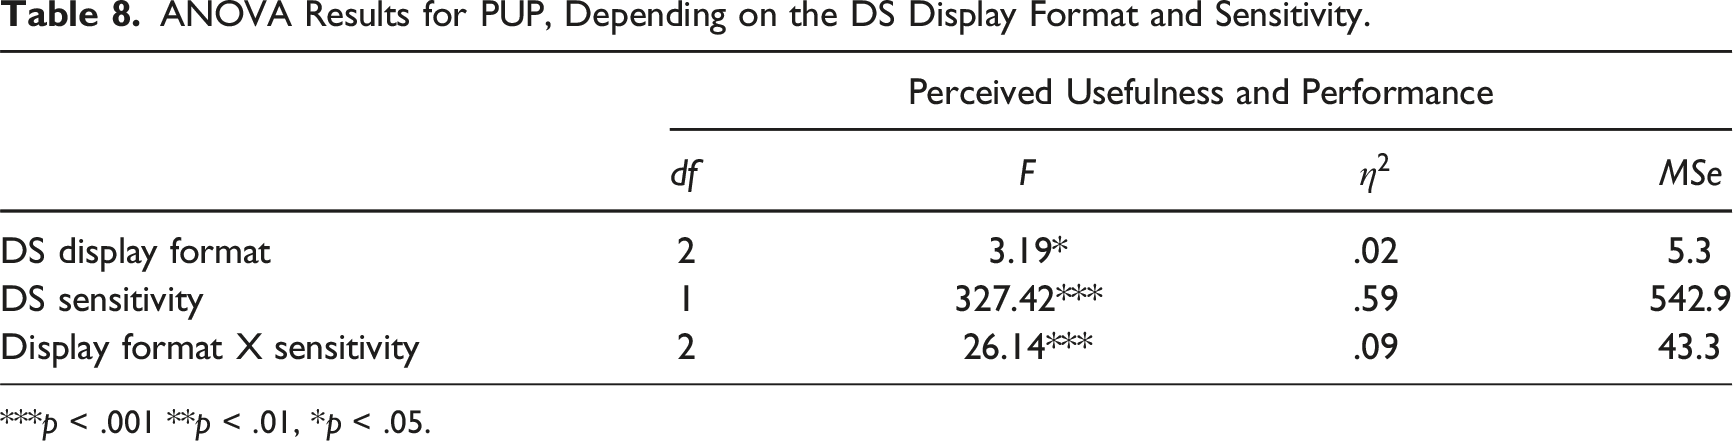
Perceived usefulness and performance of the DS
Responses to the two questions in the perceived usefulness and performance (PUP) questionnaire were strongly correlated PUP distributions as a function of the DS format and Sensitivity. ANOVA Results for PUP, Depending on the DS Display Format and Sensitivity. ***p < .001 **p < .01, *p < .05.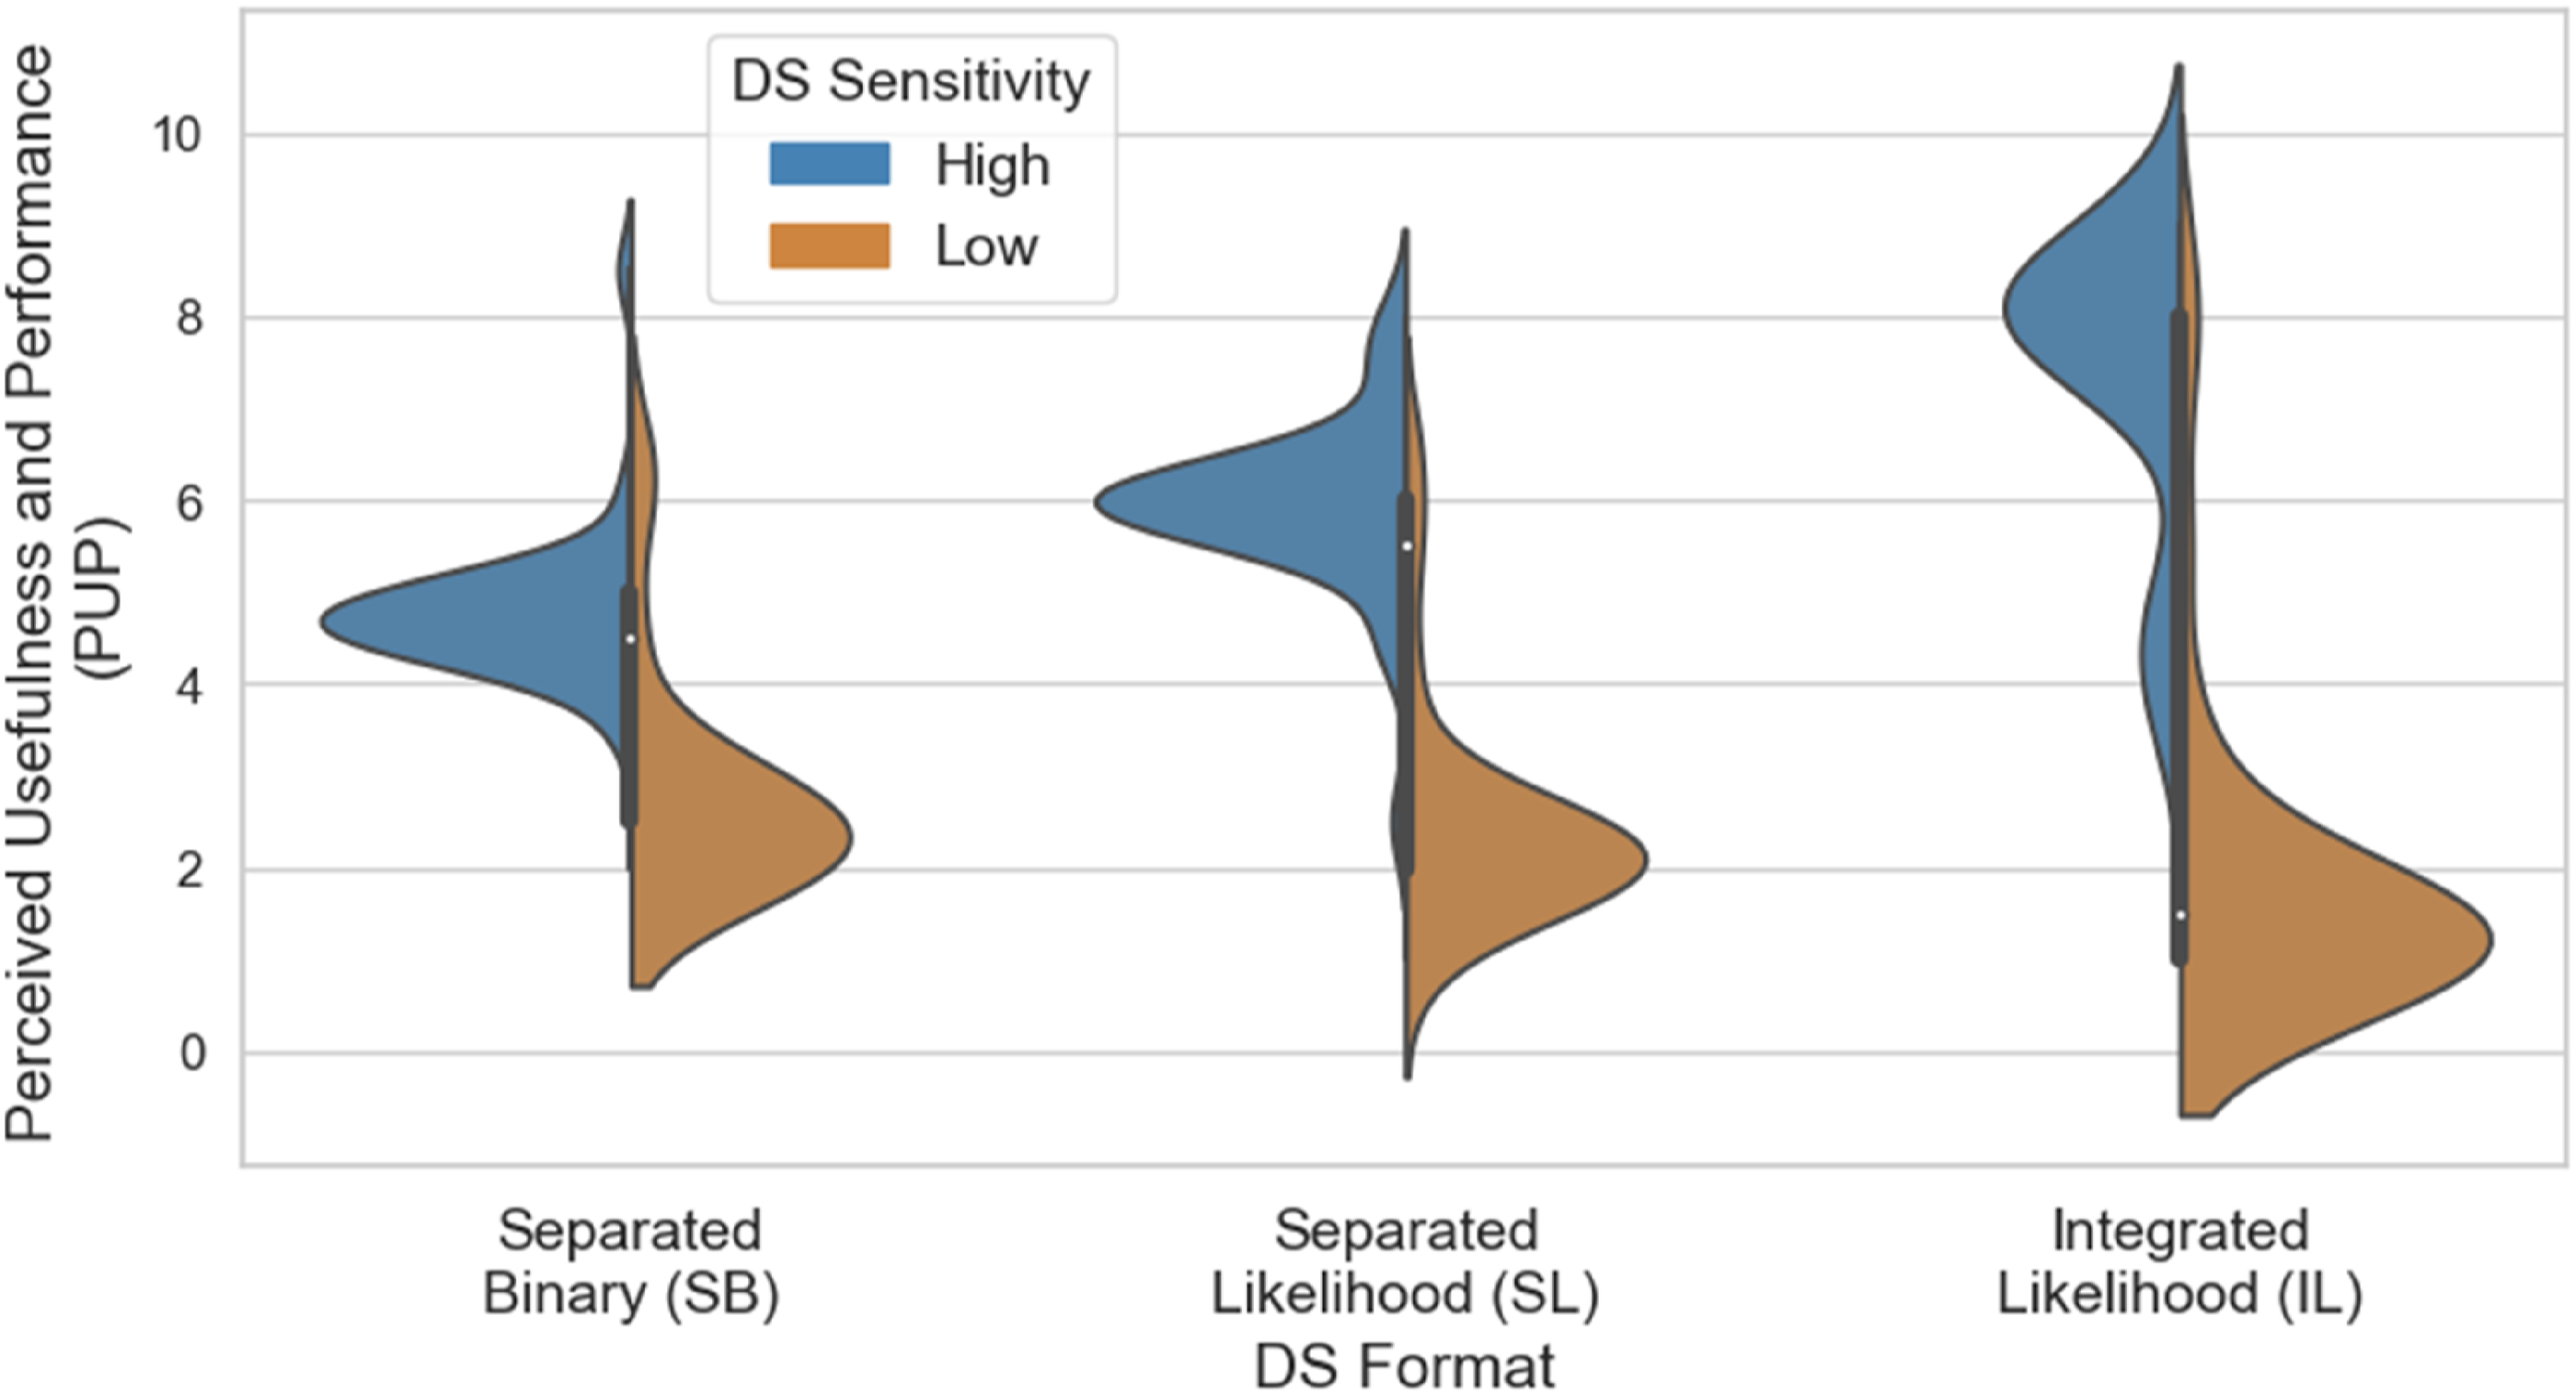
Separate one-way ANOVAs for each sensitivity level showed significant effects of format both when DS sensitivity was low and when it was high,
Discussion
We examined the selective decision to use DS on a trial-by-trial basis as a function of event uncertainty and DS display format and reliability. We compared three DS formats. In the first two conditions, the raw data and cues from the DS were perceptually separated, requiring participants to mentally integrate them. These conditions differed in that the DS showed either binary or likelihood information. In the third condition, the DS integrated raw data and the DS cue and presented them in a likelihood display. This integration process is essentially the “automation” of information integration. We investigated the impact of information presentation on preferences to use the DS, task performance, performance time, subjective workload, and perceived usefulness and performance (PUP) of the DS.
Participants were more likely to access DS when stimulus uncertainty was high, a result consistent with previous studies showing that users can identify situations where accessing additional information is beneficial (Ben Yaakov et al., 2019; Ben Yaakov & Meyer, 2024; Ben-Yaakov et al., 2021; Pescetelli et al., 2021). Participants were also influenced by the DS format when choosing to access support, but only when the DS was highly sensitive. In that case, participants accessed the IL DS more often than either form of separated DS, suggesting that they preferred cues that were integrated with raw stimulus information. Amongst the separated DS formats, participants used the binary cues more than the likelihood cues despite the likelihood cues providing more information. Participants rarely accessed the low-sensitivity DS regardless of its display format, and accordingly, the display format did not affect performance with low-sensitivity DS. With high-sensitivity DS, participants using the IL format had higher effective sensitivity and scores than those using the SL format. Still, no significant difference was found between the IL and SB display formats. These findings differ from previous ones (Meyer, 2001), who found an effect of presentation form only for low-sensitivity DS sensitivity. The difference may have resulted from the stronger tendency to access the high-sensitivity DS in the current study. Future studies should isolate the effects of access choice. Regardless of the display format, participants reached an overall sensitivity with the better DS that was lower than the Sensitivity of the DS alone, which means that automating the task and letting the DS alone make the decision would have led to better performance than having the participants involved in the decision process (Meyer, 2001; Wickens & Dixon, 2007). However, it is crucial to note that this does not necessarily imply a recommendation to exclude the human operator from the loop. Rather, it underscores the importance of carefully considering the role and interaction between human operators and DS to optimize performance.
Importantly, our data suggest that a barrier to using likelihood aids is the challenge of effectively integrating the information they provide with the raw data. These results align with the mixed findings observed in prior research regarding unintegrated likelihood versus binary cues, with some indicating that graded DS cues were not more helpful than binary cues (Bartlett & McCarley, 2017; Carragher & Hancock, 2023; Pharmer et al., 2022; Wickens & Colcombe, 2007), and others indicating that likelihood led to improved performance (Meyer et al., 2020; Zirk et al., 2020). The results underscore the need for further investigations into the factors influencing the choice and efficacy of DS with various display formats.
Our results also point to a tradeoff between the effects of the DS on performance and classification time. Here, classification times were significantly longer for trials in which the participant accessed DS than for trials in which they did not. This contrasts with the results of Botzer et al. (2013), who found that DS reduced decision times. A possible explanation for the difference is that in our experiment, unlike in Botzer et al. (2013), DS use was selective, and participants tended to invoke support only when facing highly uncertain events. This would have affected classification times in two ways. First, as the data showed, more certain information engendered shorter classification times regardless of the decision to access DS. Mean classification time will, therefore, tend to be longer for high-uncertainty events than for a mixture of high- and low-uncertainty events. Second, classification times on DS-aided trials included the time needed to access the DS in the current experiment, whereas those in Botzer et al. (2013) did not. When the DS was accessed, classification time was shorter for participants using high-sensitivity DS than for those using low-sensitivity DS, as expected. Binary DS format led to faster classification than likelihood formats, presumably reflecting the additional time needed to interpret the continuous cues.
Allowing users to choose DS on a trial-by-trial basis instead of having it by default or deciding at the block level carries various implications that warrant exploration. Most important is the possibility that selective access might improve overall DS effectiveness. On the one hand, providing DS by default ensures that users have access to additional information even when they might ignore it. However, it carries the risk that when DS gives a poor recommendation, it could lead to errors, especially in easy trials (Tikhomirov et al., 2023). On the other hand, selective DS access will improve performance only if the operator effectively requests support when needed. Future research can directly compare selective access to access-by-default conditions to resolve this question.
We also examined the subjective cognitive workload with different DS formats and sensitivity levels. Participants in all conditions but one reported higher workloads for DS-aided trials compared to nonaided trials, contradicting previous findings that indicated a decrease in subjective workload for aided trials (Rottger et al., 2009). As with classification times, higher workload ratings for DS-aided trials likely reflect the fact that participants tended to invoke the DS primarily in response to high-uncertainty events, that is, trials on which the classification was inherently difficult. In contrast, Rottger et al. (2009) provided the DS by default, thereby agglomerating high- and low-uncertainty events in the participants’ workload ratings. Notably, we observed lower workload ratings for aided trials than for unaided trials among participants using the high-sensitivity IL DS, indicating that a reliable and well-designed support system can reduce cognitive load.
Subjective workload did not differ significantly between the DS format conditions for trials on which the participants did not access DS. For DS-aided trials, participants using the high-sensitivity DS reported lower workload than those using the low-sensitivity DS. Subjective workload also varied between the DS formats for both high and low-sensitivity DS. The reported workload was lower for the integrated format than for either of the separated formats. Among the two separated formats, it was lower for the binary than for the likelihood displays. These findings underscore the advantages of automating information integration and suggest that presenting binary cues may alleviate the human workload when integrated information displays are impossible.
The results also showed that the display format and sensitivity affected users’ PUP. Participants who used high-sensitivity likelihood DS, whether of separated or integrated format, reported higher PUP than those who used binary DS, consistent with prior findings regarding trust in DS (Meyer et al., 2020). One possible explanation for the higher PUP scores associated with the likelihood display is that graded cues provide users with more transparent and interpretable information about the DS. By presenting a probability estimate rather than a binary indication, the likelihood display format allows users to understand the level of uncertainty in the DS prediction. However, this additional PUP did not translate into a preference for accessing the SB DS over the SL DS.
Participants using the IL format reported higher PUP than those using the SL format. These effects imply that users may perceive DS as better and more useful when it integrates information from multiple sources rather than burdening them with the task themselves.
The value of providing users autonomy to access the DS may depend on the nature of the task and the intended objective of the DS. For example, it may be more suitable in domains like diagnostic medicine, where decisions are unspeeded, and DS aims to maximize decision quality. In contrast, tasks requiring prompt decision making, such as in financial markets, may be less advisable. Nonetheless, when the decision regarding DS usage is based on individual events, it grants the decision maker flexibility. When the information is unambiguous, users might opt not to use DS, even though the goal is to maximize performance. Conversely, when the information is highly ambiguous, using DS might be preferred, even if minimizing performance time is crucial. Examining selective access to DS can provide insight into users’ decision making in tasks involving multiple objectives. This analysis has implications for designing and implementing DS systems across diverse domains.
Constraints on Generality
The study used an abstract task designed for nonexpert decision makers. Of necessity, it differed from many naturalistic tasks in ways that might limit the generalizability of our conclusions. For example, our participants used a binary classification task with equal probabilities and symmetric payoffs to avoid bias toward one outcome. These characteristics may not reflect some real-world situations, for instance, in the medical domain, where multiple types of events are possible, some forms of event are rare, and the payoff attached to different forms of error may be asymmetrical. Future research should explore the effects of biased event distributions and classification costs on decision making. An additional limitation is the absence of a comparison between selective DS access, access by default, and no DS conditions. This comparison would have allowed us to determine whether the observed benefits of the integrated display are primarily due to increased usage or to the more effective utilization of information. Our use of graphic design for the DS stimuli, rather than verbal descriptions, can also affect the study’s generalizability. While our choice of graphic displays was intended to maintain consistency with the visual nature of the stimuli participants saw before accessing the DS, it may limit the applicability of our findings to scenarios where two conditions hold: first, the raw data themselves are visual, and second, the DS’s recommendations can be encoded in a format similar to the raw data. Future studies should address this limitation and manipulate graphic versus verbal DS formats to explore their effects on performance and cognitive workload.
Key Points
• The ambiguity of information plays a significant role in the decision to access Decision Support (DS), which might demonstrate the value of DS in resolving uncertainty. • The tendency to access DS might vary with the nature of the task and its objectives. DS proves effective for enhancing task performance but might not be ideal for swift decisions like financial market decisions. • A DS’s display format plays a prominent and influential role in the inclination to utilize it, especially when it provides reliable information. The likelihood-integrated display format was favored over binary or likelihood-separated display formats.
Footnotes
Acknowledgments
This research was supported by the Israeli Science Foundation (ISF) (grant No. 2029/19) and the Center for AI and Data Science at Tel Aviv University. The abstract of the study was presented at the Human Factors and Ergonomics Society 2023 Annual Meeting (Ben-Yaakov et al., 2023).
Declaration of Conflicting Interests
The author(s) declared no potential conflicts of interest with respect to the research, authorship, and/or publication of this article.
Funding
The author(s) disclosed receipt of the following financial support for the research, authorship, and/or publication of this article: This research was supported by the Israeli Science Foundation (ISF) (grant No. 2029/19) and the Center for AI and Data Science at Tel Aviv University.