
Abstract
The present paper summarizes the results of a study investigating the relationship between arousal, as reflected by cardiovascular responses, and technical performance in a simulated well control task. As part of a certification exam at the end of a training session, pairs of rig operators (drillers) and supervisors were involved in a role-play exercise using a simulation equipment, while the electrocardiogram (ECG) signal was recorded from rig supervisors with the Polar H10 device. During the scenario an anomaly in well operations occurred and supervisors were required to adopt specific procedures to restore pressure containment. Our results showed that heart rate (HR) and heart rate variability (HRV) measures differently reflected the changes in the demands imposed by the different phases of the simulated task and highlighted the need to integrate the assessment of technical skills with workload and arousal assessment to increase the effectiveness of training procedures.
Keywords
Introduction
The oil & gas sector is currently predominant in the world energy landscape, as it covers more than half of the global primary energy demand (IEA, 2020). The exploitation of the resources of the subsoil requires respect for well control conditions to prevent blowouts, that is, the uncontrolled release of oil and/or gas from a well after pressure control barriers have failed, which can have catastrophic consequences in terms of loss of human lives and environmental damages. The analysis of the investigations of blowout events reveals that human errors, such as failures in the identification of anomalies during drilling operations or the incorrect execution of contingency procedures, play a role in many cases (SINTEF, 2022).
In the last decade, operator training has been focused on reinforcing incident response preparedness and practicing emergency response plans. Indeed, the operator’s ability to recognize and interpret anomalies in well parameters is crucial for maintaining well control and the timely execution of corrective actions is extremely important for preventing catastrophic consequences. Crucially, training activities mostly address technical skills and competencies. However, responses in emergencies are affected not only by operators’ technical skills but also by their mental workload and stress levels.
Even though the concept of mental workload is one of the most cited concepts in human factors engineering, its definition represents a challenge for researchers (see Longo et al., 2022 for a review). In the present study, we use the term “mental workload” to refer to the relationship between the amount of capacity or resources necessary to meet task demands and the available ones (e.g., Wickens & Tsang, 2015). High levels of workload may cause a deterioration of performance and an increase in the level of stress affecting attention, working memory, and situation awareness, that is the operator’s ability to understand the situation and to take correct decisions to manage it (e.g., Parasuraman et al., 2008). The relationship between workload and performance finds its conceptualization in the Yerkes-Dodson law (Yerkes & Dodson, 1908) which postulates an inverted U-shaped relationship linking stress and performance. Based on this model, performance is assumed to peak with moderate levels of mental workload/stress and decrease when mental workload/stress is either too high or too low.
Given the relationship between mental workload and arousal, that is, the activation of the body in response to highly demanding situations, there has been increasing interest in finding a way to assess real-time changes in mental workload by recording physiological measures that reflect the activity level of the peripheral and central nervous systems (see Charles & Nixon, 2019 for a review).
Starting from these considerations, in the present study, we assessed performance indicators and cardiovascular responses, as indicators of arousal and mental workload, during a simulated well control scenario containing a critical event. Importantly, the scenario represented the practical part of a certification exam that rig drillers and supervisors took at the end of a training course.
The aim of the study was twofold. First, we intended to assess whether heart rate (HR) and heart rate variability (HRV) measures obtained from a wearable device, the Polar H10 chest band, over short periods reflected the changes in the demands imposed by the different phases of the simulated task. Second, we aimed to assess whether, within the context of well control operations, the Yerkes-Dodson law can account for differences in performance.
The general aim was to gather important information that can guide the development of effective training procedures that integrate technical skills and human factors. Indeed, the possibility to measure in real time the workload experienced during training procedures would allow for an accurate training assessment and for the tailoring of training procedures.
Methods
Participants
Twenty-four rig supervisors (all males, 22–67 years), working in onshore and offshore installations, participated in the study on a voluntary basis. Informed written consent was obtained from all the participants. The study was conducted following the principles outlined in the Declaration of Helsinki and the procedures received internal approval. Due to technical problems, only the data of 20 participants were included in the analyses.
Setting and Equipment
The study took place in the simulation laboratory of an accredited training center in Italy. The laboratory was equipped with a console-based drilling and well control simulator (DS-50; Drilling Systems, Ltd.) and with a computer used by a certified instructor to supervise all the activities.
Electrocardiogram (ECG) data were collected via a wearable device, the Polar H10, with a sampling rate of 125 Hz. This device was chosen because of its low intrusiveness, which is a necessary condition when psychophysiological indices are measured in realistic contexts, and because of the quality and reliability of the recorded signal (e.g., Schaffarczyk et al., 2022). Rig supervisors were asked to wear the Polar H10 device before entering the lab, but recordings started when they entered the room to start the task.
Task and Procedure
The scenario used in this study was part of a certification exam taking place at the end of a training course on well Control. The exam, as established by the International Well Control Forum (IWCF), was composed of three modules: a theoretical examination on safety equipment, a theoretical examination on safety procedures and a practical examination consisting in a simulation conducted in pairs (a driller candidate and a supervisor candidate) using a simulation equipment.
The present study focuses on the practical examination that consisted in a role-play exercise in which a rig operator (driller) and a rig supervisor, working in a couple, were faced with an anomaly in well operations and were required to adopt specific procedures to restore pressure containment. The prompt identification of the problem determined the degree to which the anomaly generated imbalance in the system, and consequently the ease with which the problem could be solved.
The scenario lasted 24.7 ± 3.82 min in average and was composed of five phases:
A briefing phase (mean duration: 6.9 ± 1.74 min) in which the supervisor entered the room, checked the situation and communicated to the driller the action that had to be taken to start well control procedures. The last 3 min served as a baseline for HR and HRV measures (see “Results and Discussion” section).
A pre-anomaly phase (mean duration: 5.7 ± 1.16 min) in which the supervisor coordinated the procedures.
A critical phase (mean duration: 0.8 ± 0.55 min) in which an unexpected anomaly occurred. Once detected, the supervisor was required to identify the problem and manage the emergency.
A post-anomaly phase (mean duration: 9.2 ± 1.61 min), in which the regular operational conditions were restored, and the supervisor was required to coordinate the procedural phase.
A debriefing phase (mean duration: 2.0 ± 0.88 min) in which the supervisor analyzed the indicators, provided a report of the situation and an assessment of the effectiveness of the applied methodology to the instructor.
A certified instructor observed the procedures and, for each phase, graded the candidates’ performance by means of a grading sheet provided by the IWCF. The NASA Task Load Index (NASA-TLX) (Hart, 2006) was administered to rig supervisors at the end of the whole scenario. Participants were first asked to rate how demanding was the task along six dimensions—mental demand, physical demand, temporal demand, effort, performance, and frustration level—on a twenty point scale. Then they were shown 15 pairwise comparisons of the dimensions and asked to select for each pair which better represented their experience of demand.
Design
Since the scenario was used for certification purposes, the five phases were presented in the same order for all the participants. For each participant, the anomaly was randomly chosen from a set of four anomalies of equal difficulty: (a) a sudden stop of the circulation pump; (b) a partial obstruction of the fluid supply line; (c) a partial loss of the fluid return line; and (d) a partial obstruction of the fluid return line.
Data Recording and Pre-Processing
Performance and Subjective Measures
The technical performance scores for each phase and a global score, in percentage, were derived from the IWCF document filled in by the certified instructor.
For each participant, we computed a weighted NASA-TLX score, representing the overall task load index, by multiplying the scale score for each dimension by the number of times the specific dimension was chosen in the pairwise comparisons and then dividing the obtained result by 15.
Results and Discussion
All the statistical analyses were performed using IBM SPSS software (version 29).
The overall technical performance score was 87.25% (SD = 7.19) and the mean score obtained in the critical phase was 77.8% (SD = 22.9). The mean weighted NASA-TLX score was 69 (SD = 11.8), corresponding to a high level of perceived load (Grier, 2015). The mental demand subscale received the highest score.
To assess whether HR and HRV measures differed among the different phases of the scenario, HR, the natural logarithm of RMSSD, SDNN, pNN50, and pNN25 were submitted to the non-parametric repeated-measures Friedman test with Phase (five levels: baseline, pre-anomaly, critical, post-anomaly, and debriefing) as within-participant factor. Following statistical significance, post-hoc paired comparisons were performed using the Wilcoxon signed rank. The p value was corrected for the number of comparisons. The non-parametric approach was chosen because not all cardiovascular measures were normally distributed.
The analysis revealed a significant effect of the factor Phase for all the parameters (Fs, p < .05). Post hoc tests, however, showed that the parameters differently distinguished between the different phases of the scenario (see Figure 1).
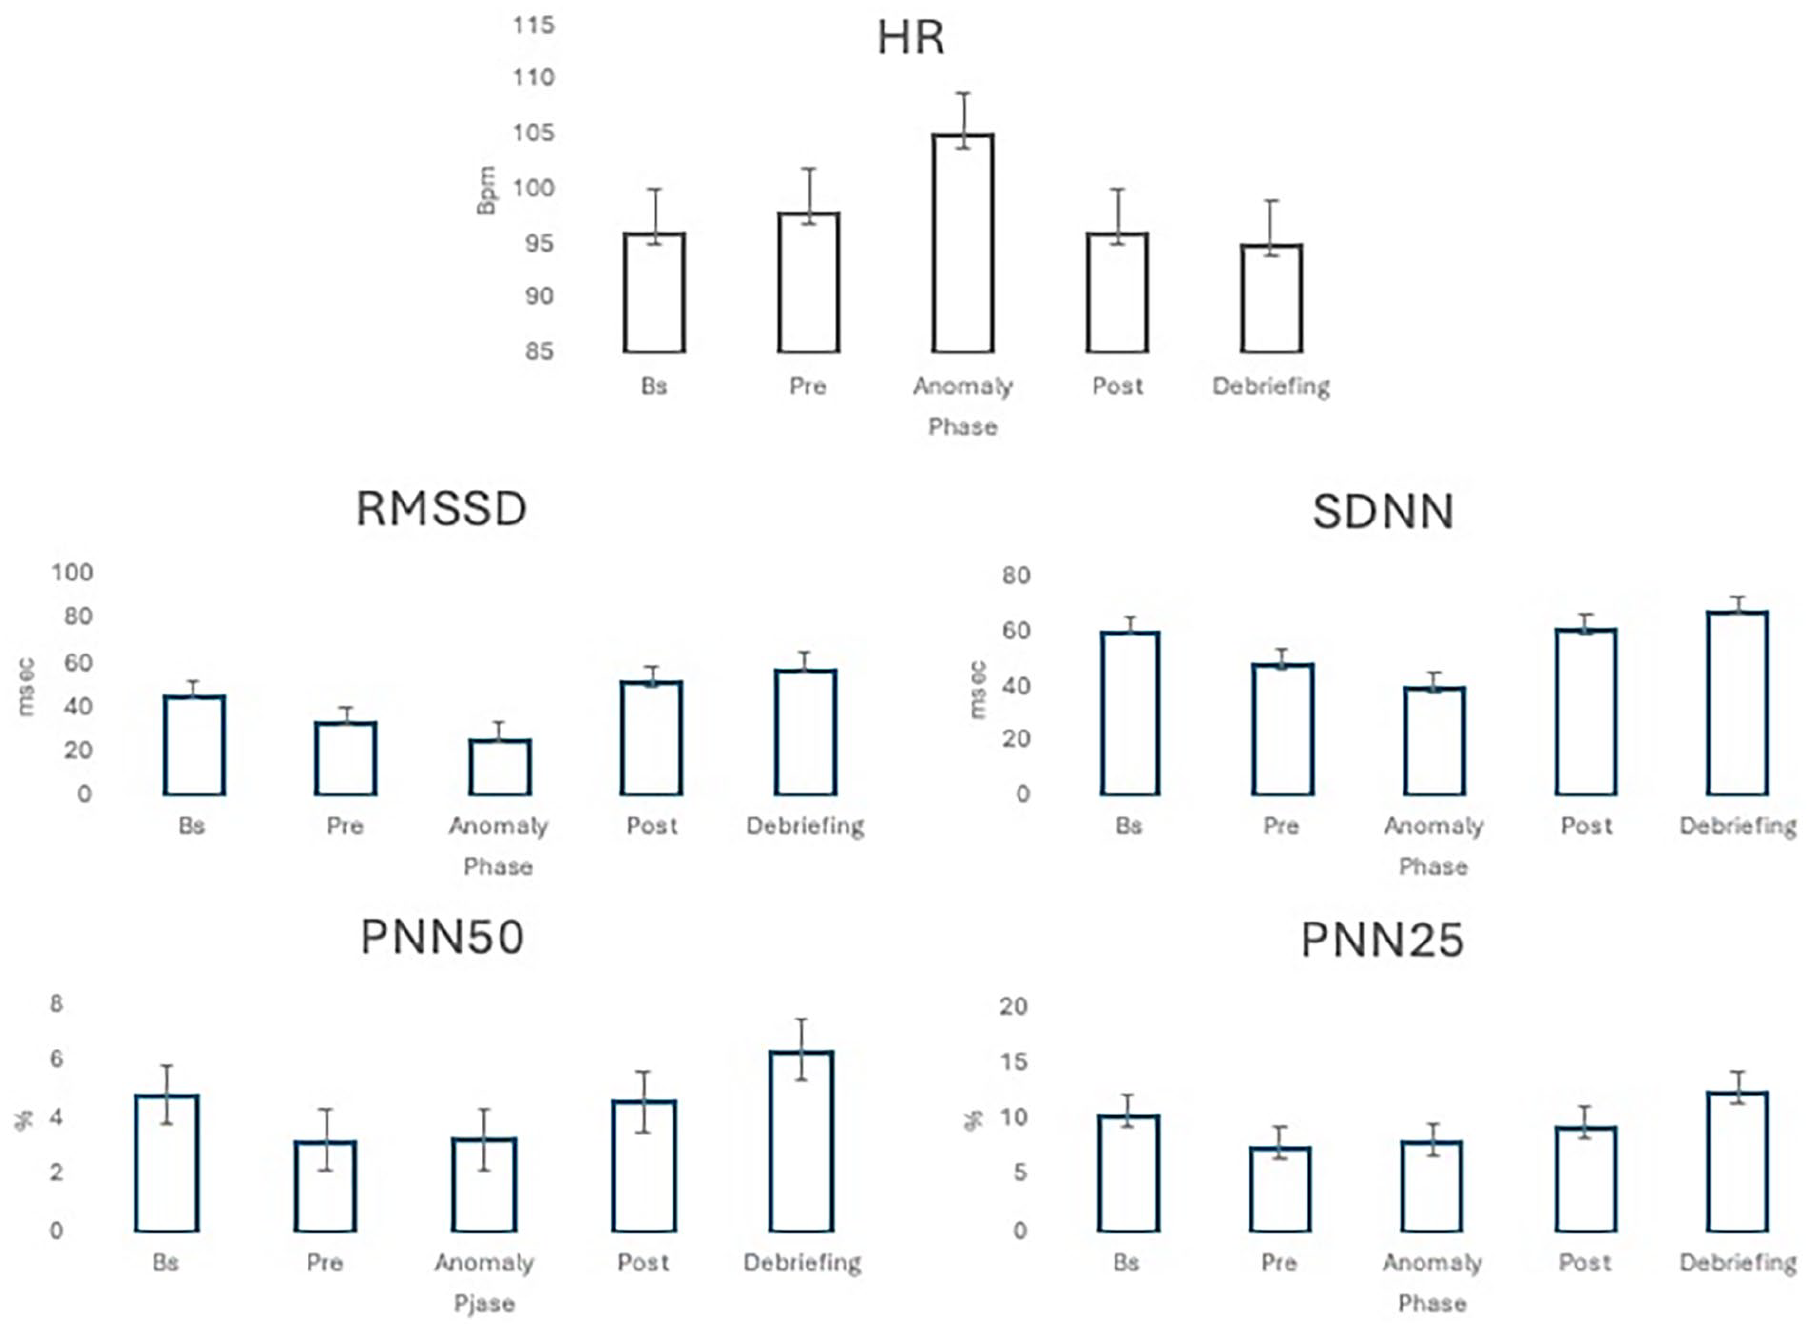
Mean values for HR, RMSSD, SDNN, pNN50, and pNN25 in the different phases of the scenario
HR was significantly higher in the critical phase than in all other phases (ps < .001), that instead did not differ among themselves. As regards HRV measures, both SDNN and RMSSD gradually decreased from baseline to the critical phase to increase in the post-anomaly and debriefing phases. The values in the critical and in the pre-anomaly phases, however, did not differ but were both lower than those in the briefing (baseline), post-anomaly, and debriefing phases. PNN50 showed lower values in the pre-anomaly phase that differed from all other phases. No difference was found between the pre-anomaly and critical phases. The critical phase differed only from the debriefing phase. Similar results were found for pNN25, with the only exception that the difference between the baseline and pre-anomaly phase was only close to significance (p = .06). Overall, these results indicate that while HR may reflect the increased demands imposed by the occurrence of an anomaly, HRV measures reflect the demands imposed by the whole task, that is by both the pre-anomaly and anomaly phases.
To assess whether cardiovascular parameters correlated with performance in the critical phase, we computed the Kendall’s Tau coefficient. Results showed a negative correlation involving the pNN50 (r = −.34, p < .05).
Finally, to assess whether, within the context of well control operations arousal level can account for differences in performance, for each participant we computed a corrected change score by subtracting average HR values for the baseline period from the average HR values of the critical phase and then dividing the resulting value by the baseline and multiplying it by 100 (see Iani et al., 2004). We then transformed the change scores obtained in the anomaly phase into z-scores. Indeed, the Yerkes-Dodson curve overlaps with the shape of the standard normal distribution. Hence, it may be assumed that the values corresponding to the area of average activation and optimal performance are delimited by the z-score values of −1/2 and +1/2, equal to −0.5 and +0.5 standard deviations from the mean. We hence categorized the scores as optimal/non-optimal based on their overlap with this distribution. Based on this categorization, 70% of the participants with inadequate performance showed a non-optimal psychophysiological activation. Even though exploratory due to the limited number of participants, this result may suggest the usefulness of monitoring arousal level during training procedures.
Conclusions
The assessment of mental workload levels during well control activities is of paramount importance since high levels of workload may cause decreases in performance, compromising the quality of operations and exposing the operator and surrounding personnel to risks with potentially catastrophic consequences, such as blowout events. Moreover, the possibility of characterizing the relationship among workload, arousal levels, and performance may be exploited to increase the effectiveness of training.
Our results showed that HR and HRV measures differently reflected the changes in the demands imposed by the different phases of the simulated task, hence suggesting that the real time monitoring of different parameters may allow for the characterization of operator mental status (see Wang et al., 2024 for a review).
To conclude, the results of the present study underline the possibility of exploiting the connection among workload, arousal, and technical performance in managing targeted problem situations within a well control simulated environment. The present study conducted in a simulation environment is the first step towards raising awareness within the industry, with long-term goals including the evolution of existing onboard industrial automation systems according to the concepts of cognitive ergonomics, and the implementation of training programs focused on human factors to support the development of technical skills among operational personnel. The next necessary step is to extend this investigation to the naturalistic context, with the aim of tracking workload levels of operational personnel during daily activities and validating the results obtained in a controlled environment.
Footnotes
Acknowledgements
We thank Simone Borghi for his help in the pre-processing of cardiovascular data. This work was conducted as part of a research agreement between the University of Modena and Reggio Emilia and DRILLMEC S.p.A. (protocol n. 0154612). At the time of the study, Leonardo Bori was an employee of DRILLMEC S.p.A
Declaration of Conflicting Interests
The author(s) declared no potential conflicts of interest with respect to the research, authorship, and/or publication of this article.
Funding
The author(s) received no financial support for the research, authorship, and/or publication of this article.