
Abstract
This study quantifies bidirectional gazing—when drivers and pedestrians look at one another—in a naturalistic setting. Understanding bidirectional gazing provides insights into the communication dynamics between pedestrians and drivers, and their relation to infrastructural support (e.g., a stop sign). Findings demonstrate that 36% of observed road crossings included at least one bidirectional glance. There was a tendency for bidirectional gazing to be more prevalent (especially early in encounters) and longer for crossing types with less infrastructural support, such as undesignated crossings. This suggests that when pedestrians lack infrastructural support and are farther away from the lane, drivers and pedestrians rely more on visual communication (looking at each other) to determine things like gap size, trajectory, speed, and distance. However, when pedestrians are closer to the lane, we find similar gaze patterns across the crossing types, which may suggest another gaze-behavior type (e.g., checking if it is safe to cross).
Keywords
Introduction
Drivers and pedestrians communicate in various ways to coordinate access to a shared region of space during road crossings. Empirical research suggests that the communication between drivers and pedestrians is predominantly governed by implicit signals such as vehicle or pedestrian movement despite the higher salience of explicit communication such as hand waving or honking (Dey & Terken, 2017; Domeyer et al., 2022; Lee et al., 2021). An open question in the human factors literature is the importance of establishing “eye contact” in pedestrian road crossings.
Most studies considering visual attention in road crossings have focused on pedestrian or driver gaze in isolation from one another. These studies show that pedestrians typically look in the direction of the vehicle before stepping onto the road (Lee et al., 2021; Rasouli et al., 2017), potentially to collect cues related to the vehicle and/or environment as well as a way for the pedestrian to communicate their intention to cross (Guéguen et al., 2015). The few studies that report both driver gaze and pedestrian gaze provide discrete measures (i.e., absence or presence of behavior), often not taking into account the temporal aspects of the crossing. For example, Sucha et al. (2017) found that pedestrians “searched for eye contact” before crossing in 84% of the evaluated interactions, while the corresponding number for drivers was only 34%.
Analyses of bidirectional gaze—or simultaneous glances of pedestrians and drivers toward each other—may provide insights into the role of such gaze behavior in driver-pedestrian communication, its dynamics, and how it differs based on infrastructure support (e.g., stop signs and zebra crossings; Noonan et al., 2022, 2023). For example, in the absence of infrastructural support (i.e., undesignated crossings) drivers and pedestrian behaviors have been shown to depend on one another to a greater extent than when infrastructural support is present. This dependence was operationalized by the correlation between changes in driver and pedestrian speed and their respective wait times (Noonan et al., 2022). This may suggest that other communication modes such as bidirectional gazing are also dependent on having designated infrastructure for crossings.
The aim of this work is to provide quantitative insights into the gaze behavior of drivers and pedestrians during road crossings with a specific focus on the occurrence of, and changes in, bidirectional gazing.
Methods
Data Collection, Reduction and Annotation
Road crossing events were drawn from the ongoing MIT Advanced Vehicle Technology (MIT-AVT) naturalistic driving study (Fridman et al., 2019). Data extracted from the broader MIT-AVT dataset for this sample consisted of Tesla Model S or X drivers who had driven their own vehicle for an extended period as well as drivers who were randomly assigned an instrumented vehicle (either a Cadillac CT6, a Volvo S90, or a Range Rover Evoque) to drive for a 4-week period. All study vehicles were equipped with data acquisition systems that collected data through forward-facing and driver-facing cameras among other vehicle and context-related information (e.g., CAN, GPS).
The data consisted of 269 road crossing events from 64 unique drivers (35% females) with an average age of 43 years (SD = 14.3). The inclusion criteria for the road crossing events were: (a) the vehicle yielded to the pedestrian, (b) the pedestrian actively crossed the road, (c) driver gaze and pedestrian head position were visible for at least part of the crossing, (d) the crossing duration was at least 1 s, and (e) the pedestrian lane entry was visible.
The road crossing events were first detected by applying computer vision to video capturing the forward view. Events were then manually screened to ensure the detected pedestrian entered the roadway ahead of the vehicle’s path. Events were annotated to extract relevant driver, pedestrian, and context information (see Noonan et al. (2023) for more details on dataset sampling).
Driver gaze and pedestrian head position were coded on a frame-by-frame level (30 frames per second). Pedestrian head position served as a proxy for pedestrian gaze (Lee et al., 2018) due to challenges in extracting relevant pedestrian eye movements from forward view video. Some of the analyzed road crossings had missing values, due to the nature of naturalistic data (e.g., momentarily occlusion). These moments were marked as not annotatable. The timepoint when the pedestrian entered the lane as well as the type of crossing were also extracted from the videos. Crossing type was classified as protected (e.g., stop sign/traffic light), designated (e.g., zebra crossing), or undesignated when no specific infrastructural support was present.
Analysis
This work analyzed the prevalence, duration, frequency, and dynamics of driver-pedestrian gaze behavior from 6 s before to 6 s after a pedestrian’s lane entry for the three different crossing types. To get an overview of the overall prevalence of driver and pedestrian gaze directions (e.g., looking at each other, not looking at each other) and data availability before and after pedestrian lane entry, the percentage crossings with a certain behavior present were visualized for the complete 12-s time interval.
For bidirectional gazing specifically, we computed the count and durations of glances (i.e., “the temporal maintaining of visual gaze within an area-of-interest” (ISO 15007-1:2020)) for all crossings with at least one bidirectional gaze. Brief moments (less than 100 ms; that is, the lower bound of a fixation (ISO 15007-1:2020; ISO, 2020)) of not annotatable behaviors were extrapolated before computing the durations and counts. Longer periods of missing data were not manipulated.
The relationship between bidirectional gazing, time interval, and crossing type was modeled with a generalized negative binomial mixed effects model with driver-specific random intercept. We estimated the proportion of bidirectional gazing within 2-s binned time intervals and for the different crossing types. This was achieved by modeling the frame counts with a bidirectional gaze with an offset term for the number of annotatable observations in each time interval. The model was fitted using R and the glmmTMB-package (Brooks et al., 2017). Pairwise comparisons for crossing type and time interval were performed using the R package emmeans (Lenth et al., 2024) with Tukey adjustments for multiple comparisons and with the alpha level set to .05.
Results
Prevalence
Figure 1a displays the proportional prevalence of four distinct combinations of pedestrian and driver gaze including when gaze data is not available in white color (e.g., the pedestrian is not visible yet). Early on (6 s before pedestrian lane entry), data availability is low and we know relatively little about the combined pedestrian and driver behaviors, primarily because pedestrian head position is unknown. When the pedestrian is closer to lane entry, the data availability increases, with the most data being available right after the pedestrian enters the lane. The most prevalently observed gaze pattern was a driver looking toward the pedestrian while the pedestrian looked elsewhere (turquoise-colored segment) or a driver and a pedestrian who did not look in each other’s direction (brown-colored segment). In contrast, bidirectional gazing (red-colored segments) and pedestrian looking at the driver while the driver looked elsewhere (yellow-colored segments) were found to be relatively rare.
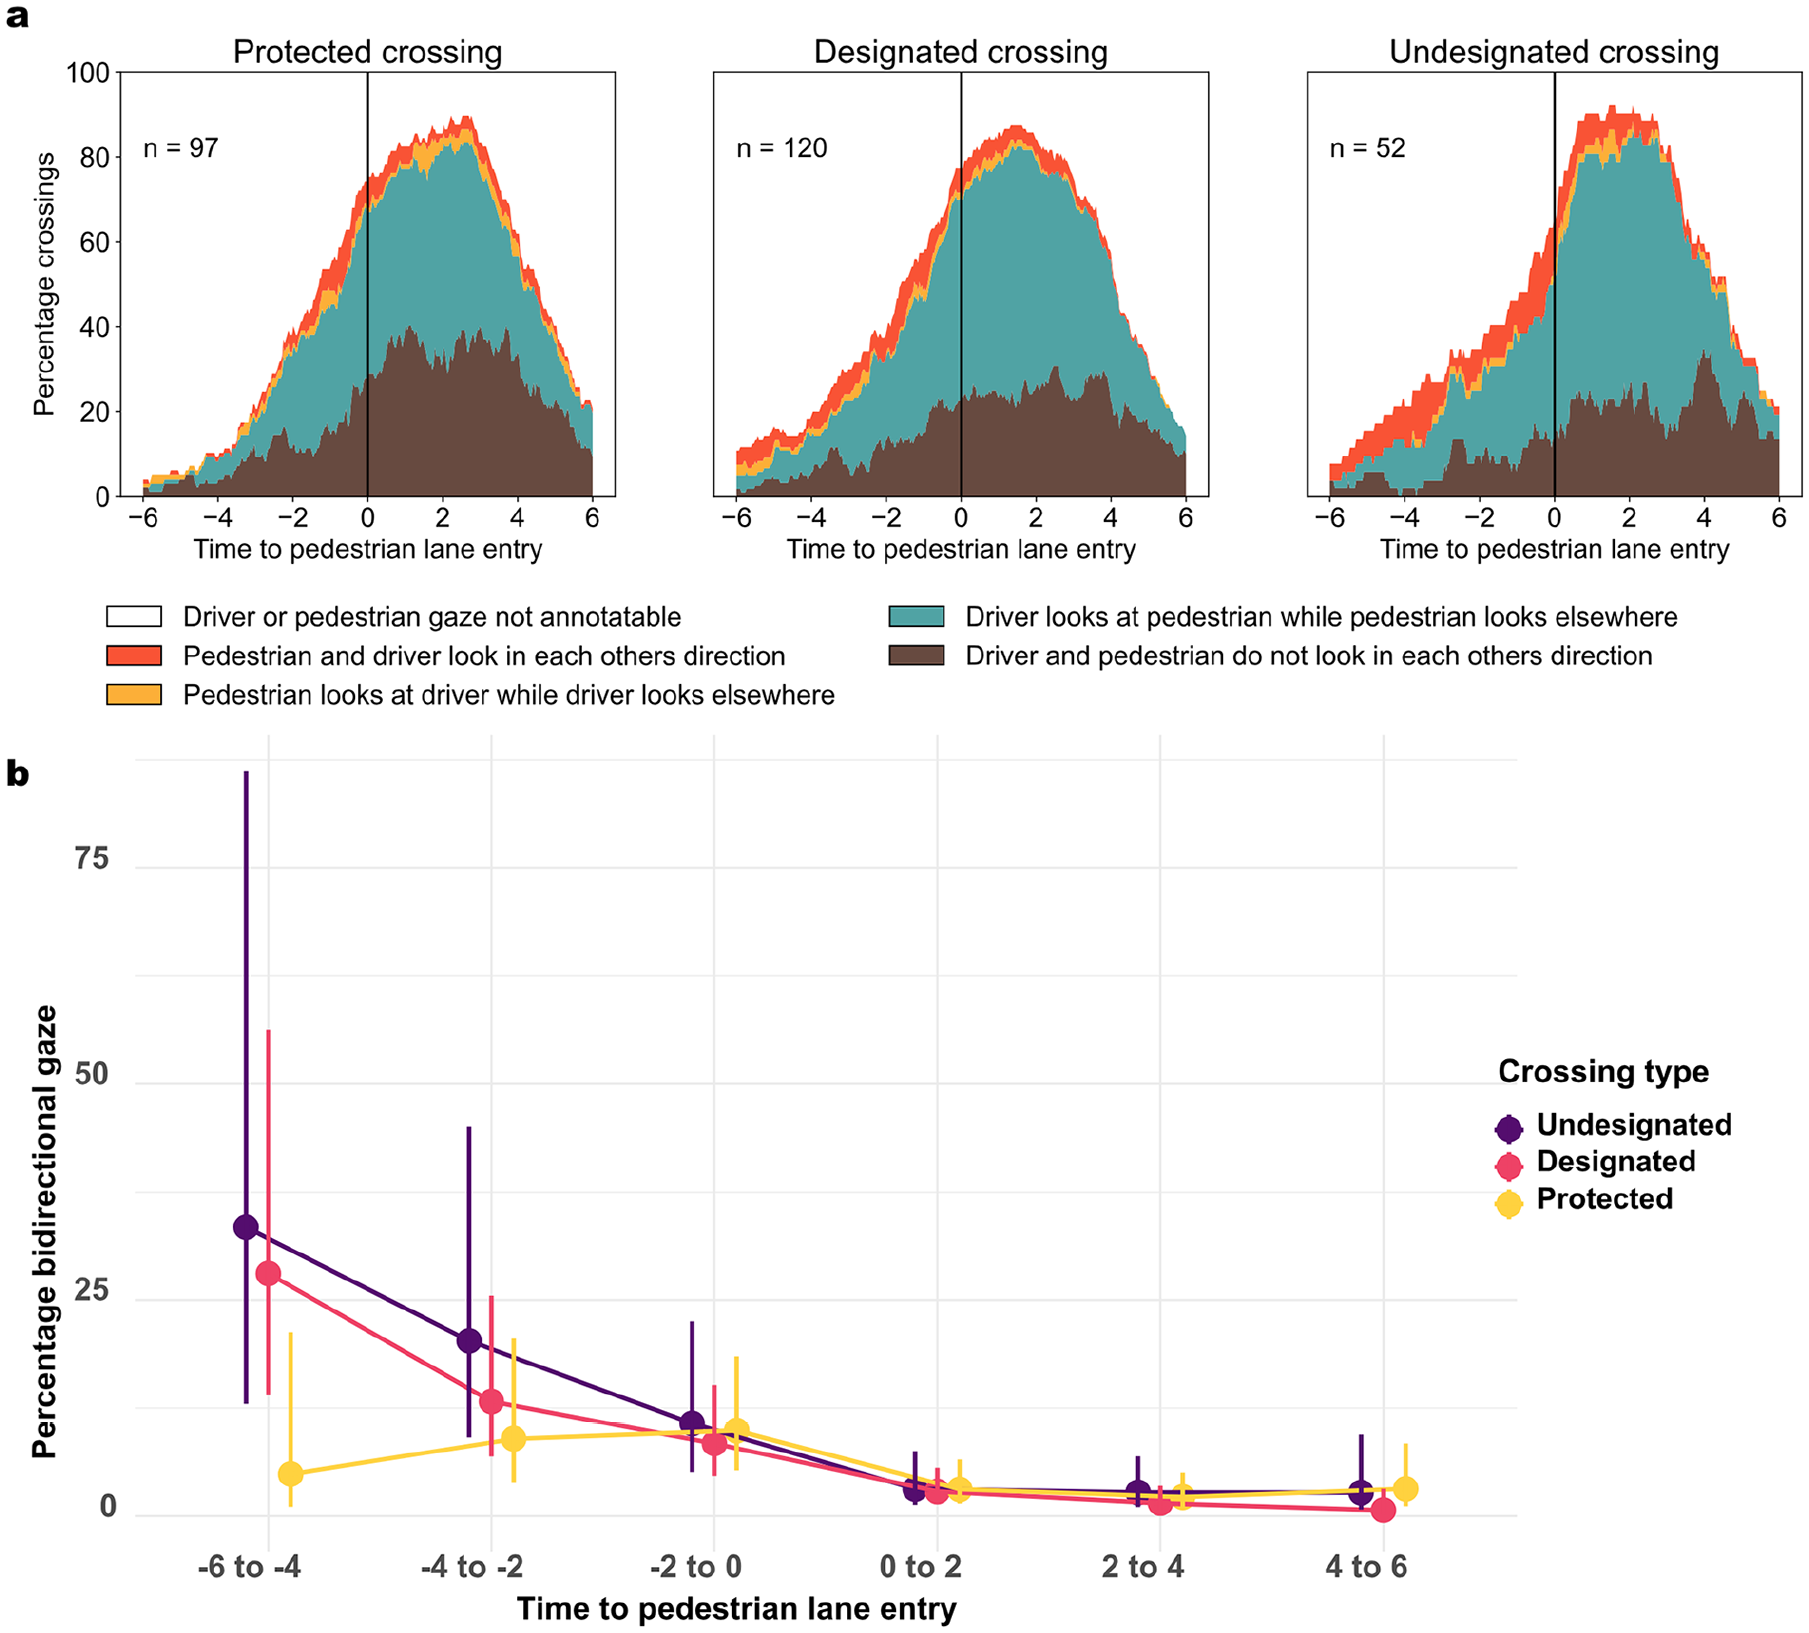
(a) The percentage of road crossings that have a certain behavior visible at the given point in time. The red colored segments, specifically, represent the bidirectional gazing and the white represent crossings with not annotatable data at the specific time point. (b) Estimated percentage of bidirectional gaze in 6 s before to 6 s after the pedestrian enters the lane of the traveling vehicle, given the negative binomial model on count data.
Focusing specifically on the percentage of bidirectional gazing out of the available data within each time interval (i.e., the colored segments in Figure 1a), bidirectional gazing exhibited different patterns over time depending on the crossing type (Figure 1b). At 6 to 4 s before pedestrian lane entry, bidirectional gazing was 5.77 times more prevalent for designated crossings at 28% (95% CI [13.0, 86.2]) and 6.88 times more prevalent for undesignated crossings at 33% (95% CI [14.0, 56.2]) compared to 5% (95% CI [1.1, 21.3]) for protected crossings, p = .06 and, p = .05, respectively. The difference between the crossing types decreased over time to similar percentages (8%–10%) at 2 to 0 s before lane entry.
Right after the lane entry (in the 0–2 s interval) the proportional bidirectional gazing decreased markedly from 9.9% (95% CI [5.3, 18.5]) to 3.1% (95% CI [1.5%, 6.6%]), p = .03 for protected crossings, from 10.7% (95% CI [5.1, 22.5]) to 3.2% (95% CI [1.3, 7.5]), p = .15 for undesignated crossings and from 8.4% (95% CI [5.3, 18.5]) to 2.9% (95% CI [1.5, 5.6]), p = .01 for designated crossings. Following that, the proportion of bidirectional gazing was low overall (1%–3%) 2 to 6 s after pedestrian lane entry.
Duration and Counts
Bidirectional gazing was observed in 97 (36%) of the road crossings, 32 of them were protected crossings, 46 designated crossings, and 19 undesignated crossings. Focusing on the crossings with at least one bidirectional gaze, these gaze periods were overall few and short with some variability across crossing types (Figure 2). The bidirectional gaze duration ranged from 0.07 to 2.8 s (Med. = 0.6 s, SD = 0.66) for the protected crossing, 0.03 to 3.3 s (Med. = 0.65 s, SD = 0.65 s) for the designated crossing, and 0.03 to 3.0 s (Med. = 0.8 s, SD = 0.9) for the undesignated crossing (Figure 2 top). A Kruskal-Wallis non-parametric test revealed no significant difference in glance durations across the different crossings, H(2) = 2.19, p = .33. The glance frequency ranged from 1 to 4 (Med. = 1, SD = 0.66) glances for the protected crossing, 1 to 5 (Med. = 1, SD = 0.86) for the designated crossing, and 1 to 5 (Med. = 2, SD = 1.11) for the undesignated crossing (Figure 2 bottom). The counts were marginally non-significant given a Kruskal-Wallis test, H(2) = 5.68, p = .06.
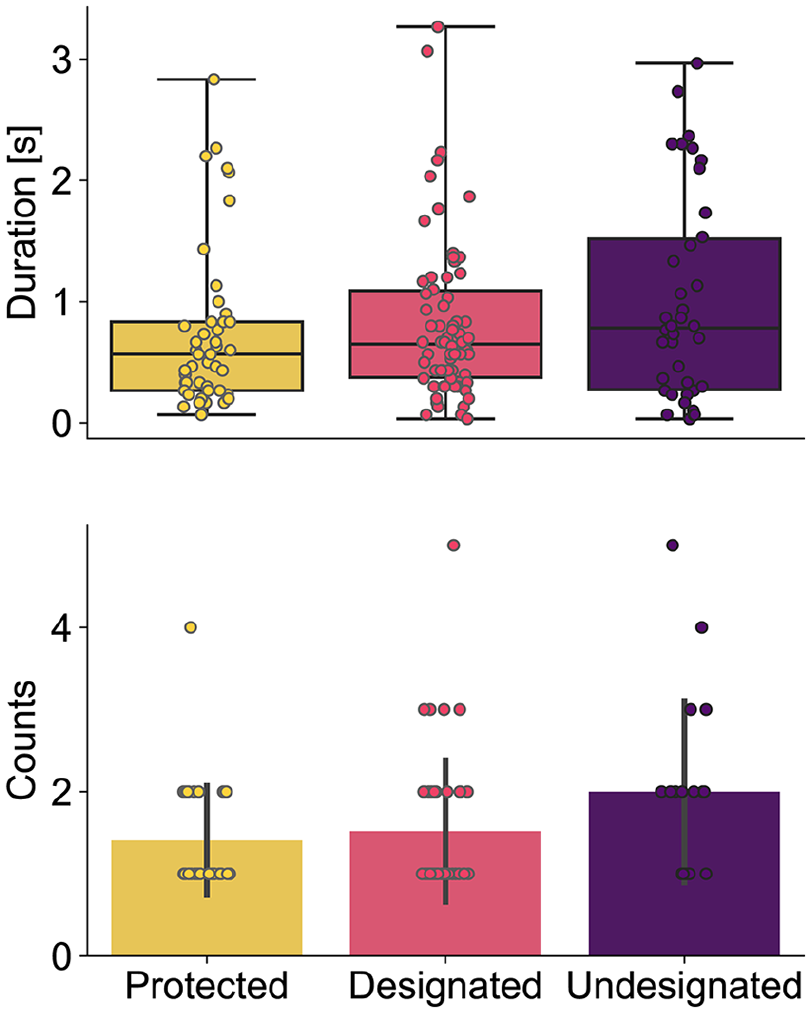
Durations (top) and counts (bottom) of bidirectional gazing within each road crossing across the three crossing types.
Discussion and Conclusion
This work shows evidence that when pedestrian and driver gaze could be observed, drivers and pedestrians for the most part do not look in the direction of one another simultaneously during pedestrian crossing events. As illustrated by Figure 1a, most of the encounter time when gaze behavior was observable consists of a driver that looks in the direction of the pedestrian while the pedestrian looks elsewhere. In contrast, a pedestrian looking toward the driver, while the driver looks elsewhere is rare. Taken together this may suggest that bidirectional gazing is typically governed by the pedestrian’s decision to look toward the driver who is likely already looking toward the direction of the pedestrian. The high prevalence of a driver’s gaze in the direction of the pedestrian is likely explained by the alignment between the location of the pedestrian and the forward roadway, which is where drivers generally look because of its importance for safe driving (Green, 2015).
Our findings demonstrate that bidirectional gazing occurs in naturalistic road crossings, with 36% of crossing events involving at least one bidirectional glance. These glances were typically few (median of 1 glance per encounter) and brief (lasting 0.65–0.80 s across the three crossing types). Importantly, while bidirectional gazing (i.e., pedestrians and drivers looking in each other’s direction) is a prerequisite for making eye contact, it does not guarantee that eye contact will occur. Previous research suggests that it is challenging for pedestrians to see a driver’s eyes due to factors like distance, window glare, and other obstacles (AlAdawy et al., 2019). Given the brief nature of the glances observed in this study, even if eye contact is established, it is unlikely to be maintained for long.
Additionally, the specific conditions required for eye contact (e.g., no window glare, driver being sufficiently close to the pedestrian) may not always be present. Therefore, the short bidirectional glances may simply indicate that pedestrians quickly assess the vehicle’s kinematics to make a crossing decision, without necessarily seeing the driver’s eyes, even if the driver looks in the pedestrian’s direction. Overall, these findings suggest that a brief glance in each other’s direction may be sufficient (or perceived as sufficient) for coordinating access to the shared space.
Our findings indicate a tendency (marginally non-significant) for bidirectional gazing to be more prevalent especially early in crossings, more frequent, and longer for crossing types with less infrastructural support. This may suggest that, in the absence of infrastructural support, early on during crossings drivers and pedestrians rely more on visual communication by looking in each other’s direction to determine considerations such as gap size, trajectory, speed, or distance compared to closer to pedestrian lane entry. However, closer to pedestrians entering the lane, we find similar gaze patterns across the crossing types, which may suggest another type of gaze behavior (e.g., checking if it is safe to cross).
Overall, this paper presents insights from naturalistic data on vehicle-pedestrian encounters at road crossings and, as such, has several limitations including a relatively small sample size. The pedestrian behaviors were collected using a forward-facing camera, while driver behaviors were collected using an in-vehicle camera. Consequently, the captured pedestrian behaviors are dependent on several contextual factors that were not controlled for such as distance between drivers and pedestrians, and occlusion. This is a potential explanation for why our study found a higher prevalence of drivers looking at pedestrians than vice versa which was observed in the study by Sucha et al. (2017) who measured bidirectional gazing at the crosswalk using infrastructure mounted cameras. Furthermore, the data focuses on yielding scenarios, and may not generalize to scenarios when a driver does not yield to the pedestrian. Finally, given the marginal non-significance of the findings, future studies should build on this work.
In summary, this study uses naturalistic data and leverages bidirectional gazing to unpack part of the implicit communication between drivers and pedestrians. Introducing the term bidirectional gazing to distinguish between measures of explicit eye contact (e.g., by using sophisticated eye-tracking devices; Onkhar et al., 2022) furthers the study of communication between agents in the driving environment. These insights may be generalized to guide the development of autonomous vehicles-pedestrian interactions, to retain features of bidirectional communication as well as support the development of human-centric advanced driver assistance systems that inform system responses while also considering the presence or lack of communication between drivers and pedestrians.
Footnotes
Acknowledgements
This research was supported by the Toyota Collaborative Safety Research Center. Data for this study was drawn from work supported by the Advanced Vehicle Technologies (AVT) Consortium at MIT (![]() ). The views and conclusions expressed are those of the authors and have not been sponsored, approved, or endorsed by supporting organizations.
). The views and conclusions expressed are those of the authors and have not been sponsored, approved, or endorsed by supporting organizations.
Declaration of Conflicting Interests
The author(s) declared no potential conflicts of interest with respect to the research, authorship, and/or publication of this article.
Funding
The author(s) received no financial support for the research, authorship, and/or publication of this article.