
Abstract
Objective
To explore factors that could explain why older adults are more at risk at the roadside.
Background
The physical and psychological health benefits of walking have been well-established, leading to the widespread promotion of walking amongst older adults. However, walking can result in an increased risk of injury as a pedestrian at the roadside, which is a greater risk for older adults who are overrepresented in pedestrian casualty figures.
Method
Relevant databases were searched up to January 2020. All peer-reviewed journals that presented data on healthy older adults and some aspect of road crossing or roadside behavior were included. A total of 142 papers were assessed and 60 met the inclusion criteria.
Results
Identified papers could be grouped into three areas: crossing at a designated crossing place; crossing with no designated crossing place; perceptions or behaviors.
Conclusion
Multiple individual (attitudes, perceived behavioral control, walking time, time-to-arrival judgments, waiting endurance, cognitive ability), task (vehicle size, vehicle speed, traffic volume), and environmental (road layout, time of day, weather) constraints influence road crossing in older adulthood.
Application
Accessibility of designated crossing areas needs to be addressed by ensuring sufficient time to cross and nonrestrictive waiting times. Signalized crossings need to be simplified and visibility increased. Where there is no designated crossing place, a reduction in speed limit alongside the provision of pedestrian islands to provide “pause” places are needed. Educational-based programs may also help ensure safety of older adults where there is no designated crossing place.
Introduction
Walking is a sustainable mode of transportation that can serve many purposes including exercise, recreation, travel, companionship, relaxation, restoration, and enhancing emotional well-being (Barton et al., 2009). In older adults, walking has also been shown to reduce the risk of coronary heart disease in men (Hakim et al., 1999) and is associated with reductions in the incidence of cardiovascular events among postmenopausal women (Manson et al., 2002). Given these benefits, it is unsurprising that interventions that promote walking amongst older adults have become widely adopted worldwide (Franks et al., 2018; Kubota et al., 2020). However, with walking comes an increased risk of injury as a pedestrian at the roadside (Kim & Ulfarsson, 2019). Across the globe, up to 40% of preventable road traffic deaths are accounted for by pedestrians, with higher numbers more apparent in developing countries (World Health Organisation, 2020). Furthermore, older adults are overrepresented in pedestrian accident statistics; for example, in Great Britain in 2018, 23% of the pedestrians injured or killed were over 65 years of age (Department for Transport, 2018), while this age group only accounted for 18.5% of the population (Office of National Statistics, 2019). In addition to the heightened risk, pedestrians aged over 65 years are age more likely to be seriously injured in road traffic accidents compared to younger adults (Islam & Hossain, 2015; Niebuhr et al., 2016; Shamsunnahar et al., 2014; Wang et al., 2017). In fact, this increased fatality rate is 2.28 per 100,000 higher for those over 75 years old compared to the fatality rate of any other age group (Karsch et al., 2012).
Chronological age itself, however, does not explain why older adults are more vulnerable at the roadside; rather, a deterioration or difficulty in one or more of the processes needed to cross the road safely could result in an increase in rate of injury. In order to successfully execute a road crossing, pedestrians must perceive and pay attention to vehicles approaching from both directions. They need to detect approaching traffic, determine the velocity of approaching vehicles, and estimate if they have enough time to cross before the approaching vehicle reaches their crossing path. Once the decision to cross has been taken, pedestrians must execute a crossing movement, reevaluating the risks as they go. Deterioration in functions that come with aging, such as vision (Klein, 1991), hearing (Gordon-Salant, 2005), visual perception (Haegerstrom-Portnoy et al., 1999), motion sensitivity (Snowden & Kavanagh, 2006), ability to estimate time to contact (Schiff et al., 1992), and general executive function (Moscovitch & Winocur, 1995; West, 1996), may all influence the ability to detect approaching vehicles and make decisions about whether crossing is safe in a fast and efficient way. Furthermore, the movement component of road crossing could serve as another explanation for the overrepresentation of older pedestrians involved in road traffic accidents, with age bringing a loss of stability (Maki, 1997), an increased movement initiation time (Rogers & Mille, 2016), and a tendency to look down whilst walking, any or all of which could be detrimental to the necessary visual monitoring behavior of approaching vehicles (Avineri et al., 2012).
The constraints-based approach provides an interesting framework when considering factors that might influence crossing ability (Newell, 1986). This framework suggests that individual, task, and environmental factors can constrain emerging movements; these constraints are unique to each individual and can change from moment to moment. Using this framework, we can think of crossing the road as the emerging movement within individual constraints, with task constraints and environmental constraints all impacting on that movement and determining whether it is a safe crossing movement or an unsafe crossing movement. Within this context, we can place age as an individual constraint, but we can also consider other individual constraints and consider why one older adult might be more or less at risk than another. We can also investigate task and environmental constraints in order to consider the components of road crossing and the role of infrastructure on pedestrian safety.
In order to fully identify the pedestrian risk factors for older adults, it is necessary to critically consider the existing literature prior to developing recommendations that might reduce these risks. The aim of this systematic review was therefore to explore existing literature relating to older adults as pedestrians. Specifically, we were interested in factors that may explain why older adults are more at risk at the roadside.
Methods
Search Strategy
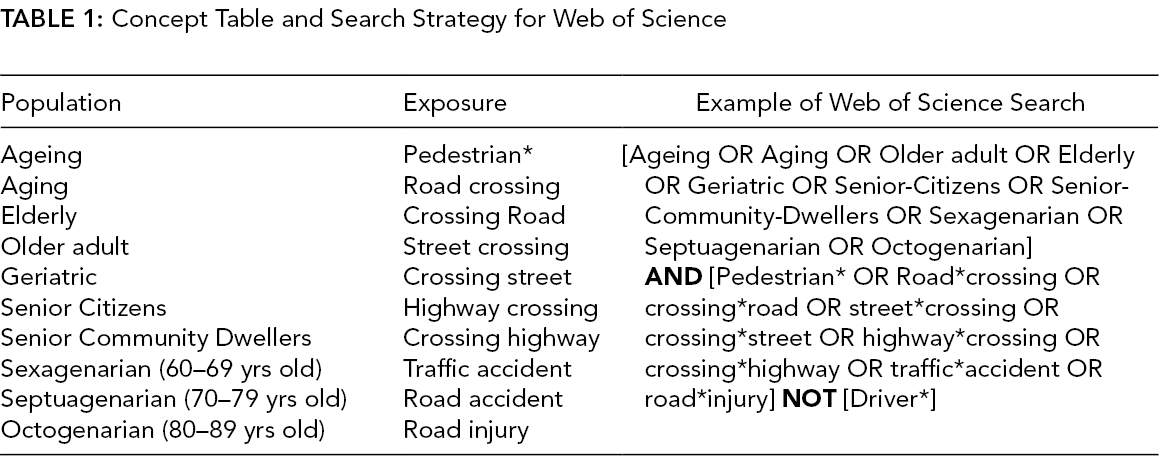
A literature search was conducted independently by KW using 10 electronic databases: Web of Science; PsychInfo; Applied Social Sciences Index and Abstracts (ASSIA); Ovid Medline Scopus; Embase; CINAHL; PubMweed; ProQuest Public Health; Cochrane Library; and AMED. These databases were selected as they represent a broad spectrum of disciplines. The final search was performed on January 8, 2020. We combined terms to describe the population of interest with terms referring to road crossing, where possible MeSH terms and Boolean operators were used. Finally, hand searches were made of the reference lists of relevant reviews and included articles. A full description of the search strategy for Web of Science is provided in Table 1 as an example.
Concept Table and Search Strategy for Web of Science
Inclusion and Exclusion
The inclusion criteria were studies that (1) presented data focusing on healthy older adults; (2) presented data focusing on some aspect of road crossing; (3) were published in peer reviewed journals; and (4) were written in English. Exclusion criteria were studies that did not, in some way, distinguish between adults less than 60 years of age and those above 60 years of age. No year of publication limit was imposed. PhD theses were not included but a search for published articles that arose from a thesis were searched for and, if they met the inclusion criteria, were included. After removing duplicates and screening titles and abstracts, both authors independently read full articles for eligibility. The authors reached a consensus of doubtful manuscripts through discussion.
Data Extraction
Extracted studies could be of any design and be published at any time. All outcomes were extracted through the selection of means, medians, and standard deviations. Both authors independently extracted data from each article using a data extraction form adapted from the Cochrane Collaboration.
Results
The database search identified a total of 5390 records with an additional six records identified through other sources. After removing duplicates, a total of 4492 records were identified. All titles were screened by KW, and those clearly not meeting the inclusion criteria were excluded on the basis of the paper title. This left 142 papers for which full texts were sourced. At this stage, a further 80 studies were excluded either because they focused on reporting incidence of injury, were not written in English, were not peer reviewed, did not focus on pedestrians, had no distinct over 60 years age group, performed no age comparison, or focused on atypical populations. This left 60 papers that are included in this review; this process is summarized in Figure 1. The papers were divided into three areas: crossing at a designated crossing place; crossing with no designated crossing place; and perceptions and behaviors.
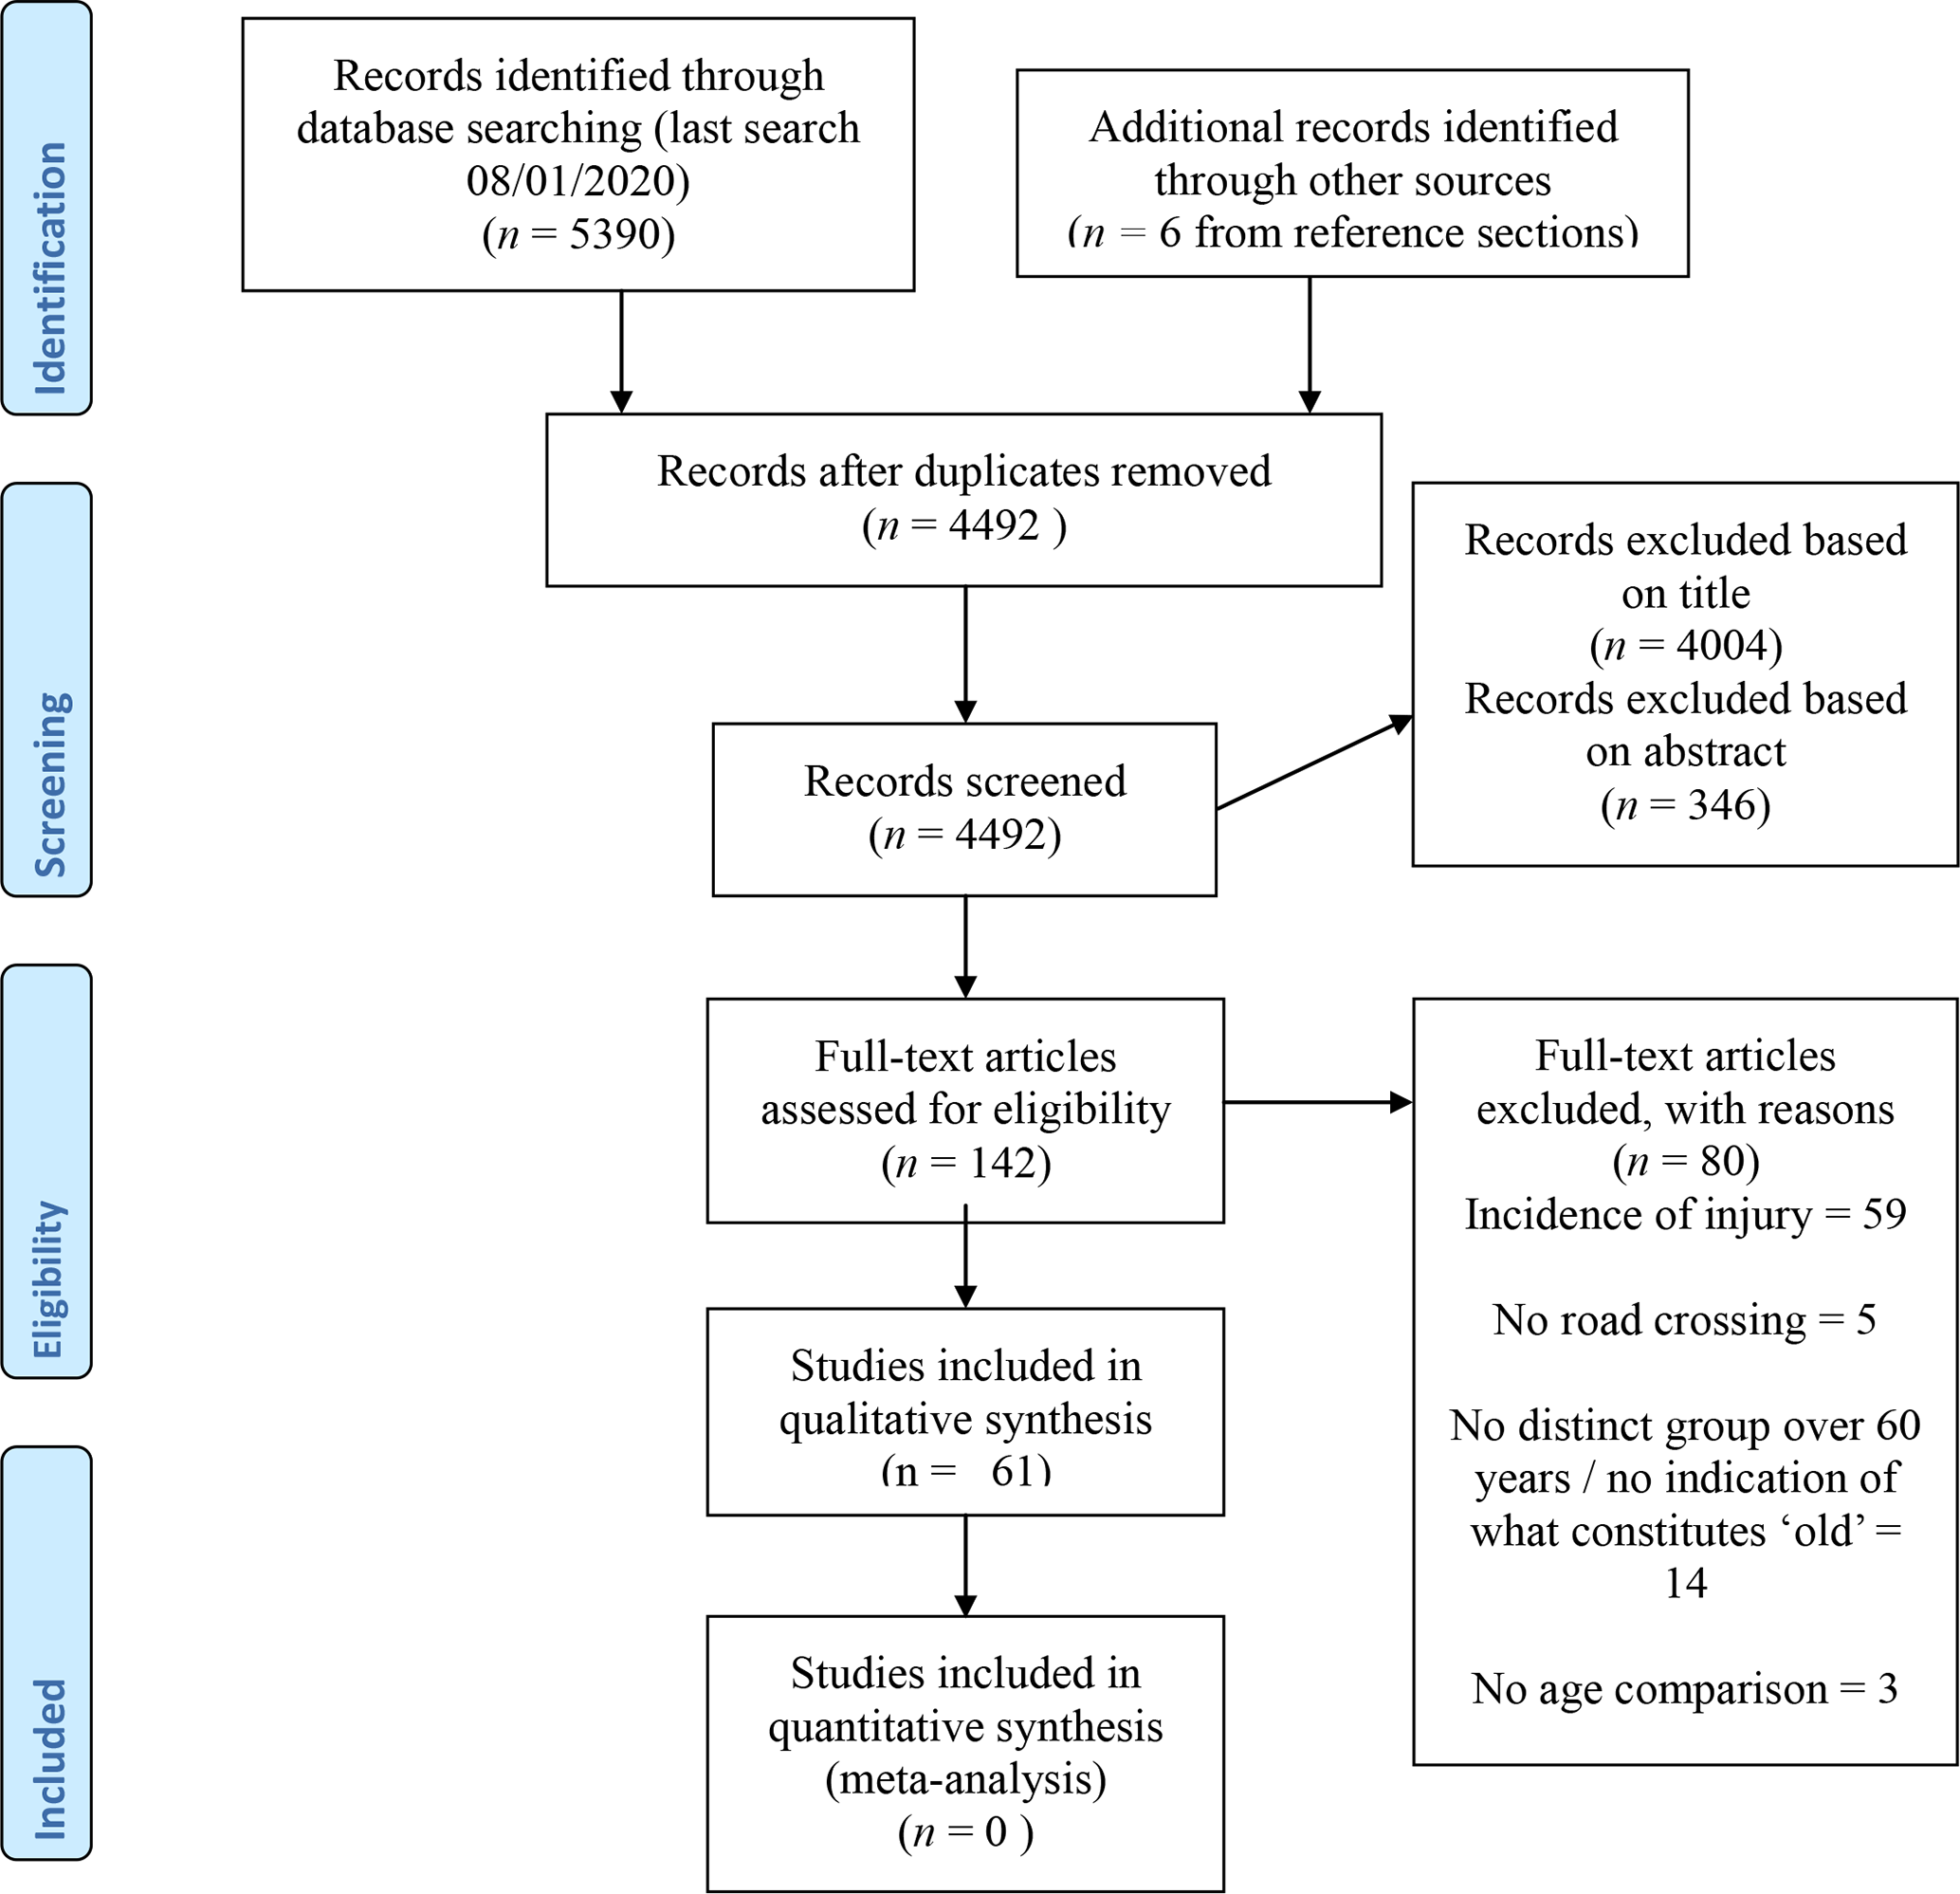
Preferred Reporting Items for Systematic Reviews and Meta-Analyses (PRISMA) flowchart.
Summary of Papers and Discussion
Common Methodologies
The most commonly used methodologies are described below. Some studies did adopt alternative methods, but as these were far fewer they are described in the summary sections.
Observational studies
These consisted of one or more live observers and/or video cameras located near a potential crossing location. Papers typically observed multiple sites within a city. Both sites with and without signalized crossings featured across papers and road type differed from single lane to crossing six lanes of bi-directional traffic and with speed limits from 20 km/hr to 70 km/hr. Typically studies focusing on very wide roads (six lanes) were geographically located in very different places to those considering narrower (two lane) roads. Details of the location of the study, road size, and speed limit are detailed in summary tables below. In terms of the signalized roads, differences between and within studies also included the type of signalized crossing, that is, with or without a pedestrian countdown device, with or without a crossing island and the types of signals present (“walk” and “don’t walk” signals common in the United States and Canada; green, flashing green, and red signals common elsewhere). Studies had varying criteria regarding the pedestrians who were sampled, with some only sampling pedestrians crossing alone and others including both those crossing alone and those in groups. Age of pedestrian was estimated with varying degrees of information across papers regarding how that was achieved and the potential accuracy of this. A handful of studies followed up observations by approaching pedestrians and asking them to complete a survey. The data collected varied; those looking at signalized crossing were concerned with time taken to cross and measured this from the point at which the pedestrian stepped onto the crossing until the point they stepped off. This was then converted to a speed by using the shortest crossing distance. Many of these studies also recorded whether the pedestrian finished crossing before the start of the red pedestrian signal. A group of observational studies also considered crossing without a signalized crossing and these studies typically measured safety margin or time left once crossing had started. The latter is measured by determining the time or distance between when a pedestrian steps onto the road and the closest approaching vehicle. The former takes into account walking speed and is essentially the time that will remain once crossing is complete before the car reaches the line the pedestrian crossed. Finally, a group of observational studies considered behavior at the roadside. At signalized crossings, this included time waited prior to crossing, whether pedestrians waited for a green pedestrian light, percentage of pedestrians crossing sometime after the green pedestrian light had started, and so on. At unsignalized crossings, this included the way in which pedestrians crossed very wide roads, that is, crossing in one go, crossing a number of lanes and pausing, and so on, and the way in which pedestrians interacted with vehicles.
Simulation studies
Simulation studies can be broken down into two types: those looking at walking speed at signalized crossings and those looking at free road crossings. The former ranged from simply asking participants to walk a set distance to studies that used “mock” roads with curbs and “light signals” in order to more closely simulate crossing. These studies were also able to manipulate factors such as talking on a phone, carrying a heavy load, and so on. Those looking at crossing without signalized crossings used virtual immersive environments to measure behavior on one or two lane roads. Typically, these environments varied traffic speed and/or gap length. These studies measured similar factors to the observational studies including temporal and spatial size of the gap chosen (time/distance between the participant stepping onto the road and the nearest approaching vehicle) and safety margin (gap chosen while taking into account walking speed). The way in which participants indicated they would cross differed across studies. Some simply asked participants to press a button/verbally indicate a cross and these measured walking speed away from the virtual environment, and then collision rate/safety margin is extrapolated assuming the vehicle and pedestrian traveled at a constant speed. Other studies asked participants to actually walk across the virtual road while being able to monitor oncoming traffic; in these studies, collision rate was based on the speed the pedestrian chose to walk at.
Crossing at Signalized Crossings
Walking speed and crossing time
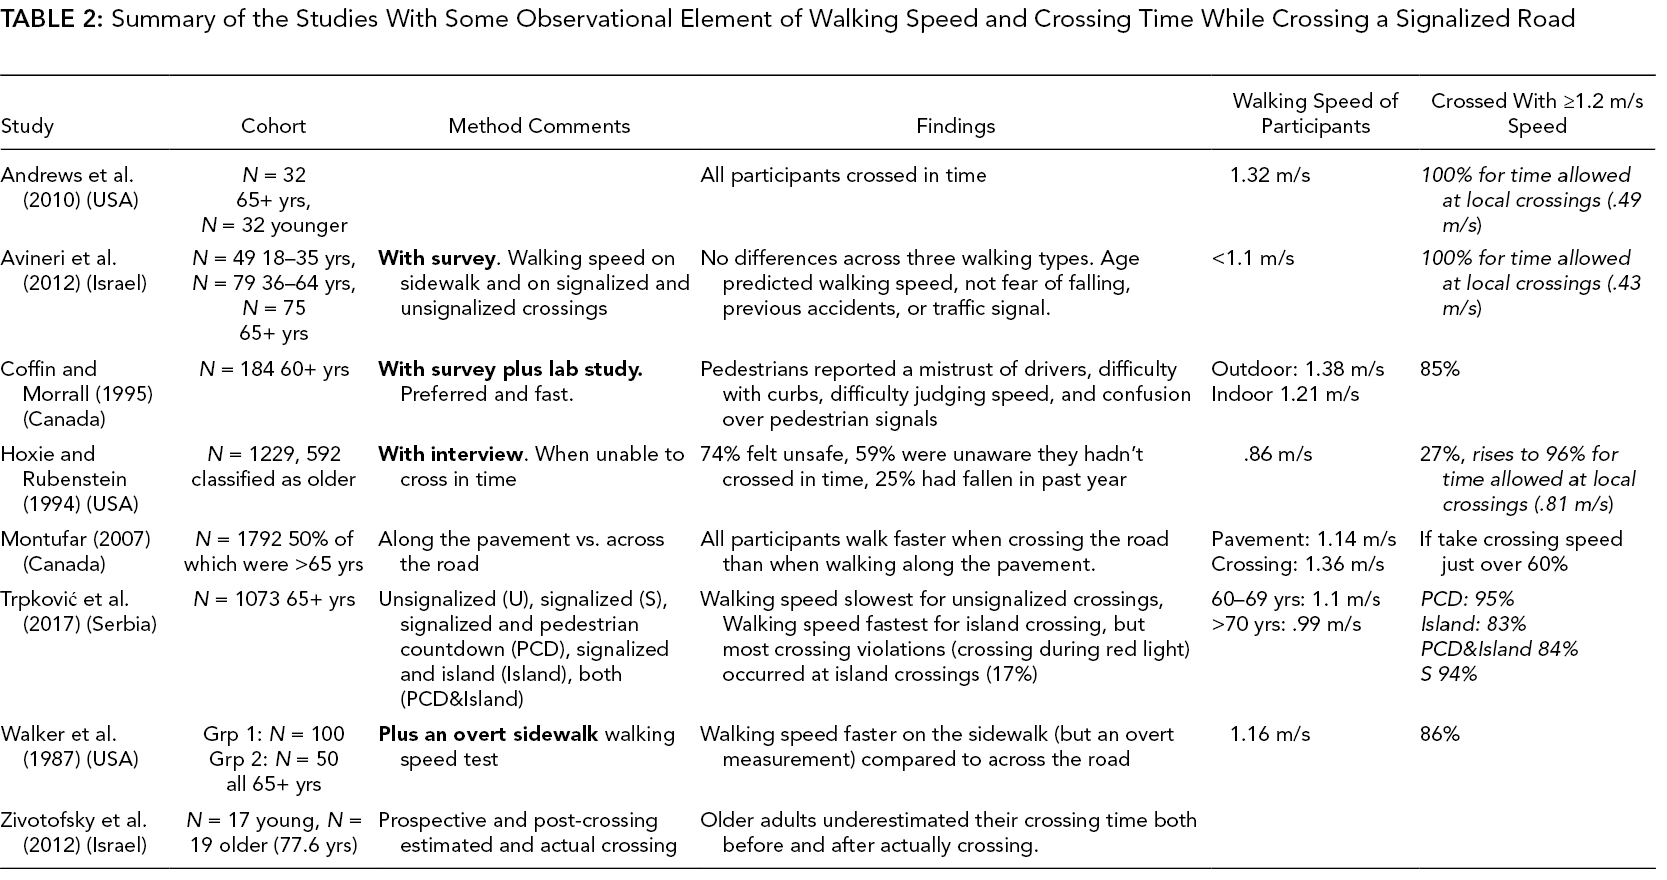
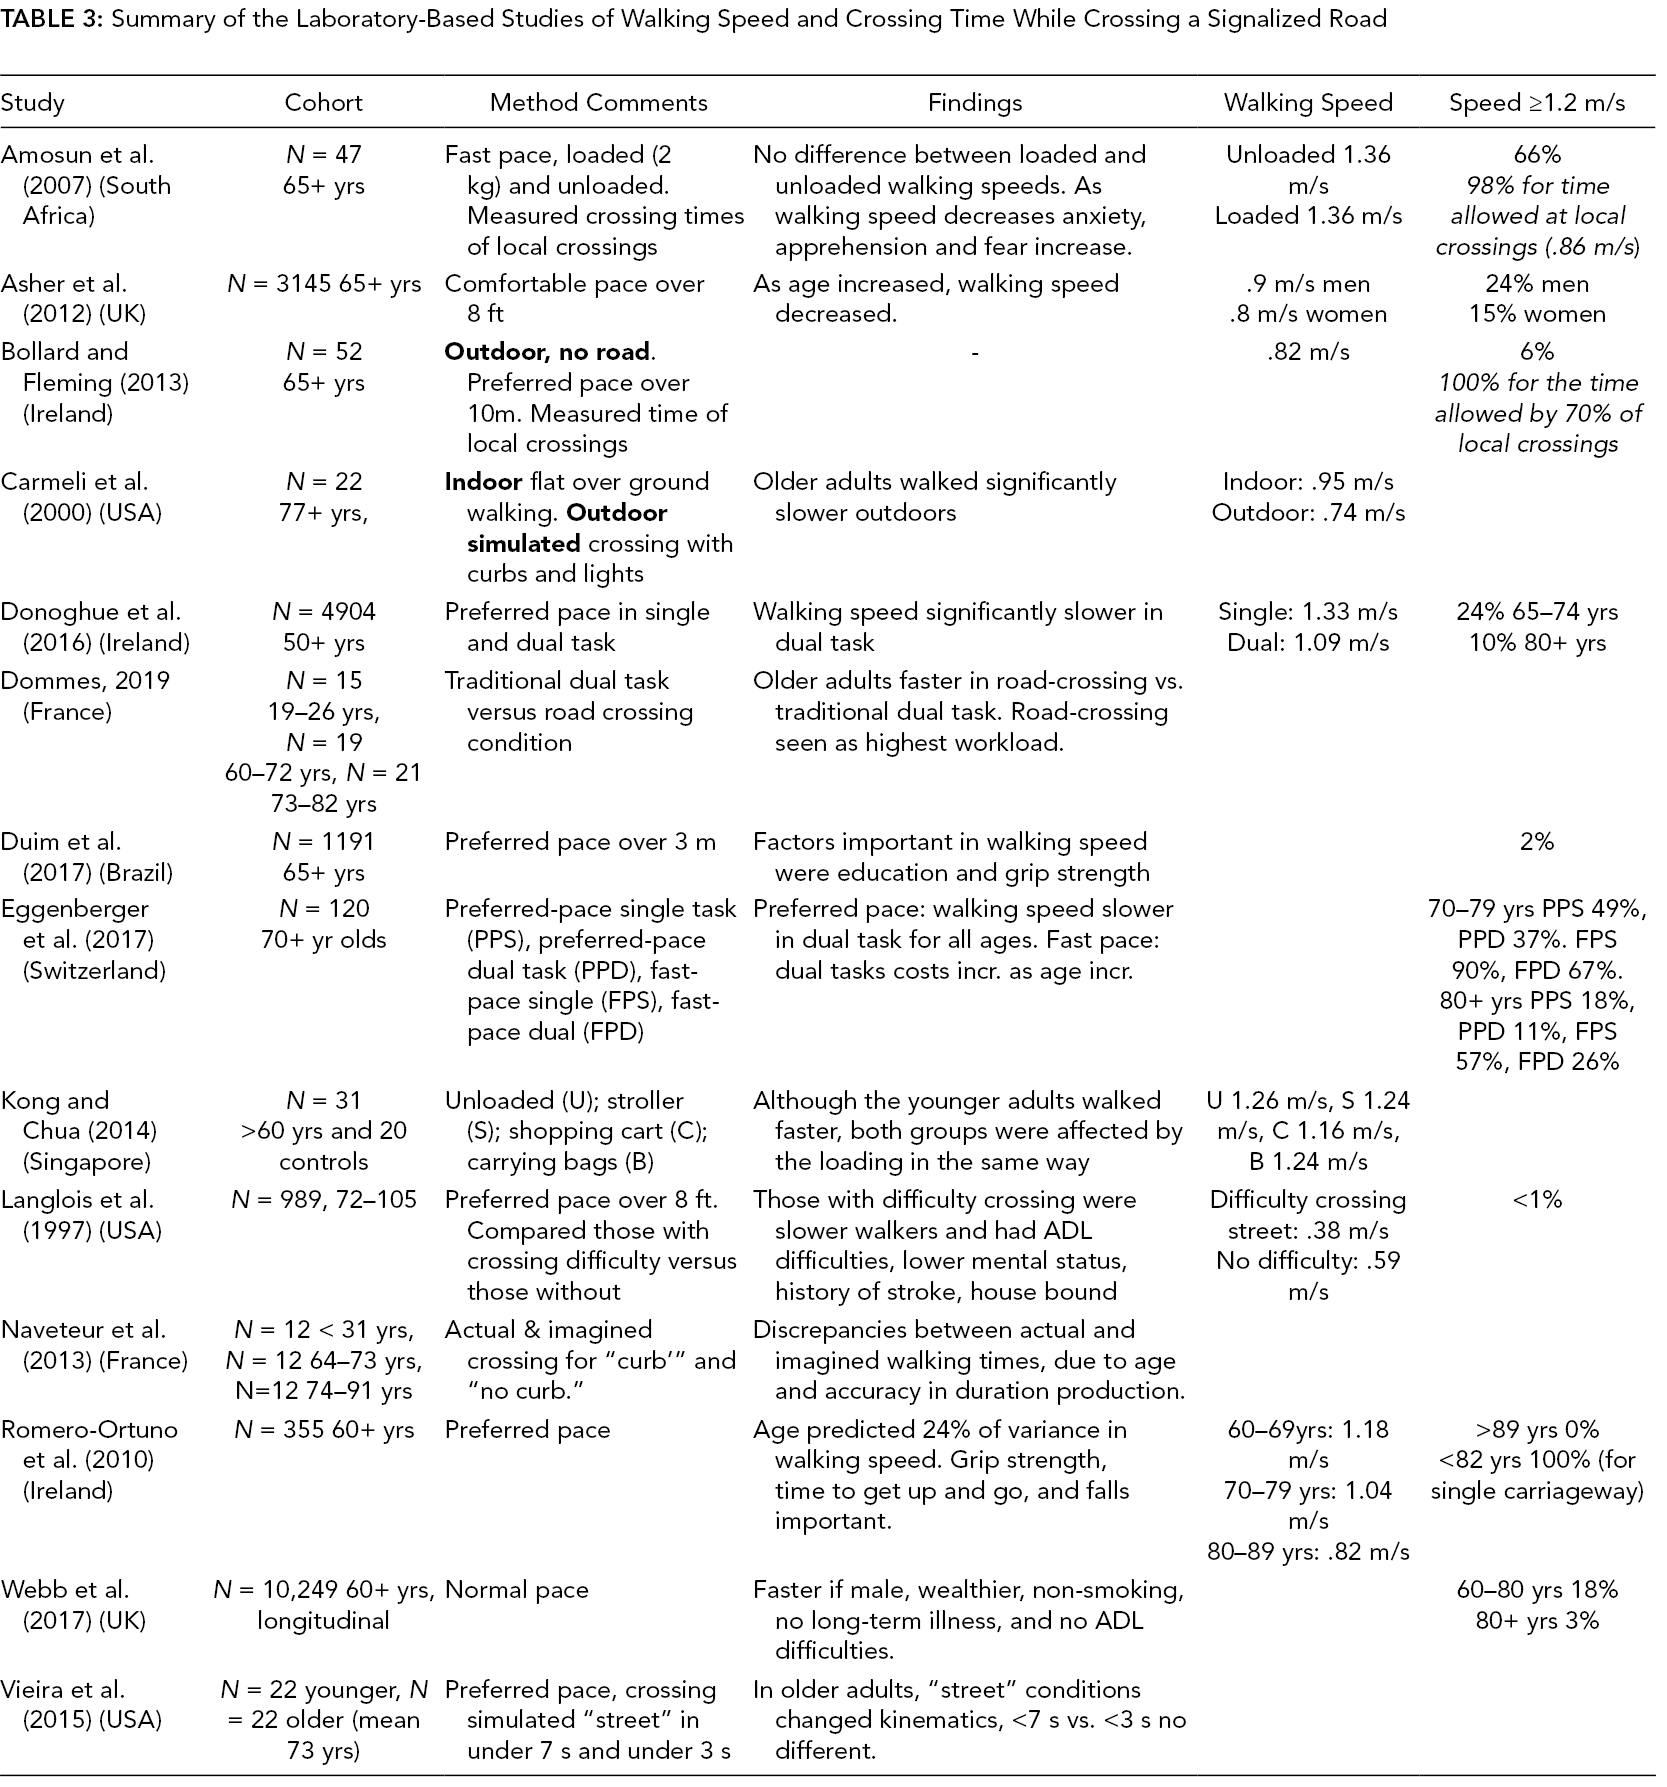
Papers that described walking speed within the context of signalized crossings are in Table 2 for observational studies and Table 3 for lab-based studies. Lab-based studies tended to find a greater proportion of older participants walking below 1.2 m/s (Asher et al., 2012; Bollard & Fleming, 2013; Webb et al., 2017) compared to the observational studies (Andrews et al., 2010; Coffin & Morrall, 1995; Hoxie & Rubenstein, 1994; Trpković et al., 2017). Across some studies, this contrast is stark with observational studies noting 100% of participants crossing in time and lab-based studies reporting <1% having a walking speed that would allow them to cross in time. However, there is a stark increase in this number for lab-based studies that asked participants to walk at a fast pace or excluded participants on the basis of poor health (Carmeli et al., 2000; Eggenberger et al., 2017). Therefore, it would seem that older adults walk faster than their “comfortable” pace when crossing roads; this is supported by one study showing faster walking speeds when crossing the road versus walking along the pavement (Montufar et al., 2002) although other studies haven’t supported this finding (Avineri et al., 2012; Walker et al., 1987). Furthermore, it might be that the cohorts used in lab-based studies do sometimes include participants who would not normally be crossing the road and so are not included in the observational studies. However, none of the observational studies, when assuming the need for a walking speed at or above 1.2 m/s found 100% of older adults achieved this. Another important point in terms of the concept of “crossing in time” is the actual time a signalized crossing allows. Five studies measured the walking speed required for signalized crossings in areas local to their studies (Amosun et al., 2007; Andrews et al., 2010; Avineri et al., 2012; Bollard & Fleming, 2013; Hoxie & Rubenstein, 1994). In all cases, the measured walking speed required at these crossings was below the recommended 1.2 m/s resulting in a greater proportion of participants crossing in time.
Summary of the Studies With Some Observational Element of Walking Speed and Crossing Time While Crossing a Signalized Road
Summary of the Laboratory-Based Studies of Walking Speed and Crossing Time While Crossing a Signalized Road
Two studies compared crossing times across different crossing types. One of these found no difference in walking time across signalized and unsignalized crossings (Avineri et al., 2012). In comparison, a second study looked at five different crossing types: unsignalized (U), signalized (S), signalized and pedestrian countdown device (PCD), signalized and island (Island), and signalized with both a pedestrian countdown device and an island (PCD&Island; Trpković et al., 2017). The unsignalized crossing resulted in the slowest crossing times and the island crossing the fastest crossing times, even though this resulted in one of the lowest “successful” crossings. Those crossings with pedestrian countdown devices only resulted in significantly more successful crossings than those with islands (with or without a crossing device) but not more than signalized only crossings. This paints a rather complicated picture and unpicking it is difficult as it isn’t clear whether the walking speed required over these four types of signalized crossings were the same. If they were, then it would seem that pedestrians were more willing to cross when an island was present regardless of the countdown time left, hence elevating unsuccessful crossings.
The effects of dual task have also been considered, with carrying out an additional task while walking (Donoghue et al., 2016; Eggenberger et al., 2017) or carrying loaded bags shown to slow participants (Amosun et al., 2007). Studies that included a young comparison group showed that both young and older adults were equally as affected (Kong & Chua, 2014). Interestingly, Dommes (2019) considered differences in walking across a traditional dual task paradigm (walking and responding to an audio or visual stimulus) and a road crossing task, which also required walking whilst processing stimuli. A dual task cost was seen in both paradigms, but older participants walked faster in the road crossing condition compared to the dual task condition, demonstrating the importance placed on walking speed when crossing a road. One final paper considered the nature of gait under different walking conditions (Vieira et al., 2015). During “road crossing” regardless of crossing time, older adults had a higher cadence, shorter step time, shorter swing time, and shorter stance time compared to younger adults. However, although the “normal” walking and “road crossing” walking differed, no differences were seen across the fast and slow road crossing conditions.
The literature cited above demonstrates clear age differences but does not investigate the mechanisms behind these age differences. A single paper considered factors that predicted walking speed in adults (Avineri et al., 2012). Only age predicted walking speed, not involvement in accidents, fear of falling, or type of crossing. However, other experimental studies that looked at ability to cross in time did find a number of factors that were important over and above age, such as poor cognitive ability (Donoghue et al., 2016; Romero-Ortuno et al., 2010), deficits in activities of daily living (Donoghue et al., 2016; Duim et al., 2017; Langlois et al., 1997), weaker grip strength (Asher et al., 2012; Duim et al., 2017; Eggenberger et al., 2017), and poor health (Bollard & Fleming, 2013; Donoghue et al., 2016; Duim et al., 2017; Langlois et al., 1997). Although these latter factors may be related to fear of falling and involvement in accidents, they are clearly stronger predictors of crossing time than the former.
A final important part of walking speed is understanding time taken to cross. Naveteur et al. (2013) found that older, but not younger, adults tended to underestimate how fast they could walk, a finding reflected in Zivotofsky et al. (2012). In contrast, Zito et al. (2015) and Butler et al. (2016) found that older adults overestimated their crossing time. An explanation for this might come from Holland and Hill (2010) who demonstrated that 60–74 year olds were most likely to underestimate their walking time while 74+ year olds were most likely to overestimate their walking time, a finding confirmed in Dommes et al. (2013). Butler et al. (2016), and Holland and Hill (2010) are described later in the paper in the section on crossing with no designated crossing place as their primary purpose was not to measure crossing speed.
Crossing behavior
Walking speed is not the only reason that crossing at a signalized or designated crossing place can be dangerous; the way in which pedestrians adhere to and understand crossing rules can also inform safety (see Table 4 for a summary of papers; please note two of the papers in this section, Coffin & Morrall, 1995 and Trpković et al., 2017, are described in Table 2).
Summary of the Studies Focusing on Crossing Behavior While Crossing a Signalized Road
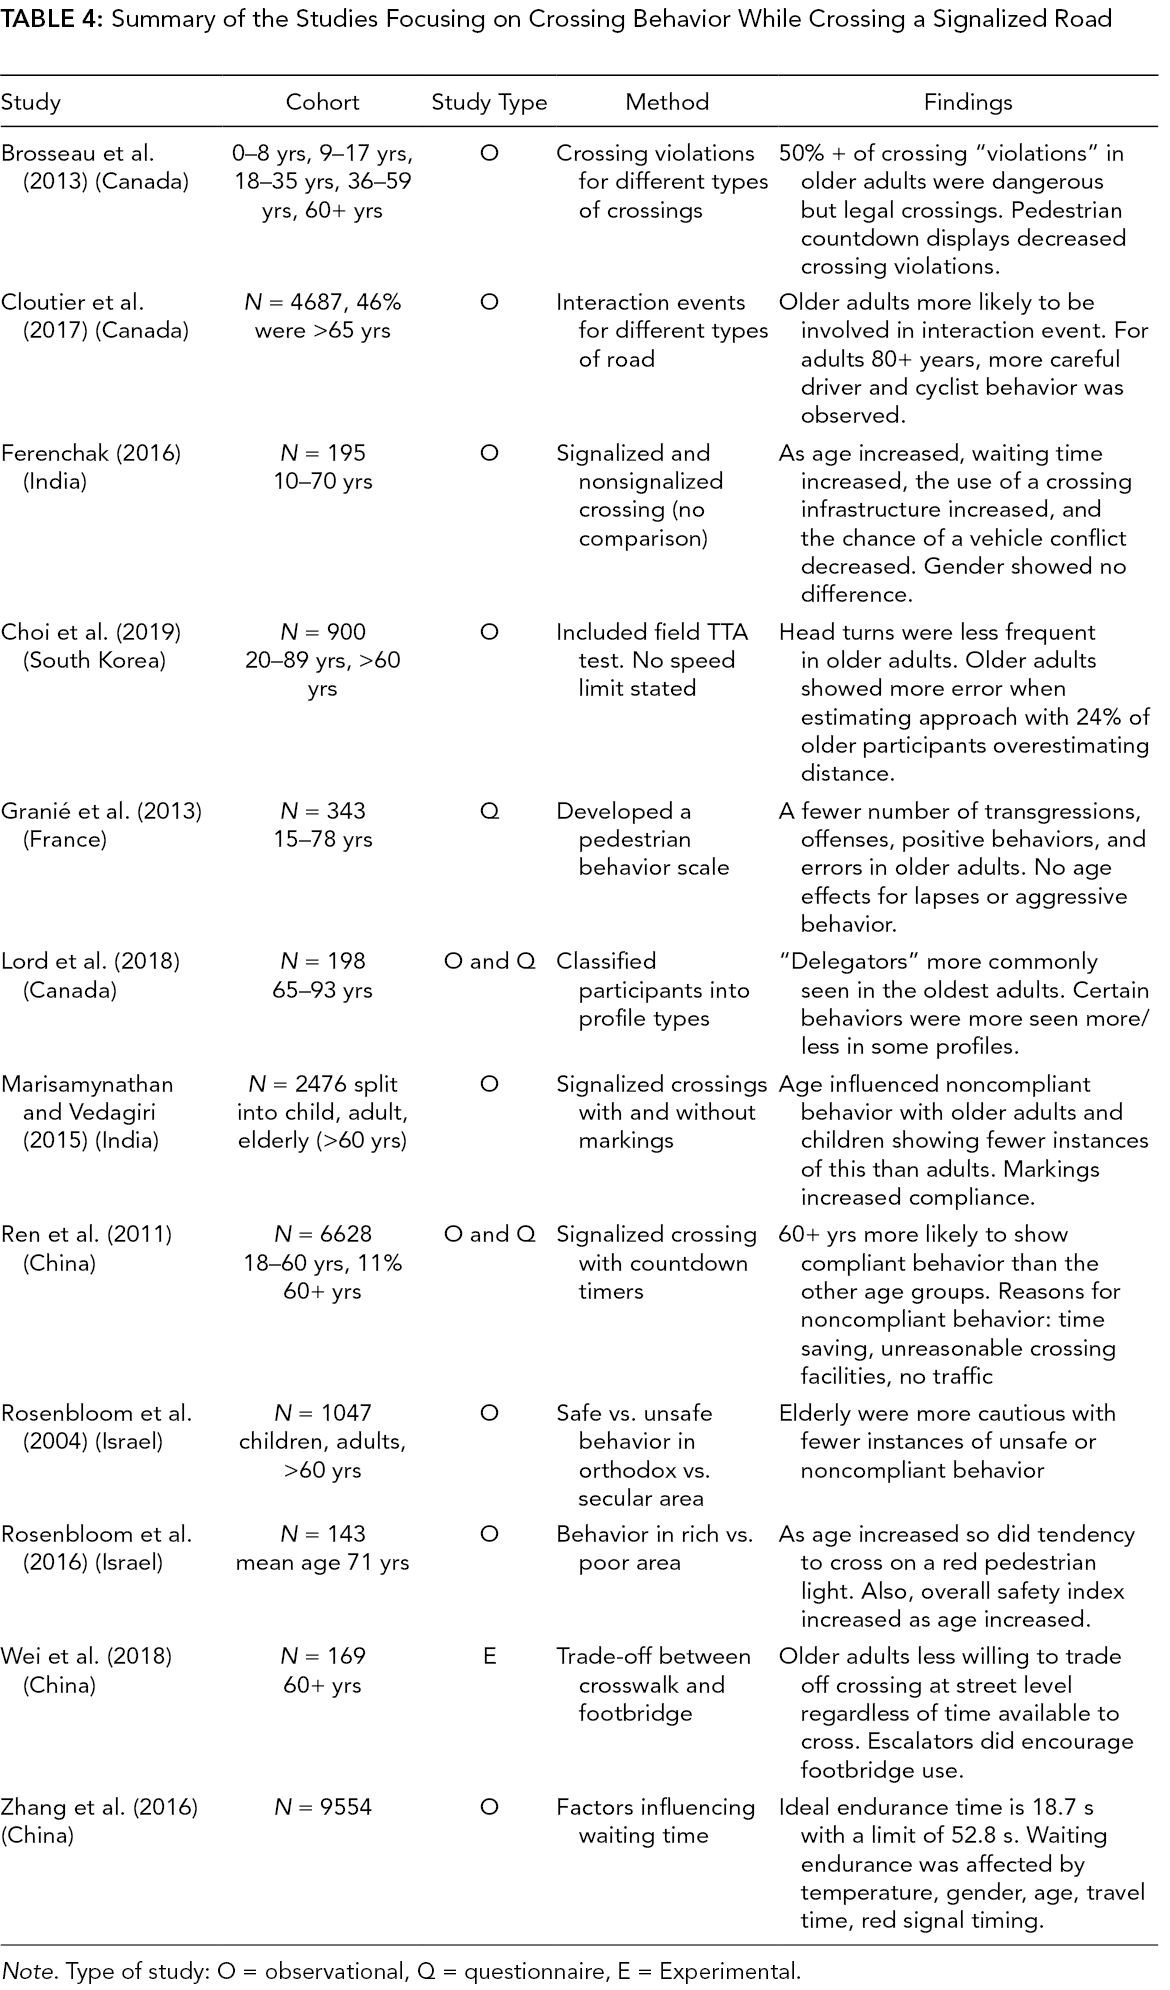
Note. Type of study: O = observational, Q = questionnaire, E = Experimental.
When self-reporting their behavior, a higher adherence to road rules/conventions is seen in older compared to younger adults, for example, exhibiting behaviors such as looking before crossing, waiting at a red light, and so on (Granié et al., 2013). In fact, one study grouped older adults into seven pedestrian profiles based on self-reported behavior (Lord et al., 2018). The oldest group were defined by finding it riskier to cross on nonsignalized roads and thinking it was difficult to cross in time, whereas the younger old group were defined as a “good” pedestrian with perceptions in line with road rules/conventions. Actual compliance rates seem to follow a very similar pattern (Ferenchak, 2016, Ren et al., 2011; Rosenbloom et al., 2004, 2016). However, city-based differences were observed with a greater compliance in older adults versus young found in wealthier (Rosenbloom et al., 2016) and secular cities (Rosenbloom et al., 2004), but not in poorer or religious cities. Coffin and Morrall (1995), although they didn’t consider compliance behavior, did find confusion regarding the “walk,” flashing “don’t walk,” and solid “don’t walk” signals, which are commonly used in North America; this confusion might result in noncompliance behavior.
Compliance to pedestrian signals has also been considered in terms of willingness to wait, with older adults seemingly less prepared than younger adults to wait for a green pedestrian light (Zhang et al., 2016). This latter study seemingly contradicts those mentioned previously, which found a higher compliance among older adults; however, the key point seems to be the length of the pedestrian red light. Studies that found that older adults were more prepared to wait (Ren et al., 2011) typically looked at signalized crossings with relatively short periods between pedestrian green lights (<80 s). In comparison, Zhang et al. (2016) looked at crossings with long wait times (76–185 s). In fact, although Ferenchak (2016) indicated that older adults were more willing to wait, the maximum wait time for an adult in their 70s was about 60 s. When asked why they didn’t wait, participants cited “time saving,” “unreasonable crossing facilities,” and “no traffic” (Ren et al., 2011)
Road markings on signalized crossings improved compliance behavior for all aged participants (Dommes, Vedagiri, et al., 2015). Furthermore, in older adults, most crossing violations were seen on crossings with pedestrian islands as compared to crossing without pedestrian islands; this was regardless of whether a pedestrian countdown device was present (Trpković et al., 2017). Brosseau et al. (2013) found that of the crossing violations in older adults over 50% were dangerous but legal crossings (the pedestrian starts to walk on the green pedestrian light, but does not make it across before the light changes). Furthermore, the presence of a pedestrian countdown display reduced the number of violations for the group as a whole; however, whether this is true of the older adult group alone is not clear. Similarly, a study that considered “interactions” (when the pedestrian’s path and the driver’s path crossed when the pedestrian was still on the street) found that these were highest in the 65–79 year olds with almost half of this group experiencing an interaction with a vehicle or bicycle, despite higher compliance among this group compared to the younger groups. Environmental factors that decreased the probability of having an interaction were the presence of a one-way street, crossings with a different surface material, and the presence of a curb extension (Cloutier et al., 2017).
Wei et al. (2018) showed participants a sequence of videos and asked them to choose whether they would use a crosswalk or a crossing bridge (Wei et al., 2018). The crosswalk included a pedestrian countdown device and the amount of time remaining was manipulated along with the accessibility of the crossing bridge. Results demonstrated that the presence of bi-directional escalators increased the likelihood of an older adult using the footbridge if the remaining time on the countdown was low. However, this study also identified a group of older adults who always opted to use the crosswalk regardless of time remaining or accessibility of the bridge. Although this study limited participant response (they were not able to opt to wait), it does demonstrate that older adults may opt for an unsafe crossing situation if the alternative is less accessible. Interestingly, one study included a breakdown of participants choosing to cross the road (without a crosswalk) versus using an overpass; when the speed limit of the road was 50 km/hr, only 16% of pedestrians (young and old) choose to use an overpass. However, when the speed limit was 70 km/hr, 84% of pedestrians used the overpass (Alver & Onelcin, 2018). Therefore, it is possible that the presence of the signalized crosswalk in the Wei et al. (2018) study made the overpass less appealing due to an apparently “safe” method of crossing.
No Designated Crossing Place
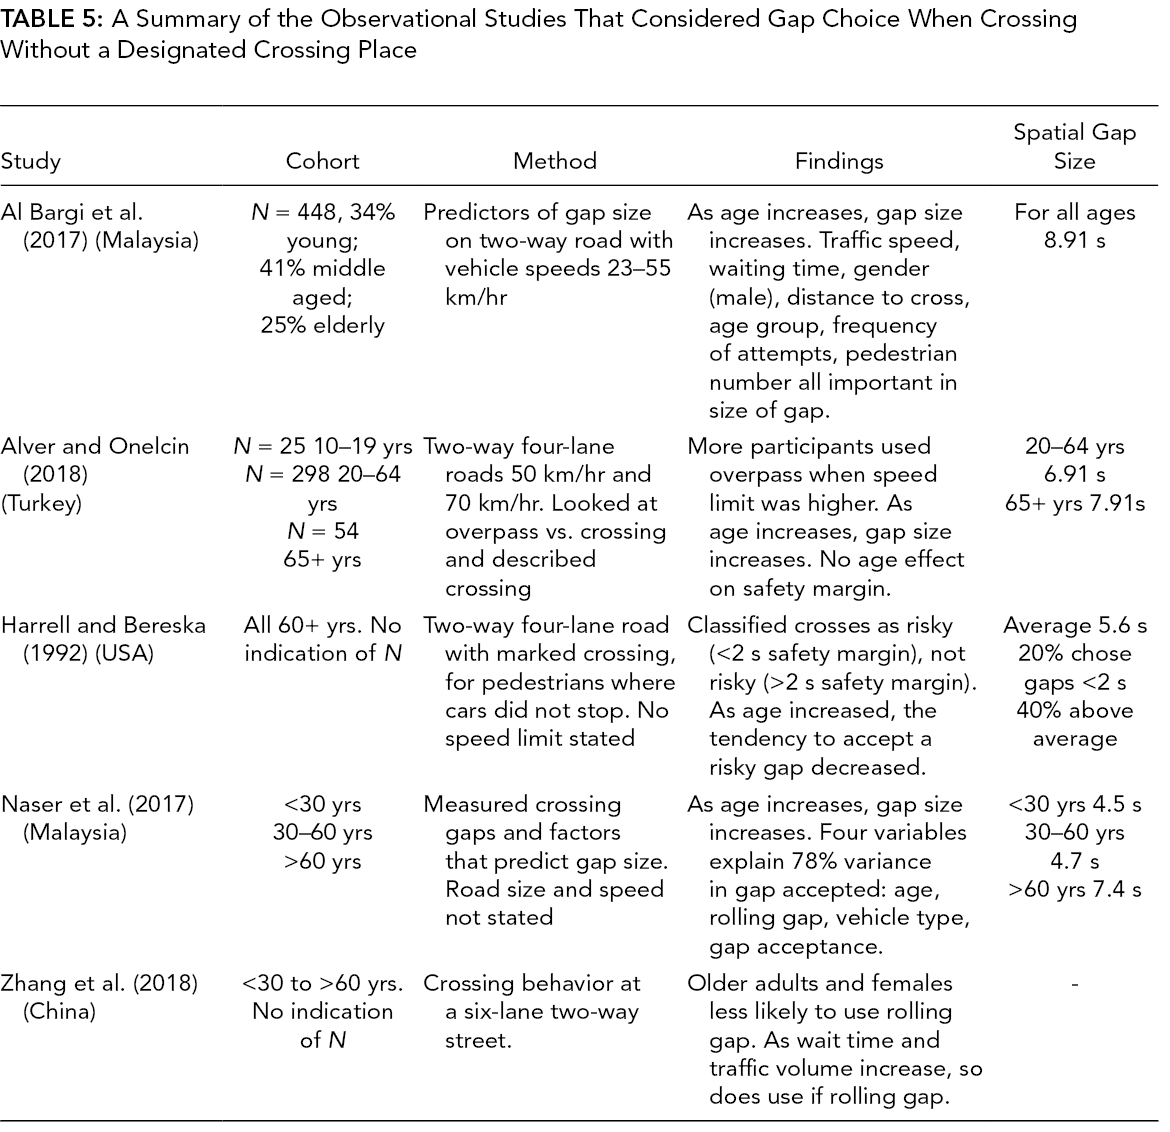
The vast majority of the literature focuses on road crossing decision-making and behavior when there is no designated crossing place; these papers are summarized in Table 5 (observational studies) and Table 6 (simulated studies).
A Summary of the Observational Studies That Considered Gap Choice When Crossing Without a Designated Crossing Place
a Summary of the Simulated Studies That Considered Gap Choice When Crossing Without a Designated Crossing Place
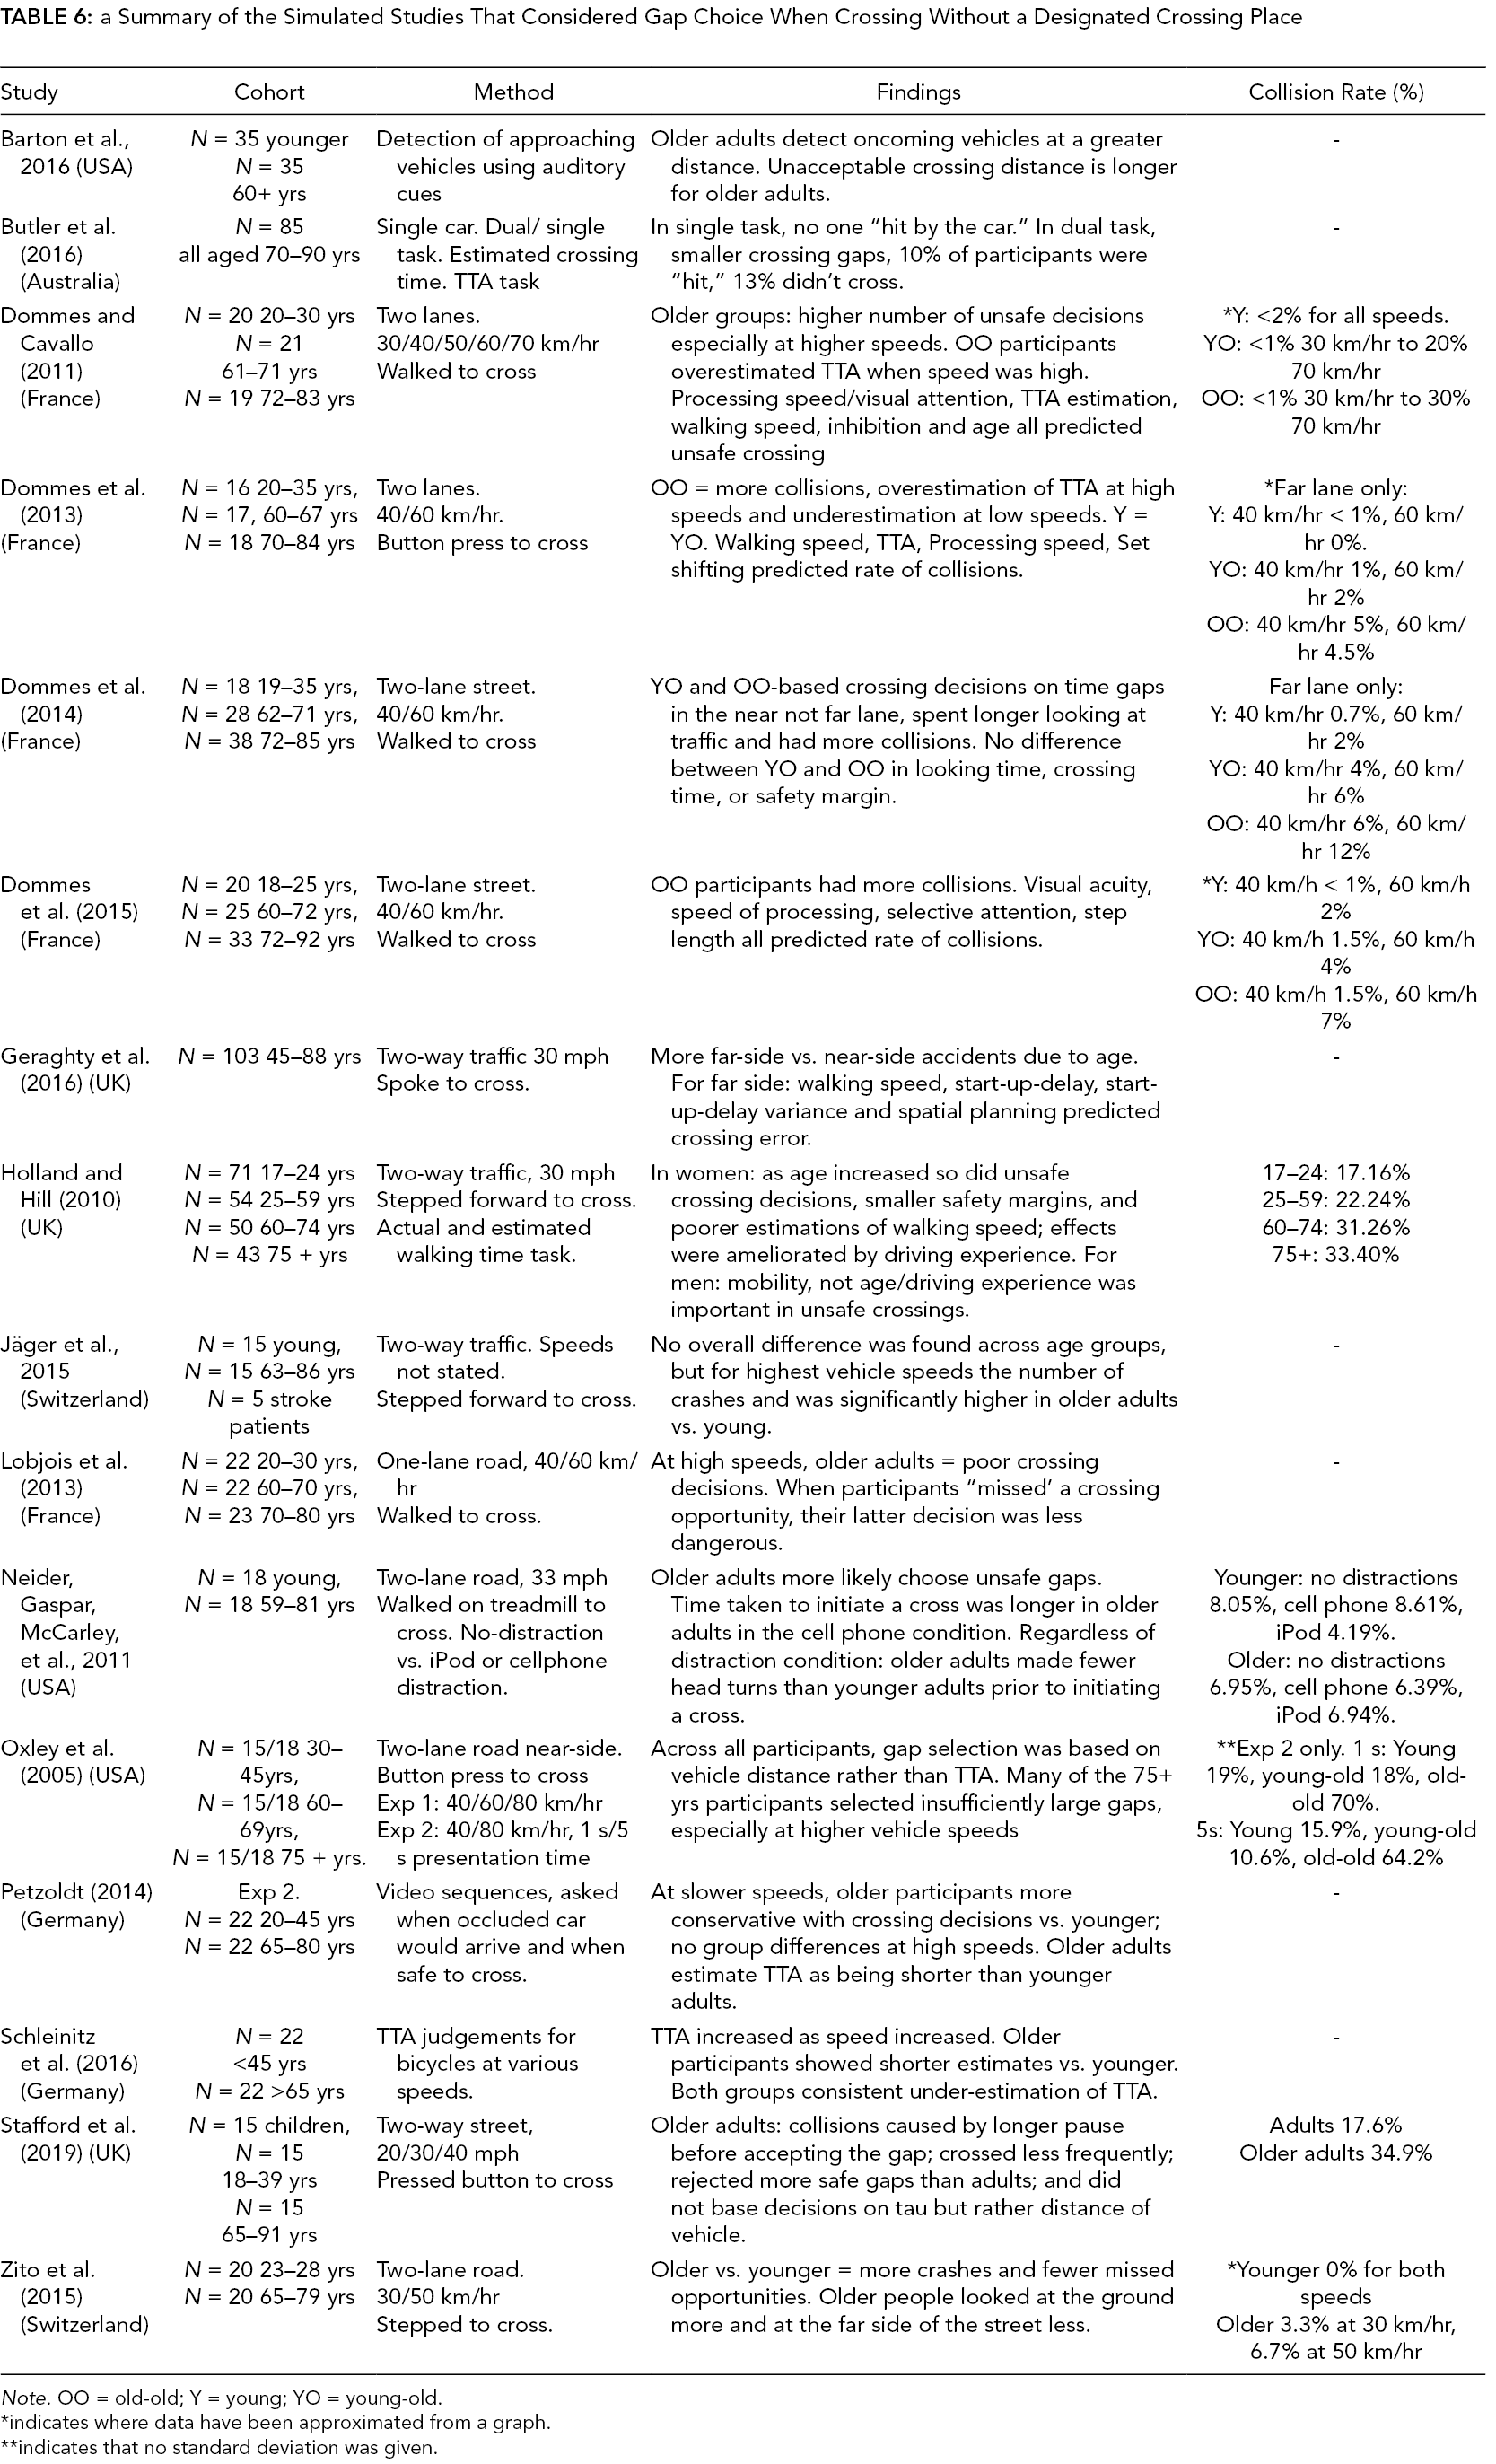
Note. OO = old-old; Y = young; YO = young-old.
*indicates where data have been approximated from a graph.
**indicates that no standard deviation was given.
Observational studies
If we first consider the six observational studies, one of these studies provided clear evidence that when crossing two-way roads older adults leave dangerously small safety margins (Oxley et al., 1997); furthermore, many of the older adults crossed the near-side road without consideration to the far-side road. Oxley et al. (1997) went on to consider crossing a one-way road and observed no differences in safety margins across the younger and older group. In contrast, four other studies focusing on two-way traffic, on the face of it suggest older adults make safer crossing decisions (Al Bargi et al., 2017; Alver & Onelcin, 2018; Harrell & Bereska, 1992; Naser et al., 2017). However, these studies report spatial gap size and not safety margin; given that older adults walk slower than younger adults, a long spatial gap does not necessarily indicate a greater safety margin. This is demonstrated in Oxley et al. (1997), who found longer gap sizes in older adults compared to young, but then shorter safety margins in older adults compared to young. Therefore, studies that demonstrate longer gap size in older adults may not be showing safer crossing decisions. Of the other two studies that showed longer safety margins in older adults, one looked at pedestrians crossing on a marked crossing; but without signals, pedestrians might behave very differently on a marked crossing than when simply crossing the road. The second study, which showed longer safety margins in older adults, observed roads with high traffic speeds (circa 70 km/hr) compared to the study that found unsafe crossing decisions (Oxley et al., 1997, circa 22–27 km/hr); in fact, in a second study, Oxley et al. (1997) found that one-way traffic increased the safety of older adults, but in addition to the second study only looking at traffic moving in one direction, the speed of traffic was higher when older adults were displaying safer crossing decisions (circa 45 km/h). This link between safety margin/gap size and traffic speed is supported by Al Bargi et al. (2017).
These studies suggest that there are, in some cases, differences in the road-crossing behaviors of older adults where there is no signalized crossing. However, the factors that influence gap choice, over and above age, have been considered by three of these observational studies. Al Bargi et al. (2017) found that higher vehicle speed, lower waiting time, being a male, wider crossing distance, older age group, lower frequency of attempts, and higher number of pedestrians were all factors that increase safety. Naser et al. (2017) found as age increased and vehicle size decreased so did the size of the accepted temporal gap. Furthermore, the presence of a traffic signal, a bicycle path, a one-way road, or different crossing material all made it less likely that an interaction would occur. A final study looked at factors that predicted crossing strategy when crossing a six-lane, two-way road (Zhang et al., 2018). Crossing was categorized into single stage crossing (wait for a gap large enough to cross all six lanes), two-stage crossing (wait for a gap large enough to cross one direction of traffic, three lanes), or rolling gap crossing (cross each lane at a time). Age influenced strategy choice with older adults less inclined to adopt a rolling gap strategy. However, as waiting time and traffic volume increased, individuals were more likely to adopt a rolling gap strategy. This study suggests safer, but more frustrating crossing behavior in older adults, who tended more toward waiting for a gap to cross all of the lanes rather than trying to cross around cars. Furthermore, as the use of rolling behavior declined, gap size increased.
Simulated studies
The simulated studies all generally demonstrate a higher proportion of unsafe crossings or smaller safety margins in older versus younger adults (Butler et al., 2016; Dommes & Cavallo, 2011; Dommes et al., 2014, 2015; Geraghty et al., 2016; Holland & Hill, 2007; Lobjois et al., 2013; Neider et al., 2011; Oxley et al., 2005; Petzoldt, 2014; Stafford et al., 2019; Zito et al., 2015). From these studies, it is apparent that the elevated risk is more common for vehicle speeds circa 60 km/hr (Dommes et al., 2013, 2015; Langlois et al., 1997) for two-way traffic, cwith the far lane not being attended to (Dommes et al., 2014, 2013, 2015; Oxley et al., 1997), when carrying out an additional task (Butler et al., 2016; Neider et al., 2011) and for older-old participants (Butler et al., 2016; Dommes et al., 2013).
The section above seemingly shows that the traffic gaps chosen change as we age; the next consideration is why this might be. Two studies included a measure of eye gaze/head turns and found that older adults spent more time looking at the ground and less time looking to the other side of the road (Zito et al., 2015), and they had a tendency to focus on near and not far lane traffic (Dommes et al., 2014). Holland and Hill (2010) found that walking time, start-up-delay, last look to the left, last look to the right, and percentage of safe crossings where the pedestrian looked both ways were significant factors in the prediction of safe crossing.
An important aspect of road crossing is the ability to make accurate time to arrival (TTA) estimates (Butler et al., 2016; Choi et al., 2019; Dommes & Cavallo, 2011; Dommes et al., 2013; Petzoldt, 2014; Schleinitz et al., 2016). Butler et al. (2016), Schleinitz et al. (2016), and Petzoldt (2014) found that older participants underestimated TTA to a greater extent than younger adults. In contrast, Dommes and Cavallo (2011) and Dommes et al. (2013) found that their oldest group of participants overestimated the available time when the vehicle was approaching at high speeds (70 km/hr) more often than the young participants. An important difference to note here is that the speed used in the Dommes and Cavallo (2011) and Dommes et al. (2013) studies was far higher than the speeds used in the other studies. In fact, Dommes et al. (2013) also report that at lower speeds, their oldest adult underestimated TTA, in line with Butler et al. (2016), Schleinitz et al. (2016), and Petzoldt (2014). In fact, many of these studies also demonstrated the importance of TTA estimates alongside other factors such as walking speed, processing speed, and visual attention in safe gap choices (Butler et al., 2016; Dommes et al., 2014, 2014, 2015). In many cases, these factors explained gap choice far better than age. Similarly, Geraghty et al. (2016) found walking speed, variance in start-up delay, and cognitive processing speed predicted near-side accidents while walking speed, start-up delay, variance in start-up delay, and spatial planning were important in predicting far-side accidents.
Summary
In terms of factors that are important in determining gap choice when there is no designated crossing place, traffic speed seems to be highly important with speeds at 60 km/hr or above particularly problematic for older adults in the lab-based studies, with a high proportion of far-side crashes noted. This seems to counter the findings from the observational studies, which suggested that safety margin increased as traffic speed increased; however, the speeds from those observational studies are lower than 60 km/hr and so speed may act as a U-shaped function. Equally, in the observational studies, pedestrians would have been aware of the speed limit of the road and so may have tempered their crossing behavior to that; in the simulation studies, pedestrians had to rely on their perceptual judgment of approaching cars. Given that older adults are less sensitive to vehicle speed information, this may have influenced their gap choice. Further important variables include processing speed, selective attention, walking speed, start-up-delay, vehicle size, and group size. The first four of these, in some instances, replace the variance explained by age. However, on very big roads, older adults were less inclined to cross using a “rolling gap” strategy; however, this did depend on how long they had to wait for a large enough gap to cross without using this strategy. One important consideration when looking at the findings of simulation studies is how much they truly represent what a pedestrian would do in the real world. They often give participants no alternative choices such as walking to a signalized crossing; so although older adults may seemingly struggle to safely cross roads where traffic is traveling at or above 60 km/hr, this may be an activity they actively avoid in the real world.
Perception of Risk and Intention to Cross
The five papers included in this section are summarized in Table 7.
A Summary of the Papers Considering Perception of Risk and Attitude to Crossing
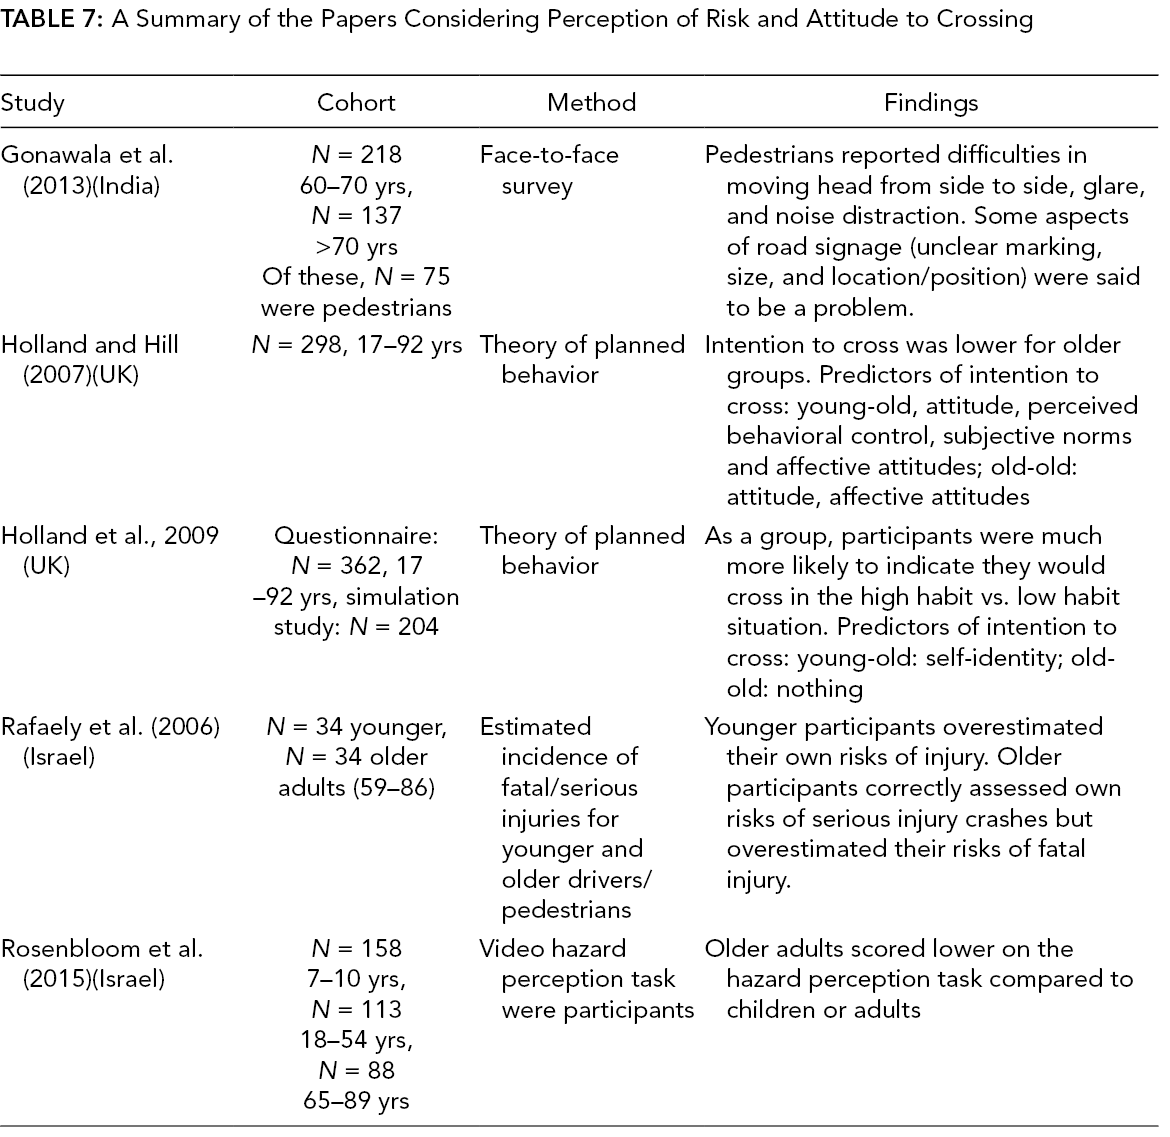
A single paper considered whether older and younger adults can accurately estimate the incidence of serious and fatal injuries for both their age group and other age groups (Rafaely et al., 2006). In terms of accuracy of estimates, the older participants correctly assessed their own risks of severe injuries but they overestimated their risk of fatal injuries in pedestrian crashes. At a more task-based level, when looking at the ability to detect hazards older adults were consistently poorer on a video-based hazard perception task compared to younger adults and children (Rosenbloom et al., 2015). However, we must be cautious as ability here was measured in terms of response time, which is often slower in older adults. In terms of perceived risks or difficulties, a face-to-face survey with elderly pedestrians, drivers, and cyclists showed that pedestrians self-reported individual constraints to road crossing in terms of being able to move their head from side to side, and for female pedestrians judging gap size (Gonawala et al., 2013). In addition, environmental constraints such as noise distraction, glare, and some aspects of road signage were noted to be a significant problem.
The other two studies brought together perception of risk and behavior using the theory of planned behavior (Holland & Hill, 2007, 2010). Holland and Hill (2007) considered factors that influence intention to cross in a high versus low risk situation, while Holland et al. (2009) considered how self-identity, attitudes, and habit influenced the intention to cross. The intention to cross was generally lower for older age groups compared to younger. In terms of factors predicting the intention to cross, Holland and Hill (2007) found that subjective norms did not account for a significant level of variance in the older two groups (60–74 years and 75+ years), but it did in the younger two (17–24 years and 25–59 years). Perceived behavior control, the degree to which older adults felt they had control over the degree of risk, was more important for the young-old group (60–74 years) compared to the old-old group (75+ years). While Holland et al. (2009) found that self-identity, age, and gender explained 31% of variance in the intention to cross for 60–74 year-olds, with an increase in age and a shift away from risk taking resulting in a lower intention to cross. In the old-old group (75+ years), none of the factors predicted intention to cross. Holland et al. (2009) went on to consider whether self-identity and intention predicted actual behavior (as measured via a simulated road crossing situation). Only 19% of variance in actual behavior was accounted for, and this was all due to intention predicting behavior and not self-identity.
Gender
Finally, a common variable considered across the papers described above was gender with five out of eight studies including this as a variable, finding a greater proportion of females versus males failed to cross in time or walk faster than 1.2 m/s (Amosun et al., 2007; Asher et al., 2012; Bollard & Fleming, 2013; Donoghue et al., 2016; Webb et al., 2017). However, these studies were all experimental and one could argue they included participants who would not normally have been at the roadside. This is compared to the three studies that found no gender differences (Eggenberger et al., 2017; Trpković et al., 2017; Walker et al., 1987), two of which were observational and the third that required participants to be able to walk 20 m independently.
Gender also seemingly influenced safety margins, with one study showing that age only influences female and not male safety (Holland & Hill, 2010). This study also demonstrated that different factors predicted safe crossing in men and women. Furthermore, we see a greater number of unsafe crossings in females versus males for near-side crossings, but no difference in far-side crossings (Geraghty et al., 2016). Alver and Onelcin (2018) also reported significant interactions, which included age and gender; however, these interactions were not explored nor were the data presented in the paper and hence the exact nature of the gender and age interaction is unclear. Finally, one paper found no gender effects (Butler et al., 2016). This disparity in findings might be an indication that gender differences are only apparent in some situations and not others. Furthermore, it is not clear whether these factors have a bigger impact on older adults’ road crossing compared to their younger counterparts.
Final Conclusions
Overall, this systematic review has looked at evidence explaining the elevated risk of older adults at the roadside. The evidence suggests that age is influenced by multiple individual constraints. We can think of these factors as being threefold: motor control; perception; and cognitive ability; these factors seem to be particularly important when older adults are crossing in nondesignated crossing places. If we consider the task of road crossing when you have to decide when to cross, one first has to focus one’s attention appropriately and determine what is happening (cognitive skills), you then need to determine when an approaching vehicle will reach you (perceptual skills), decide whether you have time to cross, and then act upon that (motor skills). The body of evidence evaluated here has shown that cognitive skills such as processing speed and selective attention are more important than age, and so older adults who have relatively poor cognitive skills could be thought of as more at risk. To some extent, this was reflected in some of the reports from older adults who stated they found “noise distraction” and “distraction from signs” difficult to process. Similarly with the perceptual skills, we have seen that the ability to judge time to arrival is key in safe road crossing decisions and that an accurate estimation of TTA may “protect” older adults at the roadside. Finally, in terms of motor control, it would seem that older adults who can walk faster are, to some extent, protected at the roadside. This does not seem to be because those adults, whose walking speed has deteriorated, have failed to recalibrate to their new walking speed as walking speed estimation was not a predictive factor. It could simply be that a faster walking speed provides people with a greater number of “crossable” gaps in which to cross and so enables someone to cross within a shorter time frame. The importance of motor control, perceptual ability, and cognitive ability may be key in understanding the elevated risk to older adults especially where no designated crossing place exists. With older adults who have a significant decline in these areas placed at a higher risk, what is unclear is whether these older adults understand this elevated risk.
In terms of task constraints, studies exploring gap choices were difficult to compare due to differences in methodology; however, factors such as number of lanes of traffic, volume of traffic, and traffic speed seems to be important in how safe a crossing decision is in older adulthood. Dual tasks also influenced the crossing and walking speed of older adults in terms of how long they stood on the sidewalk before initiating a cross. Finally, in relation to environmental constraints, older adults reported that they found it riskier to cross on nonsignalized roads and thought it was difficult to cross in time. Taken together, this review suggests that all of these factors need to be taken into consideration together in order to determine the safety of an individual as a pedestrian. It appears that different behavior is observed when older adults are asked to cross roads with low speed vehicles compared to high, when asked to execute a cross compared to indicating when they would cross, when asked to cross compared to simply walking. The interaction between the individual constraints, the task constraints and the environmental constraints are, therefore, clearly important in understanding how and why road crossing differs so greatly. Moreover, considering individual, task, and environmental constraints in isolation will never provide a full picture of crossing.
One final important consideration is the difference between the individuals we see crossing the road and the individuals we want crossing the road. We started this review talking about the importance of walking in terms of physical and mental health and that encouraging older adults to become more mobile has many benefits. However, if we currently see the vulnerability of older adults at the roadside, this is only likely to increase if currently immobile individuals start crossing the road. This highlights the importance of those lab-based studies that included older adults who were not necessarily crossing the road every day. Considering the risk factors for that group in terms of motor, cognitive, and perceptual ability is important in order to ensure our roads are accessible and safe for all and not just to those currently using them.
Future Recommendations
The material reviewed here highlights some important considerations when designing infrastructure to support the safety of older adults. Below we detail infrastructure changes that would improve the safety of our roads for older adults.
Signalized crossings
The standard walking speed of 1.2 m/s is not suitable for all older adults at the roadside and is insufficient to encourage community-dwelling older adults to become active. Furthermore, the time an older adult is willing to wait for a green pedestrian light is key in their adherence behavior. There is evidence that some older adults struggle to understand the meaning of the “walk,” “don’t walk flashing,” and “don’t walk solid” signals commonly found in the United States and Canada. This confusion may also extend to the “green”, “flashing green,” and “red” pedestrian signals in other countries.
Unsignalized crossings
Older adults don’t perceive unsignalized crossings as more dangerous than signalized ones and actually walk slower across unsignalized crossings. Therefore, it is vital that unsignalized crossing have clear signage to ensure adherence behavior of drivers.
No designated crossing points
It is not always possible to cross at a designated crossing site, and although older adults are more likely to use a designated crossing point, there is a lack of evidence regarding the distance older adults will walk to find one. Therefore, it is important to consider road safety in general. When crossing in this way, the crossing decisions of older adults were safer when crossing single lane roads with slower moving traffic.
The studies reviewed here also highlighted that factors that put older adults more at risk are predominately related to cognitive, perceptual, and motoric decline. Therefore, crossing the road with awareness of those declines is important and where designated crossing places are not available educational programs could help to raise awareness regarding the risks of crossing.
Key Points
Individual (e.g., attitudes, walking speed, cognitive ability), task (e.g., vehicle size and speed, traffic volume), and environmental constraints (e.g., time of day, weather) are all important in describing how older adults behave at the roadside.
Lengthening the time of the pedestrian green signal and reducing the time of the pedestrian red signal alongside the use of pedestrian countdown displays may increase the safety of older adults at signalized crossings.
Increasing signage and visibility of unsignalized crossings may increase the safety of older adult pedestrians.
Reducing speed limits and providing traffic islands may increase the safety of older adults where no other designated crossing aids are available.