
Abstract
Currently there is no easy way to rate the ease of evacuation from a building in case of fire or a shooter. Multiple tools, based on agent-based models, exist to simulate building evacuation. However, they have not been compared with human perceptual data of how easy people think it would be to evacuate from a building. This research is part of a project to establish an EASE score (Evacuation with Acceptable Simplicity in Emergencies) and validate that metric with human data. In this study, the authors asked participants to evaluate seven 2D building floor plans for ease of evacuation. There is a gap in the research on perceptions of floor plans which motivated this study’s research questions: (a) Do non-expert users agree on the ease of building evacuation? (b) What factors do viewers use to evaluate ease of evacuation?
Introduction
Historically, there have been a number of tragedies due to lack of a safe evacuation process (Galea et al., 2008; Layton & Elhauge, 1982). Since then, fire codes that specify door widths and the number of exits for a building have been established. However, these safety features do not always correlate with the human perception of evacuation ease. This indicates a need for building layouts to have appropriate safety features as well as appropriate displays and communication of evacuation methods. For example, buildings that appear attractive based on symmetrical floor plans may make occupants lost in an emergency scenario, running in circles. Today, multiple tools, based on agent-based models, exist to simulate building evacuation. However, few of these have been compared with human perceptual data of how easily people think it would be to evacuate from a building.
This research is part of a project to establish an Evacuation with Acceptable Simplicity in Emergencies (EASE) score using a software application called BuildingComplexity, which uses an agent-based model (ABM) simulation of evacuation (Perron et al., 2024). In the ABM simulation, agents are placed in a building and tasked with evacuating quickly. The program measures data points such speed of evacuation and number of doors used for exiting. Using the data from the program’s simulation, an EASE score can then be calculated.
In this research project, the authors ran the BuildingComplexity simulation and calculated an EASE score for seven building layouts (Perron et al., 2024). The authors had hoped to validate the EASE scores and simulations by comparing the ABM’s alignment with human data. However, the human data revealed such confusion about ease of evacuation that the authors wanted to document this confusion in the current paper and reinforce that research on how well people can build a 3D cognitive map from a 2D map presented to them is of continued interest, especially as more 3D virtual environments become available in virtual reality games, in Zillow.com for real estate, and in digital twins of manufacturing facilities.
Related Work
Research on the topic of floor plan cognition has previously taken place in architecture, especially in the context of real estate purchases. Ishikawa et al. (2011) discovered that participants asked to categorize 48 floor plans of condominiums formed three overall groups: (a) those that sorted by number of bedrooms, (b) those that sorted by type of access to the bedrooms (e.g., by hallway or living room), and (c) those that sorts by shape of the floor plan. The first two groups seemed to think more about the usage of the space that the third group, but further research would be needed to explore whether or not members of the first two groups were imagining themselves in the 3D spaces.
A more recent study showed four apartment floor plans to participants. Results showed that participants’ judgments of floor plans were affected by their goals and their knowledge or floor plan attributes (Baker & Oppewal, 2023). This paper also summarizes other related studies, noting that architects and lay people had dramatically different layout preferences and that people’s primary factors for layout preferences can change, depending on the overall size of the housing. However, these studies may be difficult to generalize to the context of building evacuation.
A topic closer to building evacuation is the study of You Are Here (YAH) maps, used in shopping malls, larger parks, and a variety of public places. One study showed the potentially surprising result that people developed better cognitive maps when the YAH maps did not have any marked routes on them (Lukas et al., 2014). Another study documented users’ confusion that results from YAH maps being placed in misalignment with the building they’re within (Aubrey et al., 1994). This study offers evidence that people are looking at the 2D map and making an effort to align its cues with the physical 3D cues around them. Overall, previous research suggests that a large number of factors contribute to people’s successful interpretation of maps.
Given the uncertainty in this research area, the current study can contribute additional information about participants’ perceptions of floor plans. Participants were asked to rate the ease of evacuation of seven building floor plans. The specific research questions investigated included: (a) Do non-expert users agree on the ease of building evacuation? (b) What factors do viewers use to evaluate ease of evacuation? The first question was an attempt to validate the metric of the EASE score. The second question was to assess viewers’ priorities in floor plan assessment. Based on the literature, the authors predicted that participants would break into groups, much like in the Ishikawa et al. study, and that some would prioritize shape-based factors while others might prioritize factors based on usage of the building.
Methods
The study used an anonymous Qualtrics survey as the main source of data collection. The survey was conducted in Fall 2023. The survey had a series of questions asking about evacuation of buildings. The 71 participants were students and staff in Architecture; Civil, Construction, and Environmental engineering; and Interior Design at a large U.S. university.
The survey featured seven different floor plans. The buildings were modeled using BuildingComplexity (https://github.com/Noah-Hall/BuildingComplexity), a open-source Unity software application (Perron et al., 2024). BuildingComplexity allows users to use modular building block components such as floors, walls, doors, and pre-built rooms to construct a floor plan. This software allows users to quickly create floor plans to evaluate and allows for simplicity when the floor plan may need revisions. Figure 1 shows the floor plans that were created for the survey. All of the floor plans shown were created from existing building layouts and dimensions. Six of the seven floor plans are from the local university campus. Exits were marked with red Es.
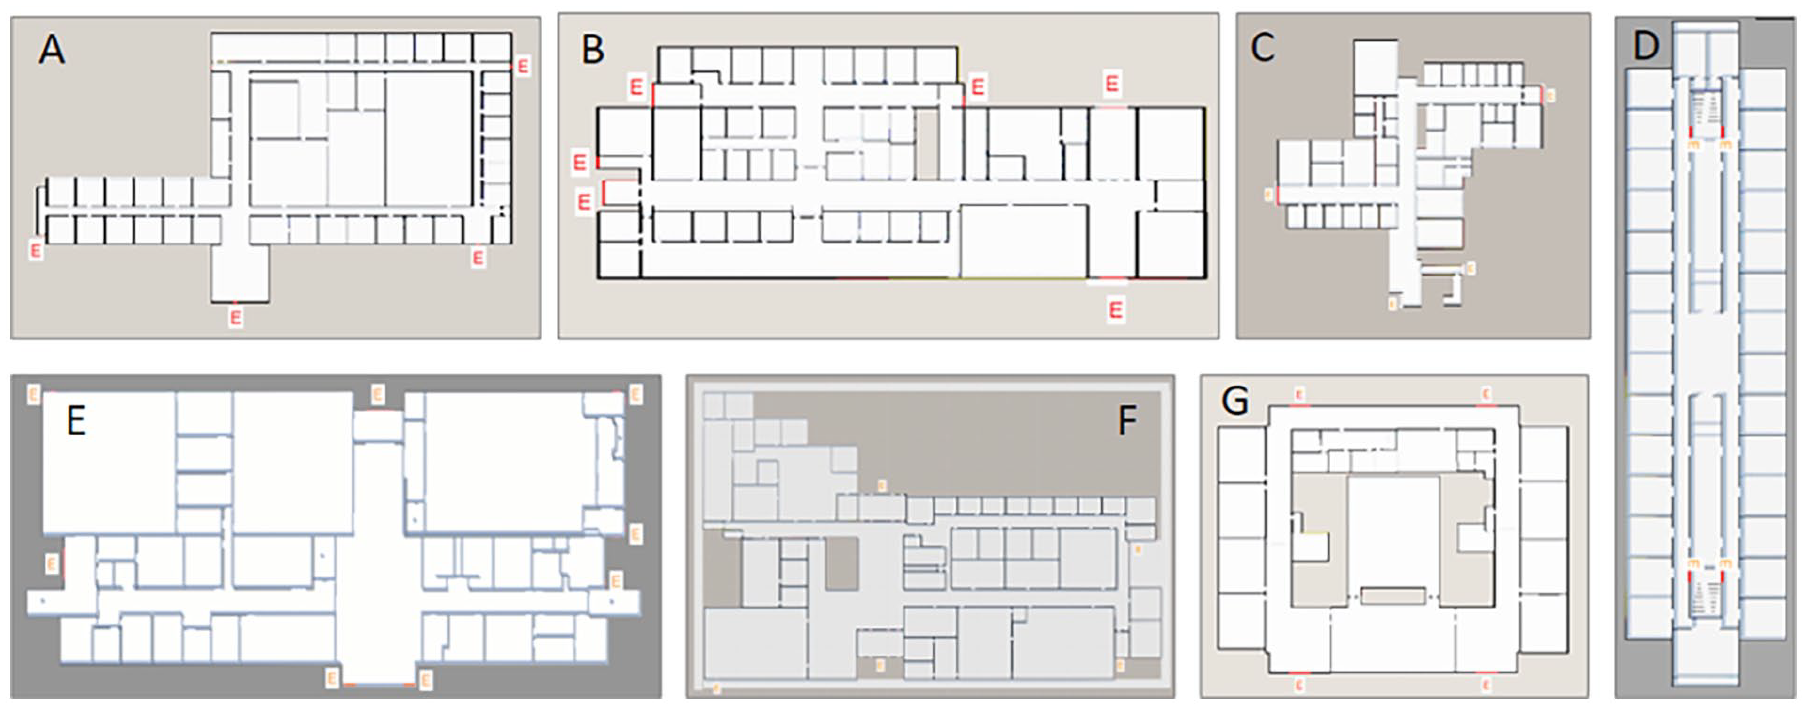
The seven floor plans. A red E indicates an exit.
The survey began by asking about gender, age, if they worked or were a student in a field related to design or construction, major, and years of experience (see Table 1). Next, participants evaluated seven floor plans from local buildings and rated them from 0 to 10 (0 was extremely difficult to evacuate and 10 was extremely easy to evacuate). In this case, a higher score was better. After each rating, the survey asked what features of the building impacted their choice the most. This question was free response with a text box. After evaluating the seven building floor plans, respondents were asked several questions to adjust for familiarity. Participants were asked if they recognized any of the floor plans, if so, to check the ones they did. Next, respondents were asked to share how much time they had spent in the six buildings from the university campus to adjust for familiarity.
Survey Questions.

Results
Ratings
Participants’ ratings (n = 71) were compared across buildings to explore whether there was consensus for validating the EASE score. Ratings were also compared across differences in gender, years of experience, and discipline. Common themes among the answers to features of the building were collected and noted.
The ratings of evacuatability of buildings showed a very large spread with little consensus on how easy a building might be to evacuate (see Figure 2). All but two buildings had scores ranging from 0 to 10. For six out of seven buildings the average rating was close to 6/10, which is close to the midpoint of 5. Previous research has noted that midpoints of Likert scales can be differently interpreted by participants, even with labeling, ranging from “neutral” to “uncertain” to “don’t care” to “neither” (Nadler et al., 2015). Thus it is somewhat uncertain what participants were thinking when they chose values near the midpoint.
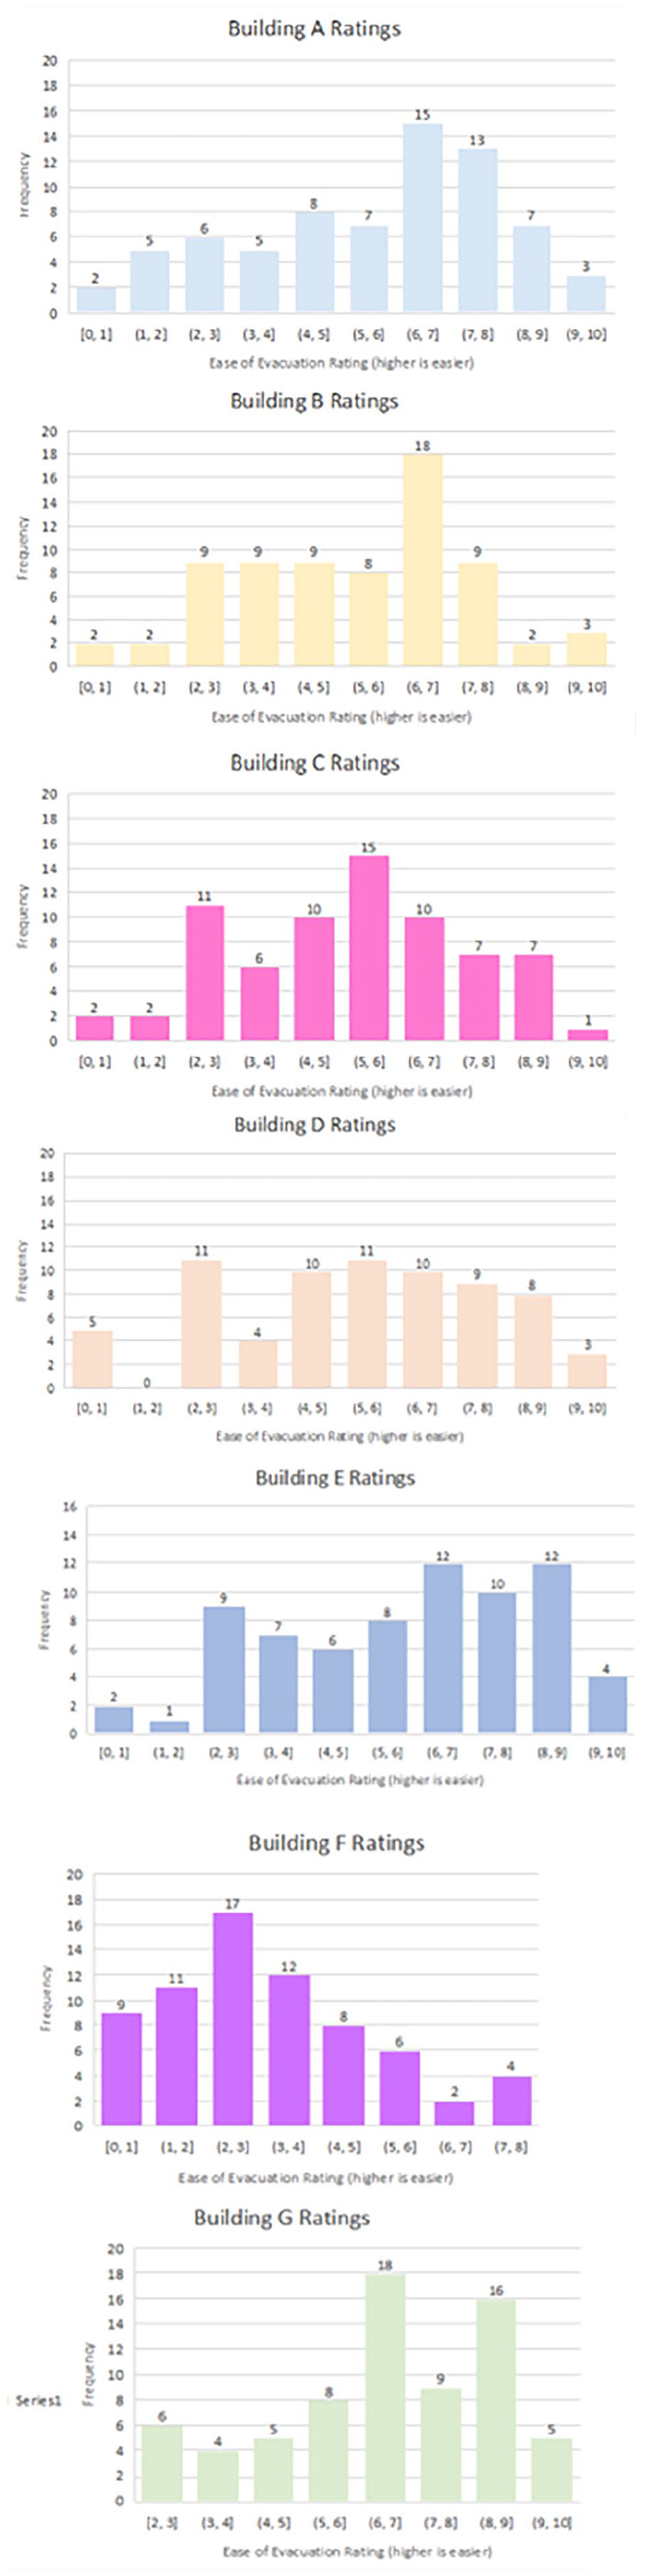
Histograms of ease of evacuation ratings for each building.
Building F stood out with an average rating of 3.6/10; its plan was characterized by a non-symmetric layout. Building F can be noted for missing higher scores (rated more difficult overall), while Building G was missing lower scores and thus rated easier overall, with average 7/10. Histograms of ratings for each building had high variance and were not normally distributed per Shapiro-Wilk tests. Despite the lack of normality, a one-way repeated measures ANOVA was used because it is somewhat robust to deviations in normality, especially if distributions are similarly skewed (Laerd Statistics, 2015). The seven sets of building ratings were statistically significantly different, F(6,420) = 20.957, p < .001. Post hoc tests with Bonferroni adjustment were carried out to create pairwise comparisons between buildings (see Table 2).
P-values of Pairwise Comparisons of Building Rating Distributions.

Because of the high variance, five buildings’ ratings were not statistically significantly different from each other. Building G was rated significantly easier to evacuate than four other buildings. Participants noted that the floor plan was more symmetrical, resulting in them rating it easier to evacuate. Building F, with an average rating of 3.6/10, was rated statistically significantly more difficult to evacuate than all other buildings. Participants cited the non-symmetrical layout.
Other statistical analyses comparing rating differences by gender, years of experience, and discipline (construction engineering vs. architecture) showed no significant differences.
Rationales for Ratings
Results from a theme analysis of respondents’ rationales for their ratings pointed to several common themes. The number of exits was the most common response (20.7%), commenting either that the floor plan had a good number of exits or not enough exits. The floor plans in the survey contained marked exits. Another common theme referenced was the shape or symmetry of the layout, either symmetrical/simple or non-symmetric/chaotic (12.9% of responses). This theme was the most common response for Building G (its ease of evacuation was related to its symmetry). The last common theme from the findings was width of hallways, either too narrow or good (7.6%). This response was found in 6/7 buildings. Hallway width was a feature that caught participants’ attention. Typically, this was mentioned with the thought of crowding and congestion.
Discussion
While predictions had expected participants to cluster into groups, clean groupings were not found. However, some participants did emphasize shape and form (symmetry) of the floor plan, while others emphasize usage metrics such as number of exits and hallway width, reinforcing Ishikawa et al. (2011). Overall, there was a lack of consistency in scoring among users. In this study, participants’ scores ranged from 0 to 10 with no consistent responses, indicating that people had a large variation of thoughts on what made a building easy/difficult to evacuate. Participants also justified their ratings using different approaches. Some looked at the number of exits, others at building symmetry and width of hallways. Building symmetry is interesting, because this attribute is typically only noticeable when looking at a building floor plan from above. While it could be beneficial to people evacuating, the number of exits and space between exits also appears important to respondents. Overall, there wasn’t a consistent perception from respondents. This resulted in no consistent metrics from the data, and no way to align EASE scores with the human metrics.
While floor plans have sometimes been cited as “boundary objects” that allow architects, construction engineers, and homeowners to communicate despite their different backgrounds (Carlile, 2002), these results indicate that people do not conceptualize floor plans consistently. Future work could explore whether 3D visualizations of the buildings at first-person viewpoint (walking through a virtual model) would change individuals’ perception of evacuatability.
Footnotes
Declaration of Conflicting Interests
The author(s) declared no potential conflicts of interest with respect to the research, authorship, and/or publication of this article.
Funding
The author(s) received no financial support for the research, authorship, and/or publication of this article.