
Abstract
Pursuing clear and safe roadways during the winter weather season is a key priority; however, the process of plowing roads has inherent risks given icy road conditions, risky driver behavior, high speed differentials, and low visibility. This work examined differences in driver interpretation and response to existing and proposed snowplow rear-end lighting configurations. Ninety-seven participants completed an online survey where they rated the likelihood of signal interpretations and driving maneuvers they would take as an approaching driver. An orthogonal factor analysis was conducted resulting in five interpretation-response factors across signal states. The proposed designs were more accurately perceived as running when presenting a running signal and braking when presenting a braking signal. Existing configurations were more likely to be incorrectly interpreted as turning when the signal was not indicating turning. Findings suggest that the existing rear-end snowplow lighting configurations may be ambiguous and the proposed designs reduce this ambiguity.
Snowplow Collisions
Pursuing clear and safe roadways during the winter weather season is a key priority; however, the required process of plowing roads has inherent risks given icy road conditions and increasing instances of risky driver behavior (e.g., driving too fast for conditions). Because snow removal takes place at reduced speeds (15–30 mph) in travel lanes and often during low visibility conditions, there is a heightened risk of rear-end collisions by rapidly approaching vehicles (Kamjoo et al., 2023; Verma et al., 2019).
Typical automotive crashes are costly, ranging anywhere from $5,700 up to $155,000 depending on crash severity and injuries (MnDPS, 2023). Crashes involving snowplows have a greater likelihood of high severity crash due to the aforementioned speed differentials and dangerous road conditions. Furthermore, snowplows cost well over $260,000 (MnDOT, 2013). The expense of snowplows and the greater risk of high severity crashes when they occur highlights the financial burden a single snowplow involved incident may have.
Not only are such crashes involving snowplows financially expensive, but they can cause immense strain on system-wide winter maintenance operations as it can take up to 3 years to replace a damaged snowplow. It is estimated that MnDOT cycles out approximately 60 snowplows of the 800 in service within the fleet every year, which means that unexpected truck losses may not be immediately replaced resulting in additional strain on the existing fleet. Due to the combined cost of snowplow involved crashes, both financially and organizationally, effort has been directed toward uncovering methods for reducing snowplow related crash risk and severity (CTC & Associates, 2018; Dur, 2007; McCullouch et al., 2008).
Effective Lighting Configuration Design
Warning lights on maintenance vehicles must attract the attention of oncoming drivers, convey information to them, and not confuse them. However, designing a lighting system to optimally meet any one of those requirements (e.g., attracting attention) could lead to a trade-off on the other requirements. For instance, increasing flash speeds, number of color combinations, and number of warning lights increases the perceived urgency of a warning system, while also increasing distraction, discomfort, and in the case of greater flash speeds, an increased inability to perceive signal indications (National Academies of Sciences, Engineering, and Medicine, 2024). It is clear that careful consideration must be taken in examining the intended and unintended consequences of any design decision in lighting configurations.
General recommendations for warning lights on winter maintenance vehicles include not placing warning lights at a following drivers’ eye level, the use of multiple colors that contrast against snow, and slower flash patterns that are less distracting and make it easier to perceive the maintenance vehicle’s speed (National Academies of Sciences, Engineering, and Medicine, 2024). An example of a tested lighting configuration design was two vertical light bars, each placed on the side of the vehicle, with an array of four steady amber lights on each bar (Bullough et al., 2001). This design was intended to help drivers perceive the spatial extent of vehicle and signal system, leading to better judgements of speed and distance. This was found to have better and faster timing of collision detection relative to a traditional flashing light design. Later work found that pairs of beacons perform better for closing distance detection relative to a single beacon (Bullough and Skinner, 2011).
The design of alerting or alarm lighting systems constitutes a discrete warning system as opposed to a continuous warning system. Discrete collision warnings are particularly helpful in the context of reduced optic flow information (DeLucia & Tharanathan, 2009), and winter environments may significantly disrupt optic flow information (Hecht et al., 2021). The use of red brake lights represents a typical example of a discrete warning system on vehicles.
If flashing lights are used in a lighting design for discrete warnings, an increase in flash rate (e.g., 1 to 4 Hz) is both perceivable and understood by drivers (Skinner et al., 2021). It is worth noting that the fast rate tested by Skinner et al. (2021) exceeds the slow (1.5 Hz) and the slow-fast-slow (1.5 to 2.5 Hz) alternating patterns recommended by the National Academies of Sciences, Engineering, and Medicine (2024). A field test of a two-level warning light system found that the system reduced the frequency of encroachment on the winter maintenance vehicle beyond safety thresholds and improved response times (Verma et al., 2019). Finally, the use of alternative colors, such as green, has been found to provide the best tradeoff between visibility and discomfort or glare in a lighting-based collision avoidance system (Fakhrmoosavi et al., 2021).
Objectives
The goal of this work was to determine whether certain snowplow rear-lighting display configurations improve driver interpretation and responses from a car-following perspective. The original designs tested were based on common display and lighting configurations employed on MnDOT snowplows with and without an optional lightbar emitting cascading light. The two proposed configurations were designed to improve signal clarity and reduce the visual noise of the original designs, with the second proposed design representing an elevated alerting state (i.e., Level 2) variant of the first proposed design (i.e., Level 1). First, we sought to determine whether there were differences in driver interpretation and responses to different snowplow lighting display design types and presented signals (e.g., turning, braking, running) and whether the proposed designs may improve driver interpretation and response. Next, we sought to specify the correct driver-interpretation responses for each signal type and determine whether driver ratings corresponded to those specifications for different rear-end lighting designs.
Methods
Incident Data Coding and Analysis
Incident data was collected from narratives in the e-SAFE (Electronic Accountability Safety for Everyone), a Minnesota internal incident reporting system. Incident reports involving a motor-vehicle incident between 1/1/2019 and 2/22/2023 were reviewed and coded for rear-end crashes involving snowplows. Trained coders reviewed the narratives and coded information related to what the plow was doing at the time of the crash, what the other vehicle was doing prior to the crash, time of day, roadway environment, roadway conditions, speed, the number of vehicles involved, and whether the plow’s wing was hit.
An analysis of 124 incident reports from the e-SAFE system between January 2019 to February 2023 showed an increase in rear-end collisions involving snowplows on Minnesota roadways. The majority of the incidents occurred during low visibility conditions which involved snow or blowing sand/dust/snow (n = 94% or 75.8%). Additionally, most incidents occurred while the snowplow was going straight or performing normal plowing operations (n = 75% or 60.5%), suggesting a frequent speed disparity between the snowplow and the other vehicle. Moreover, the reported crashes occurred even when the snowplow’s rear-end lighting displays were fully activated. Based on the findings from the preliminary analysis, several contributing factors of rear-end crashes were inferred, including detection issues (i.e., the driver was unaware of the snowplow), recognition issues (i.e., the driver noticed the lights but was unable to determine a larger vehicle was in front of them), and collision detection issues (i.e., the driver saw lights but did not realize they were approaching the vehicle at a dangerous approach rate).
Snowplow Lighting Configuration Designs
The tested rear-end lighting designs include a design present on some winter maintenance vehicles on Minnesota roadways as of 2023 to 2024 (see Figure 1). This design includes six red brake lights, five red running lights, six flashing amber lights, and two blue emergency lights on the right side.
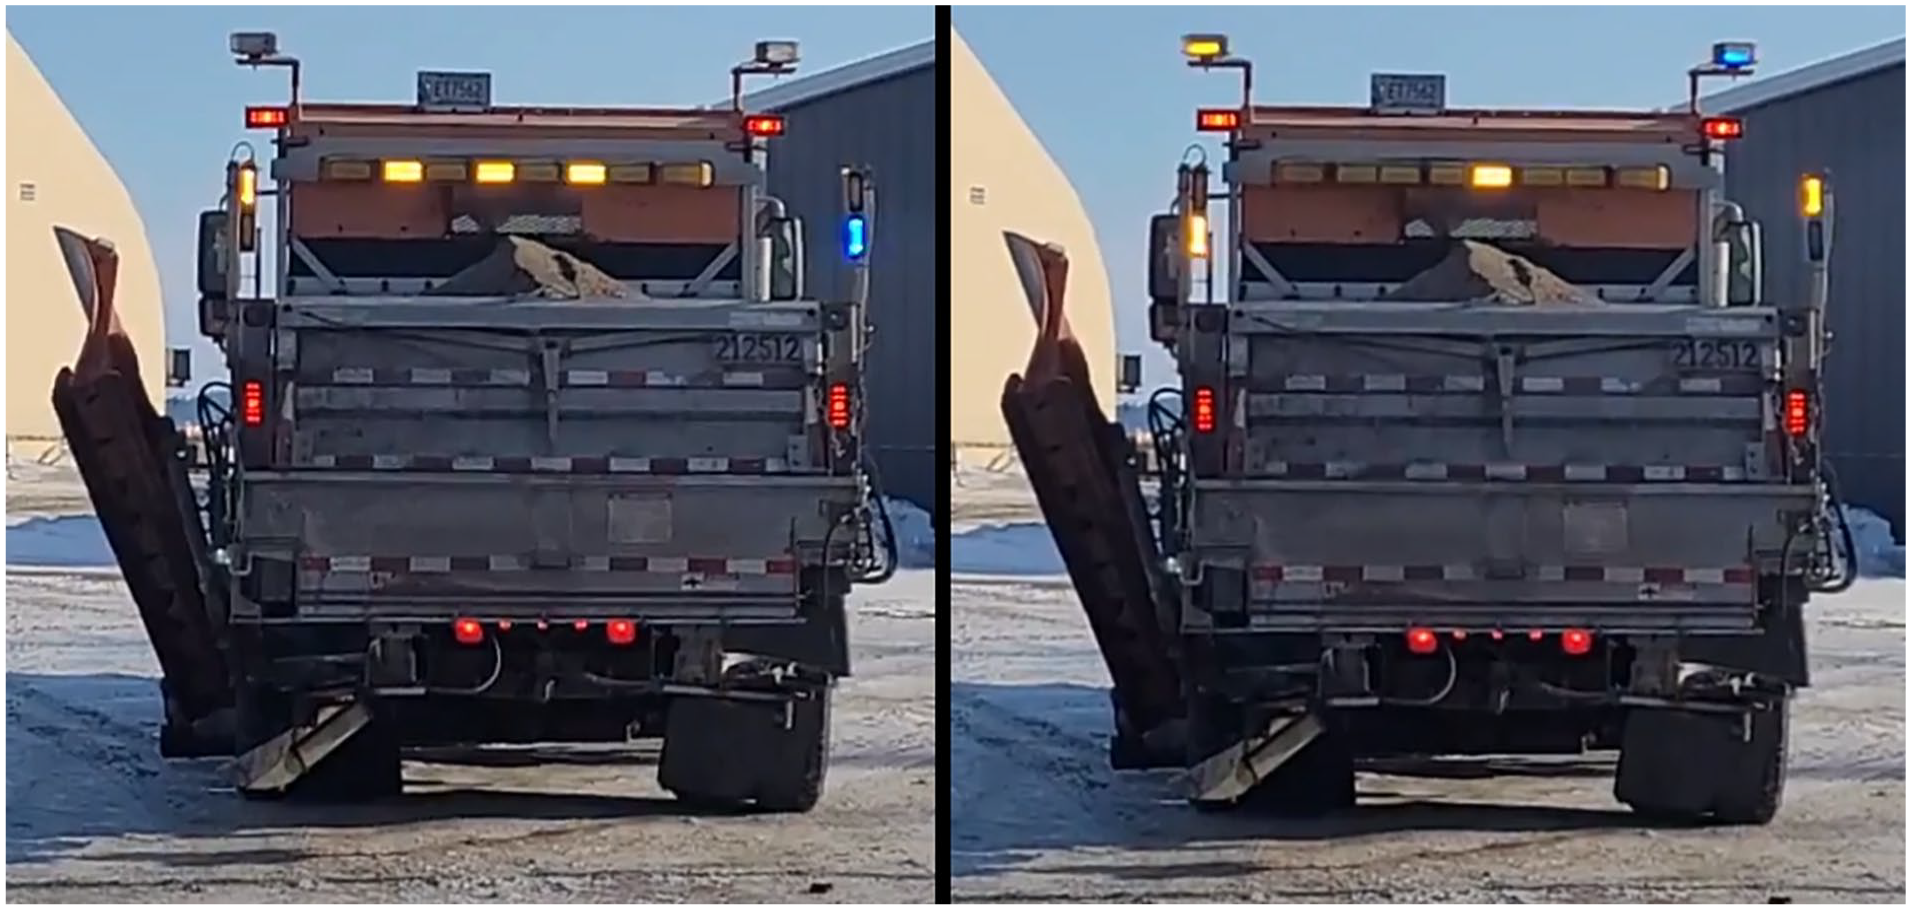
Images of the original snowplow lighting configuration tested in this study, taken August 2023.
The proposed design (see Figure 2, third image) attempted to address the factors contributing to rear-end crashes observed in the incident data, including recognition of a vehicle and collision detection and collision estimation, while maintaining clarity of signal meaning for following drivers. Two vertical and steady amber light bars were added to improve the perception of shape for collision estimation, while using two pairs of alternating flashing lights to help collision detection (Bullough et al., 2001; Li, et al., 2014). The remaining flashing lights were removed to mitigate visual noise to improve salience of a given signal, and the braking and turn signals were presented in a manner consistent with most passenger vehicles as center high-mounted stop lamps have been shown to be effective at improving braking responses (McKnight & Shinar, 1992), and keeping signaling patterns consistent with how such signals are typically presented with other vehicles on the roadway helps drivers maintain an appropriate frame or schema to improve stimulus-response compatibility with a given stimulus configuration (Craig et al., 2021; Kantowitz et al., 1990).
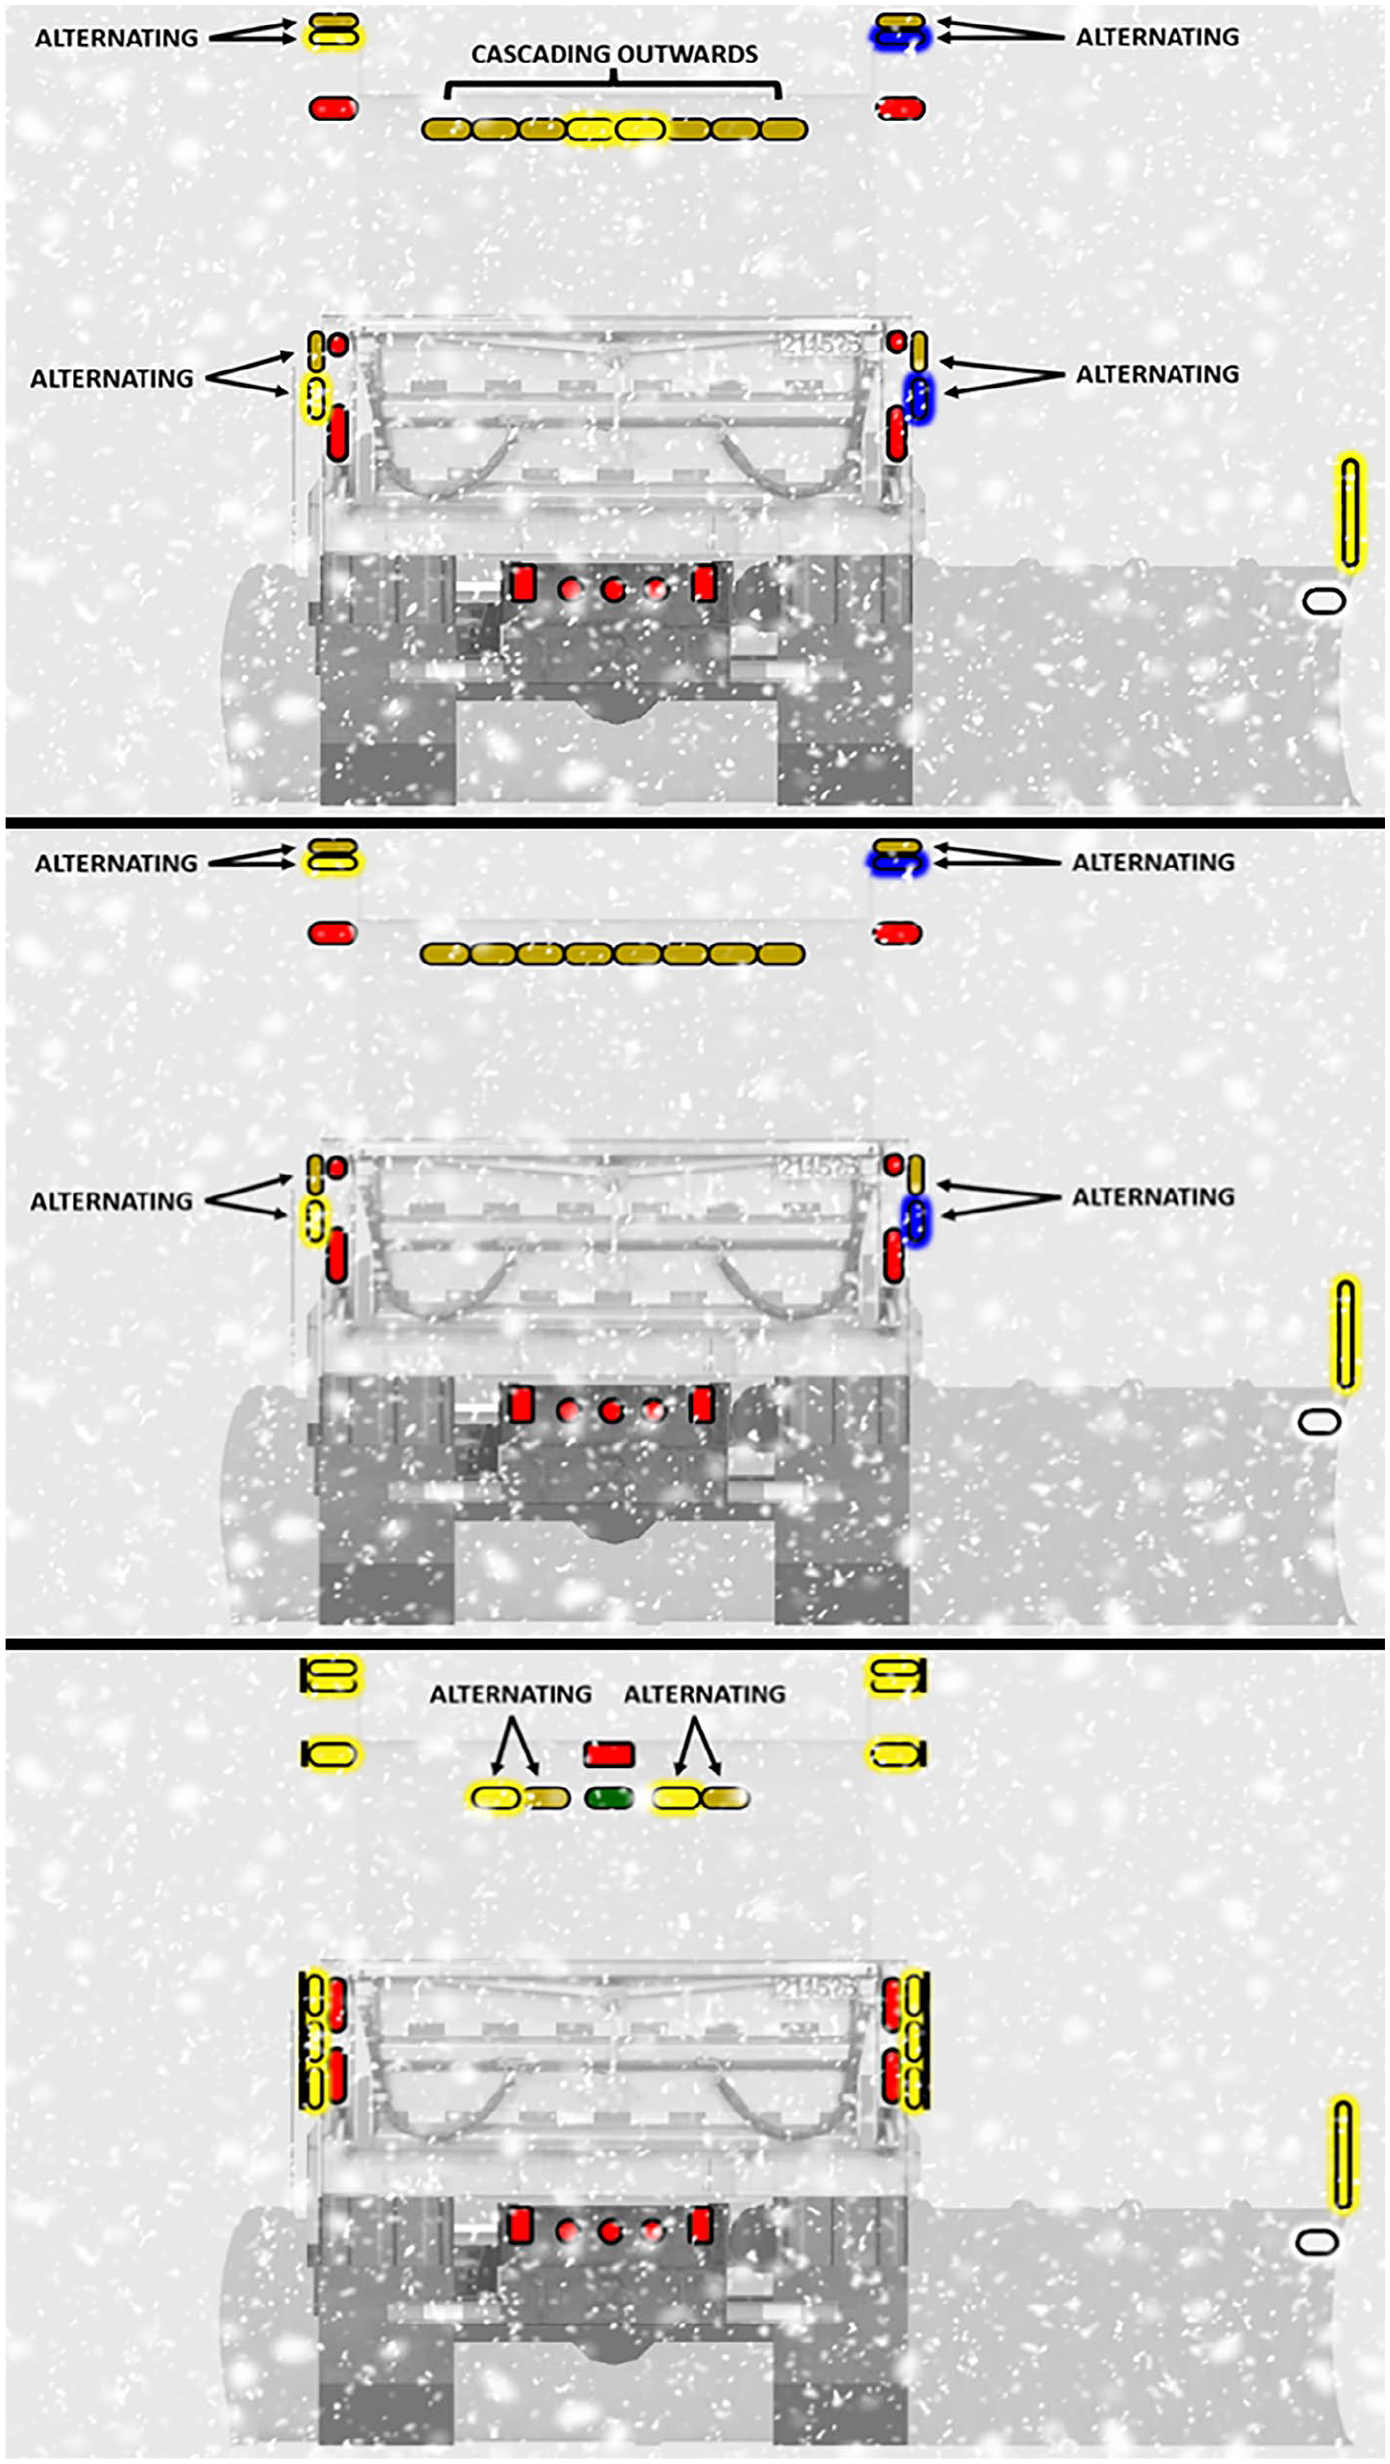
Snowplow designs presented as animated GIFs. O-C (cascade) is first. O-NC (no cascade) is second, with no activation of the central-top amber light bar. P1/P2 (proposed design) is last (P1 flashing at 2 Hz, P2 flashing at 4 Hz).
Four snowplow lighting configuration designs varying in three signal states (turning, braking, running), resulting in 12 conditions, were developed as first-person GIFs (see Figure 2). The four designs included two original designs (original design with cascade lights, O-C; original design with no cascade lights, O-NC) and two new designs (proposed design level 1, P-D1; proposed design level 2, P-D2). Two levels of a proposed design were provided to test a potential application of a future collision avoidance system utilizing different levels of alert, given closer proximity or shorter time-to-collision (TTC) between a following vehicle and the snowplow. The level 1 system (P-D1) presented alternating flashing at 2 Hz, and the level 2 system (P-D2) presented alternating flashing at 4 Hz (see Figure 2, third image).
Participants
A total of 97 participants (n = 53 or 54.6% female) were recruited via Prolific, an online survey platform. The mean age was 39.62 years (SD = 14.58). Twenty-one (21.6%) participants reported living in rural areas, 54 (55.7%) lived in suburban areas, and 22 (22.7%) reported living in urban areas. Thirty-three (34.0%) participants reported that they drive in snow 1 to 5 times per year, 14 (14.4%) said 6 to 10 times per year, 21 (21.6%) said 10 to 50 times per year, 5 (5.2%) said more than 50 times per year, and 24 (24.7%) reported they never drive in the snow. Additionally, when asked how often they encounter a snowplow on the roadway while driving, 43 (44.3%) participants reported encountering snowplows on the roadway 1 to 5 times per year, 12 (12.4%) said 6 to 10 times per year, 9 (9.3%) said 10 to 50 times per year, 5 (5.2%) said more than 50 times per year, and 28 (28.9%) said they never encountered snowplows while driving.
Procedure
Participants reported basic demographic information and their winter driving experience. Participants viewed a total of 12 first-person animated GIFs (see Figure 2) from the perspective of a driver following a snowplow and rated the interpretation and response items for each of the snowplow configuration design combinations. Participants were asked to rate a total of 13 measures that assessed what the snowplow was doing (i.e., interpretation; seven items) and how they would behave as a trailing driver (i.e., response; six items), responding to each potential interpretation and response using a 7-point Likert scale ranging from 1 = very unlikely to 7 = very likely.
Results
Design Configuration Factor Analysis
To explore the factor structure of the interpretation and behavior measures, an exploratory factor analysis (EFA) using the principal-factors method of estimation and varimax rotation showed a five-factor solution. Items loading on only the five factors with loadings of .5 or above were retained. The average factor loading was .78. Raw factor scores were converted into orthogonal factors for interpretation and response. The five interpretation-response factors included (a) constant speed (i.e., snowplow is proceeding normally), (b) slowing down (i.e., snowplow is slowing down/stopping), (c) urgency (i.e., snowplow is indicating warning/emergency), (d) lane shift (i.e., driver should change lanes/overtake) and (e) hard stop (i.e., driver should slow down/brake). A series of analyses were conducted on all designs and the proposed designs only. See Table 1 for a summary of the results.
Relative Accuracy and Degree of Interpretation.
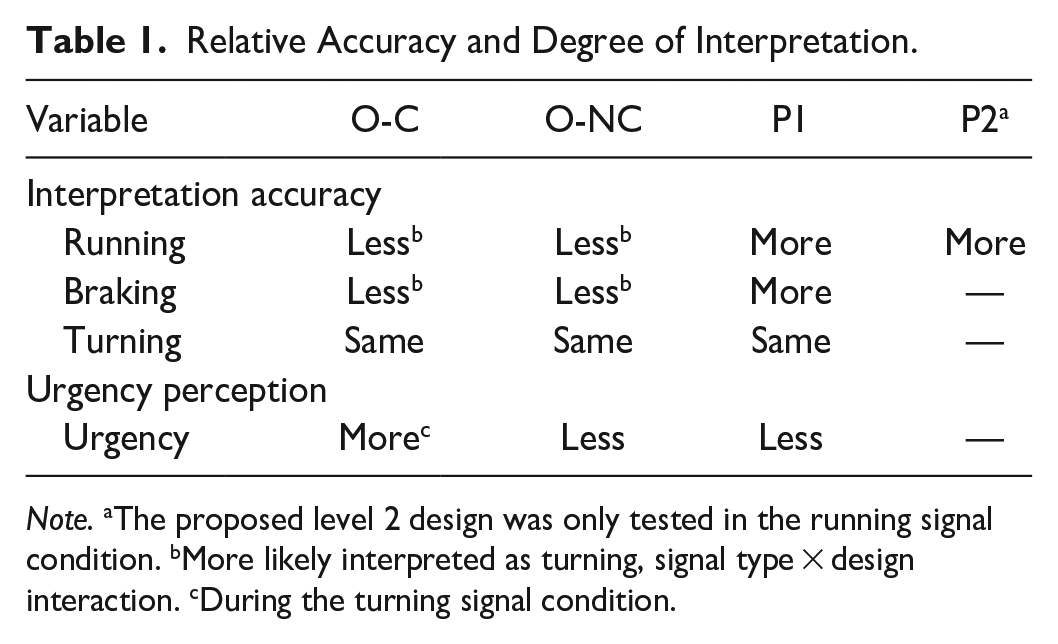
Note. aThe proposed level 2 design was only tested in the running signal condition. bMore likely interpreted as turning, signal type × design interaction. cDuring the turning signal condition.
All Designs Analysis
The z-scores on the orthogonal factors and a subset of the raw survey data for turning interpretation were analyzed with a series of repeated measures ANOVAs to examine the effects of each of the varying design types on the z-scored factor loadings. The analysis of four running designs on the five interpretation-response factors revealed a significant interaction effect between the interpretation-response factors and design type when signaling running, F(7.81, 749.60) = 4.41, p < .001, ηp2 = .044. The proposed designs (P-D1, P-D2) were perceived accurately when the signal state was a normal running condition while the original O-NC design showed more ambiguity when communicating a running signal state.
Proposed Design Analysis
The following analyses on the other signal states focused on the first proposed design (P-D1) along with the original designs. The analysis of the three turning designs on the five factors revealed a significant interaction effect when signaling turning, F(8, 768) = 2.518, p = .010, ηp2 = .026. The original O-C design communicated more urgency in a turning signal state.
An analysis of three signaling designs on the five factors revealed a significant interaction effect when signaling braking, F(4.83, 464.01) = 3.276, p = .007 ηp2 = .033. The proposed design (P-D1) signal was reliability perceived as slowing down in braking conditions compared to original O-C and O-NC designs.
Finally, there was a significant interaction effect of signal type and design on turning interpretation F(3.81, 365.90) = 12.04, p < .001, ηp2 = .111. When presenting a non-turning signal, the proposed design was clearly interpreted as “not turning” compared to the two original designs (O-C and O-NC).
Discussion
The examination of incident reports indicated three common themes across the majority of rear-end crashes involving snowplows. First, it was found that a majority of incidents occurred when the snowplow was traveling “normally” or performing normal operations. This implies the snowplow is driving or plowing at a constant speed while going straight. This finding suggests that the incidents involving a snowplow were not a result of abnormal snowplow behavior relative to the flow of traffic (e.g., slowing, stopping, or turning). Second, it was found that a majority of drivers were typically aware of the snowplow, given that many crashes occurred after a driver’s observed response (e.g., overtaking attempt, braking, and losing control, etc.) indicating that many incidents were not due to a lack of snowplow detection. Lastly, the majority of incidents involved low visibility environmental conditions, such as snow-covered roadways or blowing snow. Together, these findings suggest that the observed incidents may be in part due to the detection issues related to the design of the existing snow rear-end lighting configuration system.
The issues with the existing system design indicated from the incident reports were validated with the findings from the online study, implying ambiguity of certain signal states. Overall, the original designs were not as clearly understood by drivers when communicating normal “running” signal states and braking states, relative to the proposed designs. Specifically, when analyzing whether participants perceived the signal to communicate braking when the signal indicated braking, it was found that the proposed design distinguished itself for communicating braking and slowing down relative to the original design conditions. The ability to clearly signify braking is of key importance as reducing the speed disparities between vehicles can reduce the frequency and severity of rear-end collisions. It is important that the signal is understandable, as many collisions occur when visibility is poor in winter weather and other collision cues are less reliable as a consequence. When analyzing turning clarity, both original designs (O-C, O-NC) saw higher misinterpretation as turning when not in the turning signal state compared to the proposed design.
The original design condition, specifically the cascading lights, had more perceived urgency relative to the non-cascading lights condition and the proposed designs. This was particularly salient in the turning signal condition, when more lights were flashing. This is consistent with the National Academies of Sciences, Engineering, and Medicine (2024) report that greater number of warning lights increases subjective ratings of hazard urgency. There are trade-offs to consider in balancing urgency, collision estimation, and signal interpretability. For instance, eight flashing warning lights was rated as significantly more distracting and introducing more discomfort glare than two or four warning lights, especially at closer distances, but eight warning lights were also rated as more urgent (National Academies of Sciences, Engineering, and Medicine, 2024). Flashing lights can help with detection of the vehicle but are also associated with a reduction in the ability to detect collision (i.e., detect closing in the vehicle) in certain situations, especially at high flash rates (Muttart et al., 2021). This may be a concern because slow moving vehicles (like snowplows in operation) may be perceived as moving faster than they really are (Hanscom & Pain, 1990, p. 2). Higher perceived urgency of certain discrete auditory alarms (e.g., faster tempo sounds) are associated with faster response times in response time tasks (Suied et al., 2008). It is unclear whether this improvement in response time would translate to improved performance here if the warning system is continuous and visual (instead of strictly auditory) while communicating greater perceived urgency. An attention-grabbing visual modality warming may introduce competition for effective visuomotor performance (e.g., driving) during high mental workload (e.g., driving in snow), as implied by multiple resource theory (Wickens, 2008). A multi-modal warning system may be more effective in the driving context (Large et al., 2019).
Limitations & Future Work
The incident report data was limited in that it only considered a time frame of about 5 years and about 124 cases. Furthermore, attribution of crash factors relied on the reporting of the snowplow operators, who often did not directly observe the pre-crash maneuvers made by the passenger vehicles prior to the crash, leading to gaps in the data and requiring inferences to be made based on their reports of the maneuvers the snowplow was making prior to the crash. Future work should utilize a more complete dataset to replicate the findings presented here.
The sample size in this study neared but did not meet the minimum sample size typically required for factor analysis given the number of measures and number of factors present (Mundfrom et al., 2005). As such, it is important to further validate the interpretation-response factors identified here in a larger sample of participants to ensure item reliability.
Additionally, this work relied on the use of self-reported measures to assess signal representation and driver response behaviors through an online study and may not reflect true driver interpretation and response to the different rear-end lighting configurations. Future work should consider assessing actual driver motor response to the proposed designs through a driving simulation study.
Conclusion
This result highlights that while the addition of additional lights and flashing patterns may assist in increasing the salience of a vehicle, these additions may result in visual noise, making it more difficult to identify key information for determining the lead vehicle’s intended behavior.
Importantly, improving signal interpretability and collision estimation is important, even if a crash still occurs. If a signal (e.g., braking) is accurately perceived, drivers can respond more quickly. Crash severity can then be reduced through earlier driver responses and brake times because earlier braking responses lead to a reduction in impact velocities (Probst et al., 1987). This is particularly valuable when crash frequency or likelihood increases due to environmental conditions, such as low visibility or icy/wet roads.
Footnotes
Acknowledgements
The authors would like to thank Peter Easterlund for his contributions to the incident analysis and lighting designs.
Declaration of Conflicting Interests
The author(s) declared no potential conflicts of interest with respect to the research, authorship, and/or publication of this article.
Funding
The author(s) disclosed receipt of the following financial support for the research, authorship, and/or publication of this article: This project was funded by the Minnesota Department of Transportation and Minnesota Local Road Research Board, contract number 1036342 WO 84.