
Abstract
Development of responsive automation necessitates a framework for studying human-automation interactions in a broad range of operating conditions. This study uses a novel experiment design involving multiple binary perturbations in different stimuli to elicit measurable changes in cognitive factors that affect human-decision making during conditionally-automated (SAE Level 3) driving: trust in automation, mental workload, self-confidence, and risk perception. To infer changes in these factors, psychophysiological metrics such as heart rate variability and galvanic skin response, behavioral metrics such as eye gaze and reliance on automation, and self-reports were collected. Findings from statistical tests revealed significant changes, particularly in psychophysiological and behavioral metrics, for some treatments. However, other treatments did not elicit a significant change, highlighting the complexities of a between-subject experiment design with variations in multiple independent variables. Findings also underscore the importance of collecting heterogeneous human data to infer changes in cognitive factors during interactions with automation.
Introduction
To enhance human-automation teaming, it is necessary to incorporate human cognition models in the design and operation of autonomous systems. Researchers have studied cognitive factors that affect human decision-making in conditionally automated vehicles using event-based studies, with a focus on human responses to specific events such as take-over requests (TORs) (Melcher et al., 2015). Nevertheless, implementation of continuous-time and responsive automation in real-world scenarios ultimately necessitates a framework to (1) account for a broad range of operating conditions and (2) analyze a human’s cognitive factors throughout their interaction with the automated vehicle. Furthermore, while researchers have acknowledged that users’ workload, risk perception, and self-confidence may mitigate or influence the dominant relationship between user trust in automation and reliance (Riley, 1996), many existing studies examine only one or two of these factors at a time. Finally, studies in which multiple independent variables are varied simultaneously are limited. Varying one independent variable at a time is necessary to establish one-to-one relationships between a stimulus and its response, but this fails to capture interaction effects between different stimuli.
In this study, we present a novel experiment design involving multiple binary perturbations in different stimuli to elicit measurable changes in cognitive factors that affect human decision-making in SAE Level 3 autonomous vehicles, namely trust in the automation (trust), mental workload (workload), risk perception (risk), and self-confidence (confidence). To the best of our knowledge, this work is unique in its aim to analyze four cognitive factors in a non-deterministic autonomous driving experiment by manipulating four independent variables. The independent variables—task complexity, automation transparency, system reliability, and recommended control mode—are selected specifically to perturb these cognitive factors based on existing literature (Akash et al., 2020; Melcher et al., 2015). The dependent variables include self-reported cognitive factors as well as psychophysiological and behavioral metrics. Self-reports, while being a direct measure of a human’s cognitive factors, cannot be solicited too often without disrupting or distracting the participant and often suffer from bias (Rosenman et al., 2011). Conversely, psychophysiological (and some behavioral) metrics provide real-time continuous data to infer these factors. Psychophysiological sensing modalities used in this study include Heart Rate Variability (HRV) and Galvanic Skin Response (GSR). Behavioral measures include eye gaze and automation-reliance behaviors. While the broader objective of this work is to identify a computational model to predict the dynamics of human cognitive factors that affect decision-making during conditionally-automated driving, the scope of this study is to validate several established relationships between the independent and dependent variables in the context of this novel experiment. These relationships include the effects of changes in independent variables on the cognitive factors, and correlations between objective and subjective measures. The paper is outlined as follows. We first discuss existing work and state our hypotheses. Next, we describe the experiment design, apparatus, procedure, and data processing and analysis to test the hypotheses. This is followed by a presentation and discussion of our results. The paper concludes with a summary of our work and some limitations of this study.
Background and Hypotheses
Effects of Treatments
Previous work (van de Merwe et al., 2024) showed that task complexity increased workload in autonomous vehicle contexts. Accordingly, our first hypothesis is that
Inferring Cognitive Factors From Measurements
Previous work (Guo et al., 2016) showed that HRV metrics such as PNN50, RMSSD, SDNN (defined in Table 2) captured changes associated with workload. Accordingly, we expect these metrics to have significant correlation with self-reported (SR) workload. Specifically, Veltman and Gaillard (1998) observed a systematic decrease in NN intervals (inter-beat intervals from which ectopic beats have been removed from consideration) as a task became more difficult during a simulated flight task and likewise, we hypothesize that
Human Subject Study
Experiment Design
In this between-subject study, each participant drives an ego vehicle with SAE level 3 automation on a predefined route (called a “drive”) in a simulated environment, wherein the independent variables are varied as binary signals. A change in the state of independent variables is referred to as a treatment. To prevent abrupt changes in driving conditions, treatments only occur at intersections. In each half of a drive, two of the four independent variables are varied, and the other two are set to their default states. This design is the simplest way to vary the least number of independent variables while allowing for interactions between independent variables. There are two drives (A and B), and the choice of pairs of independent variables varied in the treatments are hypothesized to perturb all four independent cognitive factors. The treatment summary for each half of each drive is illustrated in Figures 1 to 4.
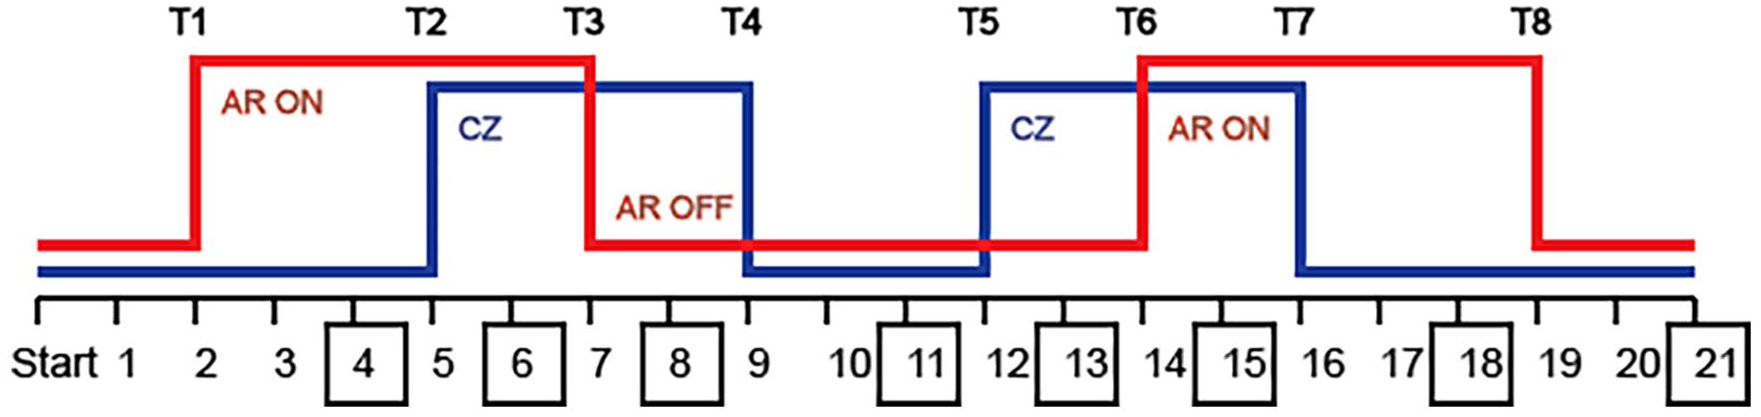
Drive A—First half: Automation transparency and task complexity are varied.
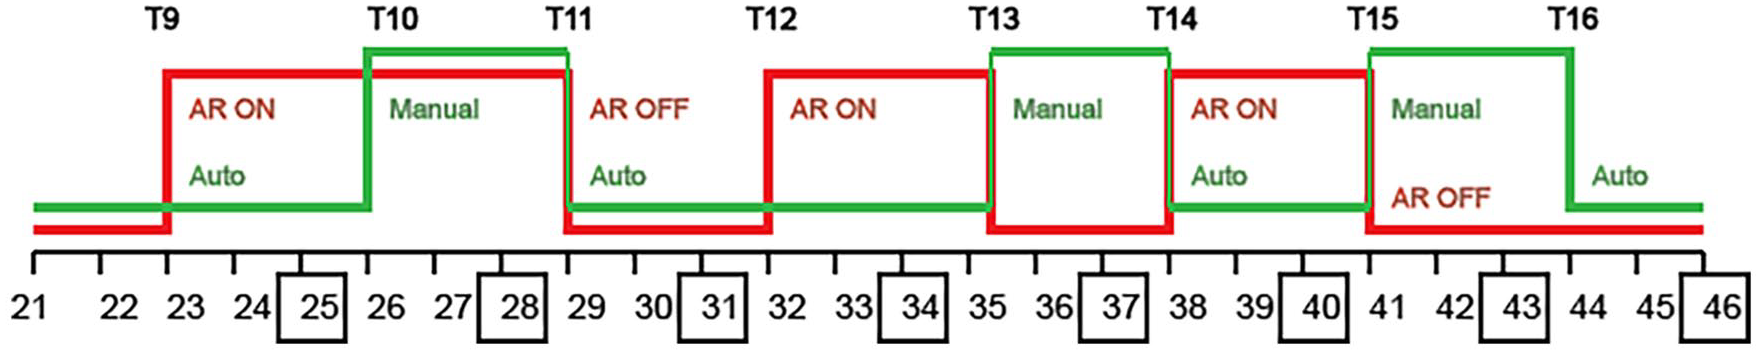
Drive A—Second half: Automation transparency and recommended control mode are varied.
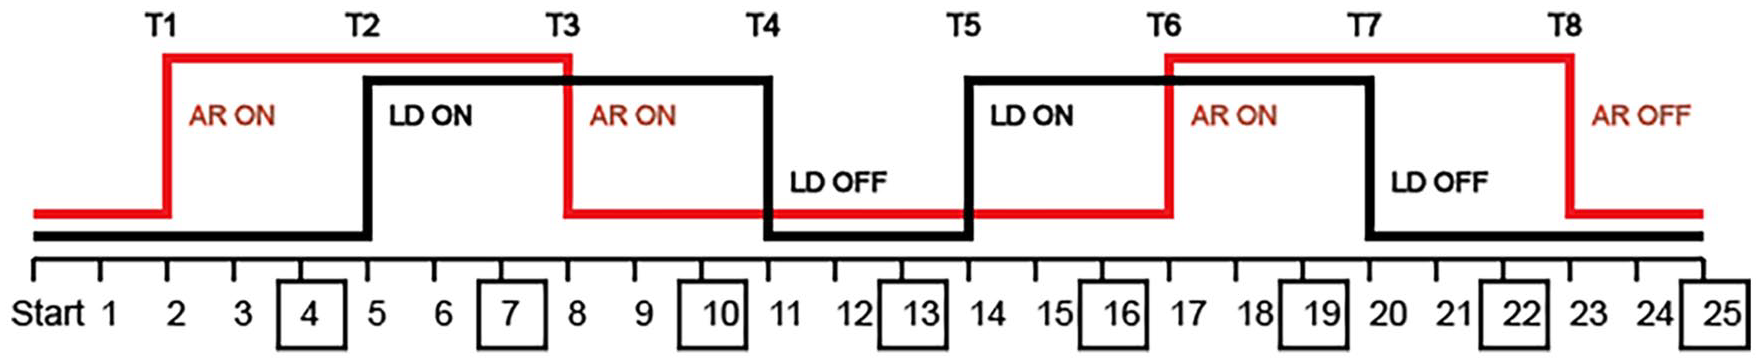
Drive B—First half: Automation transparency and system reliability are varied.
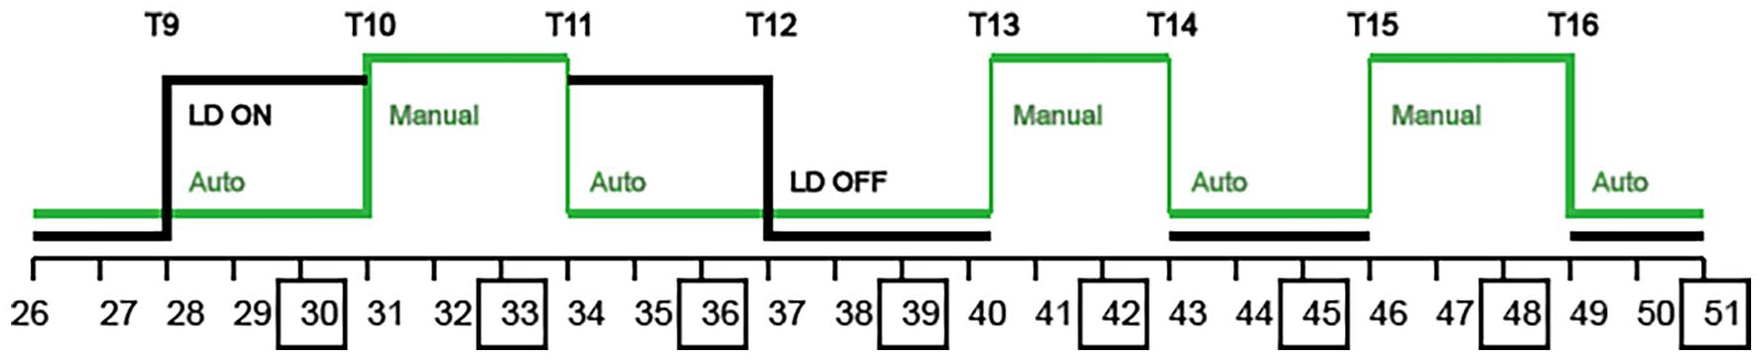
Drive B—Second half: Recommended control mode and system reliability are varied.
Treatments occur based on waypoints that are triggered when overlapped with the ego vehicle. Task complexity is increased by introducing construction zone (CZ) obstacles (Figure 5). Automation transparency is turned ON by displaying bounding boxes via augmented reality (AR) for static and dynamic objects, including traffic lights, construction zones, and traffic vehicles, with different colors for different types of objects (Figure 6). Recommended control mode (RCM) in the “Manual” driving state requests the participant to take over the vehicle and drive manually, and in the “Auto” driving state prompts that the automation is ready for regaining control. The first and third TORs (T10 and T15) are initiated in the presence of a school zone, while the second TOR (T13) is initiated without any cause. Lastly, system reliability is decreased by enabling lane deviation (LD) for the ego vehicle’s automation in the presence of faded lane markings.
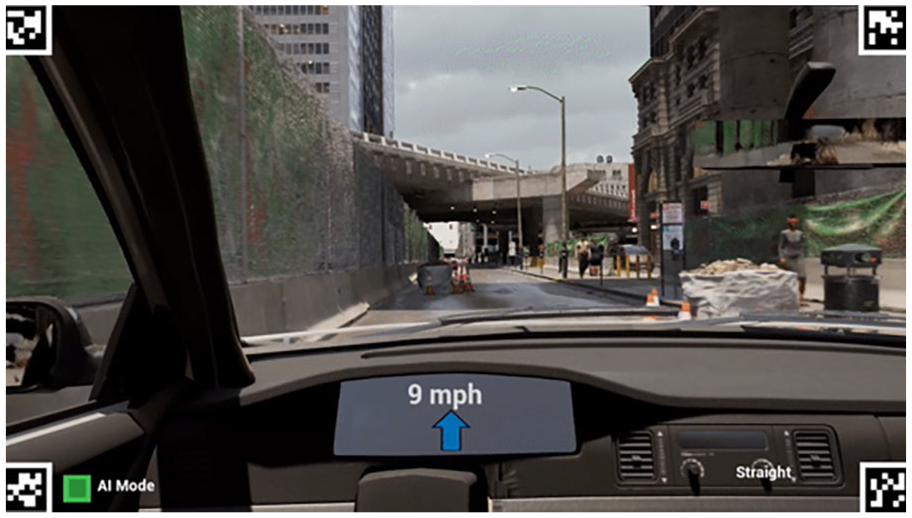
Task complexity is implemented using construction zone obstacles.
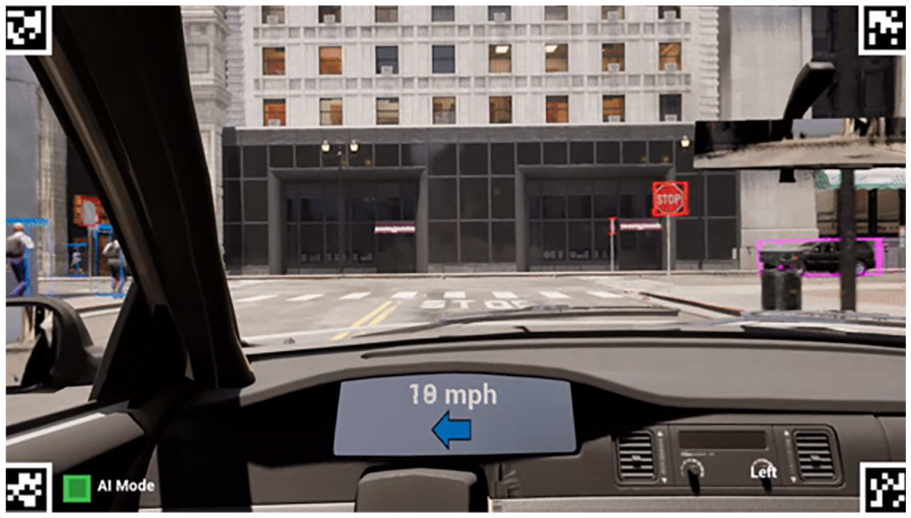
Automation transparency is implemented as bounding boxes on static and dynamic objects.
Apparatus
The experiment was conducted with a driving simulator using Unreal Engine 5 and Logitech G29 steering wheel and pedals. A toggle was added to allow participants to take over control of the ego vehicle using the steering wheel or gas/brake pedal. A designated user interface was created to include information such as current speed (in miles per hour), current control mode, availability of automation, directions for navigation, system messages for TORs, prompts for self-reports, etc. The simulator also sent event markers to iMotions (iMotions 10.0.2, 2024) to record changes in independent variables as well as all user-initiated takeovers, pauses and resumes. Heart rate data and GSR data were collected using the Polar H10 sensor (Schaffarczyk et al., 2022) and the Shimmer3 sensor, respectively. Since the driving task required the use of participants’ hands, the Shimmer3 sensor was placed on the instep of the participant’s left foot (Van Dooren et al., 2012). Eye gaze data was collected using the Neon by Pupil Labs eye-tracking glasses.
Participants
A total of 37 participants (16 males, 21 females) aged between 18 and 48 (Mean: 23.30, SD = 6.19) with normal or corrected to normal vision (with contact lenses) participated in the study upon obtaining informed consent. Twenty participants experienced Drive A, while 17 experienced Drive B in this between-subject study. All participants held valid US driver’s licenses and were screened for susceptibility to motion sickness. The study was approved by Purdue’s Institutional Review Board.
Procedure
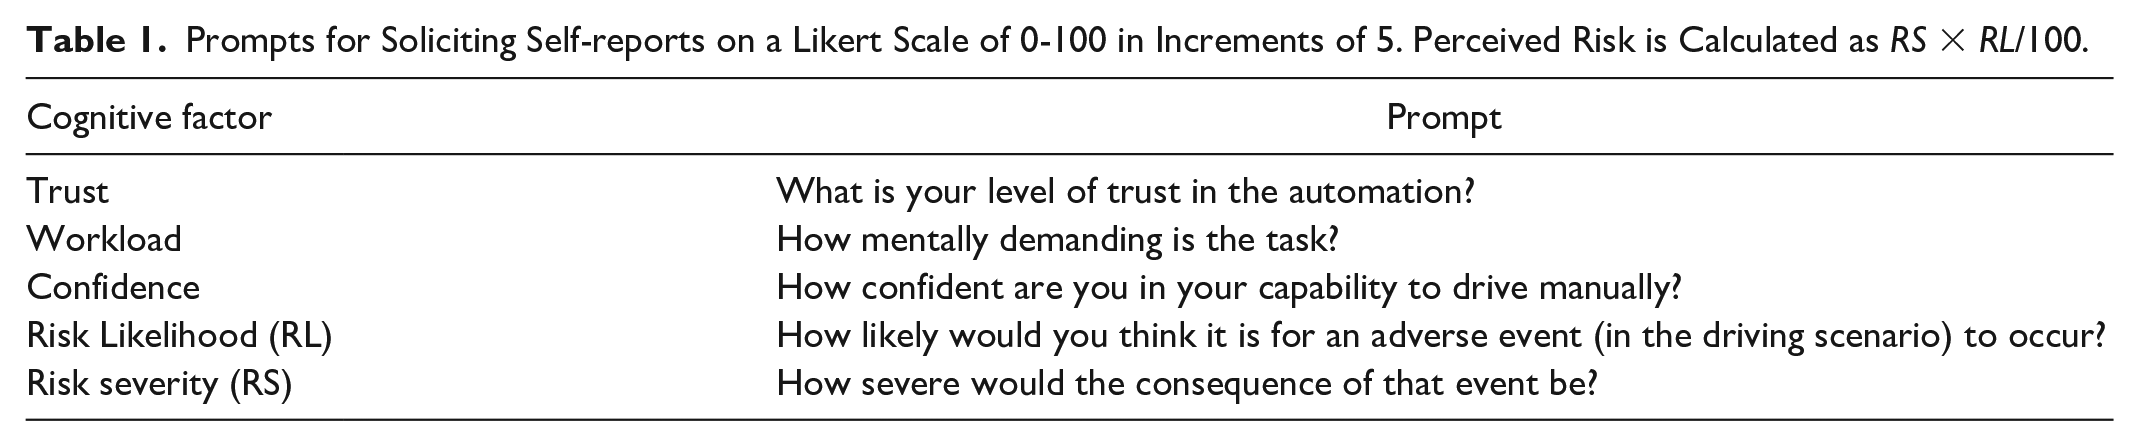
Participants first completed a pre-experiment questionnaire and were briefed about the experiment. After sensor set-up, participants experienced a trial drive to get acclimated to the simulator controls and the process for providing self-reports (Table 1). At the trial drive’s end, participants were asked for their initial self-reported cognitive factors. Self-reports were solicited at intersections (boxed in Figures 1–4) by pausing the simulation at a red traffic light or stop sign. After completing the drive, participants completed a post-experiment questionnaire, followed by a semi-structured interview.
Prompts for Soliciting Self-reports on a Likert Scale of 0-100 in Increments of 5. Perceived Risk is Calculated as RS × RL/100.
Data Processing
Psychophysiological Metrics
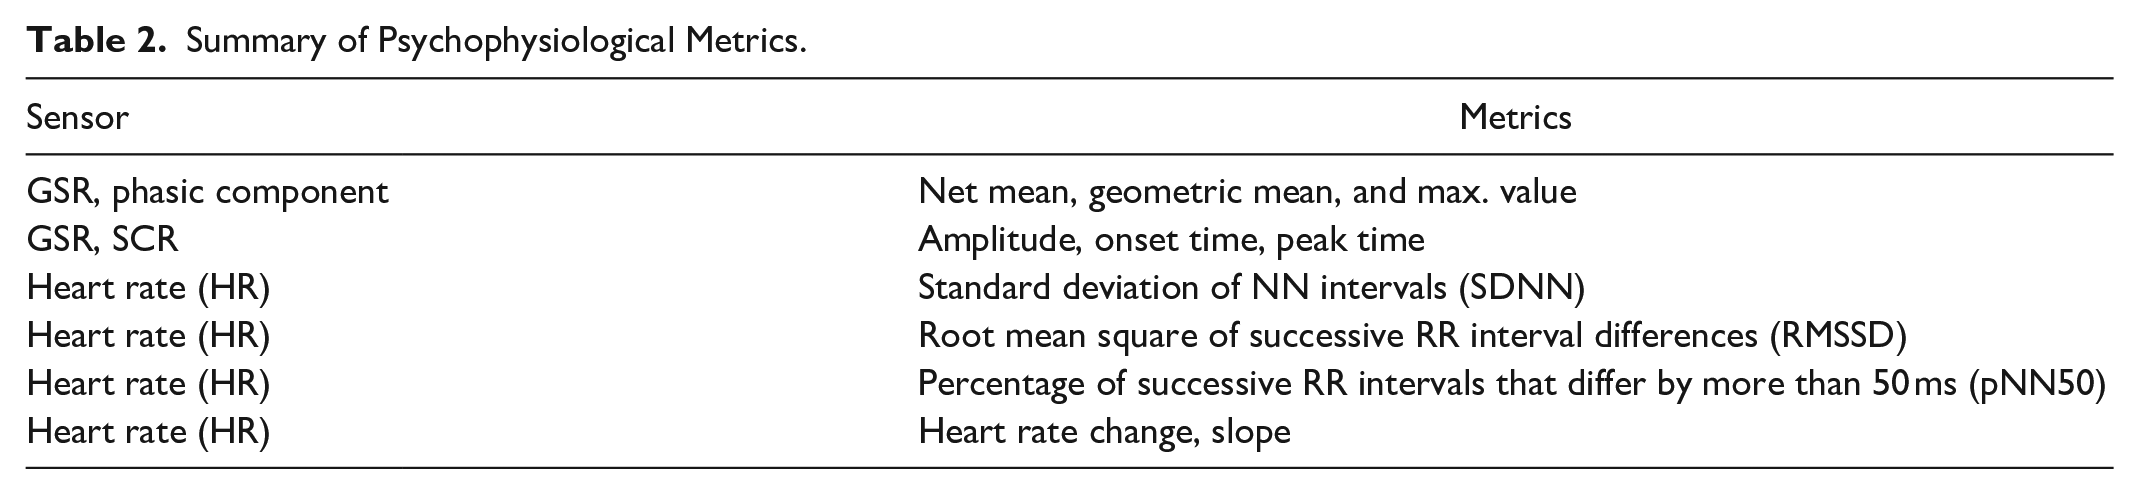
GSR data was decomposed into phasic and tonic components using non-negative deconvolution implemented by Ledalab software (Benedek & Kaernbach, 2010). The deconvolution process also identifies SCRs as it presumes that the GSR signal is the impulse response of an SCR function convolved with a tonic component. HRV metrics were computed using the MarkusVollmer HRV Matlab Toolbox (Vollmer, 2019). Time domain HRV metrics were calculated over a moving window of 80 NN intervals (Shaffer & Ginsberg, 2017). Based on event-marker timestamps, the continuous-time metrics were partitioned into 20 s pre-and post-stimulus windows over which psychophysiological metrics were computed. See Table 2 for a summary of metrics.
Summary of Psychophysiological Metrics.
Behavioral Metrics
Reliance was defined to be the fraction of time spent in Auto mode between two treatments. For eye gaze metrics, fixations were classified into the following dynamic areas of interest (AOIs): cars, pedestrians, traffic lights, stop signs, and construction zones. Static AOIs were defined around mirrors, car body, console, vehicle mode, and dashboard horizon. The dashboard horizon AOI was selected because it was observed that many participants tended to rest their eyes on the road directly in front of them at the base of the windshield. Finally, AprilTags were included as an AOI to verify they were not distracting to participants. The classified fixations were used to compute the total fixation time, total number of fixations, maximum fixation time, mean fixation time, and standard deviation of fixation time for all AOI types in experimental blocks pre- and post-stimuli.
Analysis
Statistical Model for Identifying Significant Treatments
The response for the ith participant after the kth treatment has occurred can be represented using a linear model given by

where Yi,k denotes the response observed in terms of a particular metric, Bi denotes the participant baseline for that metric, Ti,k denotes the effect size of the current treatment, and Ti,k−1 accordingly denotes the effect of the previous treatment. The term βik represents a linear drift. By de-trending the collected observations (Yi,k), Equation 1 can be rewritten as Yi,k = Bi + Ti,k + Ti,k−1. Accordingly, the response before the first treatment is simply given by the participant baseline, Yi,0 = Bi. After the first treatment has occurred, the response is given by Yi,0 = Bi + Ti,1. It follows that the effect of Treatment 1 using data from the ith participant is Ti,1 = Yi,1 − Yi,0. Similarly, it can be shown that the effect of the kth treatment is given by Ti,k = Yi,k − Yi,k−1. Whether a treatment elicits a measurable change in a metric can be checked by performing a one-sample t-test on the treatment effect collected from participants, or equivalently a paired t-test on the de-trended responses pre- and post-treatment. Further, to account for inter-subject differences, the response in each metric is normalized at a participant level using the standard deviation of the responses for that metric across all treatments.
Correlation
To verify relationships between objective (psychophysiological or behavioral) and subjective (self-reported) measures, the Pearson correlation coefficient was computed for each participant between the objective and subjective metric of interest.
Results
Effects of Treatments Across Participants
Correlation Between Subjective and Objective Measures
Discussion and Limitations
Seven out of 11 hypotheses tested positive. Importantly, significant changes in psychophysiological and behavioral metrics were observed across participants even when such changes were absent in self-reports. This supports a key feature of our experiment design, namely collecting heterogeneous human data to enable analysis of cognitive factors using a combination of psychophysiological, behavioral, and subjective measures. However, correlations between SR cognitive factors and objective measures were observed only for a few participants. Only seven participants for trust and four participants for perceived risk reported a mean absolute change higher than five (the quantization interval), suggesting a need for re-design of prompts used for self-reports. Analysis of pre- experiment and post-experiment questionnaire data may aid in identifying distinct behaviors and dispositional factors such as automation bias, which is not accounted for in this analysis. Finally, observations such as an (a) increase in reliance when exiting a construction zone with high transparency, and (b) decrease in trust when decreasing reliability in the absence of transparency suggest interaction effects between independent variables that should be analyzed in future work. In the current experimental design, participants in each drive experience the same order of treatments, thereby preventing us from using statistical models that can capture residual or interaction effects due to previous treatments. Therefore, future work will include a re-design of treatments to facilitate such analysis using tools such as linear mixed-models.
Conclusions
In this paper, a novel experiment was presented for eliciting changes in multiple cognitive factors that affect human-decision making during conditionally-automated (SAE Level 3) driving. Multiple heterogeneous dependent measures were collected to infer changes in participants’ trust in the automation, mental workload, self-confidence, and risk perception. While several findings from statistical analyses of the collected data are consistent with previous work, others underscore the complexities associated with a between-subject experiment design aimed at studying human cognitive behavior in scenarios involving their continuous interaction with an automated system under several operating conditions. This motivates further research on this challenging problem.
Footnotes
Acknowledgements
We thank Dr. Robert Proctor for lending his expertise to the experiment design.
Declaration of Conflicting Interests
The author(s) declared no potential conflicts of interest with respect to the research, authorship, and/or publication of this article.
Funding
The author(s) disclosed receipt of the following financial support for the research, authorship, and/or publication of this article: This material is based upon work supported by the National Science Foundation under Award No. 2145827. Any opinions, findings, and conclusions or recommendations expressed in this material are those of the authors and do not necessarily reflect the views of the National Science Foundation.