
Abstract
Forward collision warnings (FCW) are designed to warn drivers of potential collisions, but their effectiveness may vary based on driving conditions and driver responses. This study investigated driver behavior in response to real-world FCW alerts across various driving contexts with the aims of evaluating the prevalence and characteristics of FCW events, i.e., examining how often these events occur, their severity, and the contexts in which they happen. The current analysis considered driver responses to FCW events, including changes in vehicle kinematics, visual attention, and hand-on-wheel behavior. Findings suggest that lower-severity FCWs are more common on local roads and associated with adjacent vehicles, while higher-severity FCWs were observed to be more frequent on highways and in the presence of lead vehicles. The study highlights the potential value of integrating more advanced contextual information into FCW systems to enhance performance and reduce unnecessary alerts.
Introduction
Rear-end crashes are among the most prominent types of collisions in the United States (Lee et al., 2007). Forward Collision Warning (FCW) systems are driver-assistance technologies designed to alert drivers about potential safety-relevant objects or vehicles ahead. These systems are part of many vehicles’ collision avoidance system (CAS). A vehicle CAS typically uses radar and/or vision systems to detect potential collisions and provide alerts through audible, visual, or tactile signals to notify the driver independently of in combination with forward automatic emergency braking (AEB) (American Automobile Association, 2019). FCW systems are recognized for their safety benefits (Benmimoun et al., 2012; Jamson et al., 2008; Rakha et al., 2010), including both direct benefits like proactive alerting and indirect benefits like reducing tailgating and increasing car-following headways (Seaman et al., 2022). However, there are open questions about the occurrence of FCW events, how their prevalence depends on the driving environment, and how the reliability of FCW events may shape driver responses over time.
A primary concern is the high rate of perceived false positives, which can lead to drivers becoming less responsive to alerts over time (Seaman et al., 2022). As FCWs are specifically intended to give drivers time to react to a potentially emergent event (and where possible avoid AEB events), achieving a balance between system sensitivity and allowing sufficient driver reaction time is crucial. This technical-behavioral balance may benefit from additional human factors research to fine-tune the parameters (Nasir et al., 2024).
The current study leverages a naturalistic driving dataset with 1,429 FCW events and aims to assess driver behavior in response to scenarios involving FCWs that occur across various driving contexts. The aims of the current study are to: (a) examine the overall characteristics and prevalence of FCW events in a naturalistic dataset to understand their severity and the contexts in which they occur; (b) explore the relationship between the severity of FCW events and various contextual variables to identify key factors associated with different FCW severities; and (c) analyze drivers’ responses to FCW events by assessing changes in vehicle kinematics, visual attention, and hand-on-wheel (HOW) behavior to explore the interplay between driver reactions and FCW event characteristics.
Findings highlight the potential of more context-aware FCW systems that dynamically adjust sensitivity and warning. By integrating additional data about the driving environment and surrounding vehicles into an alerting strategy, FCW systems may be able to issue more accurate and timely warnings, potentially reducing unnecessary alerts and enhancing driver safety and trust in the technology.
Dataset and Methods
This study leverages a subset of the Massachusetts Institute of Technology (MIT) Advanced Vehicle Technology (AVT) Naturalistic Driving Study (NDS) dataset (Fridman et al., 2019). The dataset encompasses data from 14 Tesla Model S/X owners (13 Males, 1 Female). The data collected over 27,000 miles (1,304 trips) encompasses 1,429 FCW events. For the purposes of analysis, each event was clipped into an epoch to include 20 seconds preceding the warning and continuing to 10 seconds after. On average, each driver in our dataset experienced 99.3 (SD = 112.8) FCW events. The raw data includes GPS, CAN (vehicle telemetry), IMU, and videos from front-view and in-cabin-view. Based on these, each event was annotated to extract information about driver behaviors and contextual factors.
The annotation process was semi-automatic, involving computer vision methods and manual annotation. Computer vision was used to detect and track other road users and traffic elements (e.g., vehicles, pedestrians, and traffic signs (QDTrack) (Pang et al., 2021), and lane detection (YOLOP2) (Han et al., 2022). Driver behaviors, including glance direction and HOW were manually annotated by experienced annotators frame-by-frame at 30Hz from in-cabin videos. Details about the annotation procedure for glance and HOW behaviors, as well as the associated quality control process, can be found in (Morando et al., 2021). Additionally, road types were extracted from GPS logs using the database from OpenStreetMap Contributors (2017).
Contextual information about the driving environment and potential hazards were annotated from a forward-facing camera. The annotation was conducted by an experienced and trained annotator. The annotated context includes:
FCW Severity (see Seaman et al., 2022 for additional details)—defined based upon the judgment of the coder as (a)
Driving Scenario Characteristics—including non-roadway areas like parking lots and construction zones, local single-lane (LSL) roads with only one lane, and intersections with traffic signs or lights.
Surrounding Vehicle Characteristics—including vehicle types (car, truck, bus, motorcycle, bicycle, pedestrian, rider, or no target) and relative positions to the ego vehicle (same lane, adjacent, opposite lane adjacent, cross-traffic, leader).
The relationship between the severity of FCW events and various contextual variables was modeled using multinomial log-linear models. For clarity, this study will hereafter refer to FCW severity categories (a) and (b) as higher-severity events and categories (c)and (d) as lower-severity events. Additionally, given that the crash unlikely and nuisance alerts indicate a crash is not likely to occur even without driver intervention, we define these alarms as false positives.
Results
Severity Level and Driving Context
Most FCW events were classified as crash unlikely (66.7%) and nuisance (22.2%), while crash possible but not imminent and crash possible and imminent accounted for 7.8% and 2.3%, respectively (Figure 1). As can be seen in Figure 1, road type was not distributed evenly across different severity levels. Lower-severity events appeared to somewhat correspond to road types such as residential, tertiary, and secondary roads. Specifically, the likelihood of nuisance alerts occurring on residential, tertiary, and secondary roads was 5 times higher than on motorways and trunk roads (62.7%, CI = [55.7%, 69.7%] vs. 12.9%, [9.5%, 17.3%]). Conversely, higher-severity FCWs were most likely to occur on motorways and trunk roads (44.2%, [17.4%, 71.0%]). Although higher-severity FCWs were more common on higher-speed roads such as motorways, the average speed at which these alerts occurred was notably lower than the speed limit. The speed limit on these roads is typically 65 mph, but the average speed before an FCW was 35 mph, dropping to 28 mph after the alert.
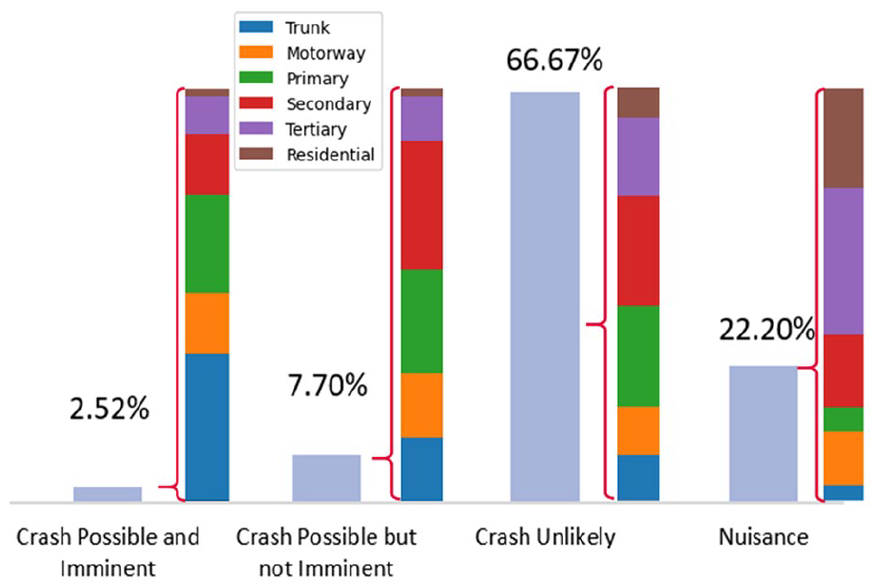
Prevalence of FCW by severity levels and road type composition.
Although most FCW events (53.67%) occurred in scenarios without observable complicating factors, some events were associated with certain driving scenarios, such as intersections (26.03%) and LSL roads (6.74%). Specific scenarios appeared to show different associations with various FCW severity. Intersections were not significantly associated with nuisance alerts (7.2%, CI: [5.1%, 8.5%]) but were more likely to be associated with alerts that indicate crash possible but not imminent scenarios (27.5%, [23.1%, 32.3%]). Conversely, LSL roads were predominantly linked with nuisance alerts, accounting for 21.1% of these alerts ([12.5%, 35.8%]).
The majority of FCW events (64.5%) occurred in the presence of a lead vehicle. Associations with severity were consistent across all levels (64.5%, CI: [58.5%, 67.8%]) except for nuisance alerts, which were less frequent 17.4%, [14.6%, 20.6%]. Additionally, the presence of adjacent vehicles (70.7%, [65.4%, 74.2%]) and adjacent vehicles in the opposite direction (12.1%, CI: [9.8%, 14.5%]) were significantly higher for lower-severity events compared to higher-severity events (1.3%, [0.7%, 1.9%] for adjacent vehicles and no adjacent vehicles in the opposite direction presented).
Severity Level and Driver Behaviors
Changes in driver behavior were observed across all measures starting from 5 seconds before to 5 seconds after the FCW alerts, with the most pronounced responses immediately after the FCW onset. As shown in Figures 2 and 3, crash possible epochs were characterized by a speed reduction of about 14 mph and a maximum deceleration of 0.4 g. In contrast, crash unlikely and nuisance events exhibited smaller speed reductions of 7 and 4 mph, respectively, with maximum decelerations of 0.2 and 0.1 g. These speed reductions were observed from just before the onset of the FCW (around 1 second) to approximately 3 s afterward.
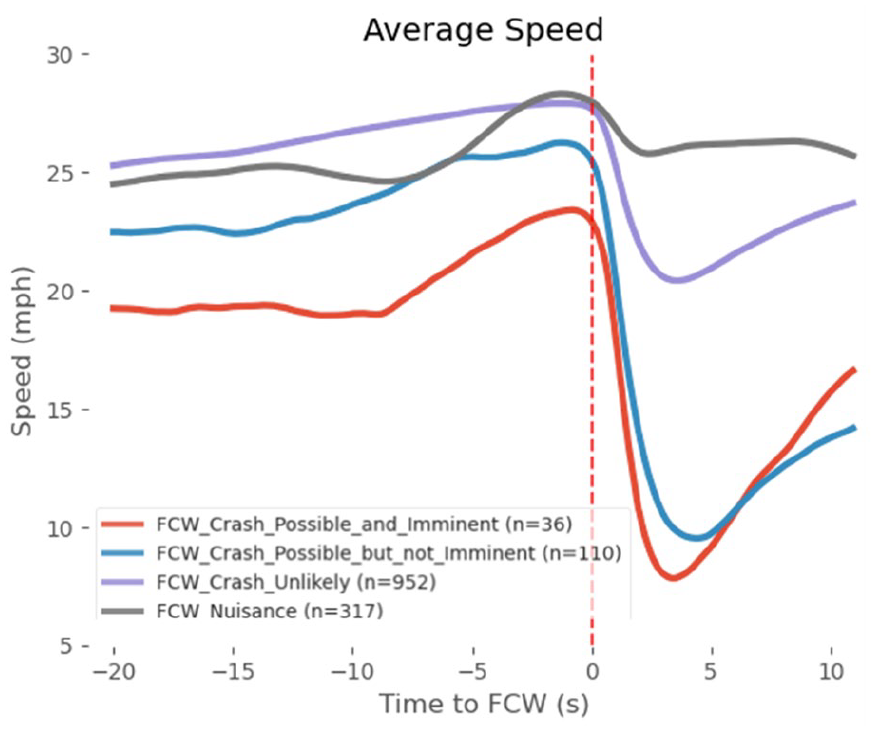
Average speed by severity levels during FCW epochs.
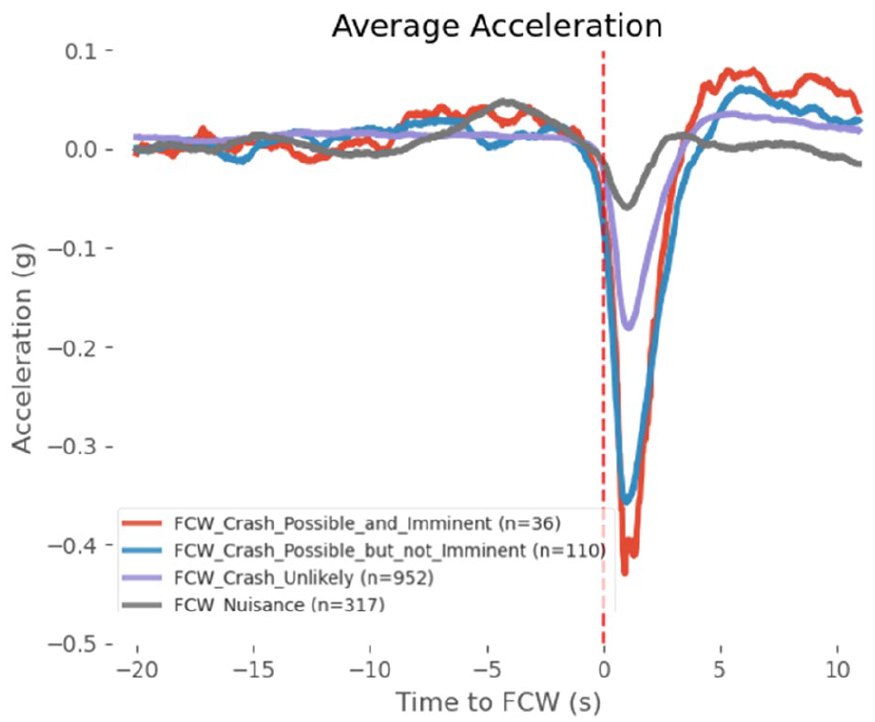
Average Acceleration by severity levels during FCW epochs.
Figures 4(a)–(d) show that driver HOW behavior was also sensitive to FCW alerts. There was a notable increase (30%) in the proportion of driving with two hands on the steering wheel during crash possible epochs. More modest increases were observed for crash possible but not imminent (18%), crash unlikely (6%), and nuisance (8%) alerts. Figures 4(e) and (h) show drivers’ glance distribution behavior before and after the FCW alert. The on-road glances increased by approximately 20% before FCWs, with the pattern of change varying across severities. The increase in on-road glances began as early as 10 s before the alert. Specifically, for crash possible and imminent, crash possible but not imminent, and crash unlikely events, the proportion of on-road glances gradually increased as the FCW onset approached, with more severe cases showing a more pronounced increase. However, in the case of nuisance events, the increase was more delayed and only appearing about 8 seconds before the alert. For crash possible epochs, there was a noticeable rise in mirror glances immediately after the alert, increasing by 23%. This increase in mirror glances was less substitutive for less severe cases, which rose by only 12%. In these cases, a shift towards invehicle glances was observed. This 8% increase occurred over a 4-second window following the alert.
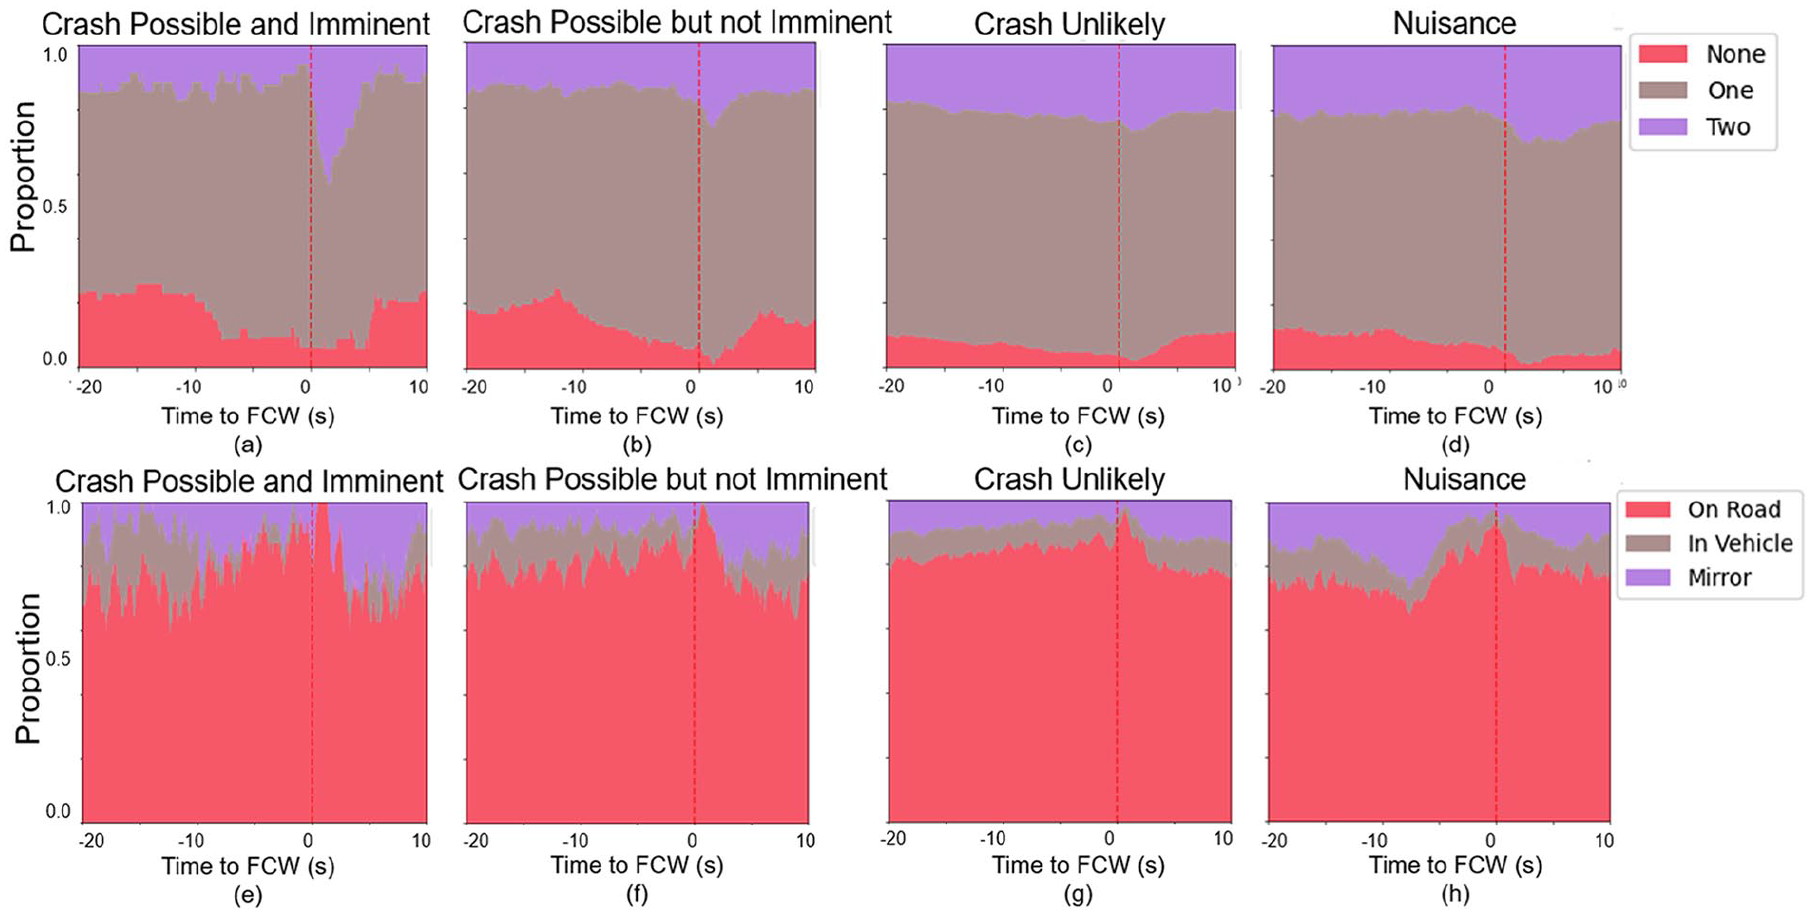
Proportion of HOW (a)–(d) and glances (e)–(f) by severity levels.
Discussion and Conclusion
This study assessed driver behavior in response to FCW alerts across various driving contexts using naturalistic driving data. Our findings indicate that the occurrence and severity of FCW alerts are associated with the driving environment. Lower-severity FCW alerts, such as nuisance and crash unlikely, were predominantly observed on residential, tertiary, and secondary roads. These alerts were often associated with adjacent vehicles. In contrast, higher-severity FCW alerts, such as crash possible and imminent, were more frequently observed on highways and in the presence of lead vehicles.
These findings suggest that contextual information could potentially enhance the sensitivity and warning strategies of an FCW alerting system, although further research is needed to substantiate these associations. It is plausible that adjustments to alerting strategies based on the driving context could reduce naissance alerts that are more likely associated with false positives. The kinematic data revealed that more severe FCW events elicited more pronounced driver responses, including speed reductions and higher deceleration rates. The analysis of hand-on-wheel (HOW) behavior and glance patterns further supports these findings. The increase in the proportion of driving with two hands on the steering wheel was most notable during crash possible epochs. On-road glances increased before FCW alerts, particularly for more severe events. This behaviors likely highlight the drivers’ anticipation and readiness to respond to potential collisions. The observed rise in mirror glances immediately after the alert for crash possible epochs suggests that drivers may be actively assessing the viability of avoidance maneuvers. Following a similar pattern the rise of in-vehicle glances after the alert for lower-severity epochs suggests that drivers were checking the instrument panel for information about the alarm. As described, for nuisance alerts on-road glances started to shift to the road almost 10 seconds before the FCW. This suggests that the driver may have changed their behavior, somehow triggering the alert. Alternatively, changes in the environment could have prompted the driver to look on-road before the alert was activated. These observations suggest the potential value of designing FCW systems that not only alert drivers to potential hazards but also incorporate contextual information both in deciding whether an alert is necessary and in providing relevant details to the driver. Specifically, the system could evaluate the driving environment and conditions—such as road type and traffic—to enhance the CAS determination of the appropriateness of an alert. Additionally, the alerts could convey contextually relevant information to help drivers understand the nature of the alert, enabling them to respond appropriately and potentially reduce information-seeking behaviors. Integrating additional data about the driving environment and surrounding vehicles could enable FCW systems to issue more accurate and timely warnings. Future work is needed to further establish these links and evaluate the benefits and limitations of the proposed approaches given sensing, computational and human perceptual limitations.
In conclusion, this study highlights the role contextual factors may play in shaping driver responses to FCW events. By understanding the occurrence of and drivers’ responses to real-world FCW events, this information may be useful in developing more sophisticated FCW systems that enhance driver trust. Future research should continue to explore the interplay between driver behavior, newer more advanced FCW systems and driving context to refine observations reported and work towards maximizing the safety benefits of FCW systems. These findings may also have relevance to other CAS including forward and reverse automatic braking systems, which help mitigate situations where drivers fail to respond to alerts quickly enough.
Footnotes
Correction (September 2024):
Article has been updated with minor changes for improving clarity and accuracy.
Declaration of Conflicting Interests
The author(s) declared no potential conflicts of interest with respect to the research, authorship, and/or publication of this article.
Funding
The data utilized in this study was supported by the Advanced Vehicle Technologies (AVT) Consortium at MIT (![]() ). The first author’s efforts in the development of this paper were supported by the New England University Transportation Center (NEUTC; US DOT UTC Grant number 69A3552348301). The views and conclusions expressed are those of the authors and have not been sponsored, approved, or endorsed by the Consortium. Note: This paper replaces a preliminary version, edits were made for clarity; no changes were made to the data presented.
). The first author’s efforts in the development of this paper were supported by the New England University Transportation Center (NEUTC; US DOT UTC Grant number 69A3552348301). The views and conclusions expressed are those of the authors and have not been sponsored, approved, or endorsed by the Consortium. Note: This paper replaces a preliminary version, edits were made for clarity; no changes were made to the data presented.