
Abstract
Armed conflicts are acknowledged for their effects on the environment, including ecosystem degradation and biodiversity loss, but also ecological restoration. Both processes impact post-conflict opportunities for peace and development. The armed conflict in Northern Uganda (1986–2008) profoundly affected local communities and their natural environment. While some areas suffered environmental degradation others underwent ecological restoration. Understanding this historical pattern is crucial for post-conflict natural resource management and peace and development prospects. This article aims to analyse vegetation changes in Northern Uganda during and after the conflict, exploring potential drivers of such changes and their implications for sustainable peace and development. Utilising remote sensing analysis and literature review, we observe a post-conflict ‘greening’ trend alongside a more equal vegetation deterioration and restoration spatial distribution. We propose that if these trends are driven by agriculture expansion, the way this is organised and articulated with natural vegetation will be central for peace and development.
Keywords
Introduction
There is an increasing global recognition that armed conflicts have a direct impact on the natural environment (ecosystems, natural resources, biodiversity), as evidenced by the growing number of research (Bruch et al., 2023; Bruch et al., 2016; Conca & Beevers, 2018; Lujala & Rustad, 2012; Young & Goldman, 2015, to name a few), policies and reports (e.g. Brusset, 2016; Carius, 2006; Conca & Wallace, 2009; UNEP, 2009; UNEP, 2013) as well as institutions or organisations who have incorporated peace concerns in their environmental agendas (such the United Nations Environment Programme, UNEP, or International Union for Conservation of Nature, IUCN) or environmental or ecological concerns in their peace agendas (e.g. United Nations Peacebuilding Commission; International Alert; Women’s International League for Peace and Freedom).
While empirical evidence from diverse regions of the world shows that armed conflicts trigger processes of environmental degradation on the ground (e.g. Bimeny, 2019; Ordway, 2015; Stevens et al., 2011; Tyner & Will, 2015 to name a few), less is known about how armed conflicts might also contribute to processes of ecological restoration. This is the case, for instance, of areas previously dedicated to farming, abandoned due to displacement. Both processes – degradation and restoration – have profound consequences for sustainable peace and development in the aftermath of conflict.
The armed conflict between the Lord Resistance Army (LRA) and the National Resistance Movement (NRM)/Uganda People’s Defence Force (UPDF) between 1986 and 2008 in Northern Uganda had profound impacts on local communities and their natural environment (ACCS, 2013; Nanpindo et al., 2005). The impacts were however not geographically evenly distributed. While some geographical areas have gone through environmental deterioration – due to natural resources overexploitation or infrastructure development – other areas have experienced ecological restoration (GoU, 2007b; Nanpindo et al., 2005). This historical trend is central to understanding post-conflict natural resource exploitation and management.
In 2013, the Advisory Consortium on Conflict Sensitivity (ACCS) conducted a comprehensive study on post-conflict drivers of conflict in Northern Uganda and concluded that one of the ‘four most serious threats to long term peace’ across the region related to the natural environment (such as competition over natural resource exploitation and access to land; including oil, grazing, forests and over reserves, but also environmental deterioration and natural disasters) and such threats could ‘inevitably return to overt conflict’ (ACCS, 2013). In 2015, the Government of Uganda (GoU) stated that tensions over resources (particularly access to land) among people could threaten any peace and development intervention set up to stabilise the region (GoU, 2015a). Together with urban growth, high poverty and low education levels, local communities bear a high potential of relapse into violent conflict (Branch & Martiniello, 2018).
Northern Uganda currently faces numerous environmental challenges and conflicts driven by expansion of plantation agriculture, oil exploration and exploitation, and urban growth (NEMA, 2019). Nardi (2024) understands that the expansion of the resource frontier towards the Northern region of Uganda during peacetime – lead by large-scale capital – has generated tensions with local communities whose knowledge and understanding of the natural environment are not considered in such economic projects (e.g. oil exploitation, mineral exploration, agribusiness, hydro-energy, etc.). In addition, a growing population demanding energy and food has triggered land use and land cover change which patterns and extent are of environmental concern according to Branch and Martiniello (2018). Luwa et al. (2020, pp. 12–13) have more recently stated that land use and cover change ‘is having a wide range of impacts on the environment and the people of Uganda at different spatial and temporal scales’. One of such impacts can be found in environmental or climate-induced migration (Serwajja et al., 2024). In fact, according to IOM (2022) ‘[o]ver the years, Uganda has incessantly faced climate change and environmental degradation related challenges, leading to forced displacement and migration’.
We argue therefore that prospects of sustainable peace and development cannot be properly understood without considerations of the natural environment. The purpose of this article is to understand (a) how vegetation activity has changed in Northern Uganda during and after the armed conflict and (b) possible drivers of environmental change explaining such vegetation activity change. The aim is (c) to comprehend potential implications of environmental change on the sustainability of peace and development.
We define environmental change as ‘changes in the physical and biogeochemical (chemical, geological, and biological) environment, over a large scale, either caused naturally or influenced by human activities’ (Foresight, 2011, p. 233). We acknowledge that this ‘natural’ environment is the result of socio-ecological relations between peoples and nature, and in this sense, vegetation is not only an ecological but also a social process (e.g. agriculture, natural vegetation in ‘protected’ areas or areas).
In this study, we first approach environmental change as vegetation activity changes and examine tendencies at sub-regional and district level for the conflict period (2002–2008) and post-conflict period (2008–2018). We also observe vegetation activity at regional level for the post-conflict period (2008–2018). Our descriptive analysis presents an assessment focused on the spatial distribution of vegetation activity trends during the last years of the armed conflict (2002–2008) and the subsequent years (2008–2018), using time series of satellite images as primary data. Secondly, we seek to understand environmental change by looking into possible drivers of vegetation activity change during the post-conflict period and in relation to the conflict period in four selected sub-regions (West Nile, Acholi, Lango, and Teso). For this part of the study, we use secondary data from land use and land cover (LULC) studies mostly from academic sources. We use LULC data to produce an explanatory analysis that would allow us to discuss the implication of vegetation activity change in the natural environment (e.g. ecosystem degradation, biodiversity loss, etc.). By examining these possible drivers as well as trends, we aim to comprehend the important contribution of the natural environment (e.g. natural resources) in sustaining peace and development. We consider these findings as propositions which would provide a foundation for future fieldwork-based research interested in environmental change in the region.
The results of our study show that environmental change might be both beneficial and detrimental to sustainable peace and development in Northern Uganda. The ongoing ‘greening’ process in the region that we observe might most likely be driven by agriculture expansion. Agriculture is certainly positive for food security and economic growth. However, the way this agriculture is organised and articulated with the natural vegetation will be central for its sustainability in the long term and for an equal distribution of the benefits of economic growth. If agriculture is motorised by large-scale monoculture of industrial crops in detriment of small-scale family-oriented crops and/or expands over forest and woodlands, biodiversity might be compromised along with ecosystem services central for local populations, for climate change mitigation and adaptation.
The article is structured as follows. In the first and second sections, we contextualised both conceptually and empirically our study. Consequently, in the third section we present our methodological approach. In the fourth section we present (a) an historical and spatial descriptive analysis of vegetation change at sub-regional and at district level, and (b) an explanatory analysis of tendencies and patterns observed on the four selected sub-regions, suggesting a potential explanatory model to understand vegetation activity change in Northern Uganda. In the fifth section, we discuss preliminary ideas arising from our analyses regarding (c) the potential implications of observed trends on the sustainability of peace and development, as well as identify areas for future research. In the final section, we conclude by presenting relevant issues for development policies in Uganda, particularly focussing on the Northern region, where peace is yet to be consolidated.
Conceptual and Empirical Context of Analysis
Prospects for Sustainable Peace and Development
The increasing recognition of the impact of armed conflicts on the natural environment has not gone unnoticed by the international peacebuilding community who have recently produced a vast number of studies on the central role of nature for peace. In particular, academic literature at the nexus of peacebuilding and development shows the relevance of incorporating nature or the environment (e.g. natural resources, ecosystem services, climate change) in consolidating and sustaining peace in the aftermath of armed conflict (Krampe et al., 2021), but also in conflict resolution (Waisová, 2017), peace-making (Conca & Dabelko, 2002) and peacebuilding (Brown & Nicolucci-Altman, 2022; Ide et al., 2023; Johnson et al., 2021).
From a policy point of view, the United Nations Environment Programme (UNEP) has been calling for the last decade to the United Nations Peacebuilding Commission and the international community in general to integrate natural resources and environmental issues and concerns into peacebuilding interventions and conflict prevention. UNEP (2009) argued then that conventional approaches to peacebuilding were often less interested in the inclusion of environmental concerns during post-conflict and peacebuilding stages. The programme set up six recommendations to move forward, four of these relate to the peace process, namely (a) addressing the natural environment in the peace process (peace-making and keeping), (b) integrating environmental issues in peacebuilding strategies, (c) employing natural resources for economic recovery, and (d) considering environmental cooperation for peace consolidation.
Utilising the natural environment for economic recovery puts the attention on the role of natural resources in economic growth and development in the post-conflict, provided that they are managed in a sustainable way: ‘[t]he international community should be prepared to help national authorities manage the extraction process and revenues in ways that do not increase risk of further conflict or are unsustainable in the longer term’ (UNEP, 2009, p. 5).
This has also been acknowledged by ACCS (2013, p. 66) when it was reported to the central Government of Uganda the need to ‘strengthen the environmental conservation policy and legal framework to promote sustainable and conflict-sensitive development’. Either conflict-sensitive development or environmental sensitive peacebuilding should account for sustainable peace and development. Unfortunately, however, the only framework policy that the GoU has crafted for the stabilisation, recovery, and development of Northern Uganda (the Peace, Recovery and Development Plan, PRDP) has been slowly leaving aside environmental management concerns since its inception in 2007 throughout its three different phases. While the first PRDP incorporated a particular area on Environment and Natural Resource Management Programme (under the strategic objective Revitalisation of the Economy) (GoU, 2007b), the latest PRDP (2015–2021) does not have such an area but instead suggests issues for intervention within the Strategic Objective Reduction of Vulnerability, such as reduction of charcoal usage (GoU, 2015a).
In this context, and since Uganda’s economy continues to be highly dependent on natural resources and ecosystem services (Twinomuhangi et al., 2022) observing historical trends and spatial patterns of environmental change – degradation and restoration – is central for understanding and planning policies conducive to sustainable peace and development.
The Natural Environment During Conflict and Post-conflict in Northern Uganda
During the second decade of the armed conflict between LRA and UPDF – around 1996 – people from Acholi sub-region were moved to internally displaced people’s camps (IDPC). The relocation of around 1.4 million people (UN, 2004) led to an uneven spatial distribution of natural resource overexploitation in camps and around them. This was observed by Nampindo et al. (2005) in a comprehensive study on the impact of the armed conflict on the environment and natural resources management in Northern Uganda. Based on mixed methods and the use of remote sensing technology to study woody cover in the country between 1985 and 2002, the report concluded that woodland was lost around towns (Gulu, Kitgum, Lira) and IDP camps due to natural resources overexploitation. The study not only pointed to internal migration as drivers of vegetation change, but also expanding human population and conversion of natural vegetation to farmland in the southern districts of the region (e.g. Lango).
The paradox is, nevertheless, that the armed conflict worked also as a driver for environmental protection (e.g. vegetation preservation or restoration) in other areas. Nampindo et al. (2005) showed that vegetation was restored in some of those territories where the LRA rebels were based, or with no easy access by most of the local population. This might explain the higher level of environmental conservation during that period: ‘[t]here is a large belt of increased woody cover west and north of Kitgum where the LRA has been most active and as a result it is clear that there has been some recovery of natural habitat as a result of the conflict’ (Nanpindo et al., 2005, p. 9).
The abandonment of some areas (both by people and livestock) and the concentration of population in others have been clear drivers of vegetation change, according Nanpindo et al. (2005). However, other factors might be explaining this unequal geography of environmental change, such as biodiversity loss (e.g. due to habitat destruction), population growth, expansion of urban settings and/or farmland, or temporal and spatial variations in the weather (e.g. making some areas more prone to droughts than others) the authors argued. In fact, Nampindo et al. (2005, p. 10) explain that the conflict in the north is not the only driver to explain changes in woody cover and that ‘other factors could include the loss of elephants from most of northern Uganda in the past 40 years, changes in climate and changes in human population numbers and density’. This might be indicating that ecological connections of Northern Uganda with other geographical regions could explain environmental change during conflict time and not only the consequences of the armed conflict itself (e.g. destruction of wildlife habitats that work as corridors).
From 2007, once the violence against civilians deescalated and people started leaving the camps, evidence shows that the Northern region of Uganda became the scene of socio-environmental transformations: urban growth, expansion of charcoal production, logging and high-value timber extraction, oil and mineral exploration and exploitation, agribusiness, land enclosure for nature conservation and the consolidation of new camps for displaced migrants from neighbouring countries (ACCS, 2013; Branch & Martiniello, 2018; NEMA, 2019).
Various factors, ranging from local to global scales, might explain the environmental changes occurring on the ground in Northern Uganda. According to academic research and policy reports, diverse processes of environmental change – mostly connected to vegetation degradation and biodiversity erosion – are motorised by the increased local population and the insertion of the region into the global economy. We observe, for example: (a) the expansion of farmland for local food production (NEMA, 2019), (b) the increasing charcoal exploitation for energy consumption mainly in Uganda but also bordering countries (Branch & Martiniello, 2018; Haysom et al., 2021), (c) the increasing oil, mineral and timber exploitation for foreign markets (NEMA, 2019), (d) the setup of camps for hosting Sudanese refugees (World Bank, 2018), (e) the expansion of large scale agriculture (monoculture plantation) for extra regional markets (Olanya, 2014) and (f) the enclosure of forests and savannas for biodiversity conservation and tourism (Serwajja, 2014). Urban population growth seems relevant to understanding processes of environmental deterioration in particular. According to UBOS (2021a) urban population in Uganda increased from less than one million persons in 1980 to about 3 million in 2002 and 7.4 million in 2014.
1
This trend translates also into land cover and use change, usually resulting in environmental degradation and biodiversity erosion. Li et al. (2016) observe that urban areas have increased with a growth rate of 52% at the national level between 1996 and 2013. In the context of Northern Uganda, it can be observed clear gains in urban land uses, remarkable in Acholi sub-region where there has been 327% increment of urban land area during the period of 1996–2013, but also in neighbouring Lango sub-region during the same period (Li et al., 2016). According to Li et al. (2016, p. 262) ‘the war economy and the subsequent growth and development of Internally Displaced People’s camps (IDPs) which have been upgraded to urban centres explain the observed patterns of growth in Acholi region’. The distribution of densely populated areas in Uganda is shown in Figure 1 where estimates of population density is projected to 2020 (CIESIN, 2018). Uganda. Estimated population density by km2 in 2020. Selected sub-regions for the analysis mentioned.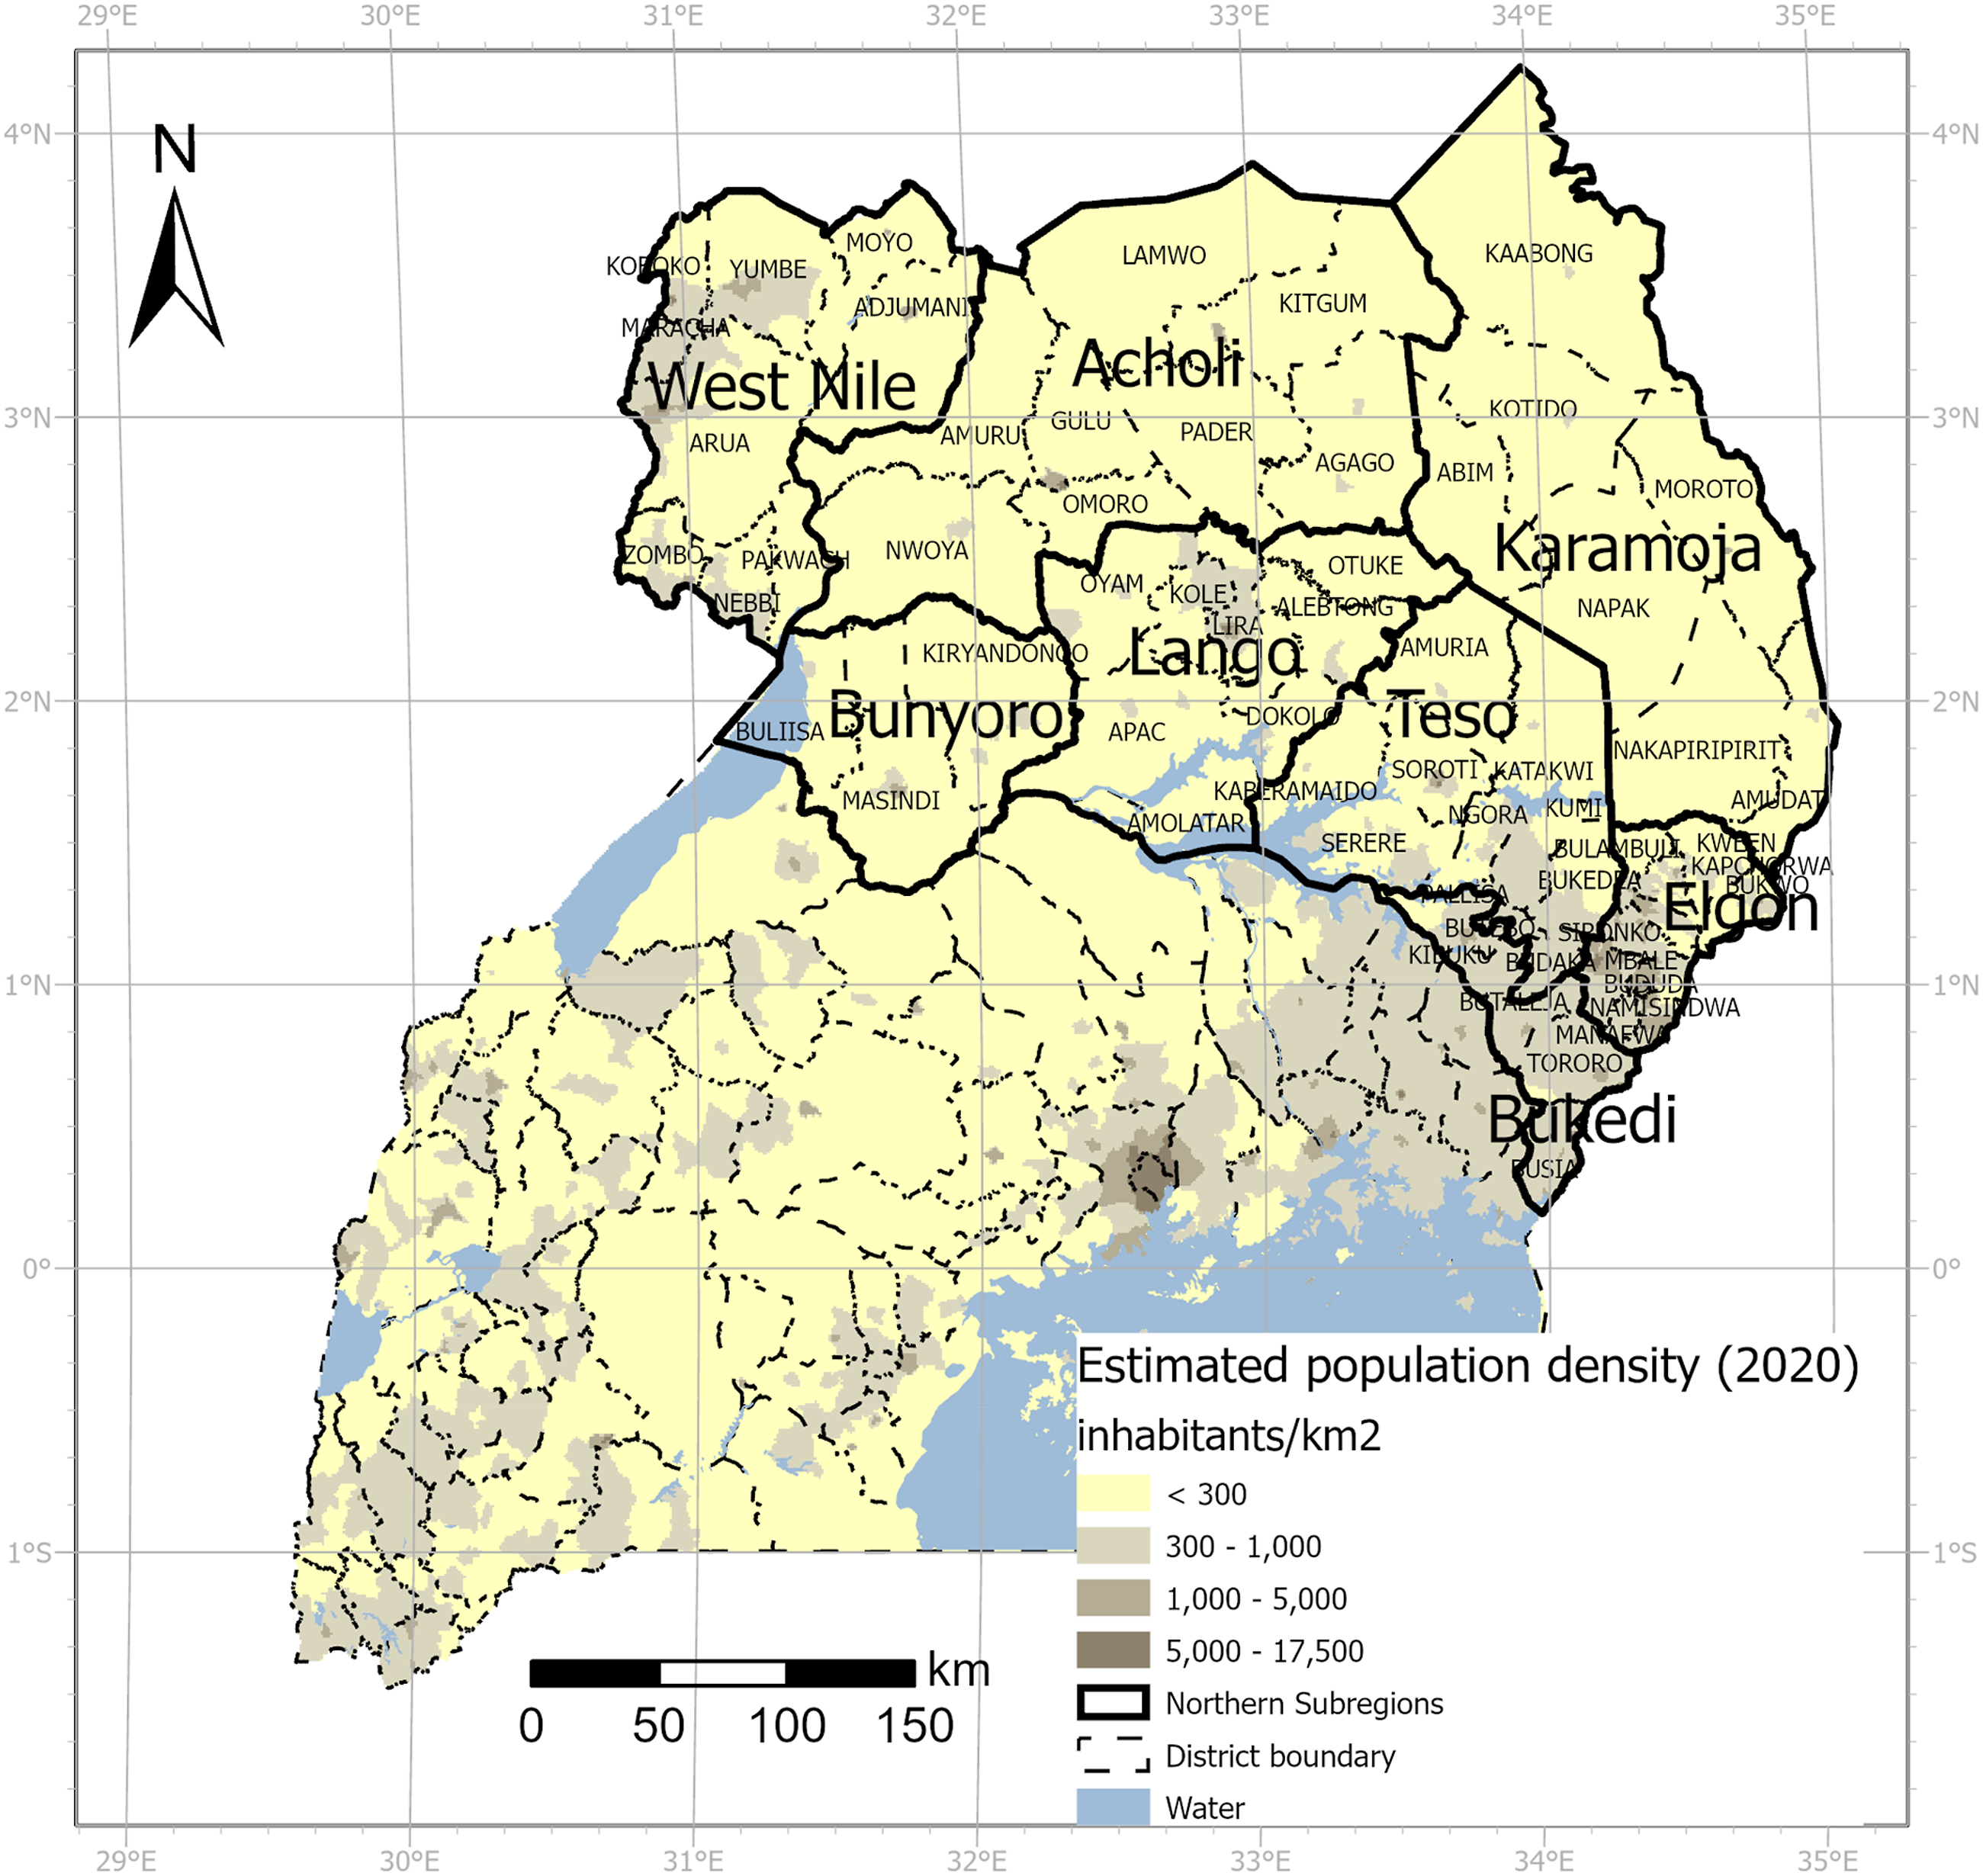
Most of the population of Uganda uses biomass as the main energy source (GoU, 2015b; UBOS, 2021b). In Northern Uganda, evidence shows that savannas and forests restored during the conflict turned into a rich source of charcoal during post-conflict, particularly to be traded outside the region (Ochola, 2021 among others). TNH (2015) reports that this is particularly the case due to regions previously supplying Kampala were already totally depleted.
Branch and Martiniello (2018) observe that during the post-conflict and peacebuilding period, new actors arrived in the Northern region and scaled up natural resource extraction and trade, for charcoal production and valuable timber logging. The fragile land tenure and unstable land access seems to be pushing people to cut down trees or overexploit soils as they are uncertain about the long-term access to natural resources from their land plots (Mugizi & Matsumoto, 2021). This has further accelerated an environmental degradation process, according to different sources (Branch & Martiniello, 2018; Ochola, 2021; Owiny, 2019; TNH, 2012).
Unsustainable charcoal production has been reported in Acholi (Ochola, 2021; The Independent, 2019), West Nile (The Independent, 2022), Lango (Zainabu, 2016) and Teso (Omagor, 2021) to name a few of the Northern sub-regions where charcoal is produced and traded in and out of the region. The overexploitation of timber and charcoal production is recognised as one of the major environmental concerns in the North region. Branch and Martiniello (2018, p. 242) assert that ‘charcoal production, and its particular destructiveness, should be understood as a continuation of the violence of the 1986-2006 war between the Lord’s Resistance Army and the Ugandan government’.
According to MWE (2016) during the period 2010-2015, an estimated number of 250,000 ha of forest per year were lost in the entire country, while between 1990 and 2015, the annual average of lost forest was 122,00 ha. At the same time, forest cover outside protected areas was reduced from 3,331,090 ha in 1990 by 34% in 2005 (1.15 million hectares) and by 68% between 2005 and 2015 (1.5 million hectares) (MWE, 2016). This might be indicating that areas with high vegetation cover (both forests and grasslands) have been subject of exploitation during peace times (post-conflict period) in the country.
Activities around oil exploration and exploitation along the Albertine Rift have been reported to be detrimental for natural vegetation and polluting (NEMA, 2019). According to Li et al. (2016), for instance, construction activities (e.g. roads, bridges, pipelines, refineries) might explain losses in forest cover in Acholi region.
Methodology
Introduction
We are particularly interested in environmental change in Northern Uganda for two reasons. First, the internal armed conflict between the LRA and NRM/UPDF (later GoU) was the longest in time in Uganda (Branch, 2011). From an environmental approach, this is relevant because time is central to understanding certain ecological processes such as forest restoration or deterioration, and the environment-related peace challenges and opportunities after the conflict during peacetimes. Second, the conflict was characterised by mass displacement of people into camps which resulted in an uneven geographical pattern of environmental degradation and conservation (OHCHR, 2008).
The environmental change study presented here is based on analysis of data produced by Earth Observation (EO) satellites and focused literature review. We produced a mixed methodology to address the three concerns introduced earlier: (a) how vegetation activity has changed in Northern Uganda during and after the armed conflict, (b) possible environmental change drivers explaining such vegetation activity change, and (c) possible implications of environmental change on sustainable peace and development.
Firstly, our study is grounded on spatio-temporal descriptive analyses of changes in vegetation photosynthesis derived from satellite registrations, and secondly in an explanatory analysis of observed patterns and trends using secondary data from literature review.
Our first objective was to assess the spatial distribution and trends of vegetation (photosynthetic) activity between our periods of analysis. Such changes (temporal tendencies and spatial distribution of photosynthesis activity) are recorded and can be analysed through satellite data. Our second objective was to explain the resulting spatial patterns and historical tendencies (e.g. drivers, possible cause-effect relationships, etc.) based on secondary data. We review academic publications, grey literature and news articles published online and in English focused on records and studies on land use and land cover change in Uganda, and the Northern region in particular, for both qualitative and quantitative data. Finally, our third objective was to discuss potential implications of environmental change on the sustainability of peace and development, so we interpret our findings at the light of current discussions about the role of nature or the environment in sustainable peace and development and based on the evidence produced in our analyses. Our interpretation is propositive as we understand further research is needed.
In the following subsections, we delimit our study in space and time and explain our methodological approach.
Spatial Delimitation of Analysis
The conflict-affected areas in the country were clearly specified at the end of the armed conflict in the Comprehensive Solution Agreement between LRA and the Government of Uganda, signed in 2007 (GoU, 2007a). The document defines Acholi, Lango, Teso and West Nile as the conflict-affected sub-regions. However, the Peace, Reconstruction and Development Programme (PRDP) framework policy designed and implemented between 2007 and 2021 had a broader geographical focus.
In this context, our descriptive analysis is focused on the Northern region as defined by the PRDP (eight sub-regions: Acholi, Lango, Teso, West Nile, and Karamoja, Elgon, Bukedi and north of Bunyoro) with all the districts included (except Bunyoro) (as shown in Figure 1). However, for our explanatory analysis we focus on the most affected sub-regions according to GoU (2007a): Acholi, Lango, Teso, West Nile with all their districts included. Since new districts were created after the conflict, we use the districts by the time the cartography was retrieved. Digitalised cartography was retrieved in 2018 from GEOSS (2018). The final districts considered for the descriptive analysis are those in Figure 4.
Temporal Delimitation of Analysis
We constructed two periods of analysis in order to observe tendencies in vegetation activity during and after the conflict. Our first period of analysis (2002–2008) was the period ‘during the conflict’. We decided to use 2008 as the end of the conflict because hostilities on the ground decreased by then when LRA moved out of the country (Schomerus, 2012). Our second period of analysis or the ‘post-conflict’ period (2008–2018) starts in 2008 until 2018, the full year of data that was available at the moment we started data collection.
Primary Quantitative Data Generation
It is worth emphasising that we study changes in vegetation activity, and do not present an analysis distinguishing the type of vegetation. This is because we look into biological activity (photosynthetic activity) that results from both natural and planted vegetation (agriculture). In this sense, increase/decrease vegetation activity does not mean there is an increase/decrease in natural vegetation or biodiversity. Nevertheless, photosynthetic activity is a valid proxy for studying the status and change of vegetation as we will show later.
EO satellites have been in use since the 1970s to study the Earth’s surface. Energy reflected from the earth’s surface is measured by sensors onboard the satellite and is quantified in discrete wavelength bands (e.g. red, green, blue, near infrared) providing multi-spectral satellite images. It has been shown that the ratio between measured radiance in the red and the infrared wavelength bands is related to photosynthetic activity and a vegetation index can be calculated that are of common use to monitor vegetation conditions and characterising biophysical properties and processes (Didan, n/d). Such indices are commonly used as proxies for studying yield and biophysical production, leaf area index (LAI), canopy greenness, vegetation coverage, and plant phenology (Gitelson, 2004; Hongxiao & Eklundh, 2014; Liu et al., 2021; Xue & Su, 2017). One of the most commonly used indices is the Normalised Difference Vegetation Index (NDVI) which have been used to study vegetation dynamics and phenology (e.g. Gitelson, 2004; Gonsamo & Chen, 2016; Pettorelli et al., 2005), and trends in vegetation greenness in diverse geographical contexts (e.g. Chen et al., 2018; Eckert et al., 2015; Li et al., 2018; Wang et al., 2019).
We retrieved a time series of bi-monthly NDVI images derived from the Moderate resolution Imaging Spectroradiometer (MODIS) covering Uganda at 1 km2 pixel resolution between January 2002 and December 2018. The MOD13A2 NDVI data is available as one raster image every 16-day period at 1 km2 pixel resolution providing a quantified NDVI value in each 1 km2 pixel twice a month. The NDVI value is unit-less and low positive values (e.g. 0.1–0.2) indicate very low vegetation activity in the pixel, whereas high values (0.6–0.7) indicate high vegetation activity. NDVI saturates at about 0.8–0.9 and 1 is the maximum value (GisGeography, 2024). The photosynthetic activity expressed as NDVI could hereby be explored in Uganda throughout the time series (2002–2018).
Based on our scale of analysis – focused on the sub-regional and district level – we have selected 1 km2 as the spatial resolution to work with. Therefore, higher spatial resolution than 1 km2 was not deemed necessary for the construction of NDVI maps.
MODIS NDVI Reliability and Derived Trends
NDVI has been used in numerous studies and shown to be a reliable proxy for vegetation dynamics, stress, and phenology. The available time series of NDVI used in this study provides bi-monthly NDVI at 1-km2 pixel scale and has been calibrated and atmospherically corrected to construct a reliable and consistent time series for EO monitoring. The coarse pixels however may contain different land uses and therefore it is not possible to evaluate what type of land use or vegetation type a pixel contains. On the other hand, photosynthetic activity is quantified through the NDVI that can be used to evaluate different vegetation proxies. The reliability of trends depends on the number of data points in the time series, and we stand honestly that by splitting the time series (2002–2018) into two separate periods, the number of data points to calculate the trend can be considered too few data points in the conflict period. For the post-conflict period we used 11 data points, and the trend has higher reliability.
Calculation of Mean NDVI and NDVI Trends and its Representation
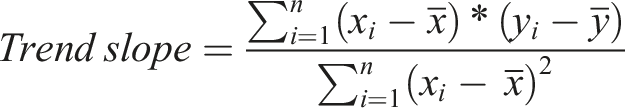
The bi-monthly NDVI data time series was analysed regarding annual phenology of vegetation together with climate data in the Northern sub-regions, in order to pinpoint the best representable vegetation growth peak period every year for the period of analysis (WBG, 2021). This turned out to be the Mid-May, June, and July (MMJJ) images, which we aimed to compare through the time series in order to study how vegetation activity had changed. We used the Geoprocessing tools available in ESRI’s ArcGIS Pro 2.7.3. Thus, we constructed an NDVI annual footprint image of the vegetation peak activity by calculating the mean value of the registrations in MMJJ (five bi-monthly images) each year. This image was used to calculate a mean vegetation peak NDVI image showing the distribution of vegetation peak NDVI activity (Figure 2). Additionally, the trend slope was calculated based on the annual vegetation peak images representing the inter-annual change using the least square method of the linear regression to analyse the spatial distribution of the vegetation peak NDVI trends, using the following formula: Uganda: selected sub-regions. Spatial distribution of mean NDVI during post-conflict period (2008–2018).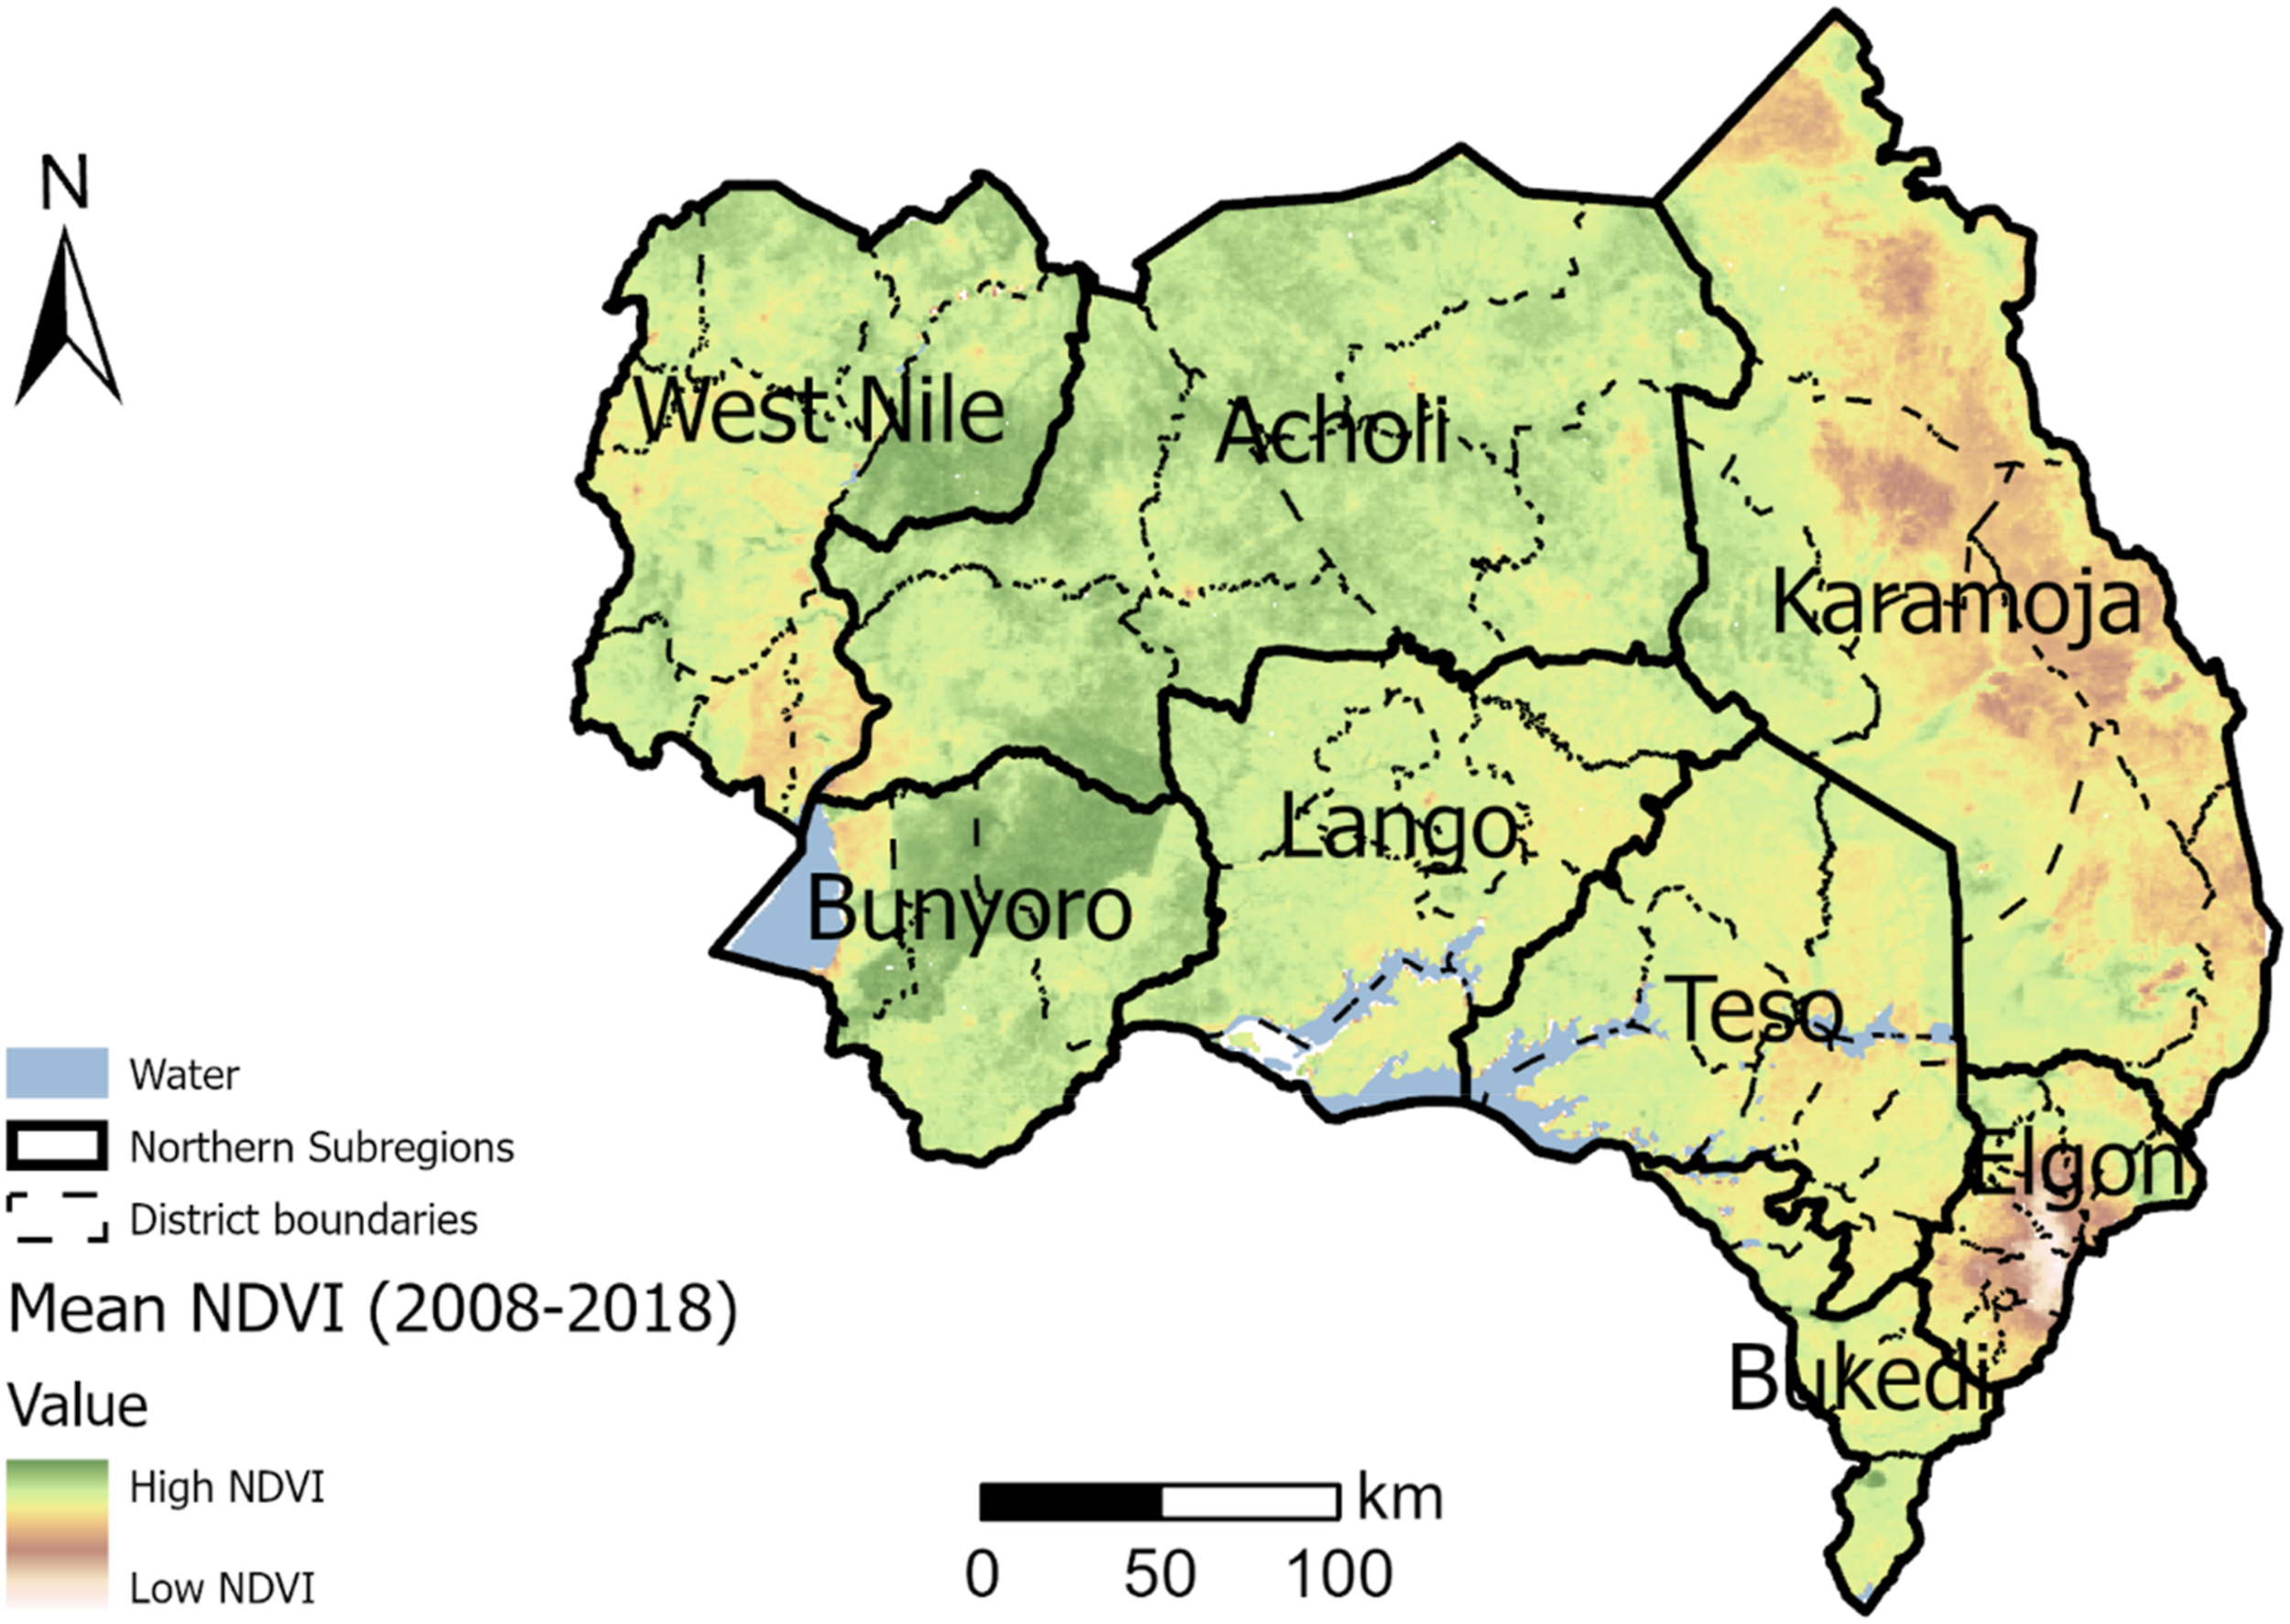
When calculating the NDVI trends, we split the 17 annual NDVI footprint images (2002–2018) into two separate time periods: (i) 2002-2008 (conflict period) and (ii) the 2008-2018 (post-conflict period). In each 1 km2 pixel the slope of the linear trend was calculated to express the annual change in NDVI units (positive or negative) through each of the two periods (conflict/post-conflict).
The trend values presented in the maps (Figure 3 and Figures 5–8) and statistics show the gain value of the linear trend and indicate the annual change of NDVI in every pixel. To exemplify this; if the trend value is + 0.01 for the post-conflict period (2008-2018 = 11 years) it indicates that NDVI in the pixel would have changed 0.11 units during the time period, for example, NDVI changed from 0.20 to 0.31. Uganda: selected sub-regions. Spatial distribution of NDVI trends’ slopes during the conflict period (2002–2008) (A) and during post-conflict period (2008–2018) (B).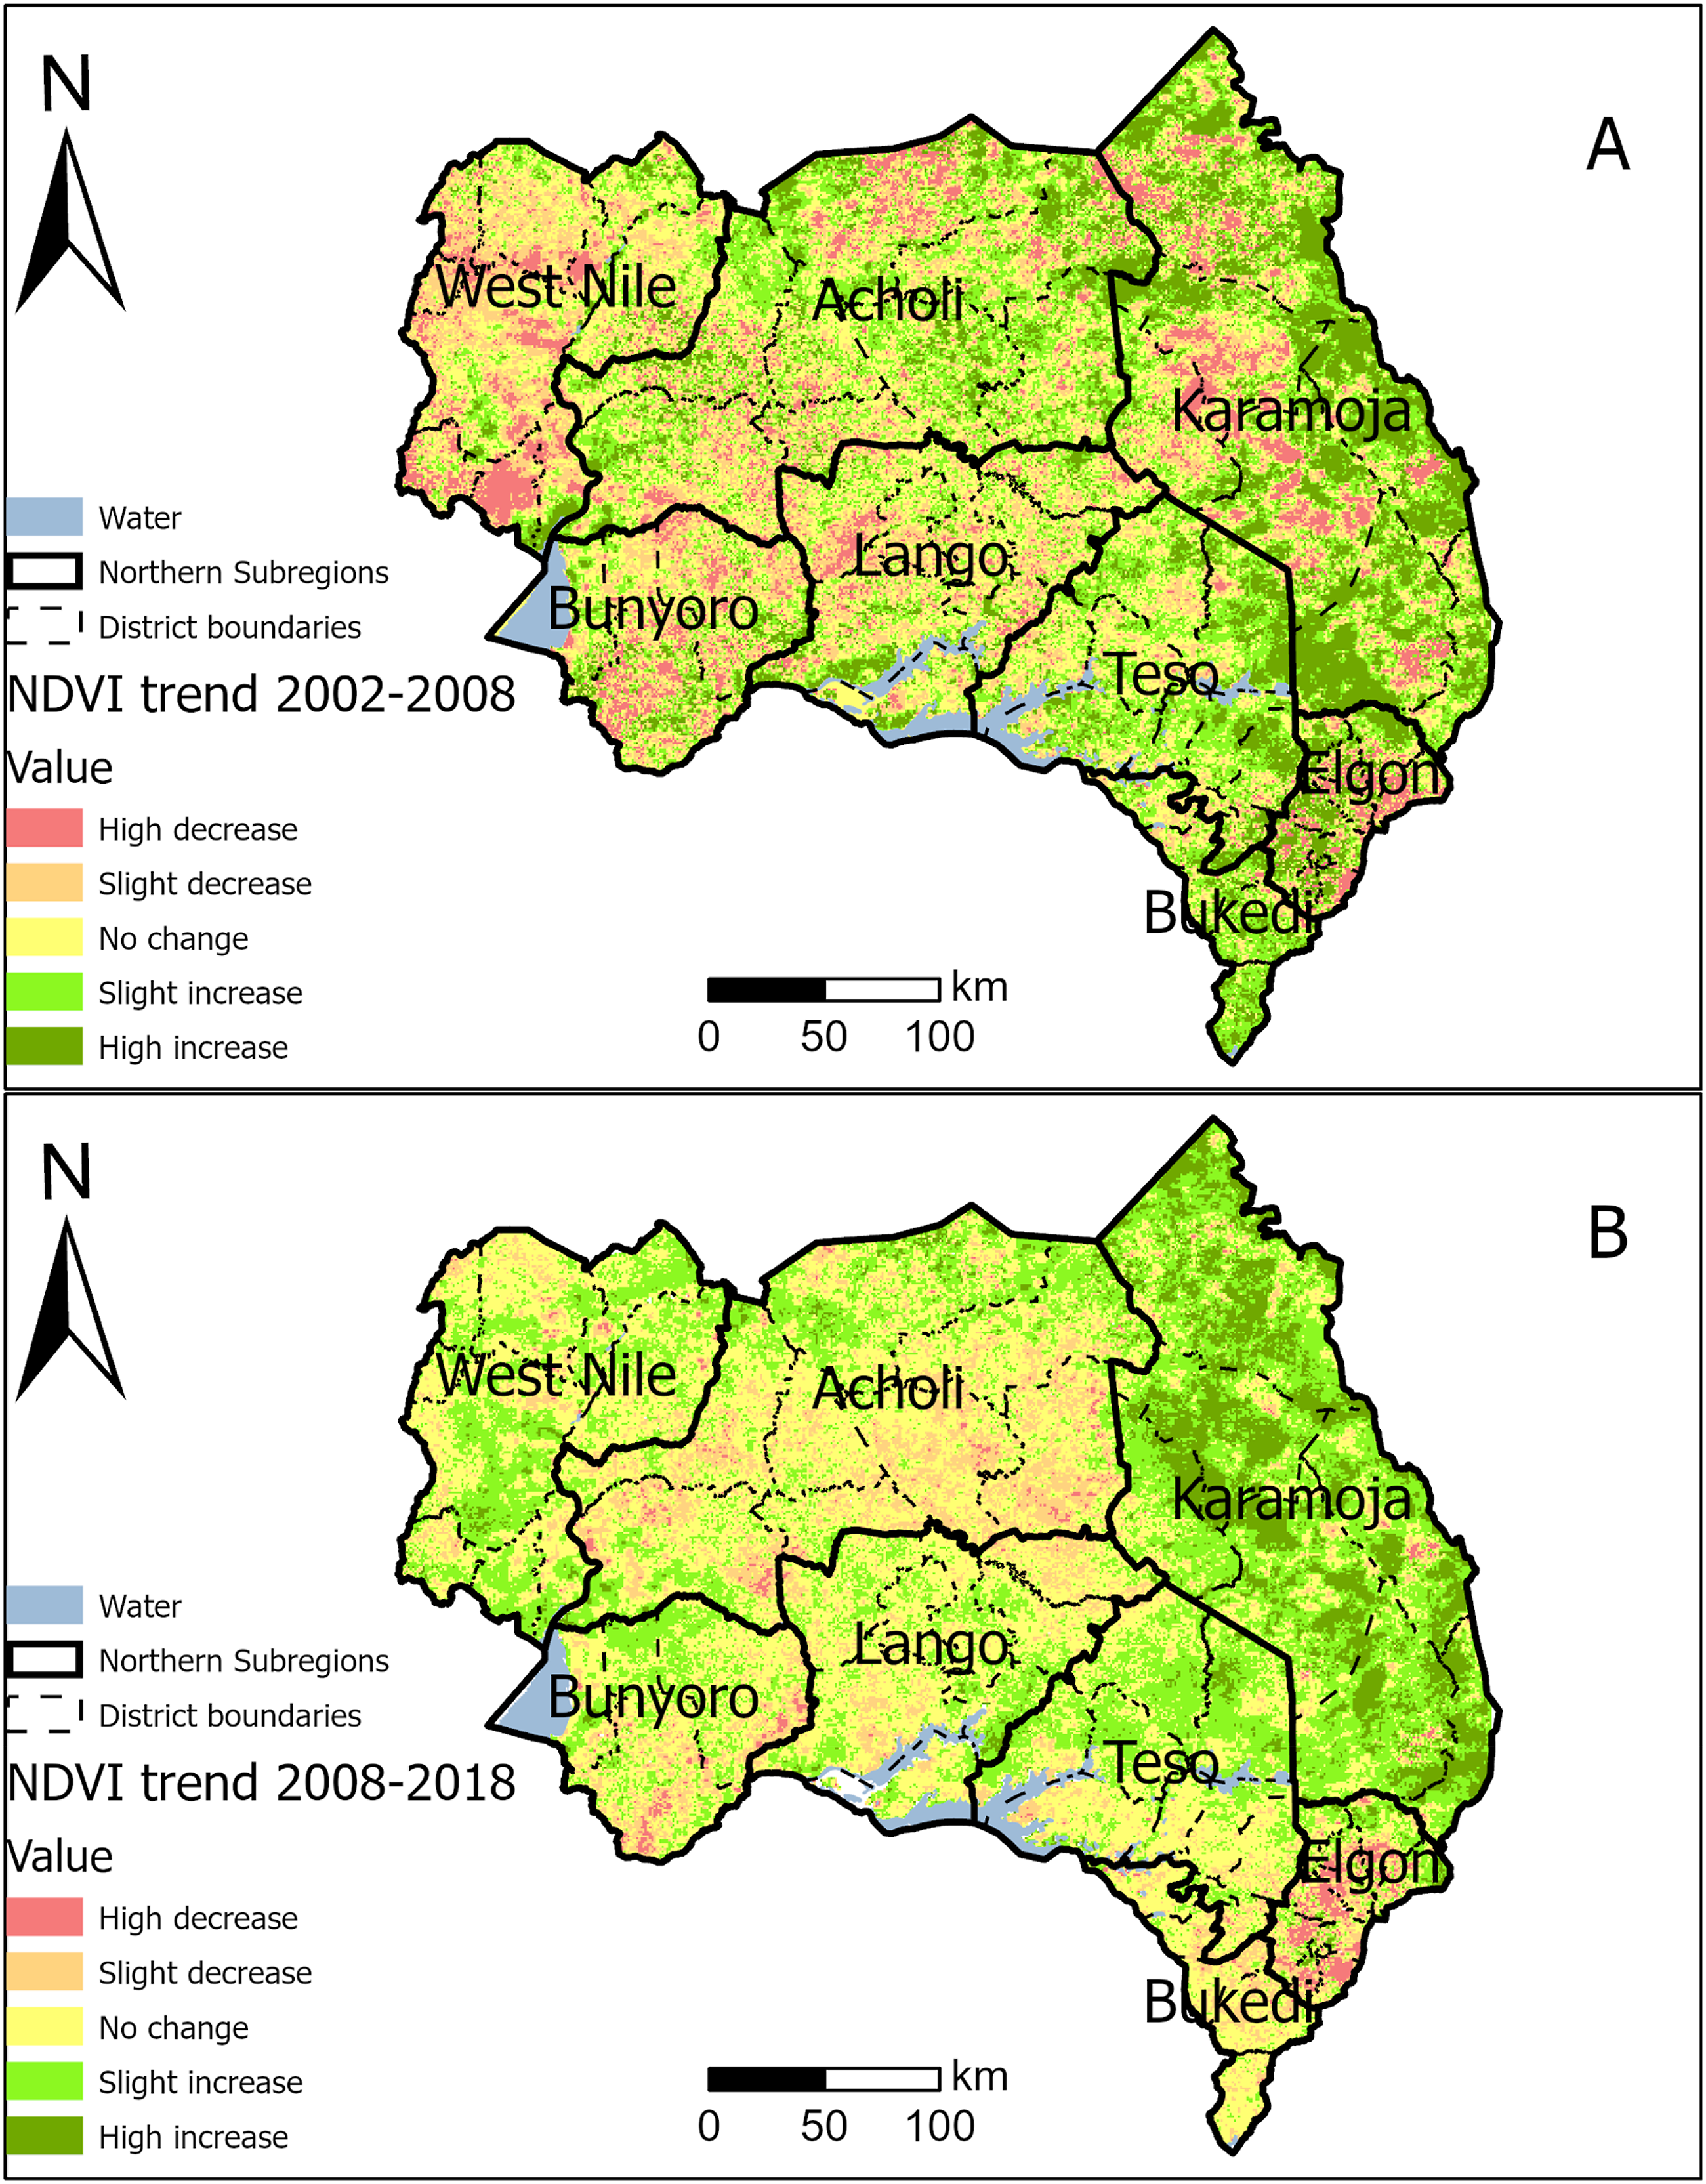
The trend slope values in all NDVI trend maps (Figure 3 and Figures 5–8) have all been classified manually into five classes to be visually comparable. High decrease – in red – are trend slope values below or equal to −0.01. Slight decrease – in orange – are values above −0.01 and below or equal to −0.003. No change – in yellow – are values above −0.003 and below or equal to 0.003. Slight increase – in light green – are values above 0.003 and below or equal to 0.01. High increase – in dark green – are values above 0.01.
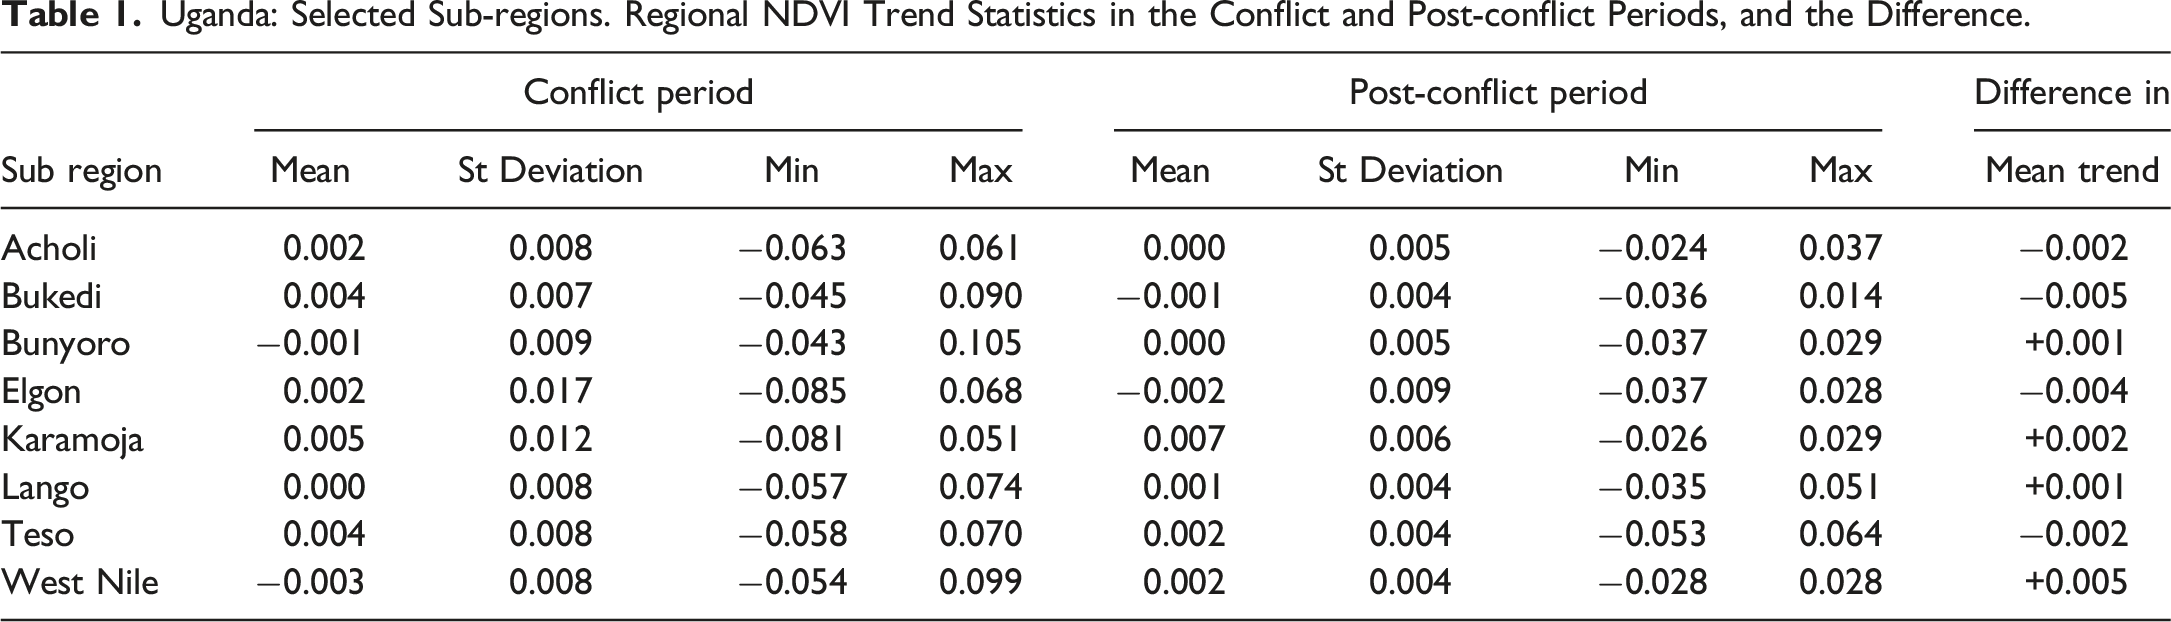
Uganda: Selected Sub-regions. Regional NDVI Trend Statistics in the Conflict and Post-conflict Periods, and the Difference.

Uganda: selected sub-regions and districts. NDVI trends at district level for conflict period (2002–2008) and post-conflict period (2008–2018). The mean NDVI trend is marked by , and the ±1 standard deviation are provided as a line for each district).
Secondary Quantitative and Qualitative Data Generation
Our methodological approach to study possible drivers that would explain NDVI change during our periods of analysis is based on secondary data. For this, we conducted an online search and make use of academic publications (peer-reviewed articles, book chapters, and PhD dissertations), grey literature (NGO reports, donors’ assessments, think tanks communications, opinion pieces, etc.) and news articles (mainly in Ugandan news sites) in English. As in snowball sampling, reference material in publications was searched.
The literature review was focused and guided by our interest in contextualising post-conflict environmental challenges and conflicts in Northern Uganda. We were particularly interested in studies discussing LULC in the region as we considered that land use and cover tendencies are central to explain vegetation change. We therefore used keywords such as ‘environment’, ‘natural resources’, ‘land cover’, ‘land use, ‘ecological restoration’, ‘forest deterioration’, ‘soil conservation’, ‘environmental protection’ among other keywords intersecting with ‘Uganda’ or ‘north Uganda’ or a particular sub-region (e.g. Acholi, Lango) or district (e.g. Gulu, Lira) when doing the online search.
The selected material was used to construct a narrative about possible drivers of vegetation change that would explain our observations in the first part of the study (NDVI analysis). Secondary quantitative and qualitative data was produced by this literature review when applicable. Both types of analyses were then interpreted from the previously presented conceptual framework at the nexus of environment, peacebuilding, and development.
Results
Descriptive Analysis of Vegetation Activity
Spatial Distribution of Mean NDVI in Northern Uganda in the Post-conflict Period
The spatial distribution and strength of vegetation activity (NDVI) during the post-conflict period of analysis can be seen in Figure 2. This figure provides a good overview of spatial distribution of vegetation abundance and scarcity in the post-conflict period 2008-2018.
In north Bunyoro, Murchison Falls National Park stands out due to very active vegetation activity in the post-conflict period. High photosynthetic activity is further visible in some parts of West Nile and Acholi sub-regions. On the contrary, in the north-east, Elgon and Karamoja sub-regions vegetation activity is low in the post-conflict period.
Spatial Distribution of NDVI Trends in Northern Uganda in the Conflict and Post-conflict Periods
It becomes visually apparent when comparing the NDVI trend maps (Figure 3) that areas with positive trends (in green) are more abundant in the post-conflict period (B) in comparison to the conflict period when larger areas show negative trends (in red) (A).
At this scale of analysis, it is then possible to conclude that Northern Uganda has been turning greener after the cessation of hostilities (B). In the drought stricken Karamoja a ‘greening’ process seems to be taking place since the conflict ended and during the period of analysis (2008–2018), contrary to the conflict period when large extents of areas showed negative trends in vegetation activity (2002–2008).
Descriptive statistics for the sub-regions’ NDVI trends are provided in Table 1. In general terms, we observe that half of the sub-regions under study (four out of eight): north of Bunyoro, Karamoja, Lango, and West Nile have increased vegetation activity between the conflict and post-conflict periods. West Nile stands out due to the larger difference in mean NDVI trend indicating a positive change in vegetation activity.
On the contrary, the remaining four sub-regions show a reverse trend from positive during the conflict period to negative in the post-conflict period or decreasing positive trends, namely, Acholi, Bukedi, Elgon, and Teso. Two sub-regions stand out in this regard – Bukedi and Elgon – due to the greater difference in the mean NDVI trend in comparison with the rest of the sub-regions.
It is evident that both positive and negative trends are found at the sub-regional level, and therefore we explored the NDVI trends statistics at another scale, at district level (Figure 4).
At district level (Figure 4) it is noticeable that most of the area from all the districts in West Nile and Karamoja sub-region have turned negative or stable NDVI trends in the conflict period into positive ones in the post-conflict period of analysis. Karamoja shows the highest positive trends in all its districts during the post-conflict period where no negative cases are found. On the contrary, all districts in Bukedi and most in Elgon show opposite trends between the periods studied. Elgon sub-region stands out due to the severity of the negative trends in the post-conflict period in comparison to all the districts studied.
During the conflict and post-conflict period of analysis, districts in Lango show dissimilar NDVI trends on average as in the case of districts in Acholi, with some districts presenting negative and others, positive trends. The districts in Teso show that high positive trends during the conflict period have changed to moderate but still positive trends in the post-conflict period.
Finally, a common pattern in all districts studied is that there is less variation of extreme (positive-negative) NDVI trends in the post-conflict period of analysis in comparison to the conflict period of analysis. This is evidenced by the statistical analysis which shows that the standard deviation is smaller in the post-conflict period compared to the conflict period.
Explanatory Analysis of Vegetation Activity
Introduction
In this section, we seek to move beyond the analytical descriptions presented above and bring a possible explanatory analysis of the vegetation activity trends described. There are two issues that stand out from our descriptive study: (a) many areas in the Northern region have become ‘greener’ (Table 1 and Figure 4) and (b) the standard deviation of NDVI trends within each sub-region has shortened (Figure 4).
First, in relation to the ‘greening’ of the environment in Northern Uganda, we consider that two drivers might be explaining this. Studies conducted around our second period of analysis (2018) show that agricultural land has been expanding in the region, sometimes in detriment of woodlands and forest (Li et al., 2016; NEMA, 2019; Oguzu et al., 2018). As mentioned earlier, agricultural land has increased, particularly in West Nile and Karamoja according to Li et al. (2016). Oguzu et al. (2018, p. 353) mention various policies and interventions put in place by the government of Uganda to promote and support farming in the Northern region aiming at ‘boosting agriculture through provision of inputs like improved seeds and seedlings, hoes, tractors and ox ploughs, among others’.
Second, the shortening of the variation of NDVI trends means that extreme cases of positive-negative trends became more evenly distributed across space in the Northern region. We consider this might be explained by a more equal distribution of vegetation growth/deterioration, compared to previous unequal geographies of environmental change during the armed conflict.
Based on the literature reviewed, our proposition to explain this is that the relocation of people from IDPC back to their lands and the expansion of economic activities in the Northern region during post-conflict meant a de-concentration of resource exploitation, the degradation of previously preserved areas, the restoration of vegetation in conservation sites, and the expansion of agriculture or other types of vegetation growth (e.g. grasslands, planted forests, etc.) (ACCS, 2013; Kaguta, 2022; Li et al., 2016; Luwa et al., 2020; Mugizi & Matsumoto, 2021; NEMA, 2016, 2019; Olanya, 2014).
In addition, the expansion of infrastructure and urban centres (including refugee camps) (Li et al., 2016) might be explaining hotspots of vegetation deterioration.
Our spatial focus of analysis now turns to the four selected sub-regions and their districts: West Nile, Acholi, Lango, and Teso.
West Nile Sub-region
West Nile sub-region stands out because mean NDVI trends in the conflict period (2002–2008) were negative in all its districts (except for Adjumani and Moyo that show no changes) and this was reversed in the post-conflict period when all the districts show positive mean NDVI trends (Figure 5). We propose that the ‘greening’ trend in West Nile might be attributed to the conversion of degraded forestlands to crop lands and the shift from subsistence to commercial/plantation farming (Li et al., 2016). West Nile sub-region, Uganda. Spatial distribution of NDVI trends during conflict (2002–2008) (right) and post-conflict (2008–2018) (left). Trend statistics from Figure 4 (below).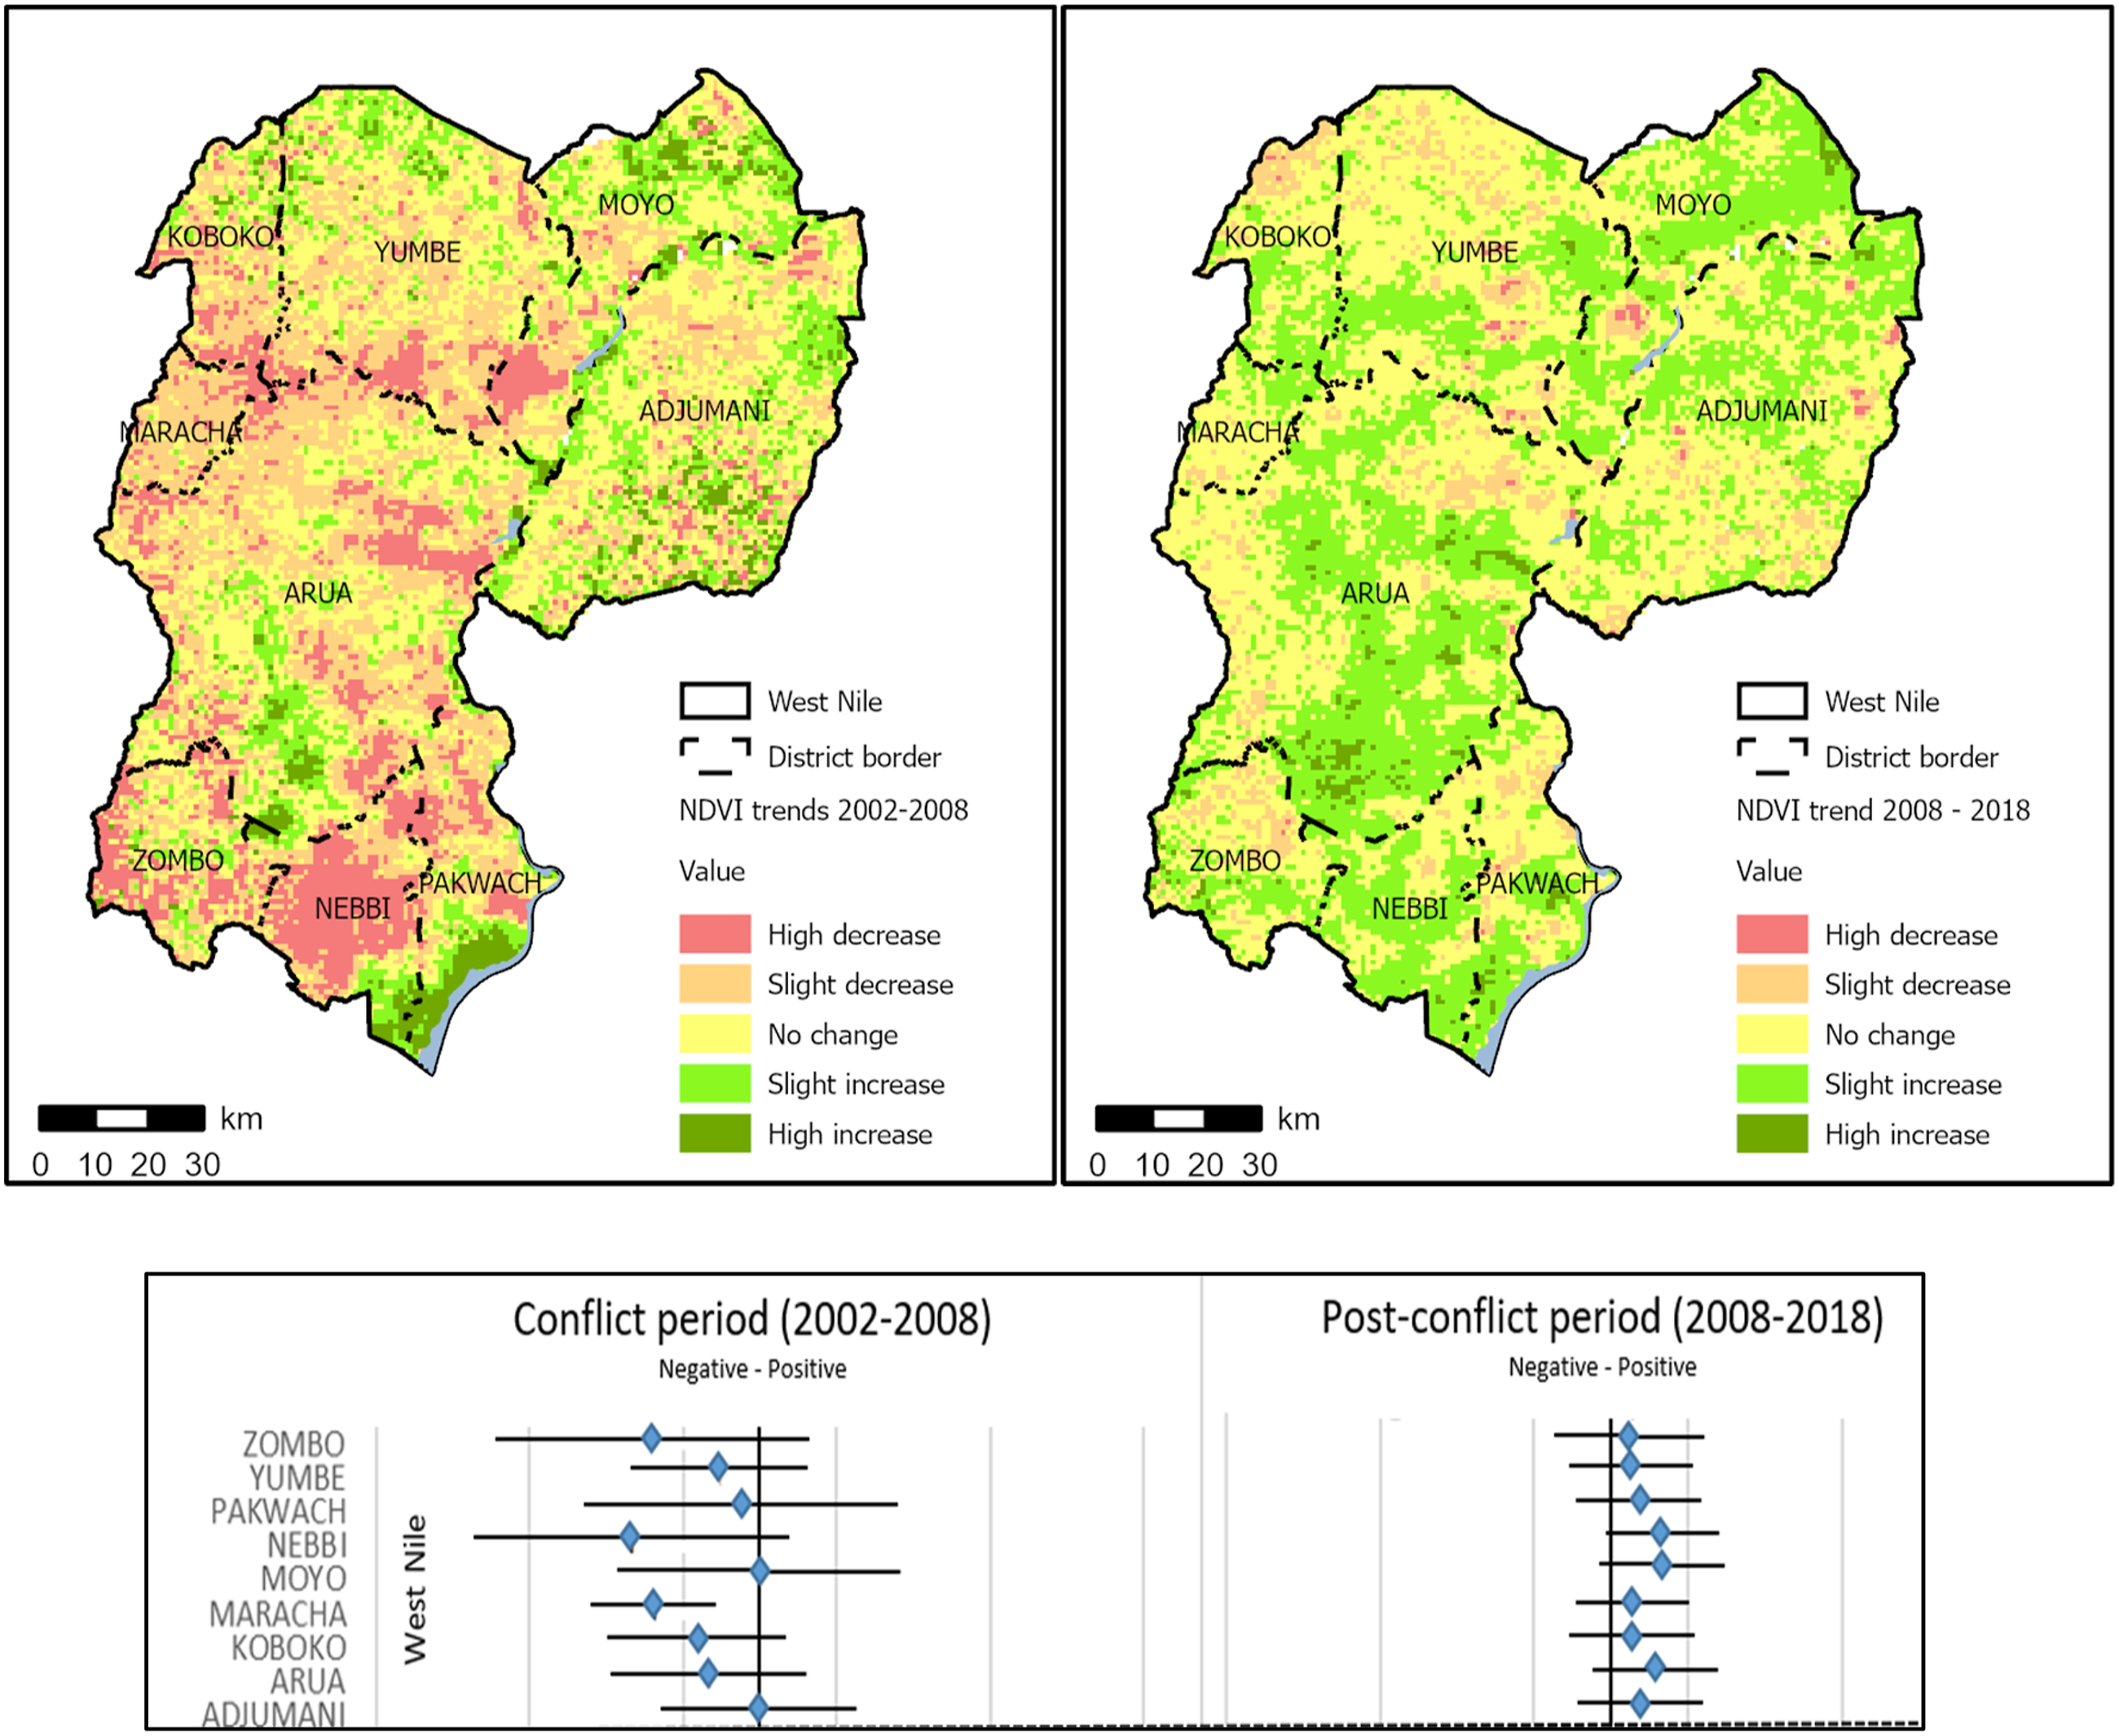
Negative NDVI trends (shown in red) during the conflict period might be attributed to forest degradation. Li et al. (2016) note that the boom in smoked fish trade between 1990 and 2000 resulted in overexploitation of forests for fuel wood, leading to a loss of over 70% of forest cover along the Nile during that period. But other drivers might explain the ‘redness’ of West Nile before 2002, such as population growth, including the influx of refugees into camps, which greatly contributed to resource extraction and vegetation deterioration (Hughes et al., 2020), particularly in woodlands of Adjumani and Moyo districts (GoU, 2015b). However, both districts showed an increase in vegetation activity in the post-conflict period of analysis. The discovery and exploration of oil and gas in the Albertine rift has also negatively impacted natural vegetation albeit more localised in West Nile.
Nebbi district experienced the highest decrease in vegetation during the conflict period, similar to Zombo, indicating extensive degradation in almost all the surface of the district (similar to Maracha). Deforestation for charcoal production and agricultural expansion likely explain the observed patterns in Nebbi, where shea butter trees can be found (NEMA, 2019). However, in the post-conflict period, positive vegetation activity reversed the trend.
We propose that deterioration of woodlands and forests due to resource extraction for fuel and housing might be explaining the ‘redness’ of West Nile in the conflict period 2002-2008. Conversely, the greening of the sub-region until 2018 might be attributed to increased agricultural area.
Similar to the overall trend in the Northern region, West Nile showed a decrease in extreme cases of vegetation deterioration/growth at the district level. Localised situations of vegetation deterioration (red hotspots) might likely be associated with areas hosting refugee settlements, known for high levels of resource extraction and conflicts with hosting communities (Barasa et al., 2020; Okiror, 2019).
Acholi Sub-region
This sub-region shows dissimilar trends at district level. We propose that the negative NDVI trend in some areas after the conflict might be explained by the conversion of natural vegetation – restored during the armed conflict – to agricultural land or urban land use, which also increased between 1996 and 2013 in Acholi (Li et al., 2016).
As the general trend, Acholi sub-region shows a decrease in extreme cases of vegetation deterioration/growth at district level (Figure 6). Acholi sub-region, Uganda. Spatial distribution of NDVI trends during conflict (2002–2008) (right) and post-conflict (2008–2018) (left). Trend statistics from Figure 4 (below).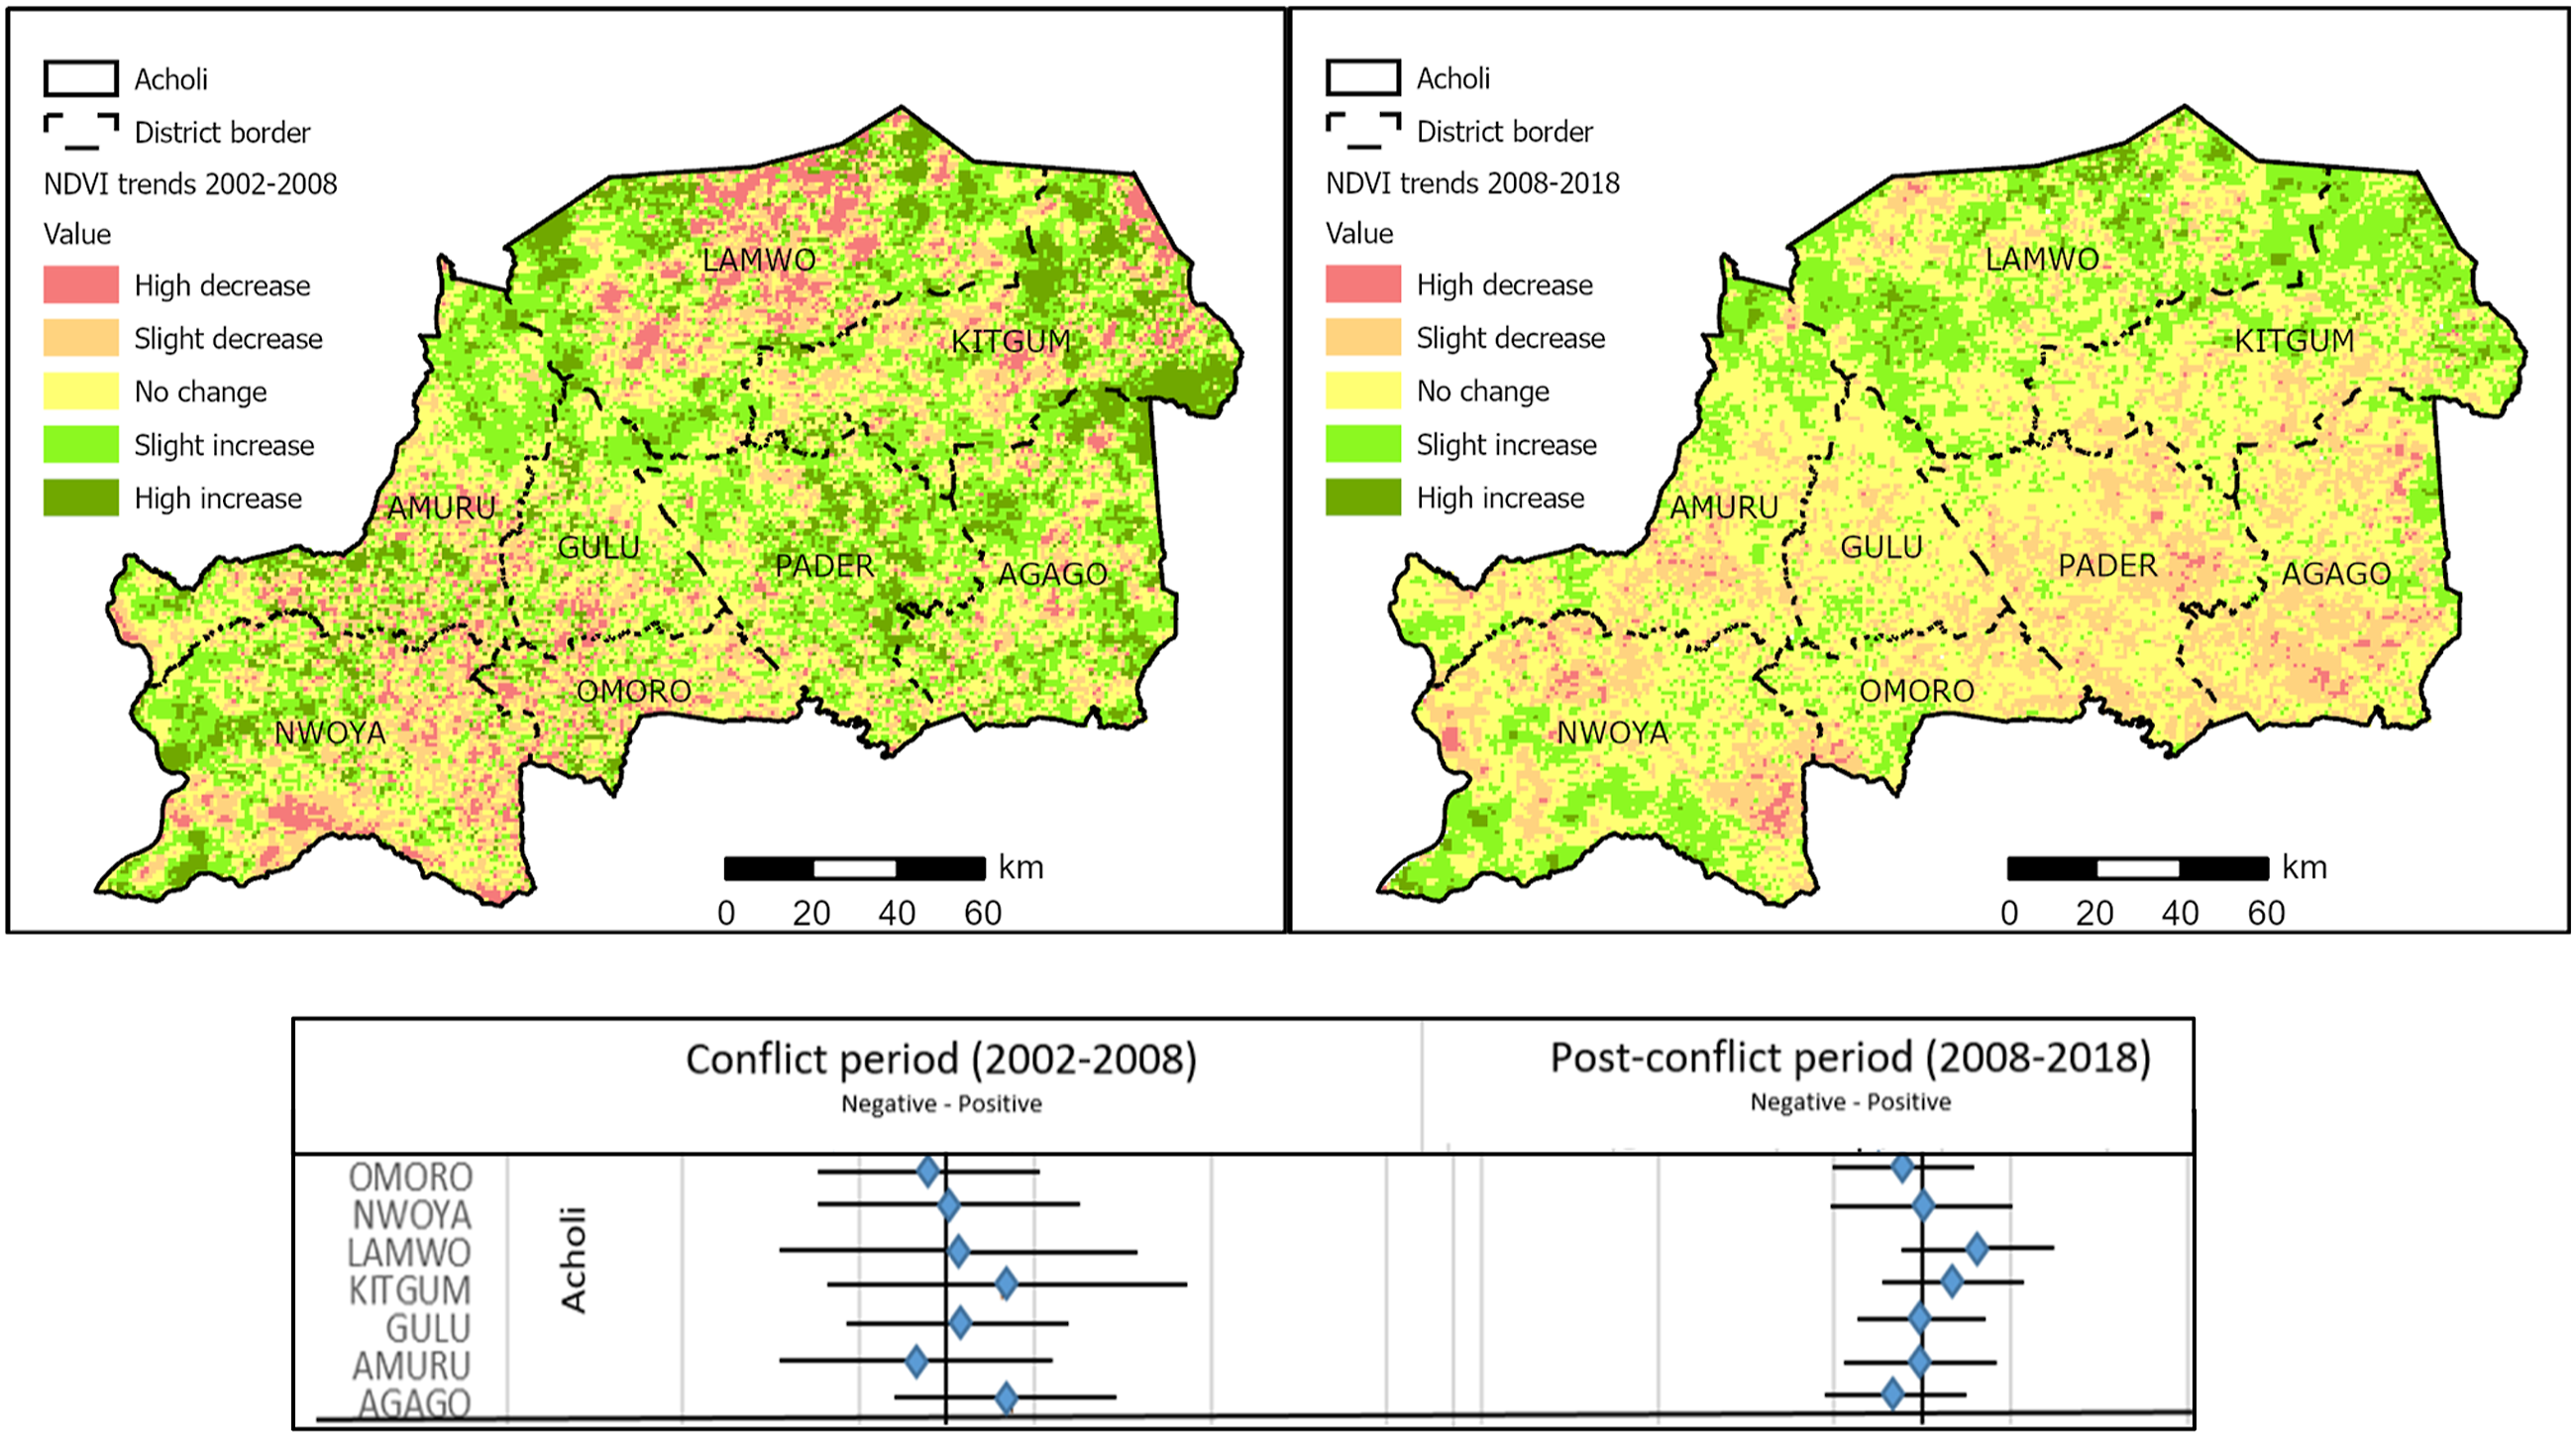
Oguzu et al. (2018) observe notable changes between 2006 and 2016 in land use and cover in some parts of Acholi (Aswa iii sub-catchment) where woodlands decreased, small-scale farming increased, while grasslands remained the dominant vegetation during the period until 2018 when agriculture and grassland were evenly distributed in all the area under study (Oguzu et al., 2018). Commercial large-scale agriculture has also increased in this sub-region during the post-conflict in Nwoya and Amuru districtus between 2009 and 2019 according to Luwa et al. (2020).
Haysom et al. (2021) report that Acholi sub-region – together with West Nile – is the main charcoal producer in Northern Uganda. According to Kaguta (2022) Acholi sub-region has a comparative advantage over other areas of Uganda for charcoal production because vegetation has been preserved during the armed conflict. Ochola (2021) states that conflicts around charcoal overexploitation have been observed in Lamwo, Amuru, and Agago.
As mentioned above, Acholi stands out for the increase in urban land between 1996 and 2013 according to Li et al. (2016). Urbanisation might explain hotspots of vegetation degradation in Acholi during the post-conflict period.
Agago and Pader stand out as the mean NDVI trends during the conflict reversed from positive to negative in the post-conflict (Figure 6). This – we propose – might be explained by the expansion of logging and/or land clearing for agriculture into these districts in detriment of natural vegetation preserved during the conflict (Asiimwe, 2021; Kaguta, 2022; Oguzu et al., 2018).
Amuru, Kitgum, and Lamwo, on the other hand, seems to have reversed the most negative trends in the 2002-2008 conflict period to more moderate trends the post-conflict period. This might be explained by the increase in agricultural land in these three districts during the post-conflict. The location of IDPC in these districts triggered an intensive land use, overexploitation of natural resources and environmental degradation around the camps, while at the same time permitted the expansion of small-scale farming which could be observed later during the post-conflict (Oguzu et al., 2018).
In conclusion, we propose that agriculture might be one of the central drivers explaining the greening of the natural environment in Acholi sub-region, over areas previously degraded, and logging and grassland degradation seem to explain vegetation degradation in areas previously restored and/or preserved during the conflict.
Lango Sub-region
South of Acholi sub-region, Lango accommodated IDP by hosting sixty-one camps all closed by 2009 (UNHCR, 2009). According to Nampindo et al. (2005, p. 33) the loss of woody cover in Lira and Apac districts during the first decade of the conflict (1985–2002) ‘could be attributed to an increased expansion and intensification of agricultural and pastoral land use systems as a response to increasing population demand for food and market opportunities’. 2
We observe that in the conflict period of analysis (2002–2008), mean NDVI trend is positive in Apac and there are no changes during the post-conflict period (2008–2018) (Figure 7). The trend is positive in Lira during the post-conflict. Unfortunately, this does not necessarily mean that woody cover has increased here. We propose that the mean NDVI increment might be explained by the increase of land for agriculture and/or grassland as already observed by Nampindo et al. (2005) for the first decade of the conflict. Lango sub-region, Uganda. Spatial distribution of NDVI trends during conflict (2002–2008) (right) and post-conflict (2008–2018) (left). Trend statistics from Figure 4 (below).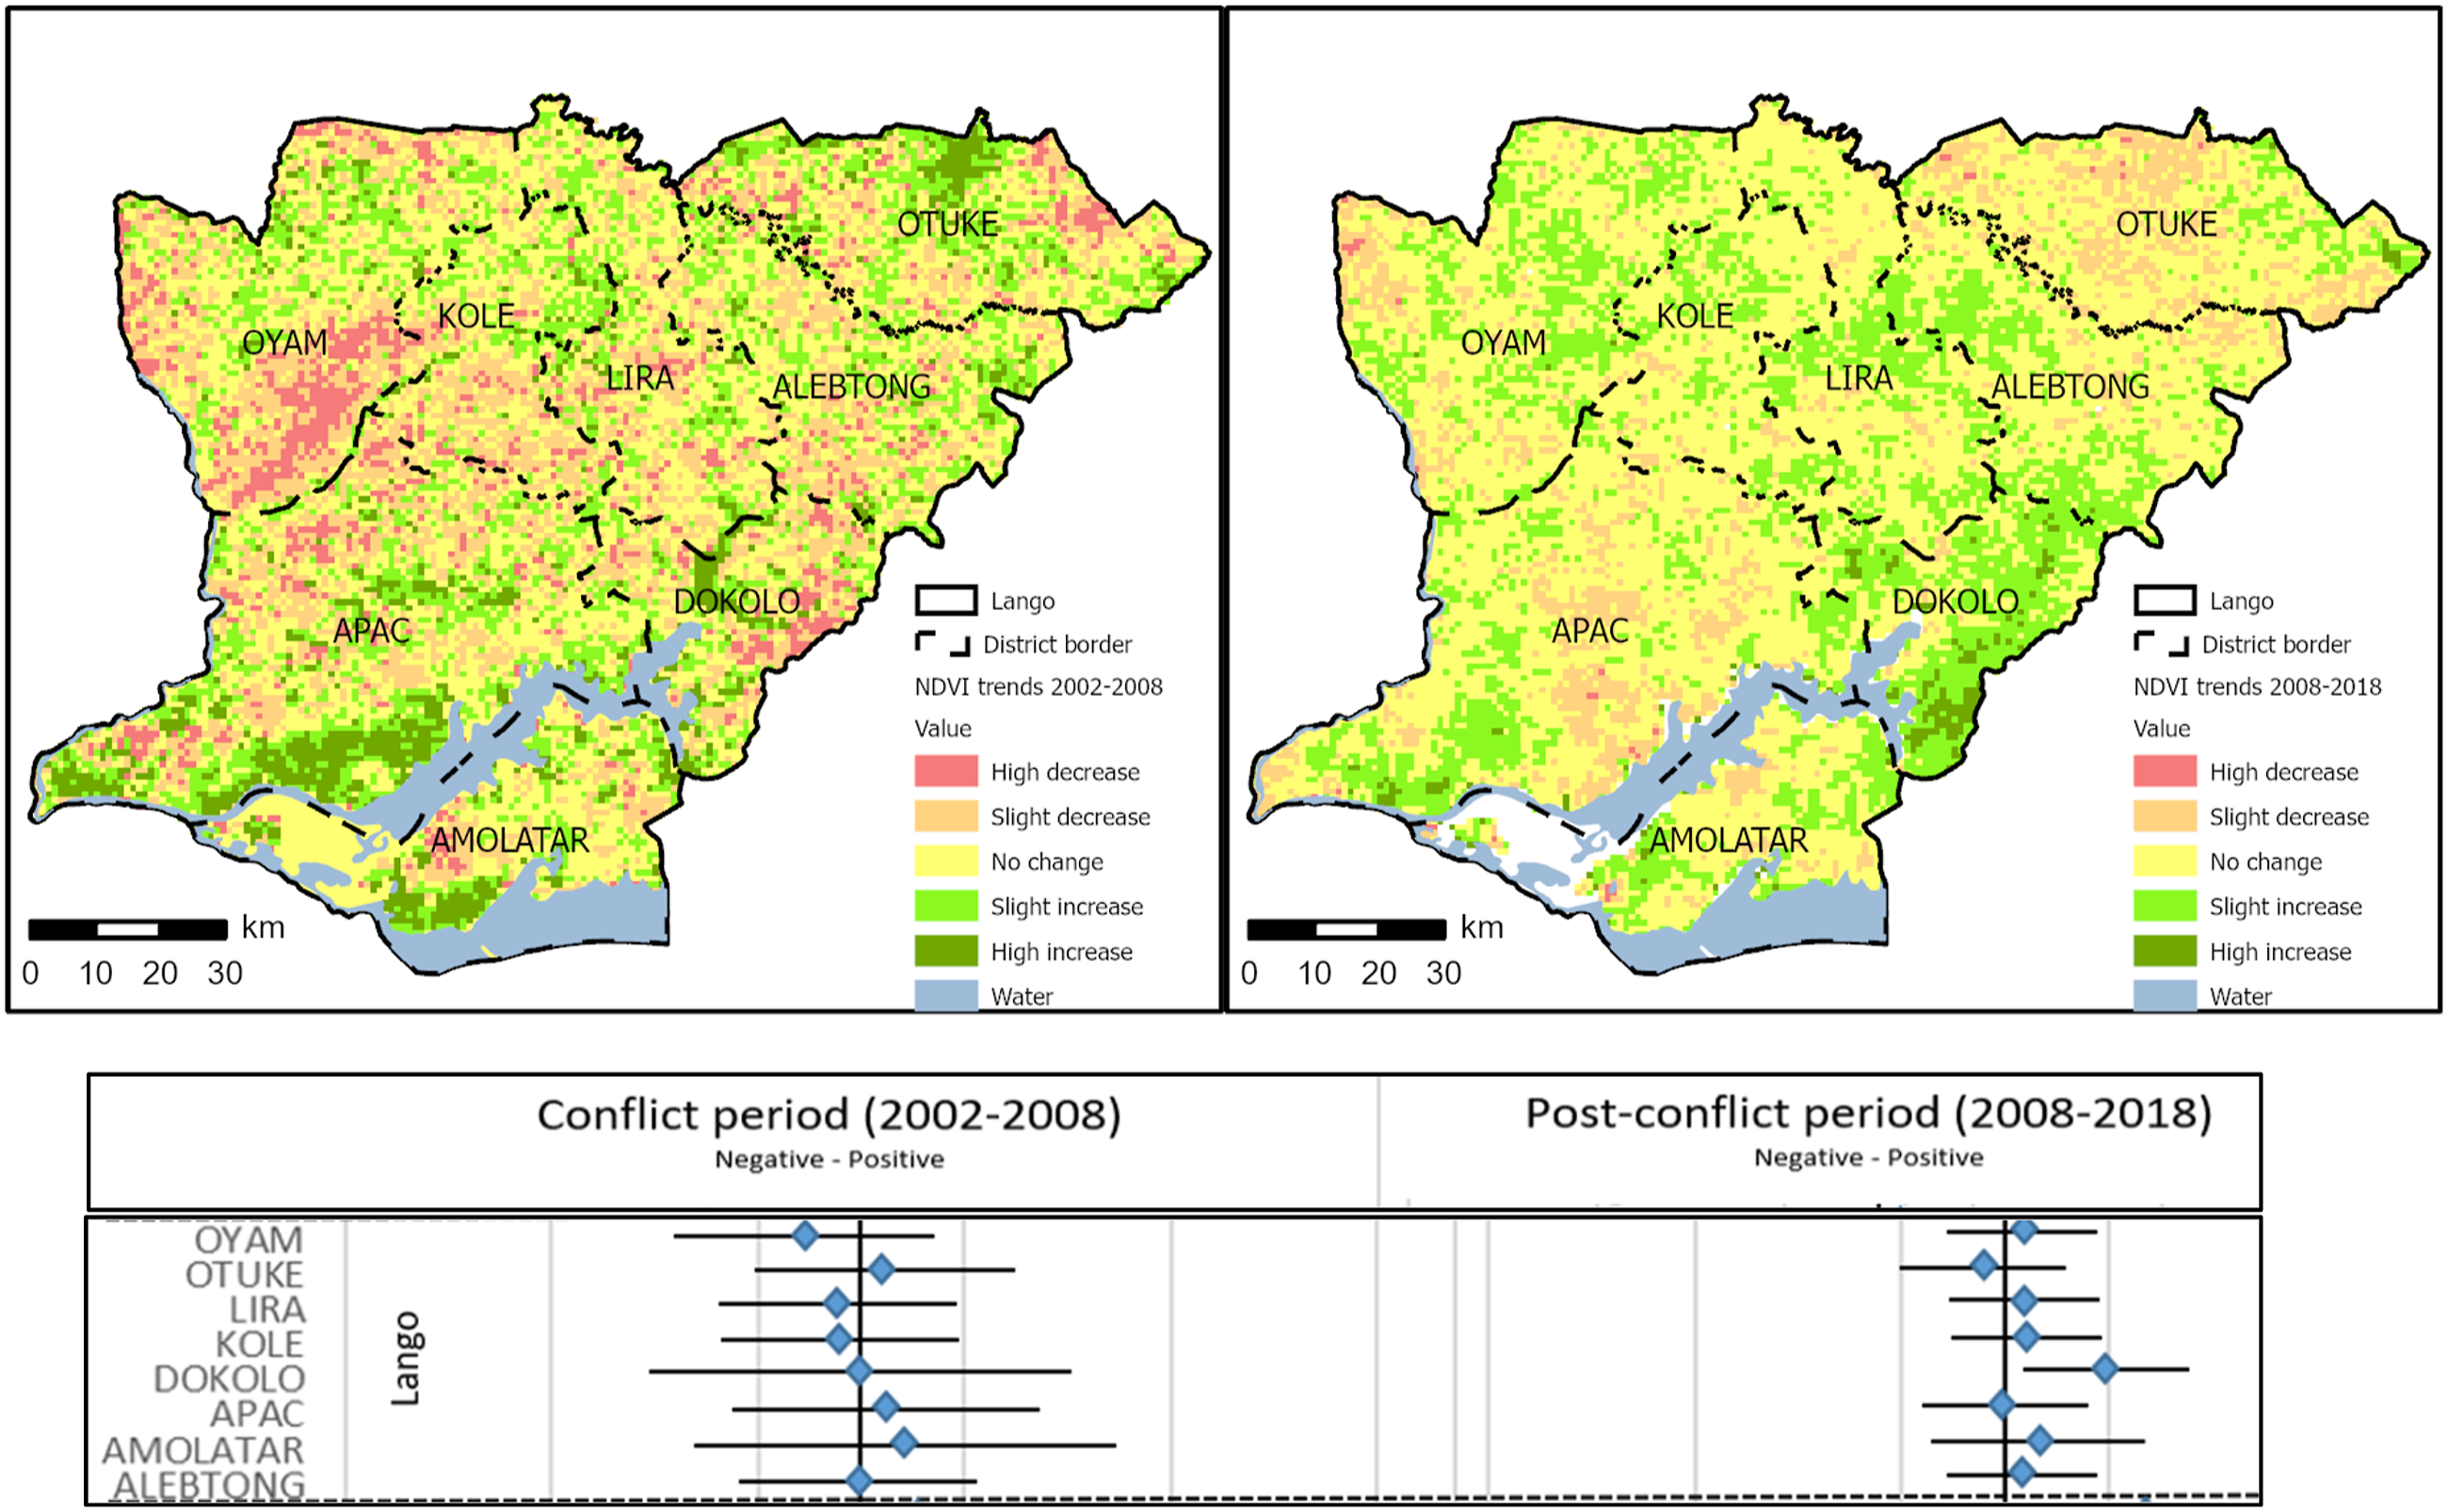
The statistical analysis shows that mean NDVI trend in the post-conflict period becomes much shorter in terms of variation in the increase/decrease of photosynthetic activity, which means that vegetation deterioration/growth becomes more evenly distributed in the sub-region (Figure 7).
During the post-conflict period, most of the districts show positive mean NDVI trends (except for Otuke). Dokolo stands out during the post-conflict because the majority of the surface of the district shows positive NDVI trends. In this district can also be found the highest positive mean NDVI trend of the sub-region. Based on secondary data, we consider that these tendencies might be explained by (a) expansion of agricultural land and forest regeneration or afforestation (e.g. 2099 ha of Kachung Forest Project) in the case of Dokolo (Edstedt & Carton, 2018) and (b) negative change in woody cover (e.g. Otuke) (Ojok, 2020).
Teso Sub-region
Ten years ago, ACCS (2013) observed that Teso not only has experienced numerous armed conflicts but also cattle raids, which greatly impacted vegetation (natural and agriculture). Together with Karamoja, this sub-region is currently suffering from drought and floods that have destroyed crops, increased food insecurity and emigration (NEMA, 2019).
During the conflict period (2002–2008) mean NDVI trends were positive for all districts in the sub-region. Bukeda, Budaka, and Katakwi districts particularly stand out because of the high mean positive NDVI trends. In the post-conflict period positive trends remained except for Budaka that showed a negative trend (Figure 8). Teso sub-region, Uganda. Spatial distribution of NDVI trends during conflict (2002–2008) (right) and post-conflict (2008–2018) (left). Trend statistics from Figure 4 (below).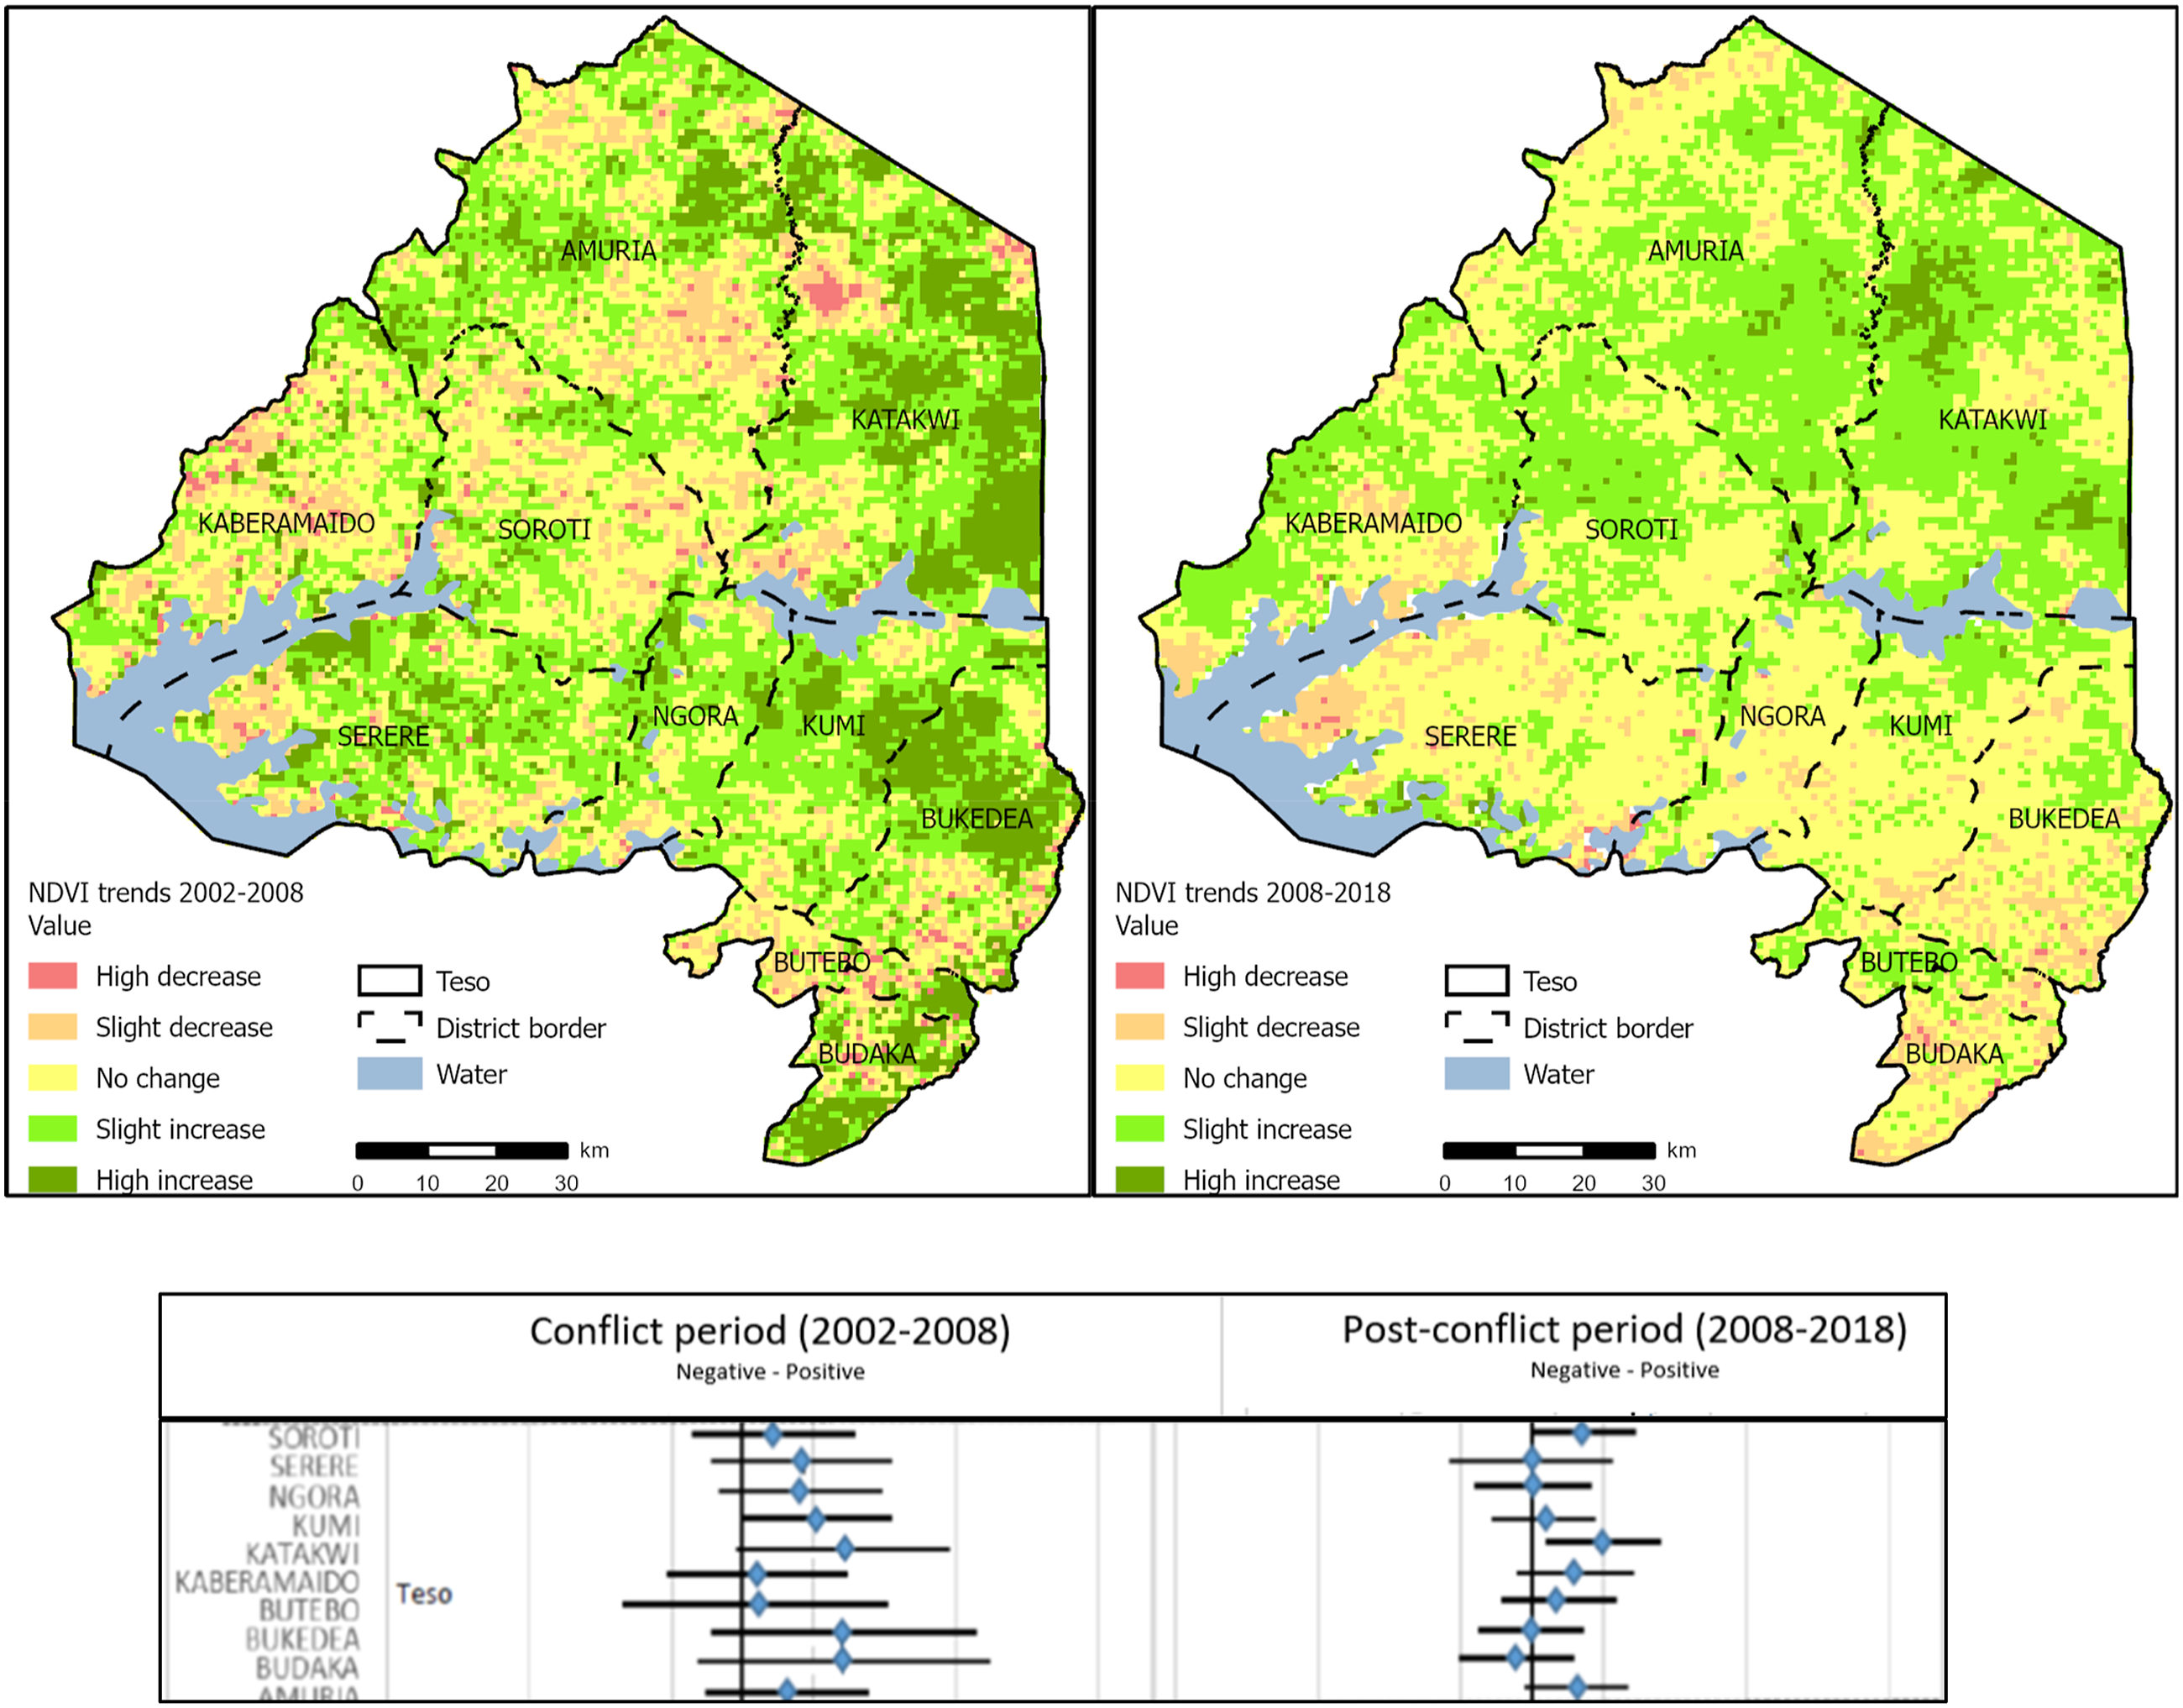
We propose that the positive NDVI trends in Teso might be explained by forest regeneration or afforestation. According to Li et al. (2016, p. 261), Teso is an exception in Uganda as forestland in the sub-region grew 62% in the period 1996-2013: ‘[t]his is primarily due to the preservation of the most naturally wooded areas in the districts of Katakwi, Serere, Soroti, Amuria, and Kaberamaido which constitute the wider Teso region’.
In Soroti, for example, a study by Egeru and Majaliwa (2009) showed that there was a decline in small-scale farming in 1986 due to the armed conflict that resulted in grassland gains by 2.9% between the period 1973-1986. However, the authors observed that in 2001 small-scale farming had increased by 13.6% at the expense of woodlands, bushlands, forest stock and wetlands that experienced declines. Albeit a positive mean NDVI, this might explain the negative cases in Soroti during our conflict period of study 2002-2008.
We propose that the ‘greening’ of Teso sub-region during the post-conflict period might differ from previous sub-regions studied as it seems to be forestland and not agricultural land that might be explaining this trend. Nevertheless, there are differences within the sub-region as Bukedea and Budaka have dramatically changed tendencies during the post-conflict, probably due to deforestation.
The statistical analysis shows that there is a tendency between both periods towards vegetation deterioration. In addition, similar to the other sub-regions, in the post-conflict period, the gap between vegetation deterioration-growth has shortened within each district compared to the conflict period 2002-2008. This means that there are not extreme cases of vegetation deterioration/growth.
Final Remarks
We propose the following model to explain NDVI spatial trends in the sub-regions studied. Areas with vegetation growth during conflict (in green in the 2002-2008 period) which turned red during post-conflict due to vegetation deterioration (2008–2018) might indicate areas whose lands were used for forest exploitation, infrastructure building, or clearing for farming in the post-conflict period (Figure 9(a)). Eventually, these areas could have turned green after 2018 if they were used for farming. Further research is needed to show trends after 2018. On the other hand, areas deteriorated during the conflict (in red in the 2002-2008 period) turning green during the post-conflict (2008–2018) might be areas where lands are used for agriculture or whose natural vegetation was restored during peace times (Figure 9(b)). Model to understand possible land cover/use change associated to NDVI trends at district level at the four selected sub-regions in Northern Uganda (a) during conflict (2002–2008) and (b) post-conflict (2008–2018) (green: vegetation increase, red: vegetation decrease).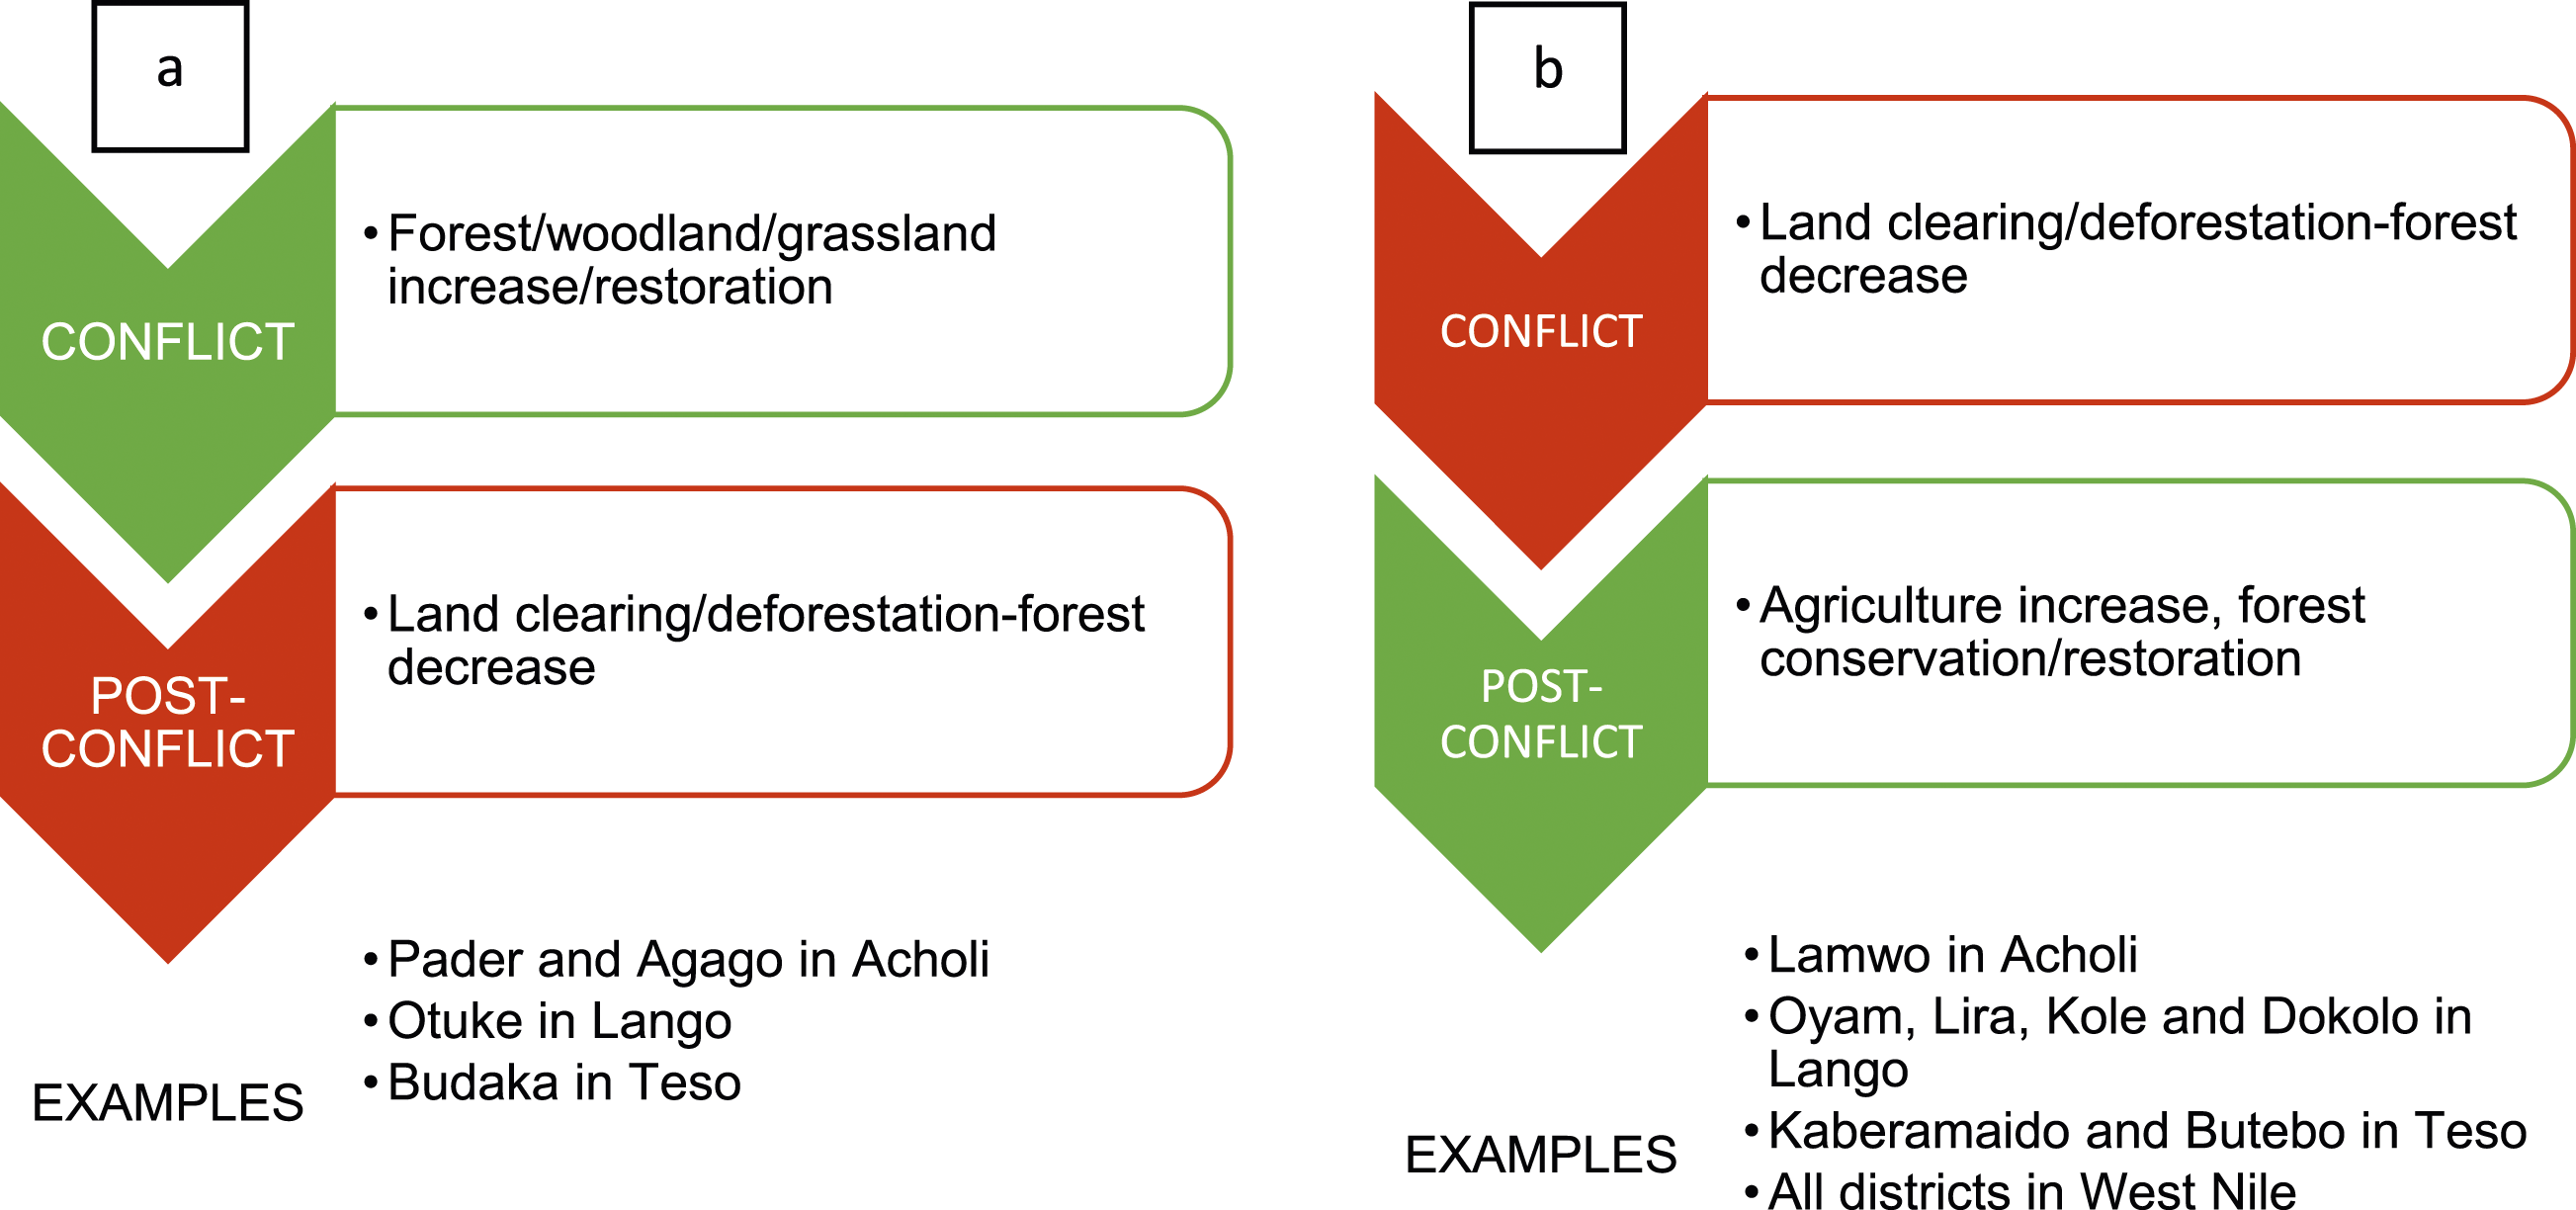
Discussion: Environmental Change, Prospects for Sustainable Peace and Development and Further Research
Our study has shown that some of the sub-regions and districts in Northern Uganda have been turning greener since the armed conflict. We have also proposed that this might be explained by the expansion of agriculture. However, other drivers might be at play. Indeed, forest restoration and/or expansion of woody cover and grassland, as in the case of Teso might be pointing to this.
The conservation of natural vegetation (grassland, forest) or previously degraded areas to agriculture crops might be indicating that the region has not been turning more biodiverse rich during the post-conflict. If the greening of Northern Uganda is explained by agriculture expansion, then we propose that there has been environmental deterioration to a certain degree, as agriculture implies the loss of wildlife habitats and biodiversity erosion. While agriculture might be conducive for food security and economic growth, the way it is organised and articulated with the natural vegetation is central for its sustainability, as well as for an equal development. If agriculture is motorised by large-scale monoculture of industrial crops in detriment of small-scale family-oriented crops and/or expands over forest and woodlands, biodiversity might be compromised along with ecosystem services central for local populations, for climate change mitigation and adaptation. Further research is needed to properly understand positive trends in vegetation activity (e.g. ‘greening’) as well as the impact of agriculture on biodiversity (e.g. use of agrochemicals and water and soil pollution).
The study has also shown that the geographical scale of vegetation change (degradation and restoration) during peace times has changed compared to conflict times and in different scales. Our NDVI study during the armed conflict and during the post-conflict shows that the geographical distribution of vegetation deterioration and growth has become more equally distributed in all sub-regions studied at the district scale of analysis. In this sense, Northern Uganda’s unequal geographies of environmental change have transformed. While it is possible to argue that vegetation is not further depleted during peacetime, it is also the case that vegetation is no longer being restored in the same intensity as during conflict time at regional scale. This should be further corroborated on the ground to properly understand the drivers. However, it is important to consider how scale matters here. Hotspots of deterioration (e.g. refugee camps or forest encroachment) can be observed if we use another geographical scale of analysis than the one used in this study (focused on sub-regional and district level). Future studies could look into other scales of vegetation and environmental change (sub-counties or parishes level).
What might these regional and sub-regional trends and possible explanations be indicating in terms of sustainable peace and development in North Uganda? If we understand agriculture expansion, along with infrastructure expansion, as signs of ‘progress’ and ‘economic growth’ we might conclude that Northern Uganda is undertaking processes of ‘development’ during the post-conflict period of analysis. However, it is important to question whether this development is sustainable and inclusive as well as the implications for peacebuilding. As stated above, the management of natural resources during post-conflict peacebuilding should be carefully monitored in order to promote conflict-sensitive development (ACCS, 2013; UNEP, 2009) and avoid resuming (armed) conflicts.
Our explicative analysis based on secondary data shows that environmental concerns and conflicts in the region in the post-conflict period of analysis might be related to the extensive use of land for agriculture, encroachment over wetlands and local forests (ACCS, 2013; MWE, 2016; NEMA, 2019), which might be indicating the unsustainability of this development model. While the local population continues to meet their fuel demands on biomass (charcoal and firewood), and their food needs on subsistence cultivation, environmental degradation will continue to play a key role in the sustainable development of the region as local communities are highly dependent on their natural environment for their livelihoods. At the same time, the expansion of large-scale industrial agriculture (e.g. sugar cane), oil exploration and exploitation or hydropower or carbon offsetting projects driven by corporations might further fuel land and environmental conflicts with local communities, as recently shown by environmental defenders in Northern Uganda (Nardi, 2024). This – we propose – might weaken peace consolidation in the region, irrespectively of the ‘greening’ tendencies we observe during the post-conflict period of analysis (2008–2018) in some parts of the region.
Final Reflexions
Our study suggests that peacetime in Northern Uganda has worked as an opportunity to ‘green’ some parts of the region (e.g. as shown in Table 1 and Figure 4) and to start up processes of economic development, as evidenced by the literature (e.g. agriculture expansion, oil, mineral, hydropower projects). However, the cessation of hostilities and the stabilisation of Northern Uganda since 2008 seems to be also driving the expansion of the ‘resource frontier’ as various sources have shown. Population growth, the expansion of the capitalist frontier, and the insertion of the local economies into the national and international economy, might complexify sustainable peace and development opportunities in this region of the country.
Economic activities that drastically change land cover or deny local communities access to or use of natural resources might likely increase local tensions and conflicts. For local communities to benefit from this seemingly economic development, environmental concerns need to be highly prioritised in Uganda’s development agenda. Natural resources management and governance – including land and forests – and climate change adaptation and mitigation policies and strategies should be both conflict and environmental sensitive.
We suggest that future development policy should continue to have a particularised approach to Northern Uganda as peace is not yet consolidated. We propose that future research on vegetation and environmental change in Northern Uganda pays careful attention to dynamics of LULC on the ground and the implication of these uses and changes in natural resource exploitation and management. Our NDVI study could serve as a starting point to identify at local level processes of vegetation restoration and deterioration worth observing.
Footnotes
Declaration of Conflicting Interests
The author(s) declared no potential conflicts of interest with respect to the research, authorship, and/or publication of this article.
Funding
The author(s) disclosed receipt of the following financial support for the research, authorship, and/or publication of this article: This work was supported by the Swedish Research Council for Sustainable Development (FORMAS) under the project ‘The Nature of Peace: the Dynamics between Post-conflict Peacebuilding and Environmental Protection’ (Grant, 2018-00453). We would like to thank Paul Isolo Mukwaya for his observations and Lina Eklund for her comments in an earlier version of the manuscript.