
Abstract
In recent decades, the adoption of geoinformation technologies has grown more crucial in determining the various characteristics that define the Earth’s environment. GIS tools have evolved significantly to planning for environmental and urban development. This research examined various geoprocessing approaches employed by the ArcGIS MODELBUILDER to decide whether a site is suitable for a slum relocation procedure. Three potential relocation sites for a slum in Cairo were examined using 12 different criteria. Five degrees of suitability have been included for sites assessment. Results were applied according to the score for each site and the final degree of suitability was recorded for decision support of slum relocation. Comparing the proposed sites, Site 3 showed the highest level of suitability for the relocation of slums, scoring 4.246 (84%), followed by sites 1 and 2 with scores of 3.99 (79.8%) and 3.43 (68.6%), after the weighted ratings for each element were determined.
Keywords
Introduction
Land Suitability Analysis
Land suitability is the potential of a parcel of land to be used effectively for a specific purpose. The site may be taken into consideration in its current state or subsequent developments. The site may be considered in its existing state or in perspective of future developments. The land suitability analysis process involves assessing and classifying specific sites in accordance with their suitability for specific purposes. (Alvandi et al., 2017). The assessment of land suitability incorporates both qualitative and quantitative analysis. Qualitative assessments of land suitability consider a number of factors like climate, irrigation, topography, plant, and environment, whereas quantitative analyses produce estimations and more meaningful outcomes (Scholten, 2020). Subsequently, LSA has been used in studies associated with a range of different environmental phenomena. For instance, it has been used to map and model urban areas for different particular purposes (Bamrungkhul and Tanaka, 2022; Foroozesh et al., 2022; Hao et al., 2022; Ismaeel and Elsayed, 2022; Saleem et al., 2022) . The driving concept of LSA is to provide decision-makers with the necessary information to evaluate a site suitability for a particular purpose. The initial site selection, which is a prerequisite for project building, is impacted by topography and other environmental factors (Rediske et al., 2021). Therefore, it is crucial for decision-makers to engage global thinking through utilizing the applications of GIS spatial analysis capability to find the best location for a particular purpose (Rezvani et al., 2022). Numerous engineering applications have contributed through the use of GIS. Researchers have found that the increasing number of criteria, variety of data kinds, and measurement units make it impossible to evaluate criteria in site selection quantitatively and that there are interactions between the criteria (Sarıçam and Yilmaz, 2022). Hence, The GIS-based spatial analytical hierarchy process (SAHP) was employed to generate the weights of the criteria and rank the alternatives utilizing pairwise comparison matrix (Shelar et al., 2022). The AHP is a multiple criteria decision-making approach that employs analytical hierarchies to assess the significance of criteria and the relationships among each other in complex circumstances (Liu et al., 2015). The AHP has the benefit of assigning weights according to experts' preferences for particular concepts. Since this, the AHP-modeling framework is powerful tool that could be successfully employed in multi-criteria decision analysis (MCDA), and has been utilized in several decision-making challenges involving the evaluation of land suitability at a global level (Hamurcu and Eren, 2018). The combination of GIS and MCDM methods is shown to be applicable and effective from the results of the related literature (Meng et al., 2022). When developing land suitability models, various criteria and factors in the decision-making process that may be assessed using geospatial datasets are applied to the land suitability (Purnamasari et al., 2022). The assessment of land suitable for slum resettlement involves weighing the significance of each factor that influences land suitability. Land suitability assessment is challenging due to diverse and numerous criteria and the significance of factors affecting land suitability differs. Hence, land suitability assessment process become more complicated (Zelenskiy et al., 2022).
Land Suitability Analysis for Slums Relocation Site Selection
Slums are considered one of the major challenges with urban development worldwide. In recent years, the concern of slums receives political, social, and economic attention (Ajibade and McBean, 2014). In Egypt, dangerous and unsafe settlements account for 1% of urban areas; as a result, 351 areas with around 240,000 housing units were planned for elimination by 2030 (Saleh and Gomaa, 2022). Relocating people from informal communities into “appropriate” housing conditions is promoted as a significant political accomplishment that will significantly improve the quality of life for citizens (Elmouelhi et al., 2021). Dealing with informal areas should not be limited to the physical environment represented in housing condition, infrastructure shortage, and surrounding urban areas. Measuring and improving other aspects such as transportation, service accessibility, and risk prevention is a must especially to those dwellers relocated from deteriorated informal areas to new locations with perfect physical environment (Hovik and Stigen, 2022). The use of geoformation technologies has been helpful in organizing efforts for capacity building, in mapping communities living in deprived urban areas reflecting different perspectives of development identifying choices made that have environmental, geological and socio-economic impact due to the change in the slums intervention strategies (Oluoch, 2022). The GIS technology has become particularly helpful to design and implement models for problems of spatial dimension (Stoeglehner and Abart-Heriszt, 2022). GIS tools provide the processing, analysis, and integrating of spatial data as well as the organization and integration of spatial processes into more comprehensive systems that model the real world (Xia et al., 2022). Spatial models can be effective tools for prediction, forecasting, and planning, used to evaluate possibilities and reduce future uncertainties as they are abstractions and simplifications of complicated systems and processes (Xu et al., 2022). GIS models for slums development and planning are usually created using ESRI ModelBuilder which is an ArcGIS application to generate, edit, and analyze models (Alzahrani, 2022). Model Builder introduces graphical user interface, which makes it easier to design, visualize, edit, and carry out geoprocessing workflows, as well as to publish and use outputs across various geographic contexts (Randall et al., 2022).
This paper presents ArcGIS implemented geoprocessing models (scripts) based on ESRI ModelBuilder tools for automatic land suitability analysis data processing, using spatial analytical hierarchy process (SAHP). SAHP is a practical geospatial analytic method that combines the AHP model with the Geographic Information System (GIS) algorithm to determine the optimal site for particular purpose (Dutta et al., 2022). As a result, three sites (Site1—Site2—Site3) were selected to be considered for the relocation of a slum area (Slum) within Cairo, Egypt. The data of the three sites as well as the slum area were collected to serve as the model inputs. 12 different criteria were employed for the assessment; five degree of suitability are used according to the score for each site indicating the degree of suitability for slum relocation.
Description of ArcGIS ModelBuilder
ModelBuilder is an application to develop, modify, and analyze models. Models are series of processes that connect collections of geoprocessing tools, using the result of one tool as the input for another tool (Graser and Olaya, 2015). ModelBuilder offers advanced techniques for extending ArcGIS capabilities by enabling expertise to develop and distribute models as a tool. It is highly helpful for creating and carrying out simple workflows. ArcGIS may also be integrated with other programs via ModelBuilder (LAHMAR et al., 2020). In a model, connecting lines show the order of processing, the tools and all of the variables associated to it form a model process (Bao et al., 2019). There are three different processes when running a model. ArcGIS system tools are blank (colorless) when they are first added to a model (Hassen & Cherenet, 2020). When all necessary parameter values have been entered into the model, a process is ready-to-run. Ready-to-run processes are symbolized in color as shown in Figure 1. Tool elements are yellow or orange, output data (derived data) elements are green, and input data elements are blue. Sample Model Builder Interface.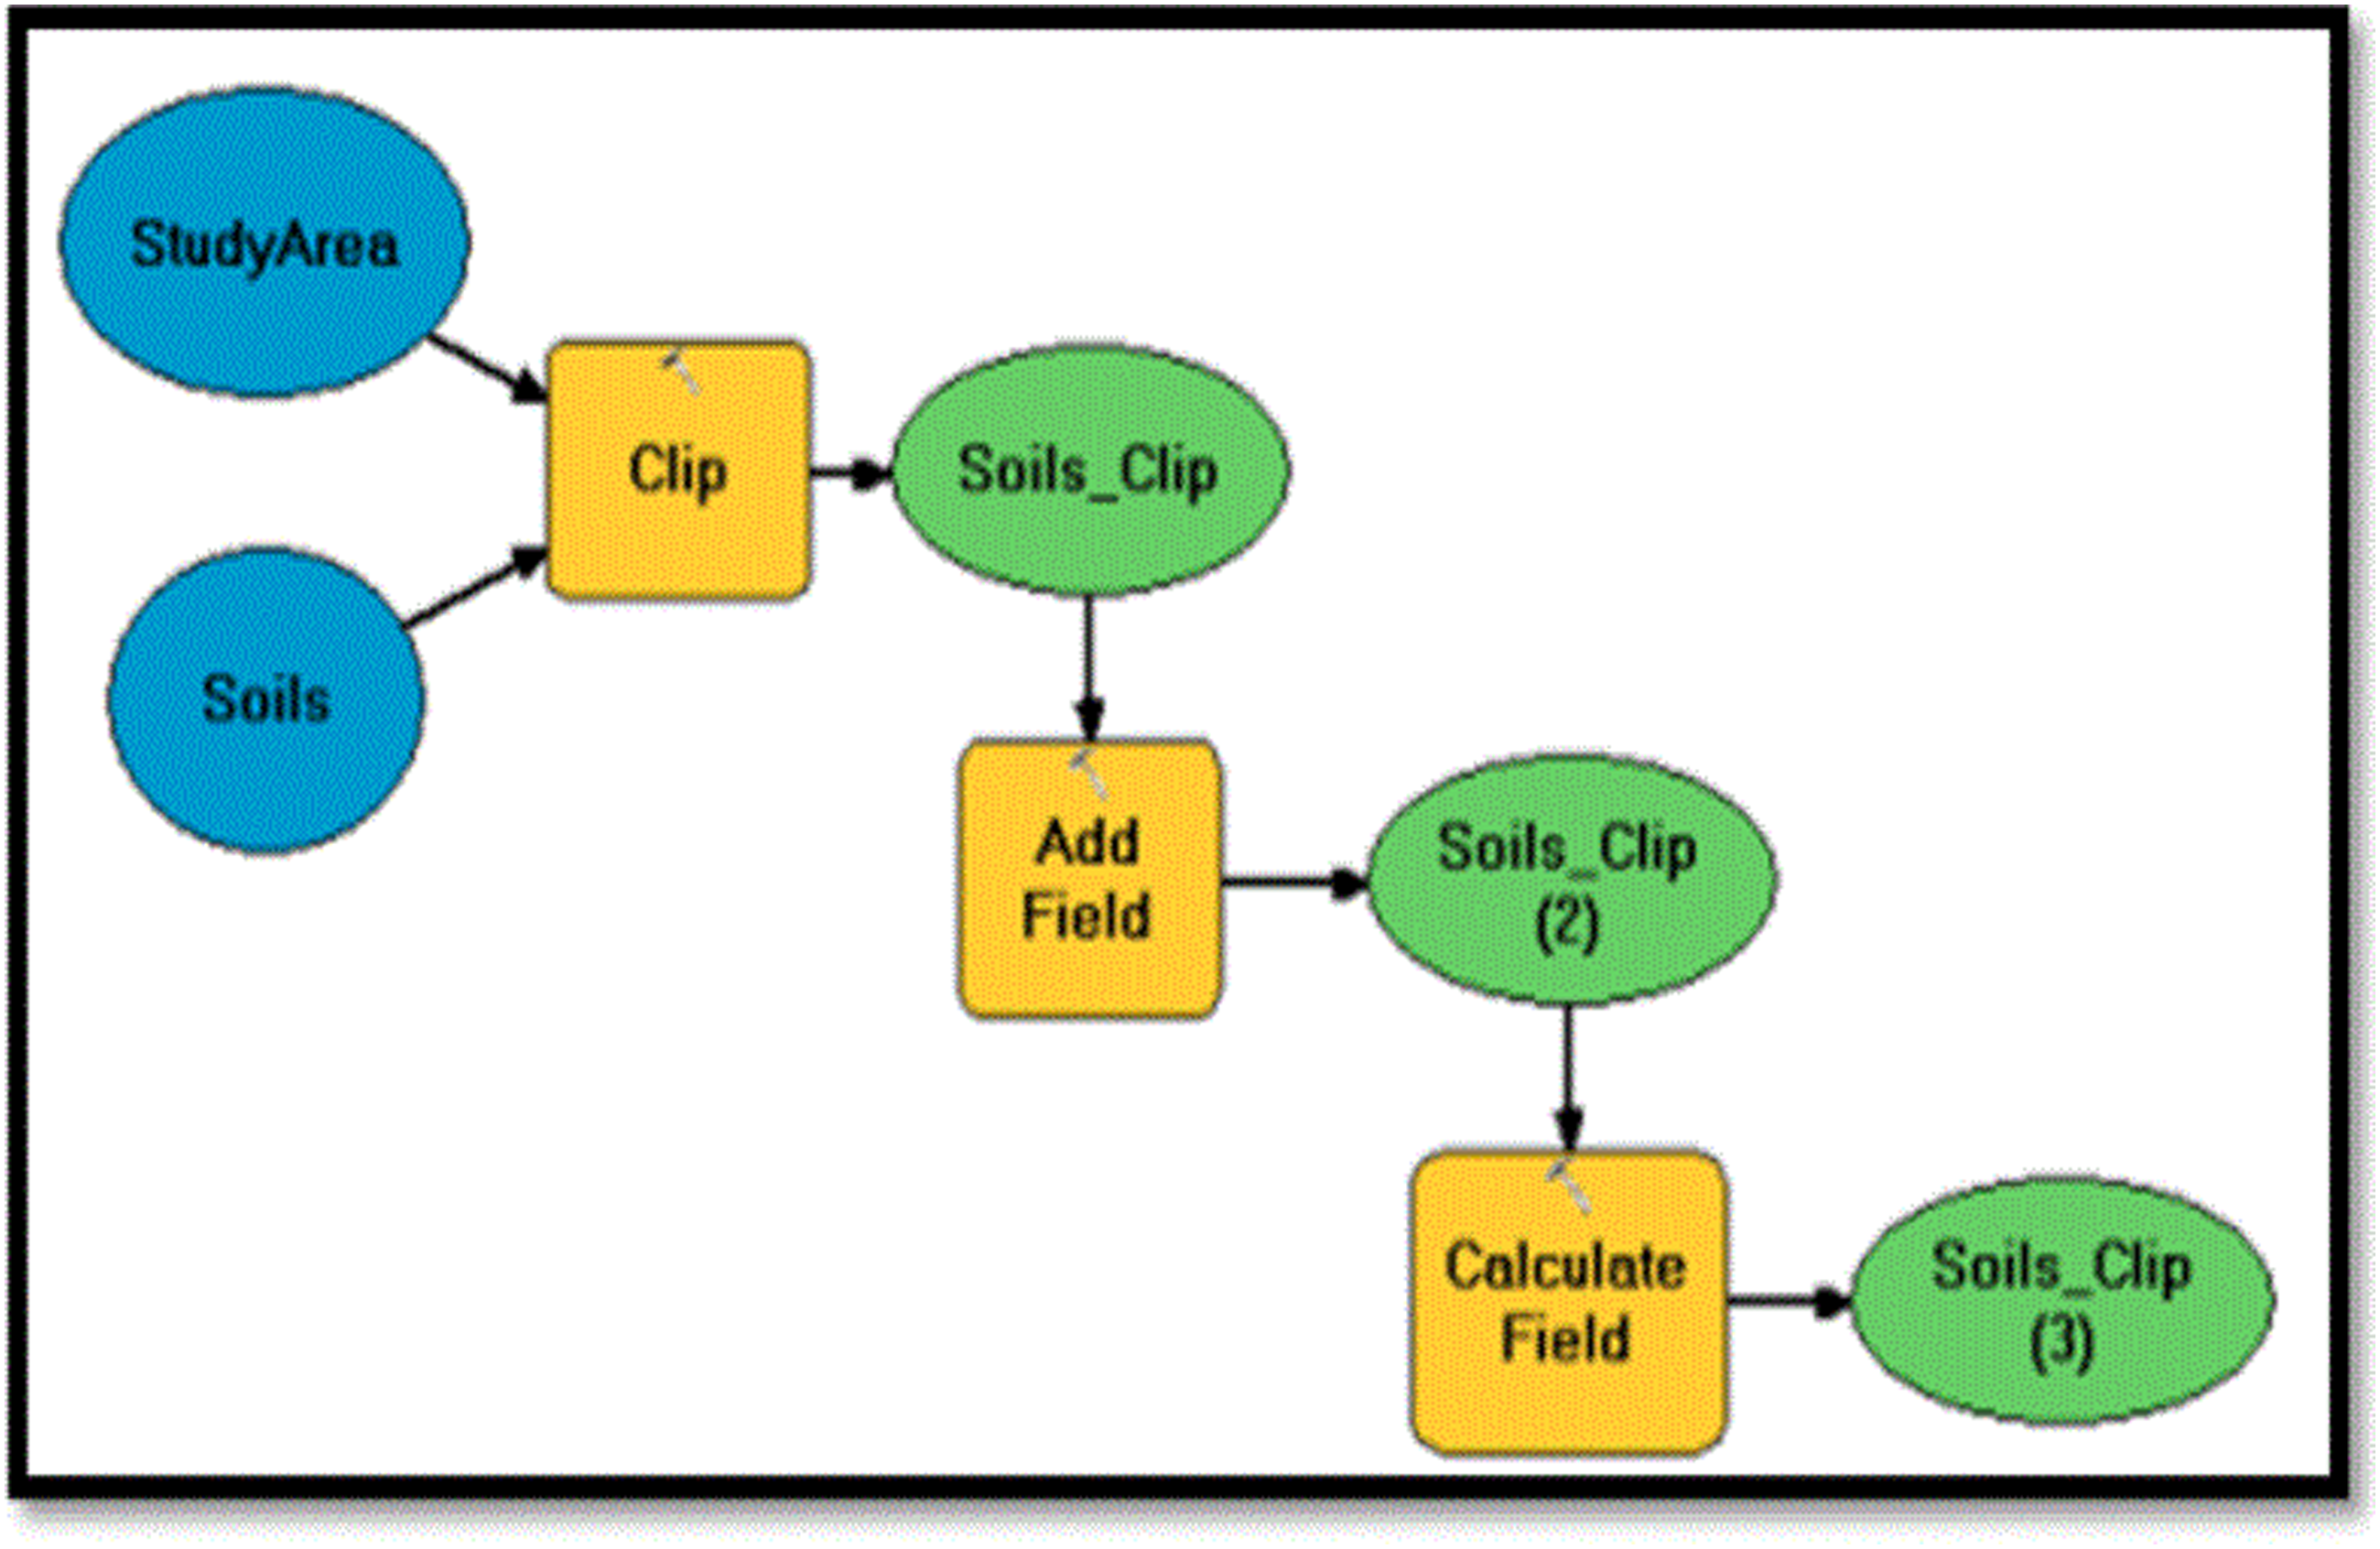
Build Land Suitability Analysis Model with ArcGIS ModelBuilder
Model design is a sequential procedure that calls for performing some processes in a series of steps (Gramacy, 2020) to get the final decision according to inputs and data analysis as shown in Figure 2. Land Suitability Analysis Model Process.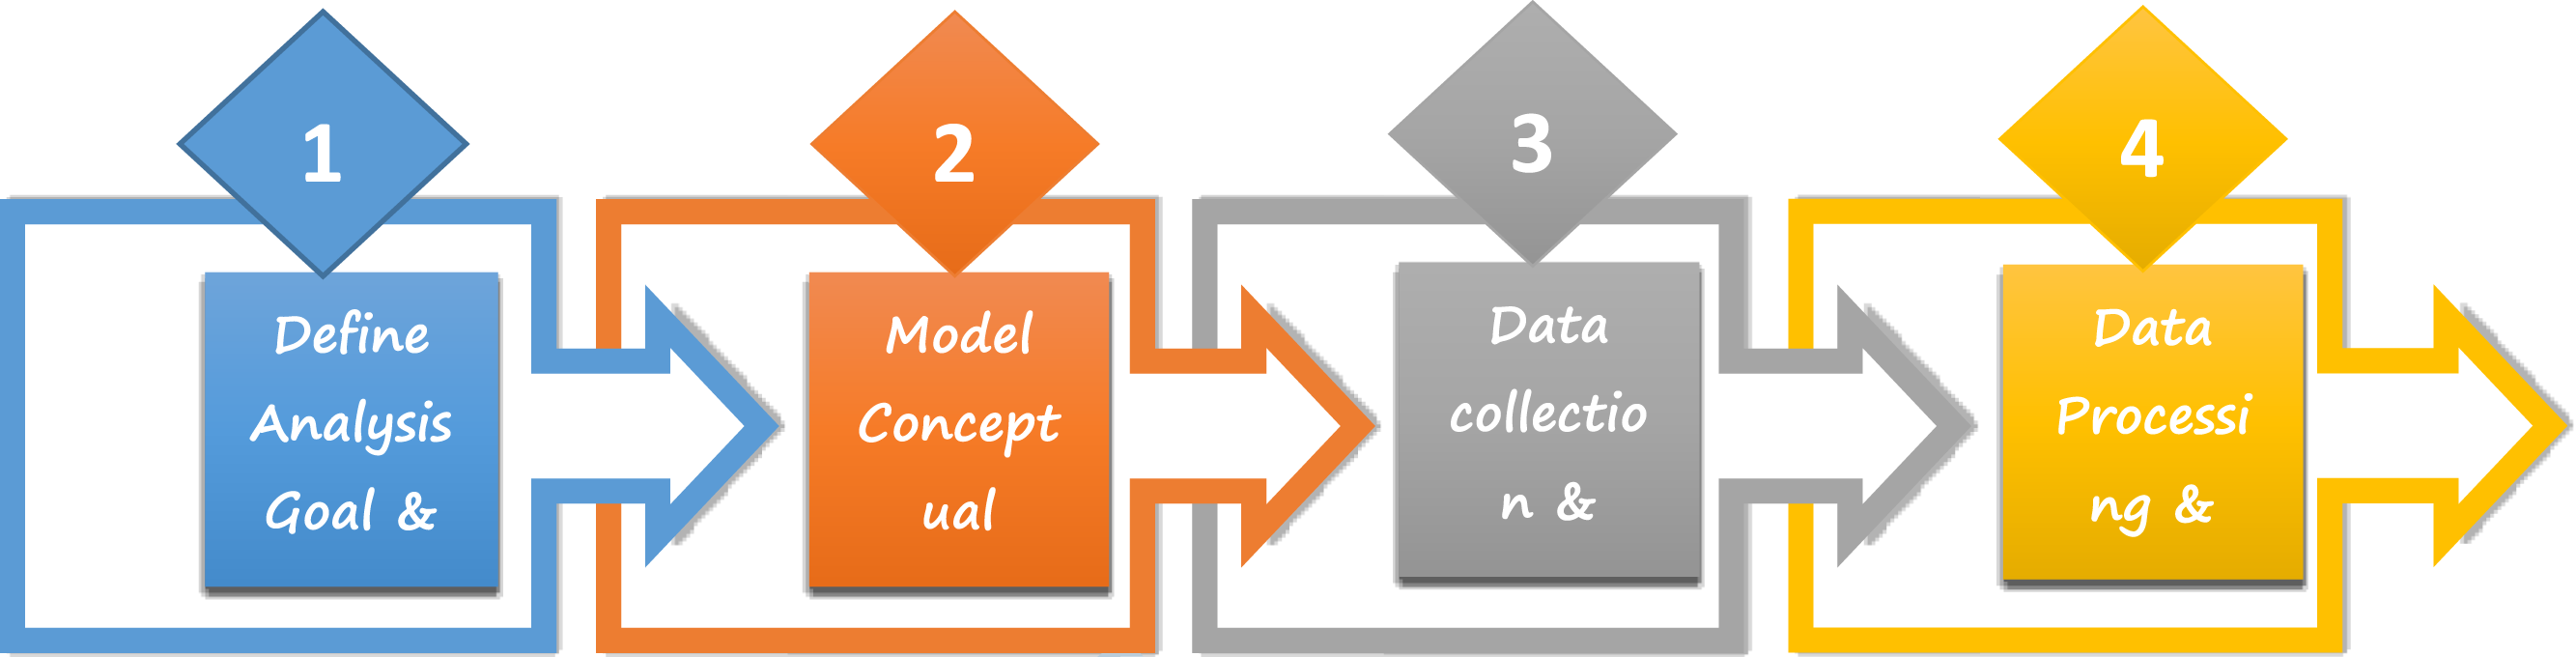
Define Analysis Goal and Evaluation Criteria
The first approach in model creation is the definition of the purpose for model development, in this context, model is developed to select the most suitable sites for slums relocation based on several criteria. 12 different criteria were employed to the suitability analysis model as follows. • • • •
Weighting and Ranking
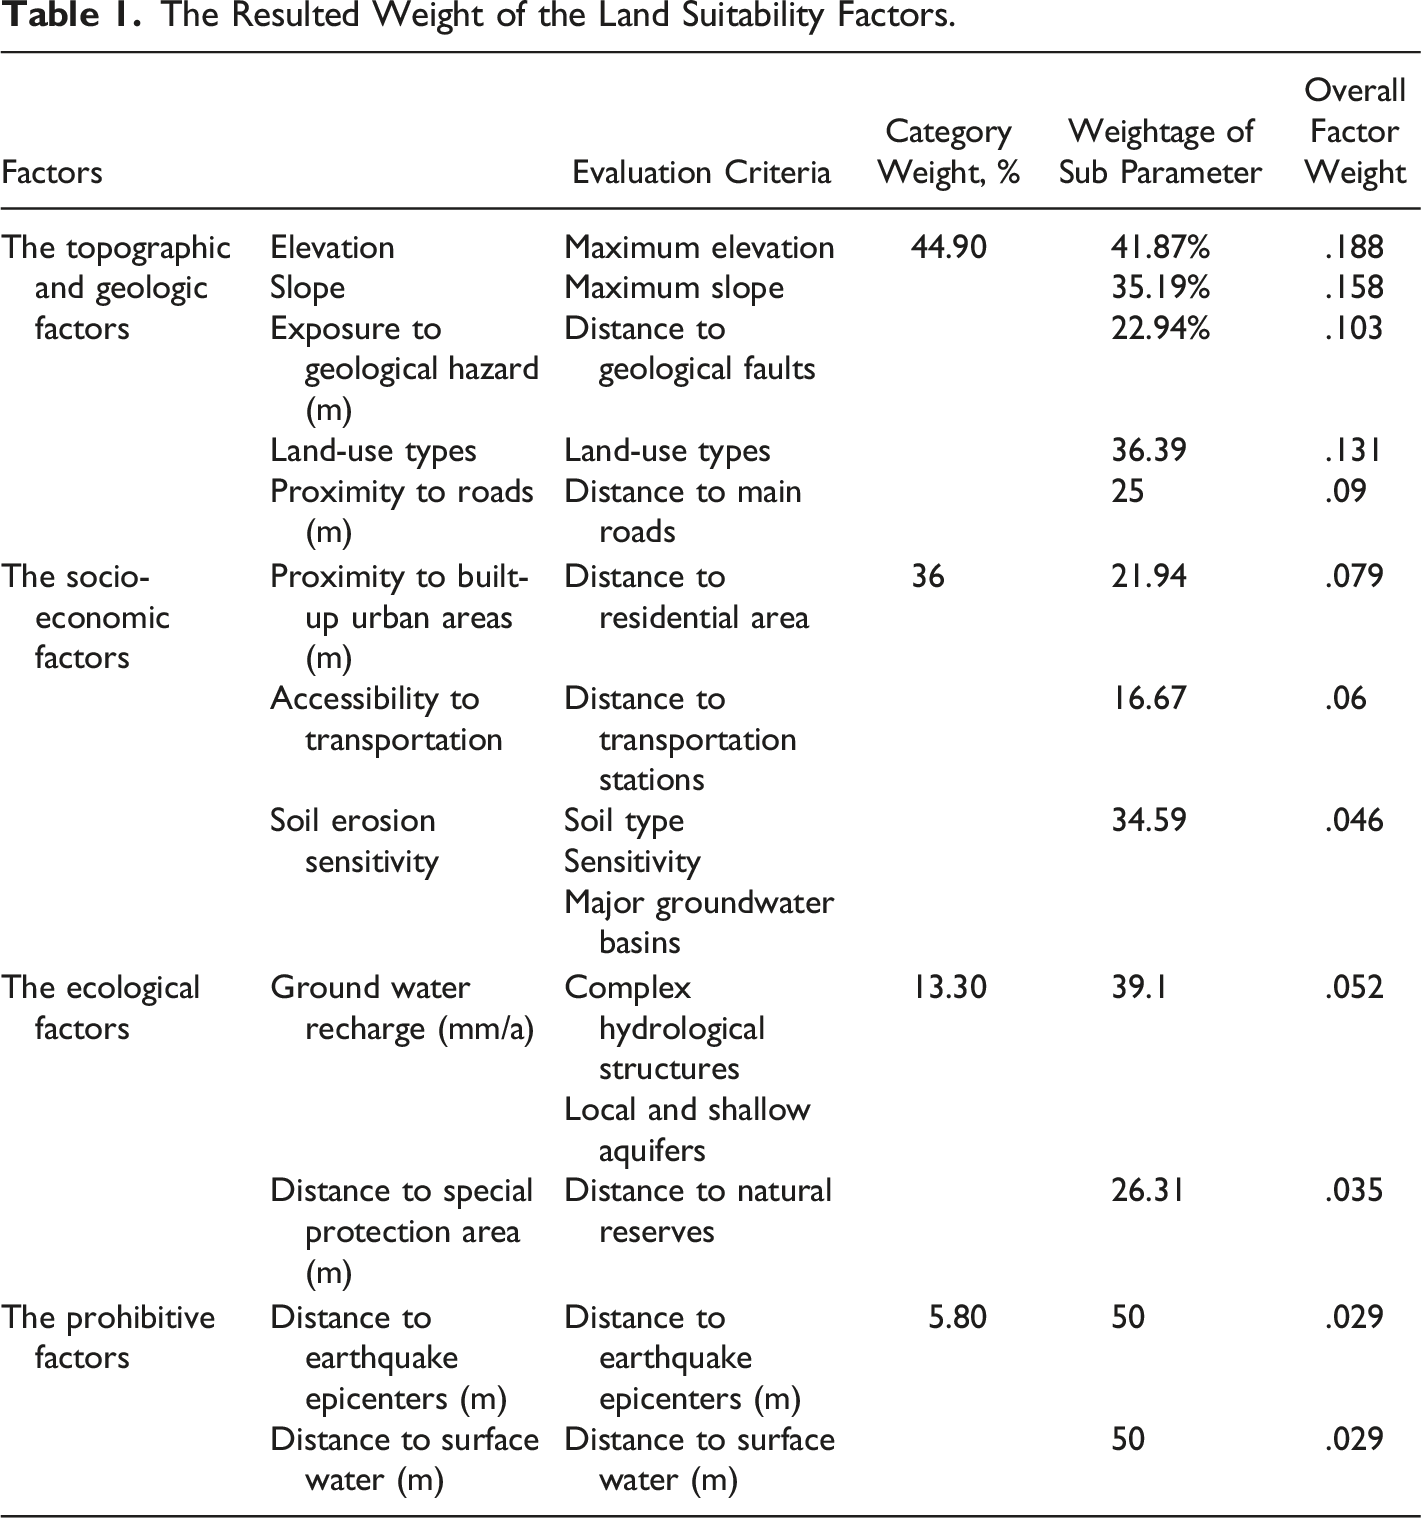
The Resulted Weight of the Land Suitability Factors.
Data Ranges Establishment
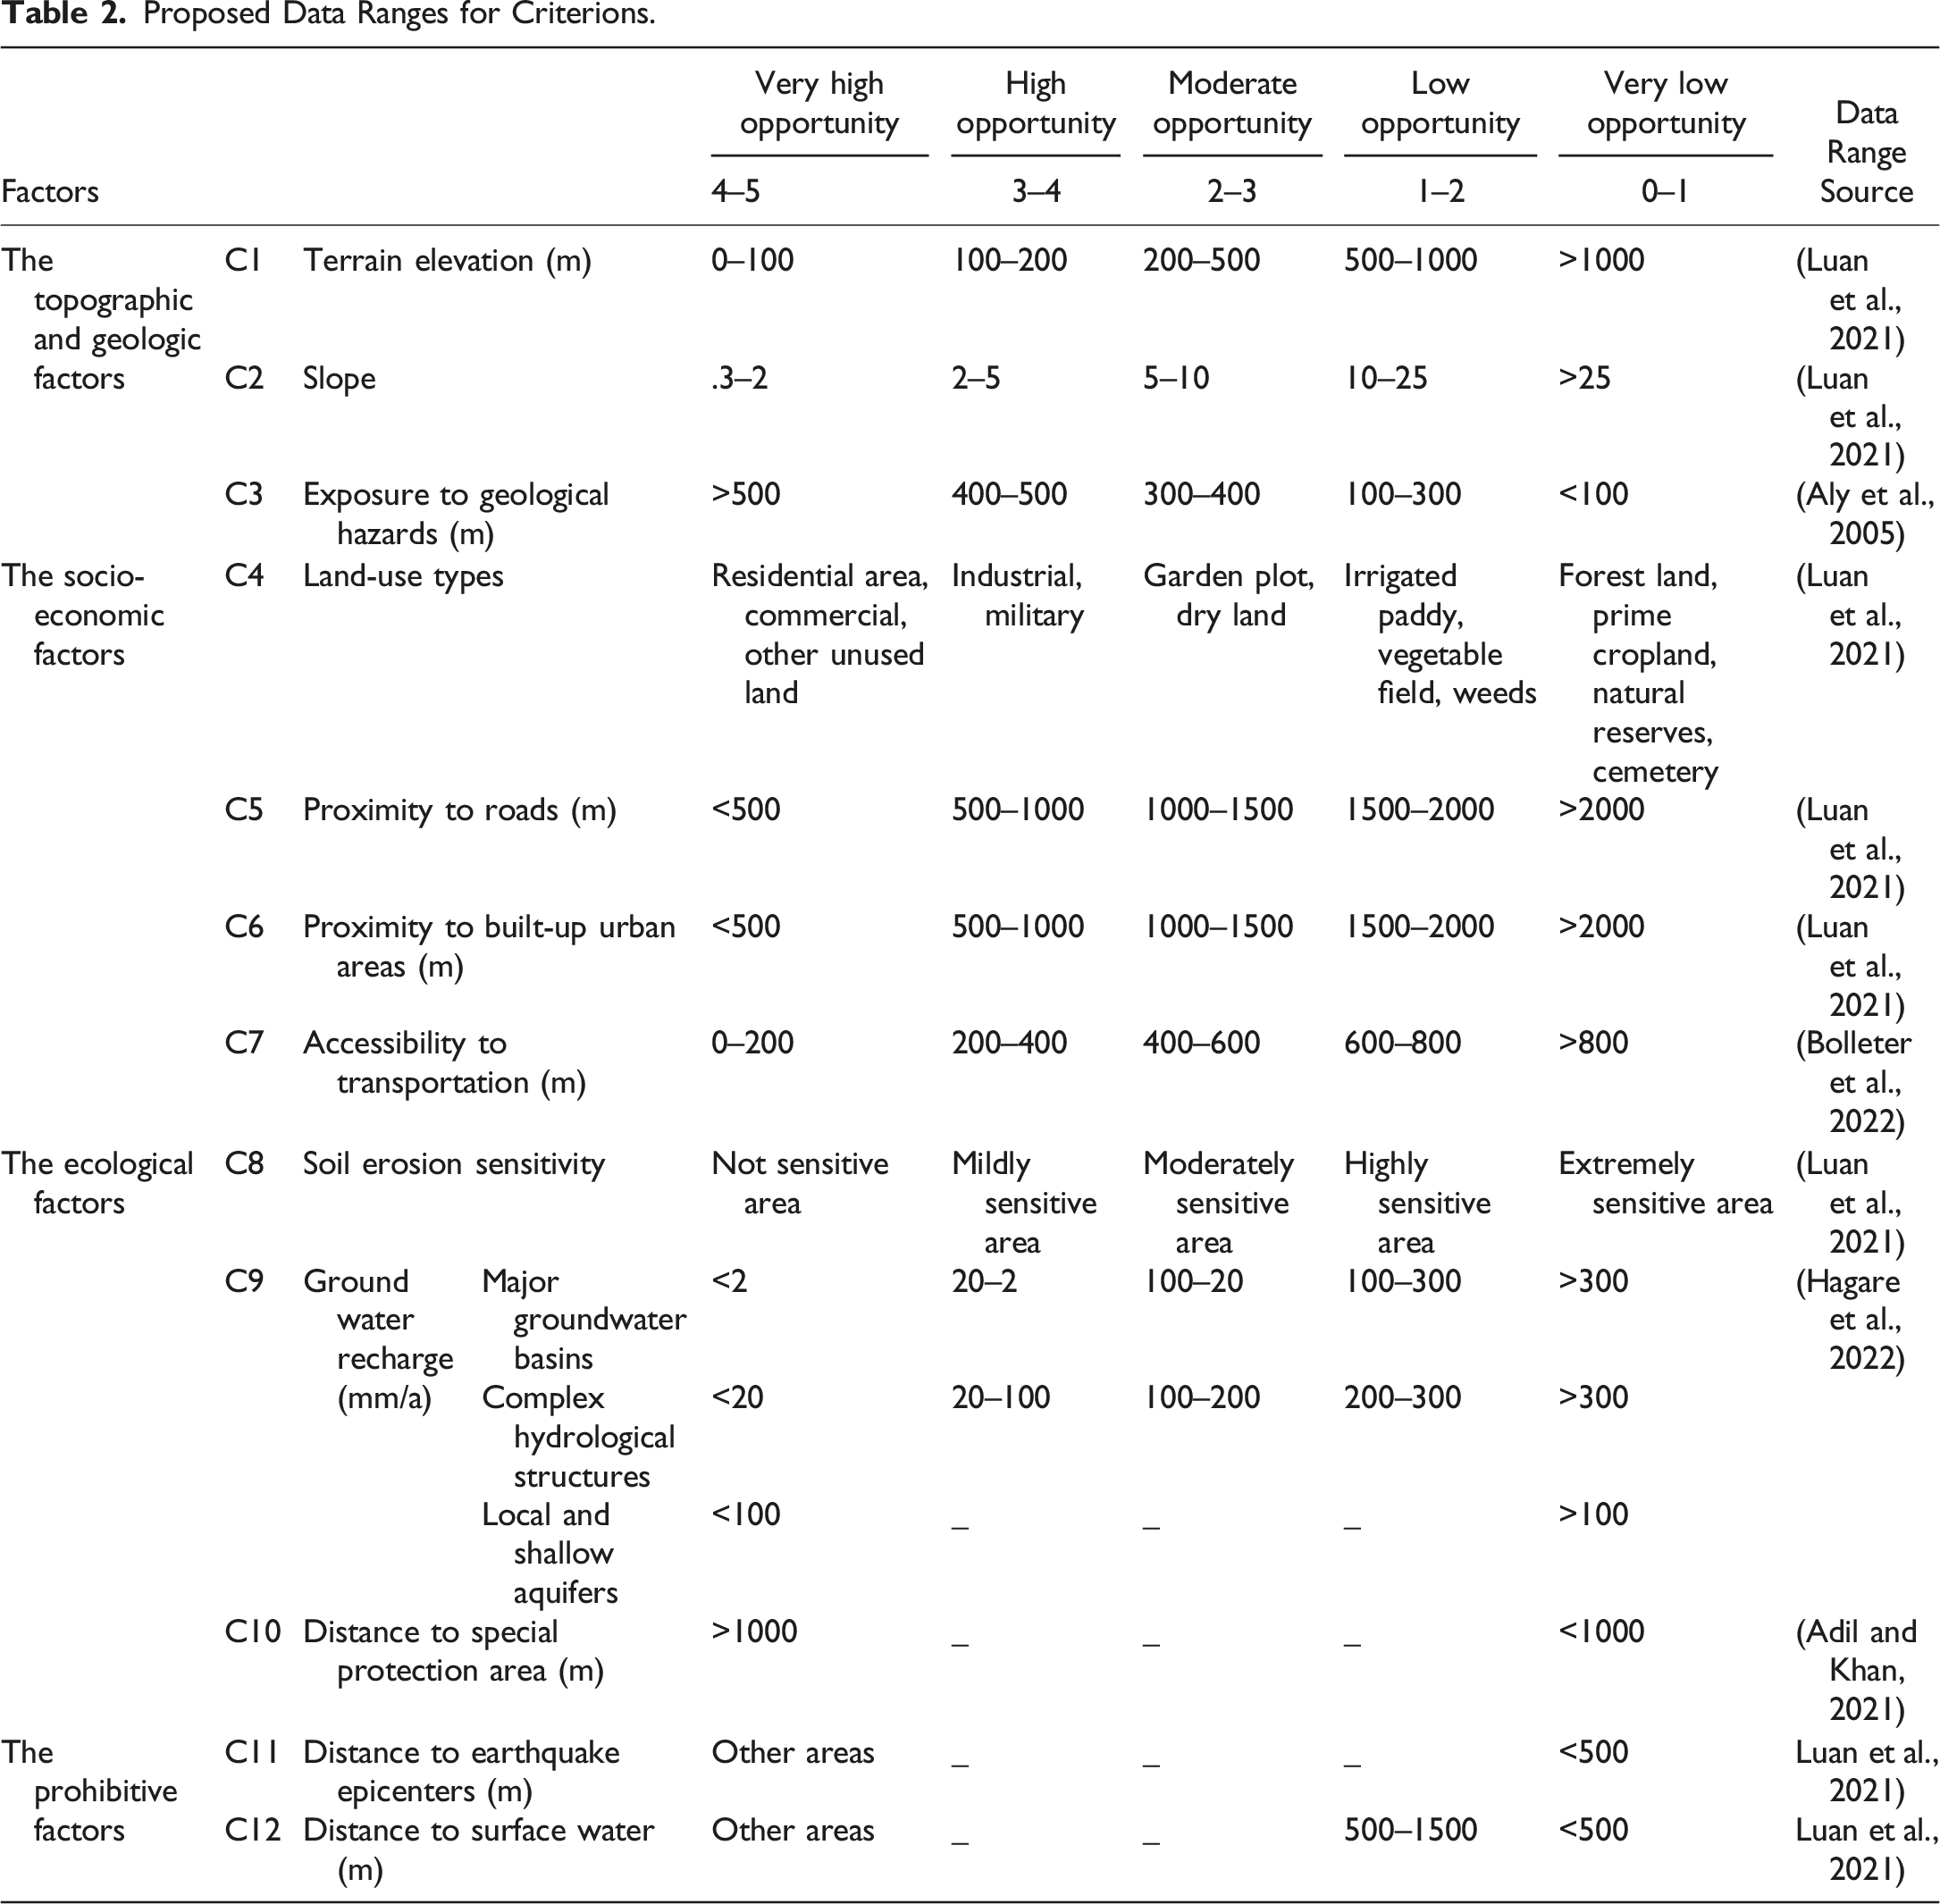
Proposed Data Ranges for Criterions.
AHP Pairwise Comparison Matrix.
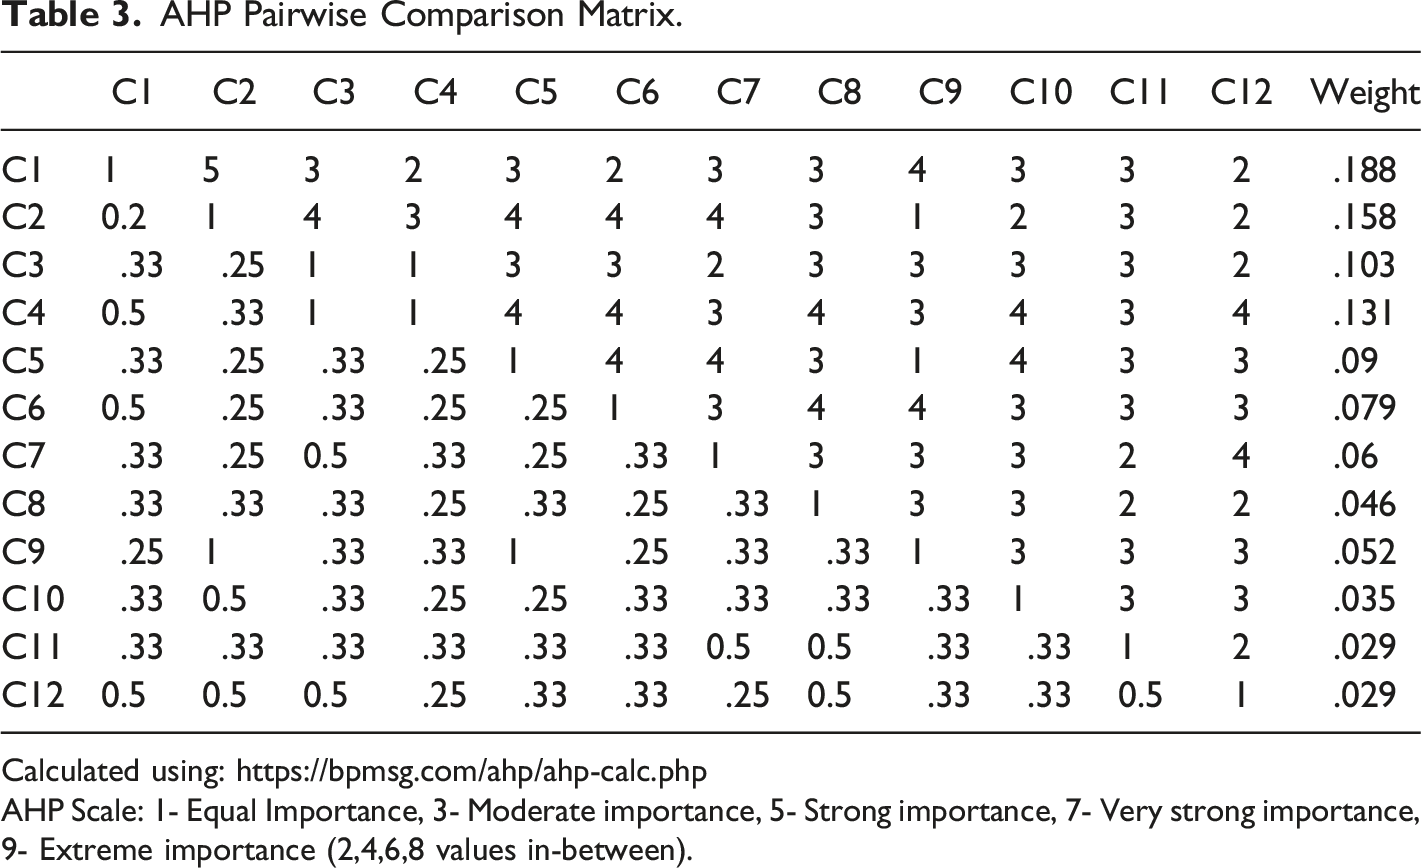
Calculated using: https://bpmsg.com/ahp/ahp-calc.php
AHP Scale: 1- Equal Importance, 3- Moderate importance, 5- Strong importance, 7- Very strong importance, 9- Extreme importance (2,4,6,8 values in-between).
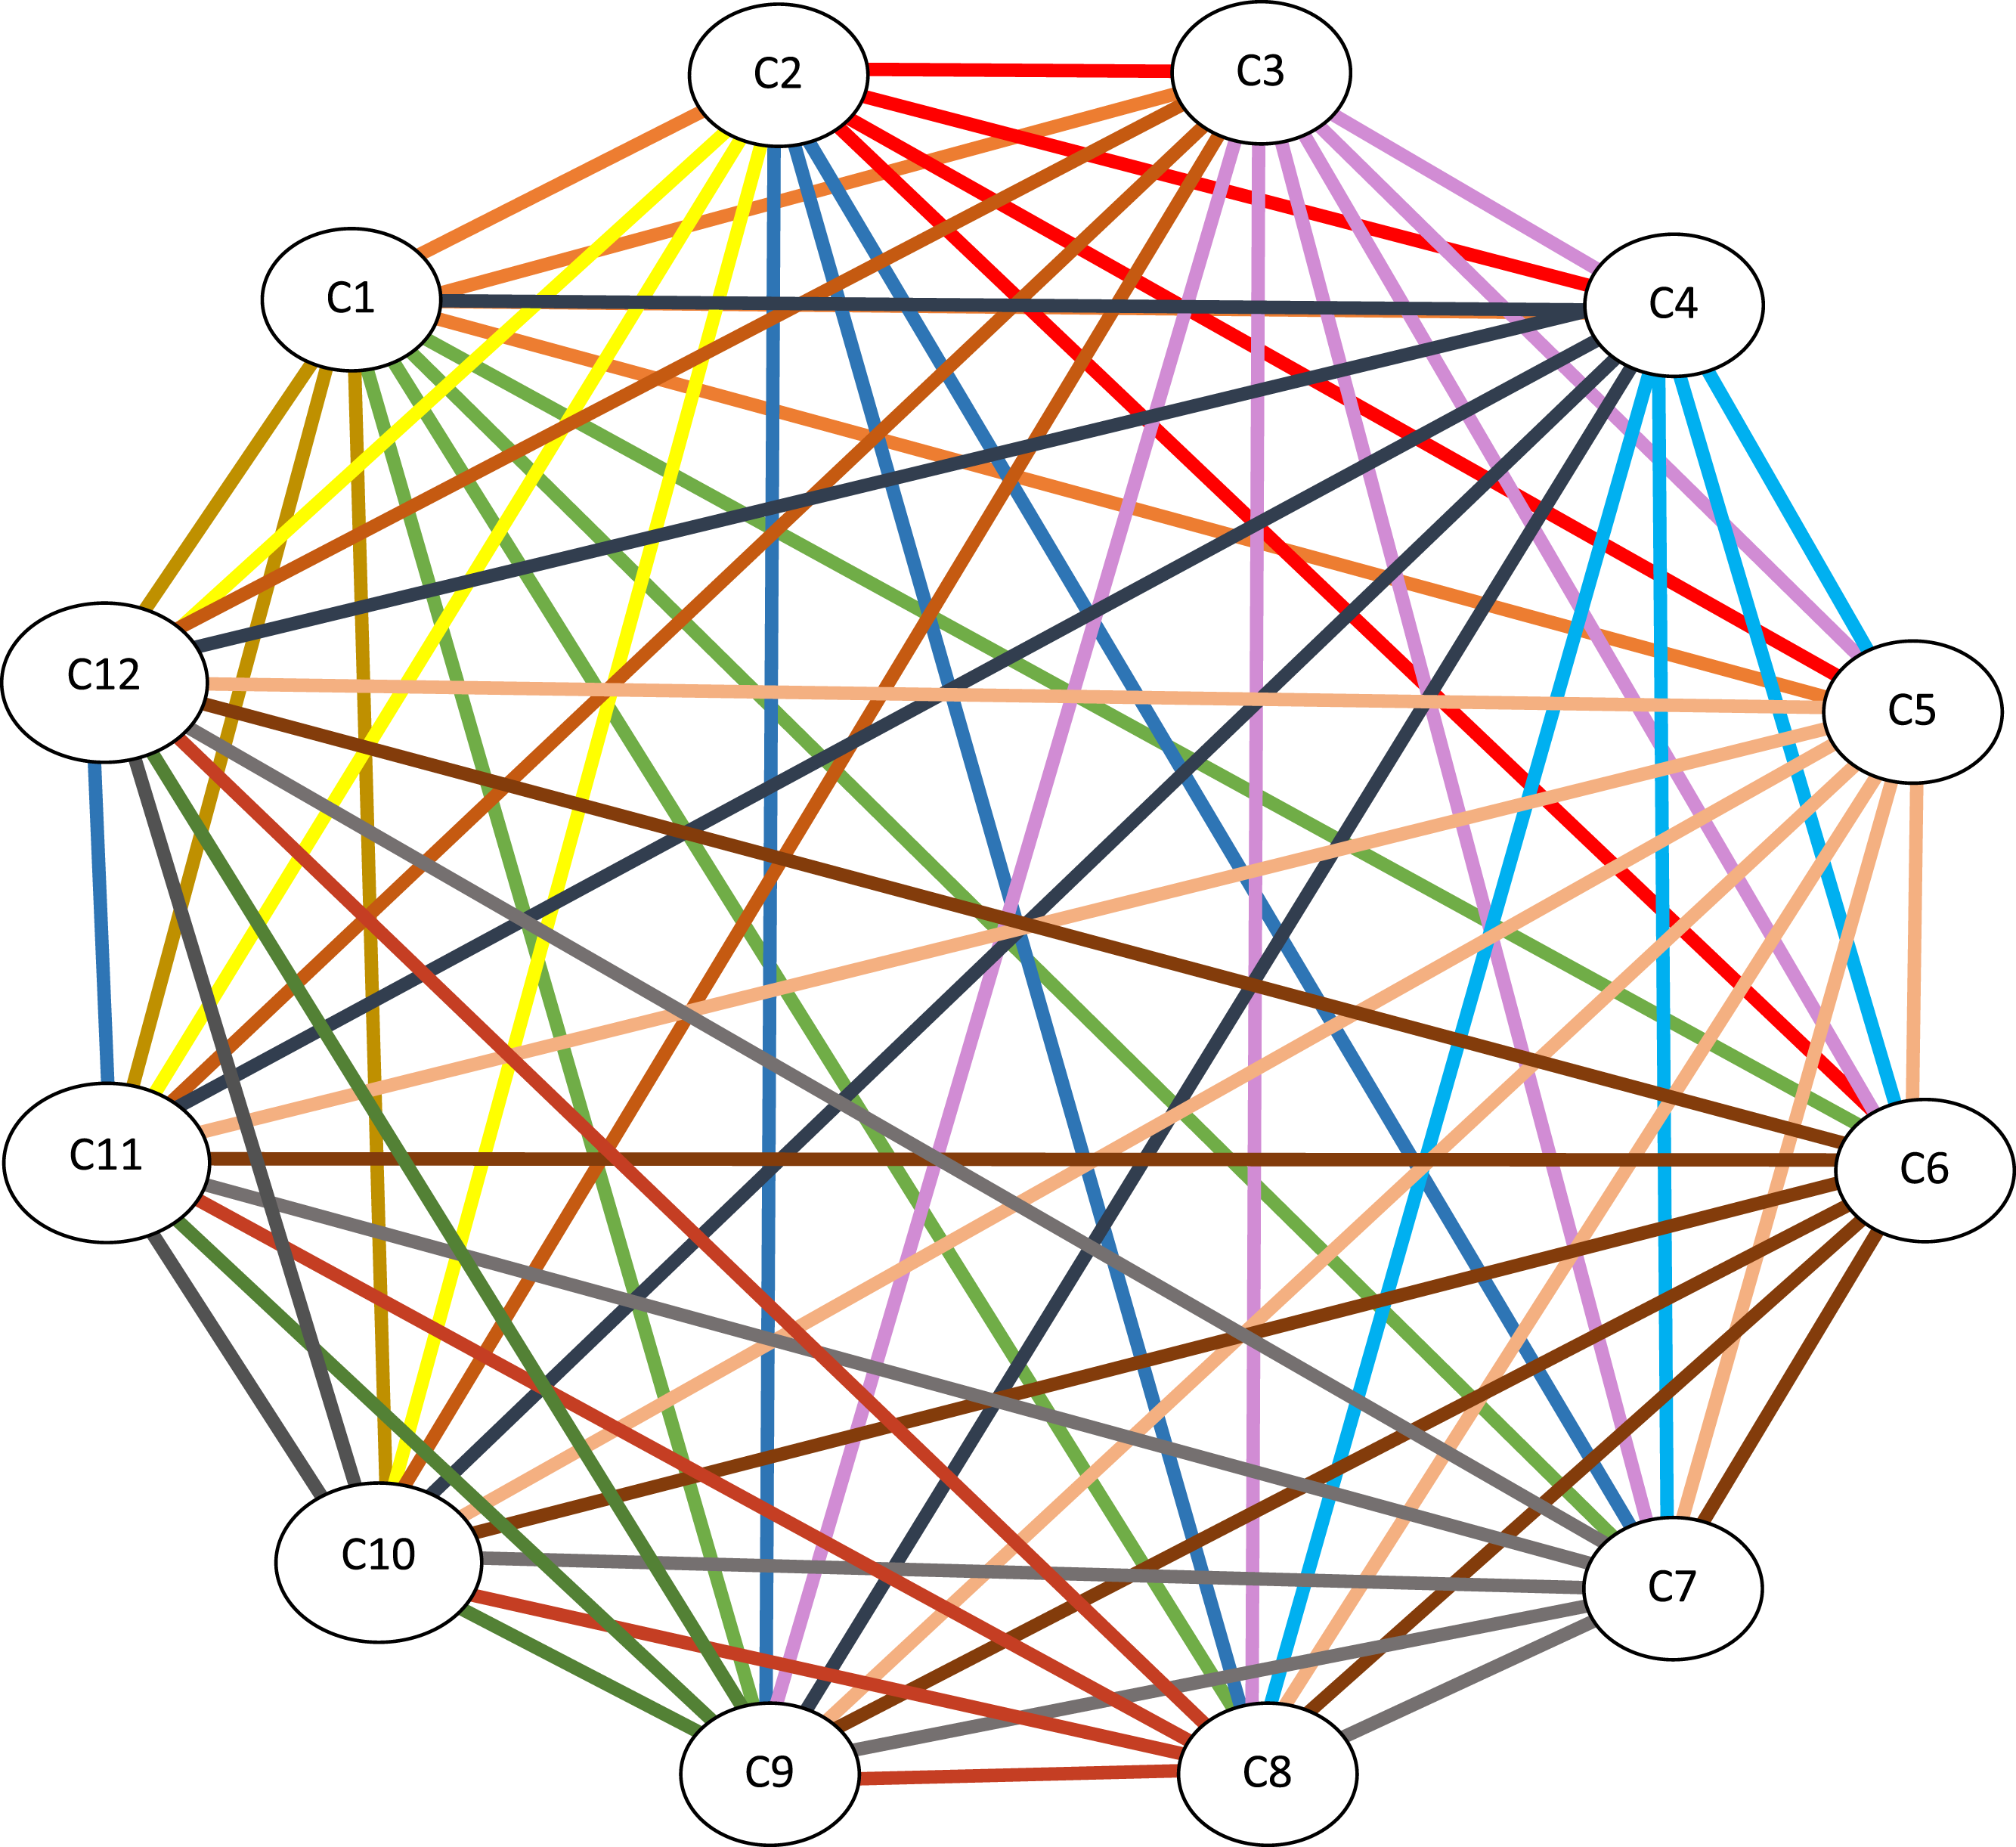
Correlation Between Criterions.
Model Conceptual Design
The designer develops a conceptual model to provide a high-level blueprint for how the entire process will behave and integrate properly (Li et al., 2019). It is composed of various components that control how the data is organized and is consequently displayed in the user interface and how final results are displayed for decision-making support. In the land suitability conceptual model design, after the data categories and criterions is identified, data formats must be defined to determine the processing tools utilized for performing specific analysis for data layers and the expected outputs from each step of the data processing as shown in Figure 4. Land Suitability Analysis Model conceptual Design.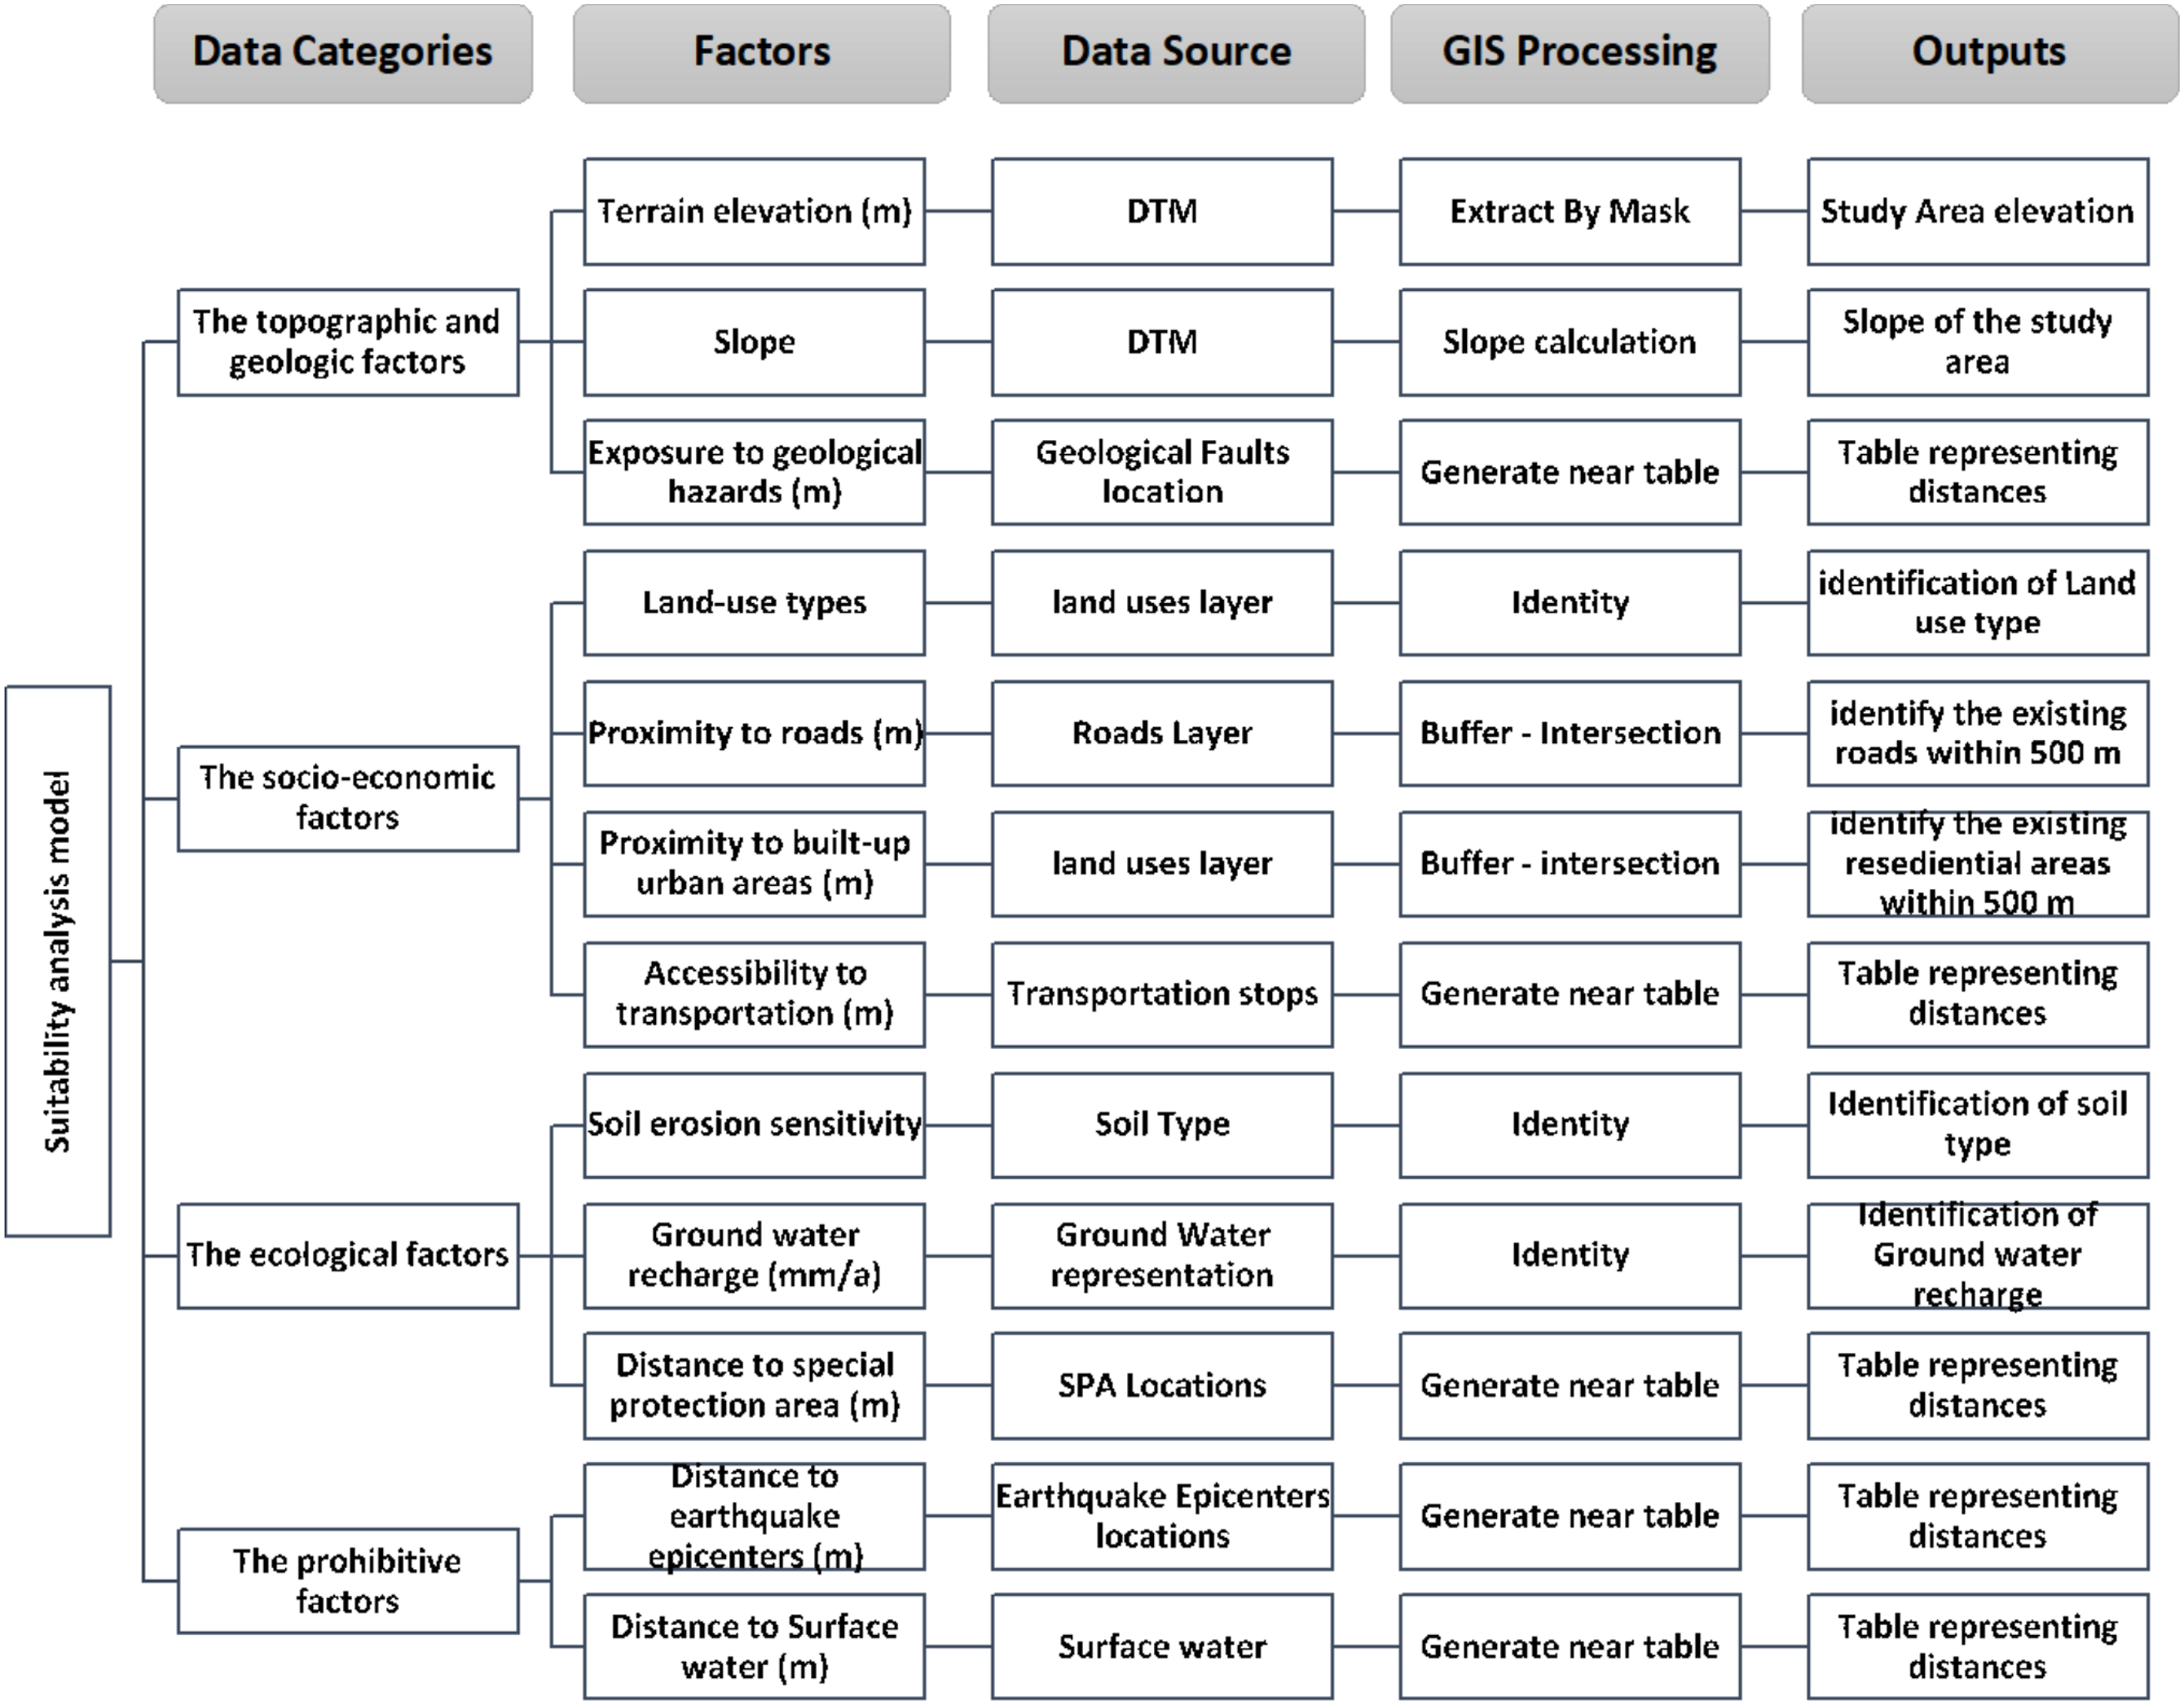
Data Collection and Database Design
After the model is conceptually designed, the data is collected from different sources to be prepared for processing.
Data Sources Identification.
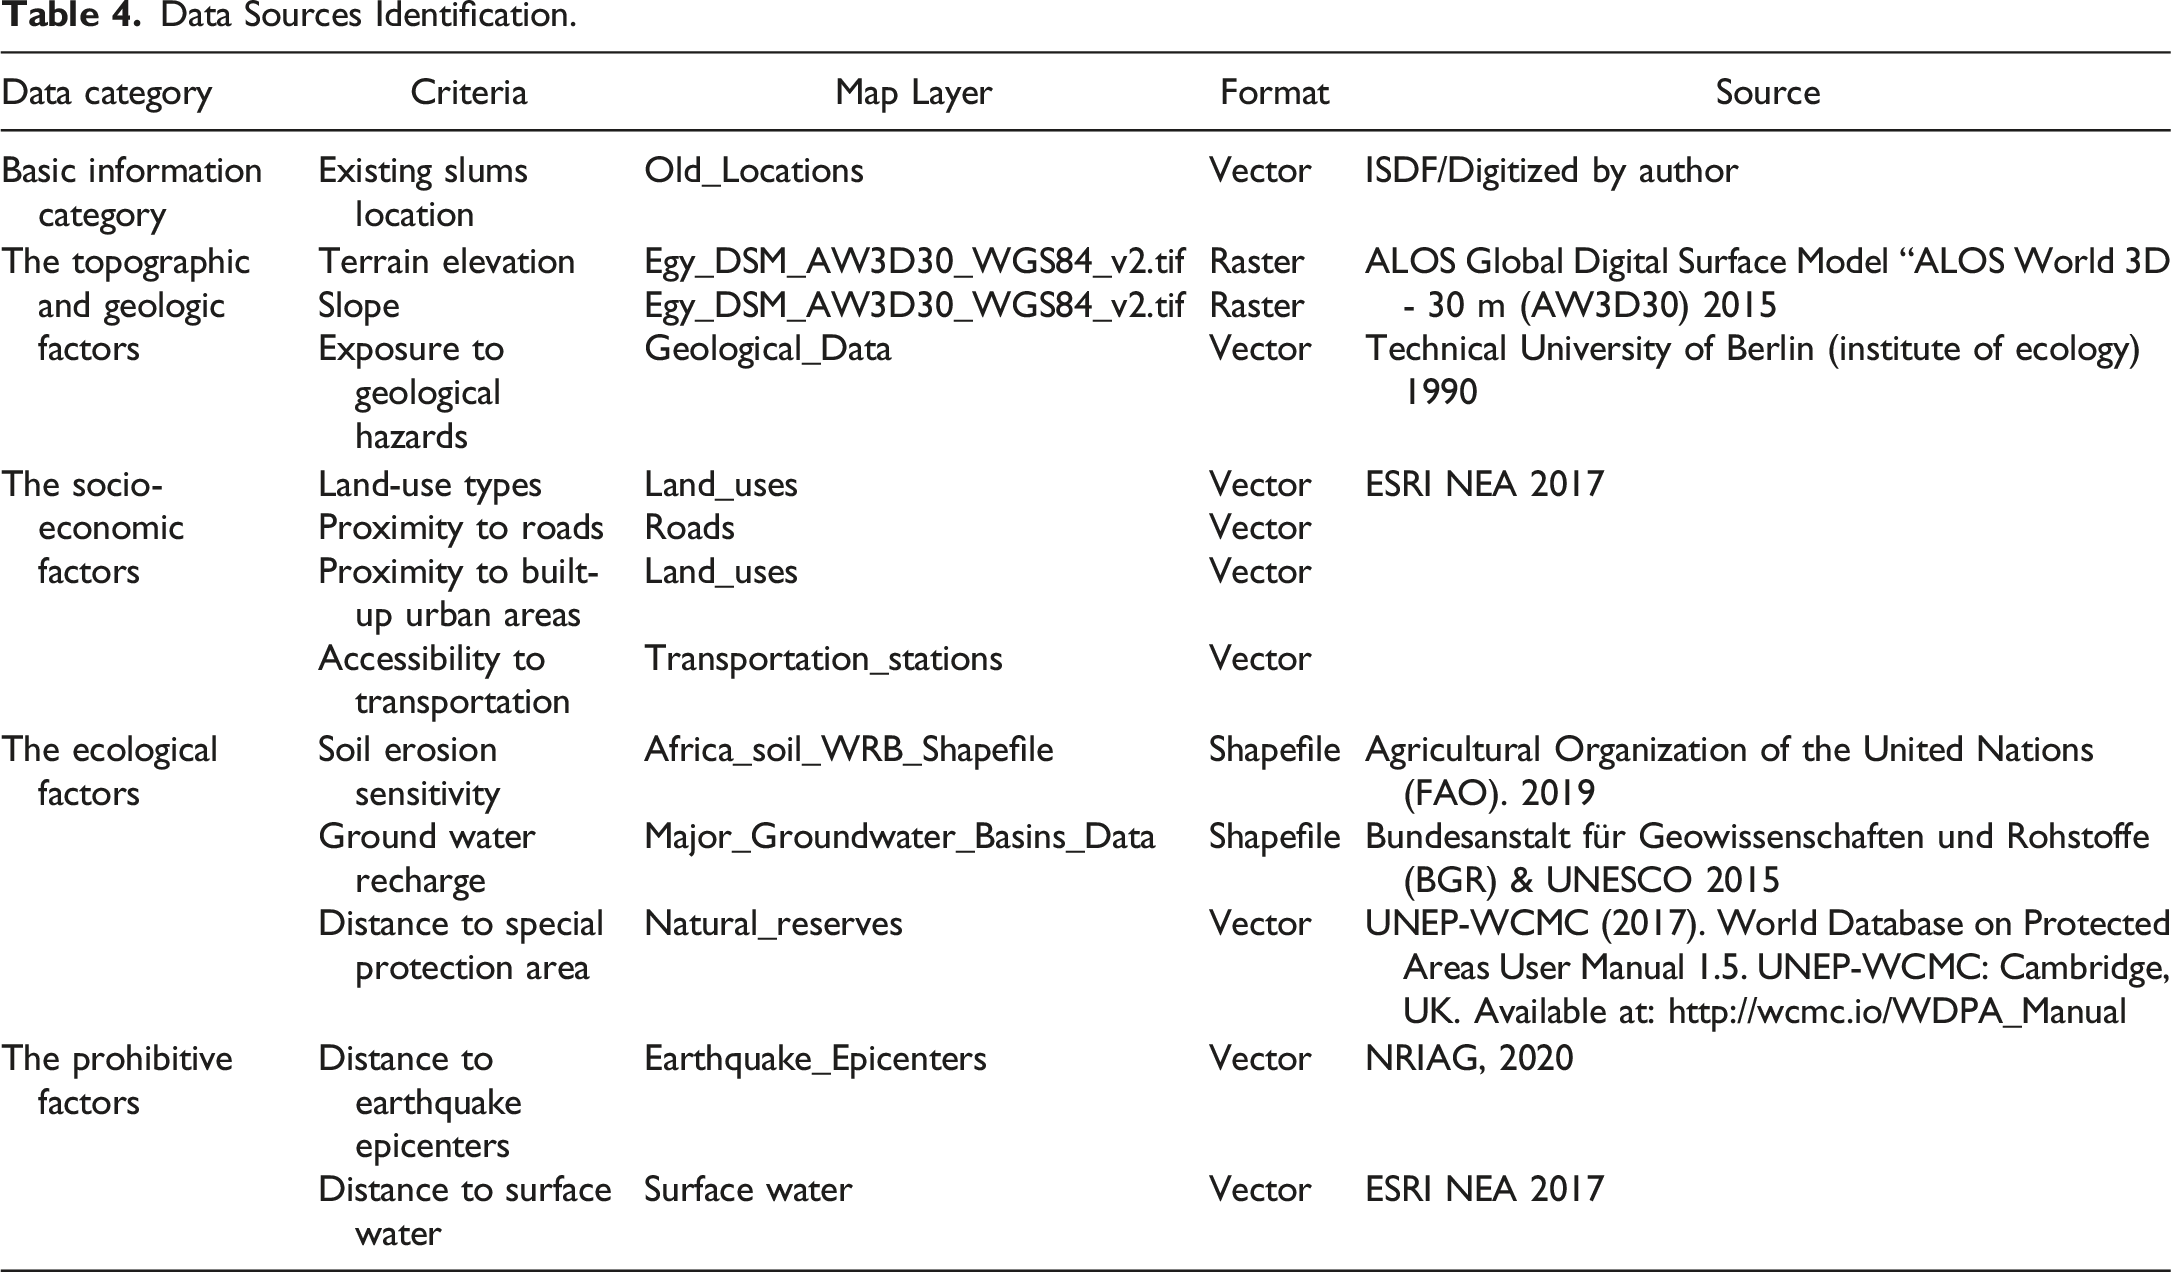
All data are adjusted to be stored and analyzed using ArcGIS Software in file geodatabase as it introduces a wide range of tools and functions for geoprocessing platforms for various data types and formats.
Data Processing and Results
Using ArcGIS Model Builder in Processing Land Suitability Analysis
As was previously mentioned, employing the model builder makes it possible to carry out multiple tasks concurrently. In this case, the proposed model for using MCDA with ArcGIS ModelBuilder was employed using different tools of the arc toolbox, the resulted layers are added to the display to complete the analysis process as shown in Figure 5. In the next section, detailed description of the used geoprocessing tools is describes and discussed. The Complete Applied Model for Land Suitability Analysis.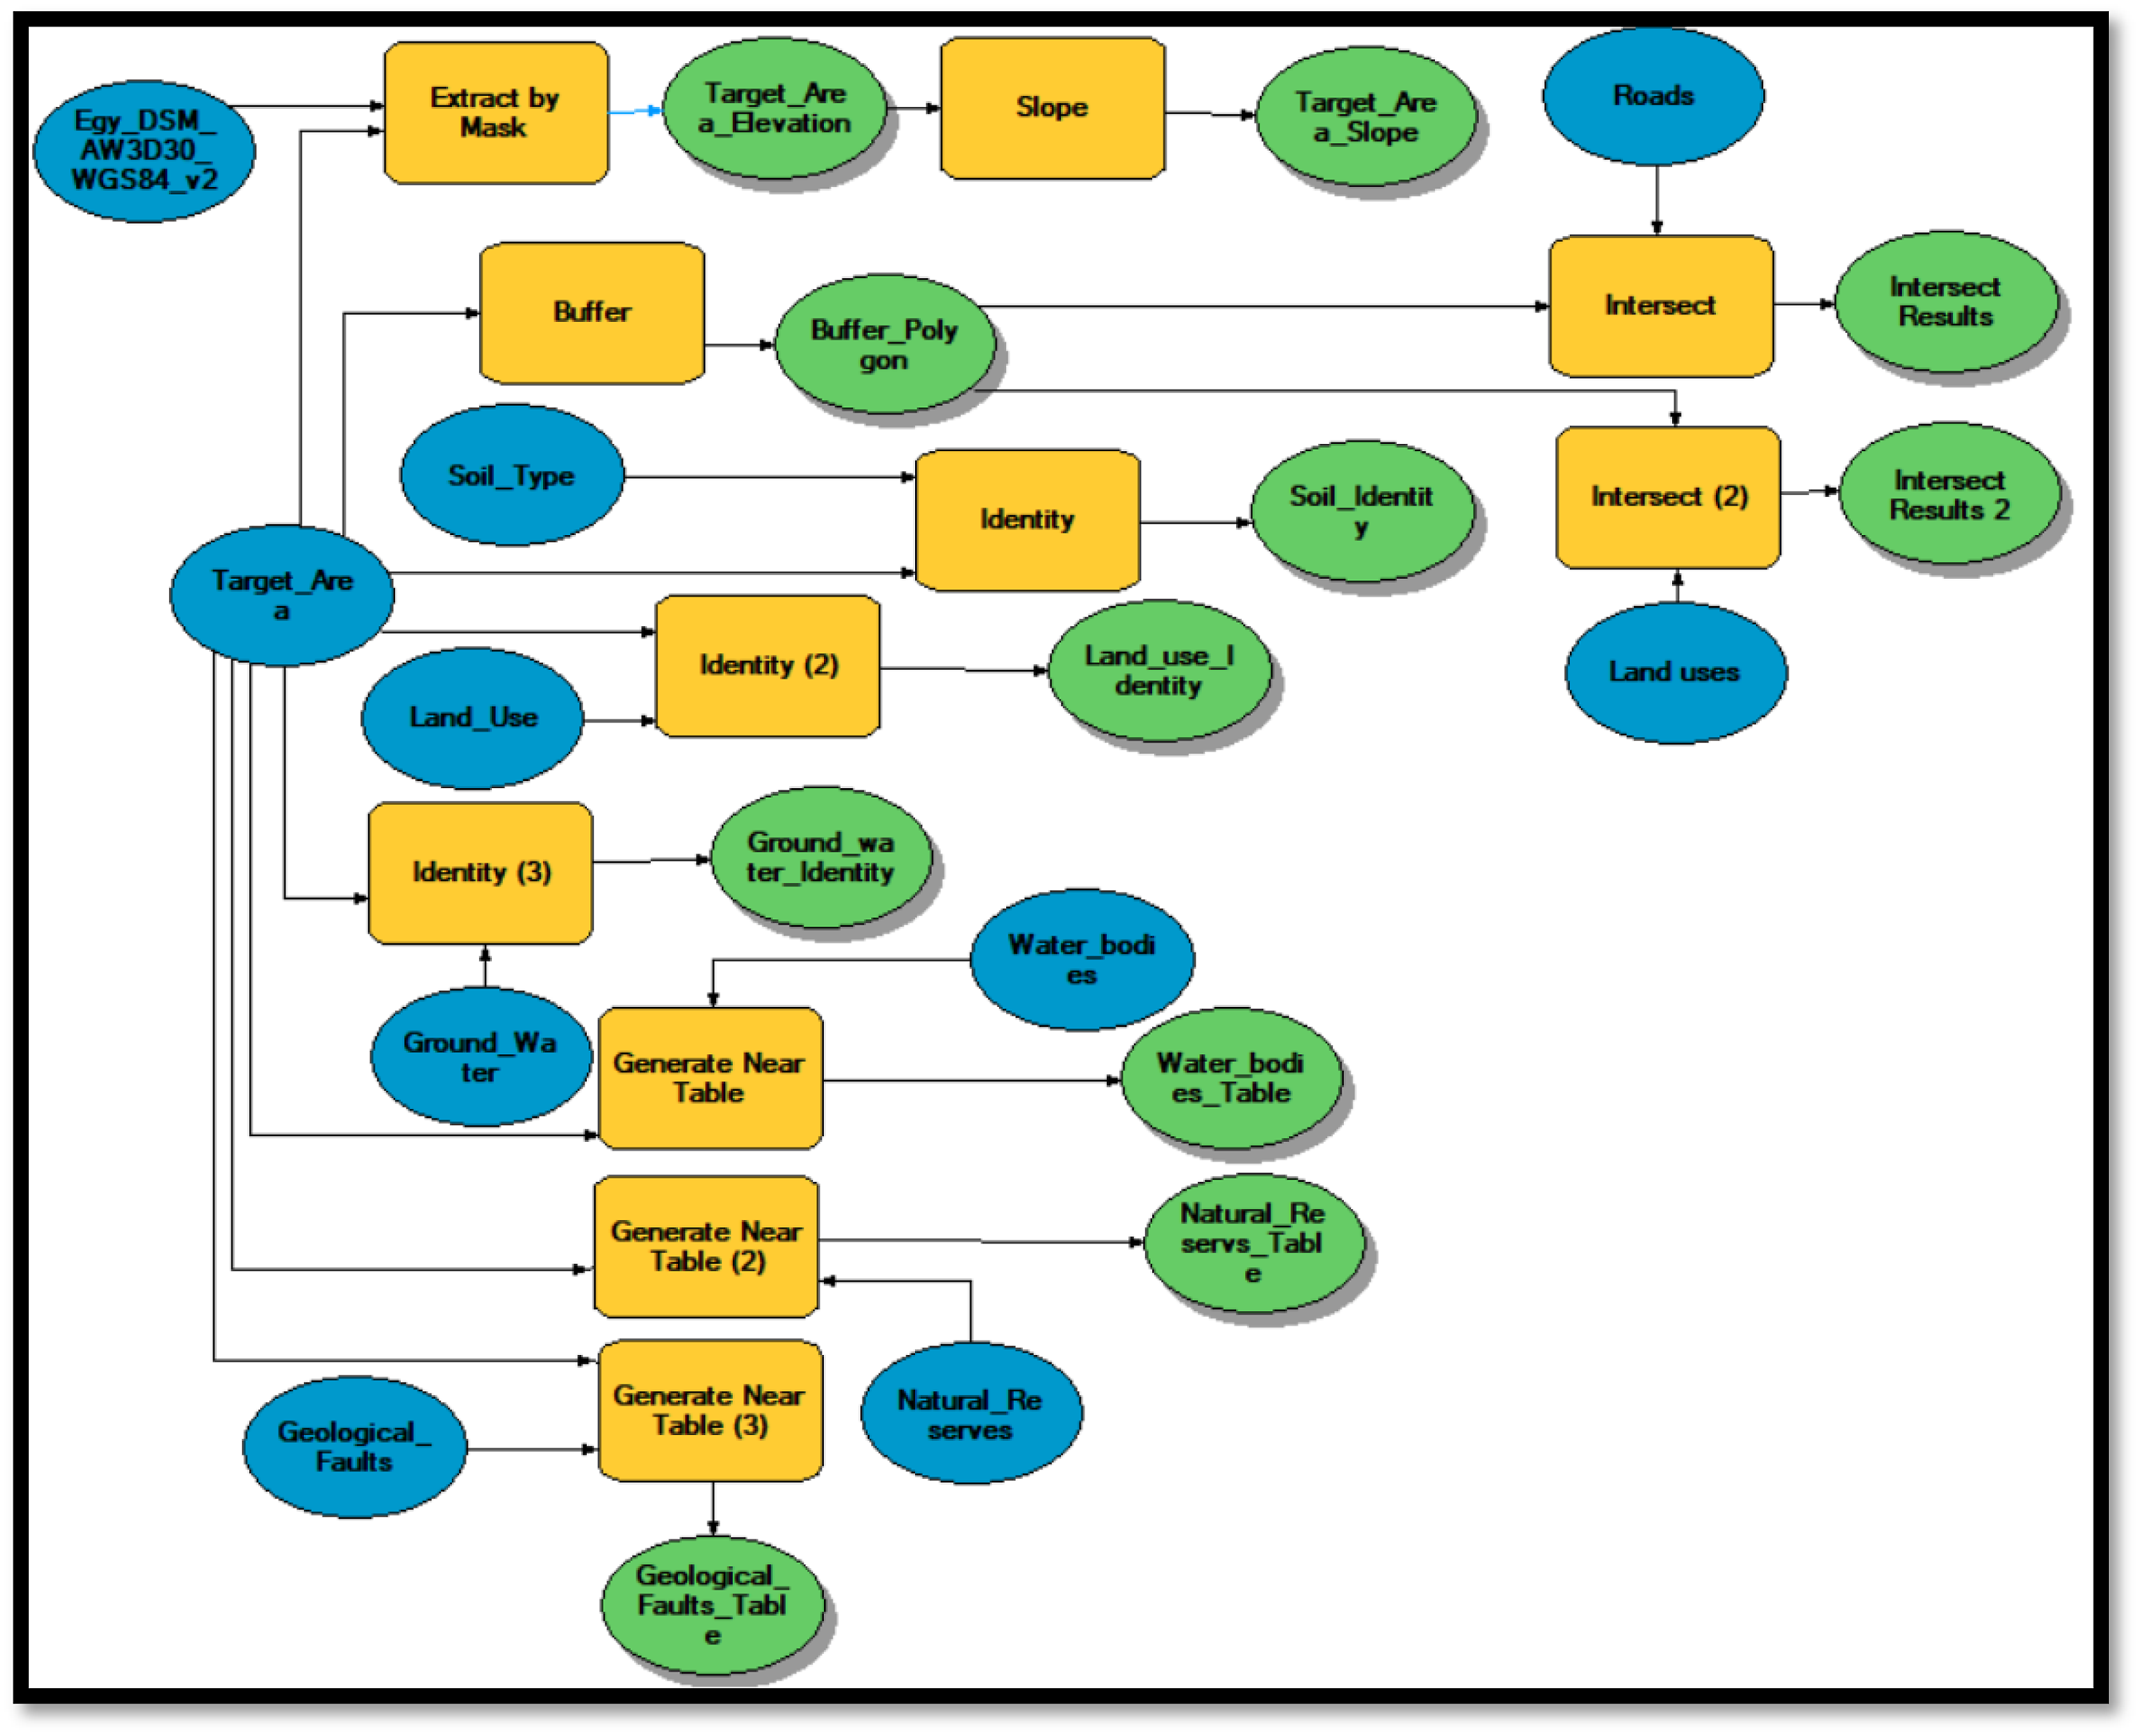
Extraction of Slopes and Elevation of Proposed Sites
Digital Surface Models (DSMs) are elevation information for each raster cell in raster formats. DSMs are widely used for calculations, manipulations, and in-depth examination of a region, and more analysis particularly focused on elevation. The DEM can be converted directly into a slope map with the Slope tool as shown in Figure 6. This map provides a representation of the slope in degrees for each raster cell based on the elevation at each point. Using Spatial Analyst tool to Extract Elevation and Slopes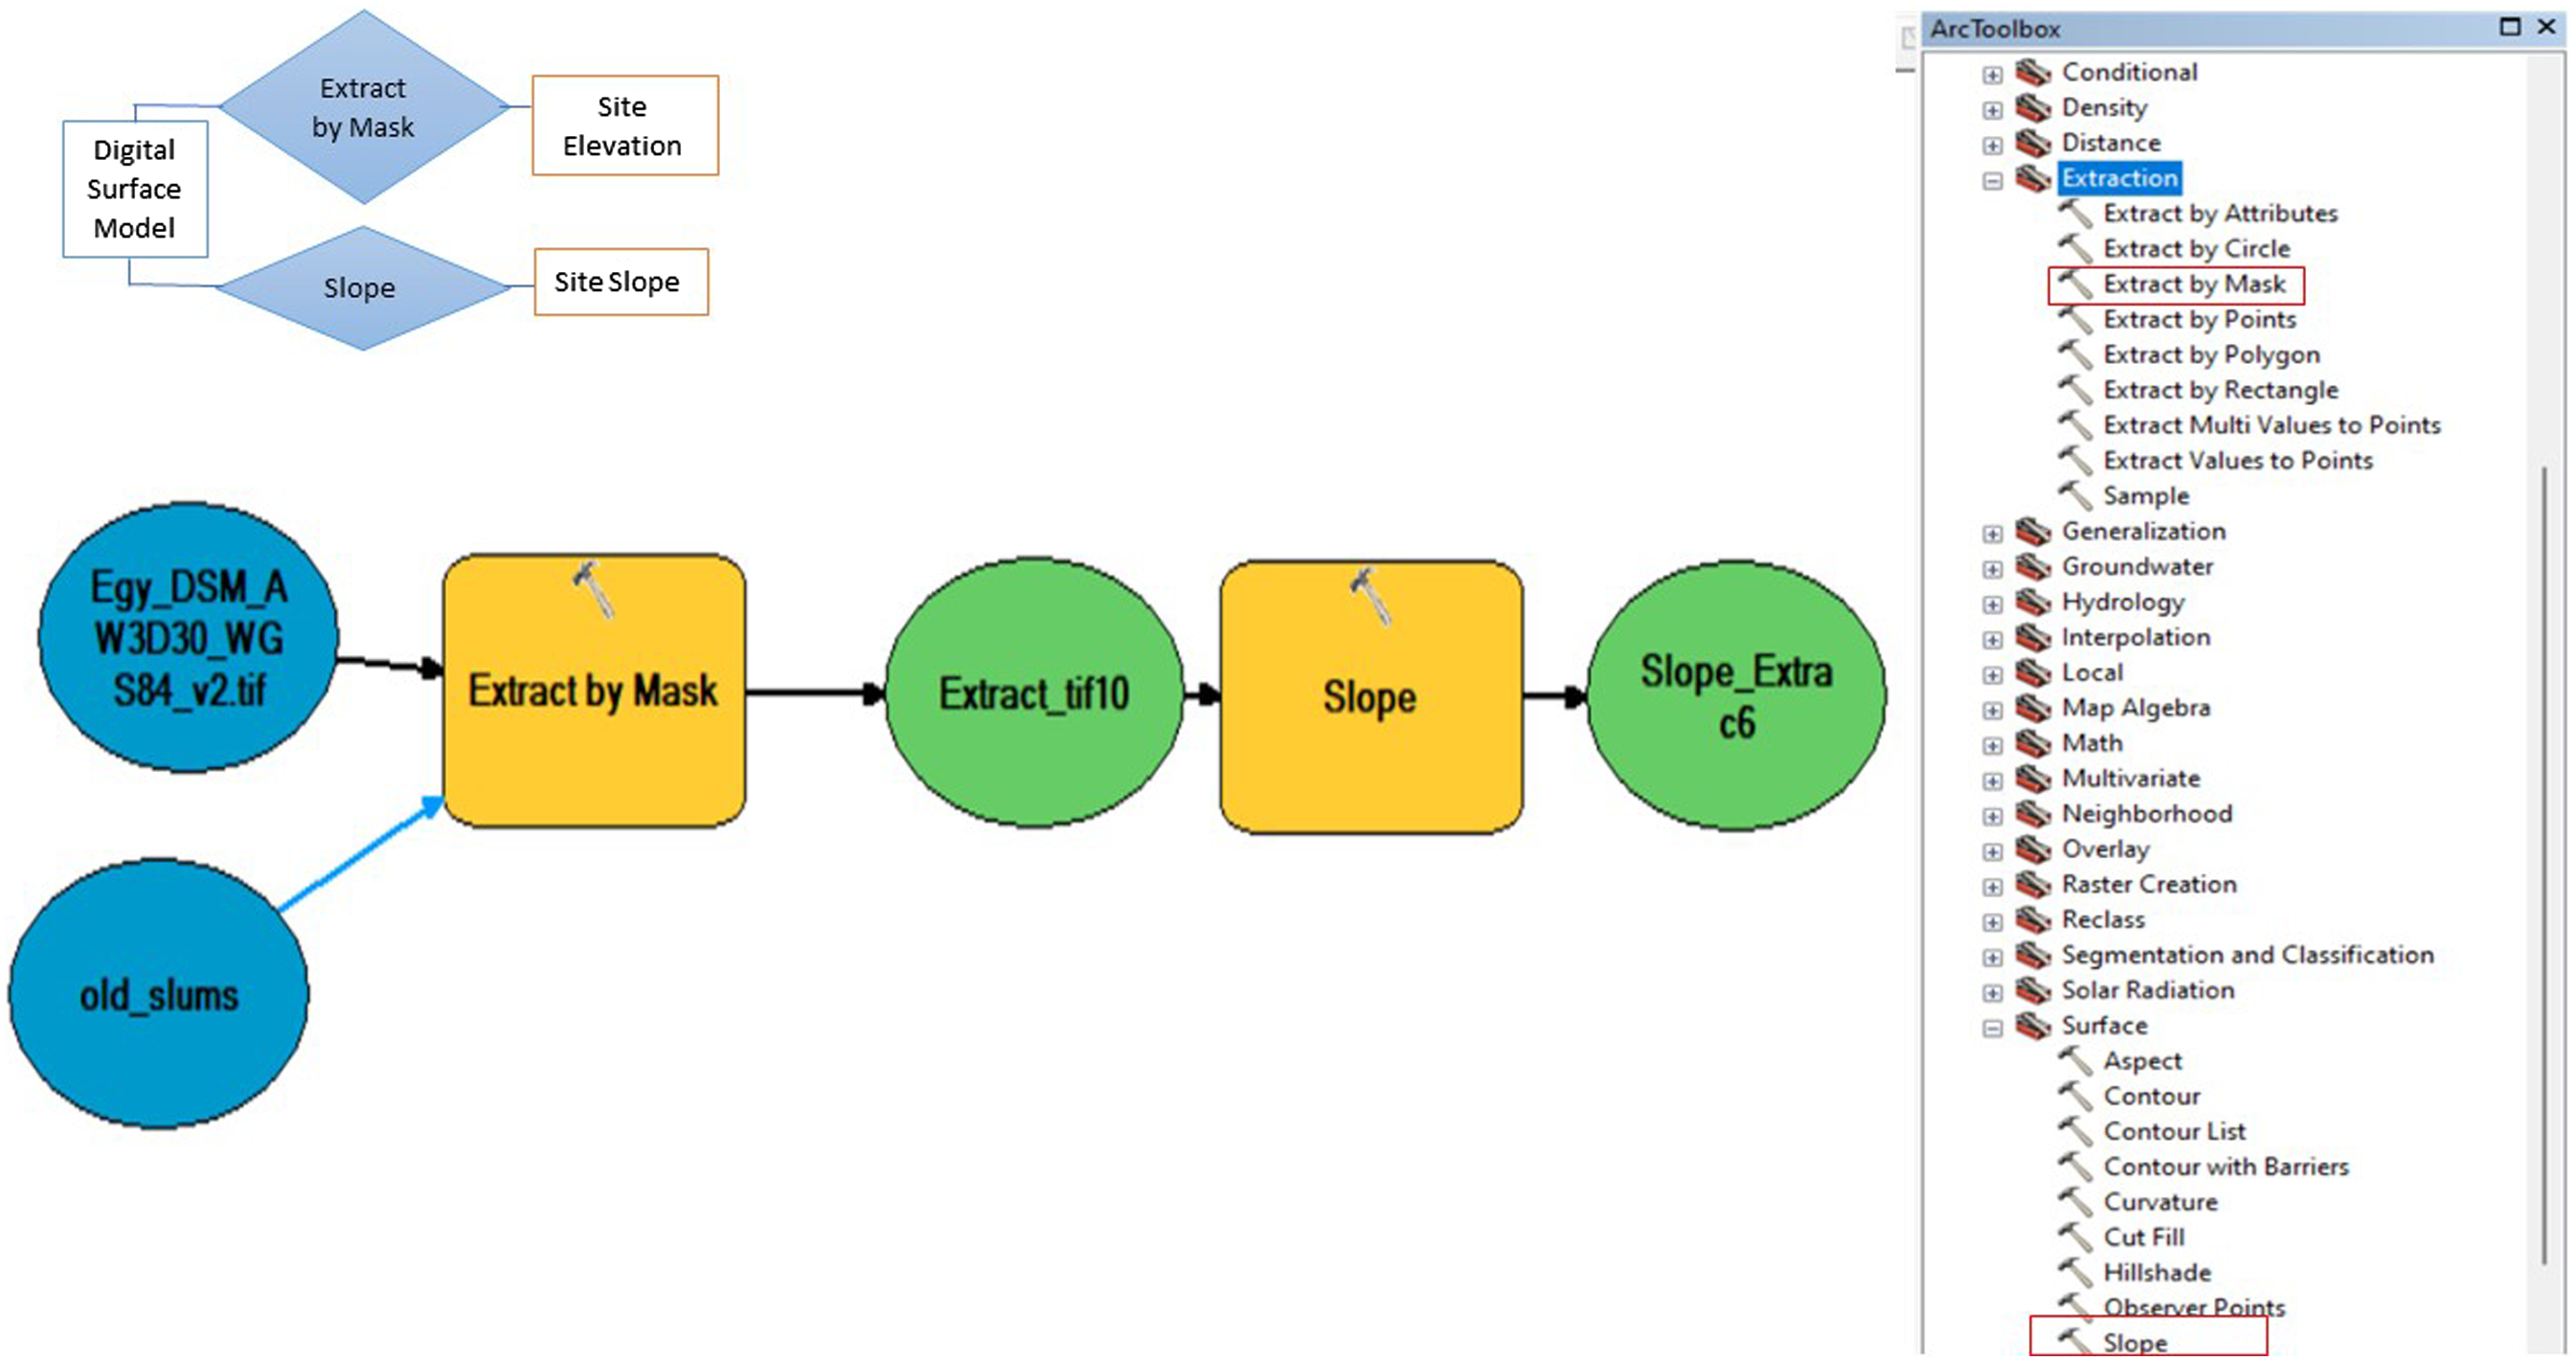
Analyze Proximity to Roads and Urban Built-Up Area
The second set of criteria for determining land suitability analysis is the proximity to roads and urban build-up areas as shown in Figure 7, the model in use defines the minimum necessary distance from the target area as 500 m. Using Overlay Toolset to Identify the Surrounding Roads and Residential Areas.
Calculating Distances Between Target Areas and Specific Layers Generating Table of Distances in Meters
One of the most important entities is the distance to specific layer (surface water—geological faults and special protection areas. The use of Generate Near Table tool is resulting a table identifying the distance between the features in two layers using Arc toolbox > Analysis tools > Proximity toolset > Generate Near Table as shown in Figure 8, while three tables are generated calculating the distance from target study area to Surface water, Natural Reserves and geological faults, respectively. Using Generate near Table Tool to Identify Distances Between Features.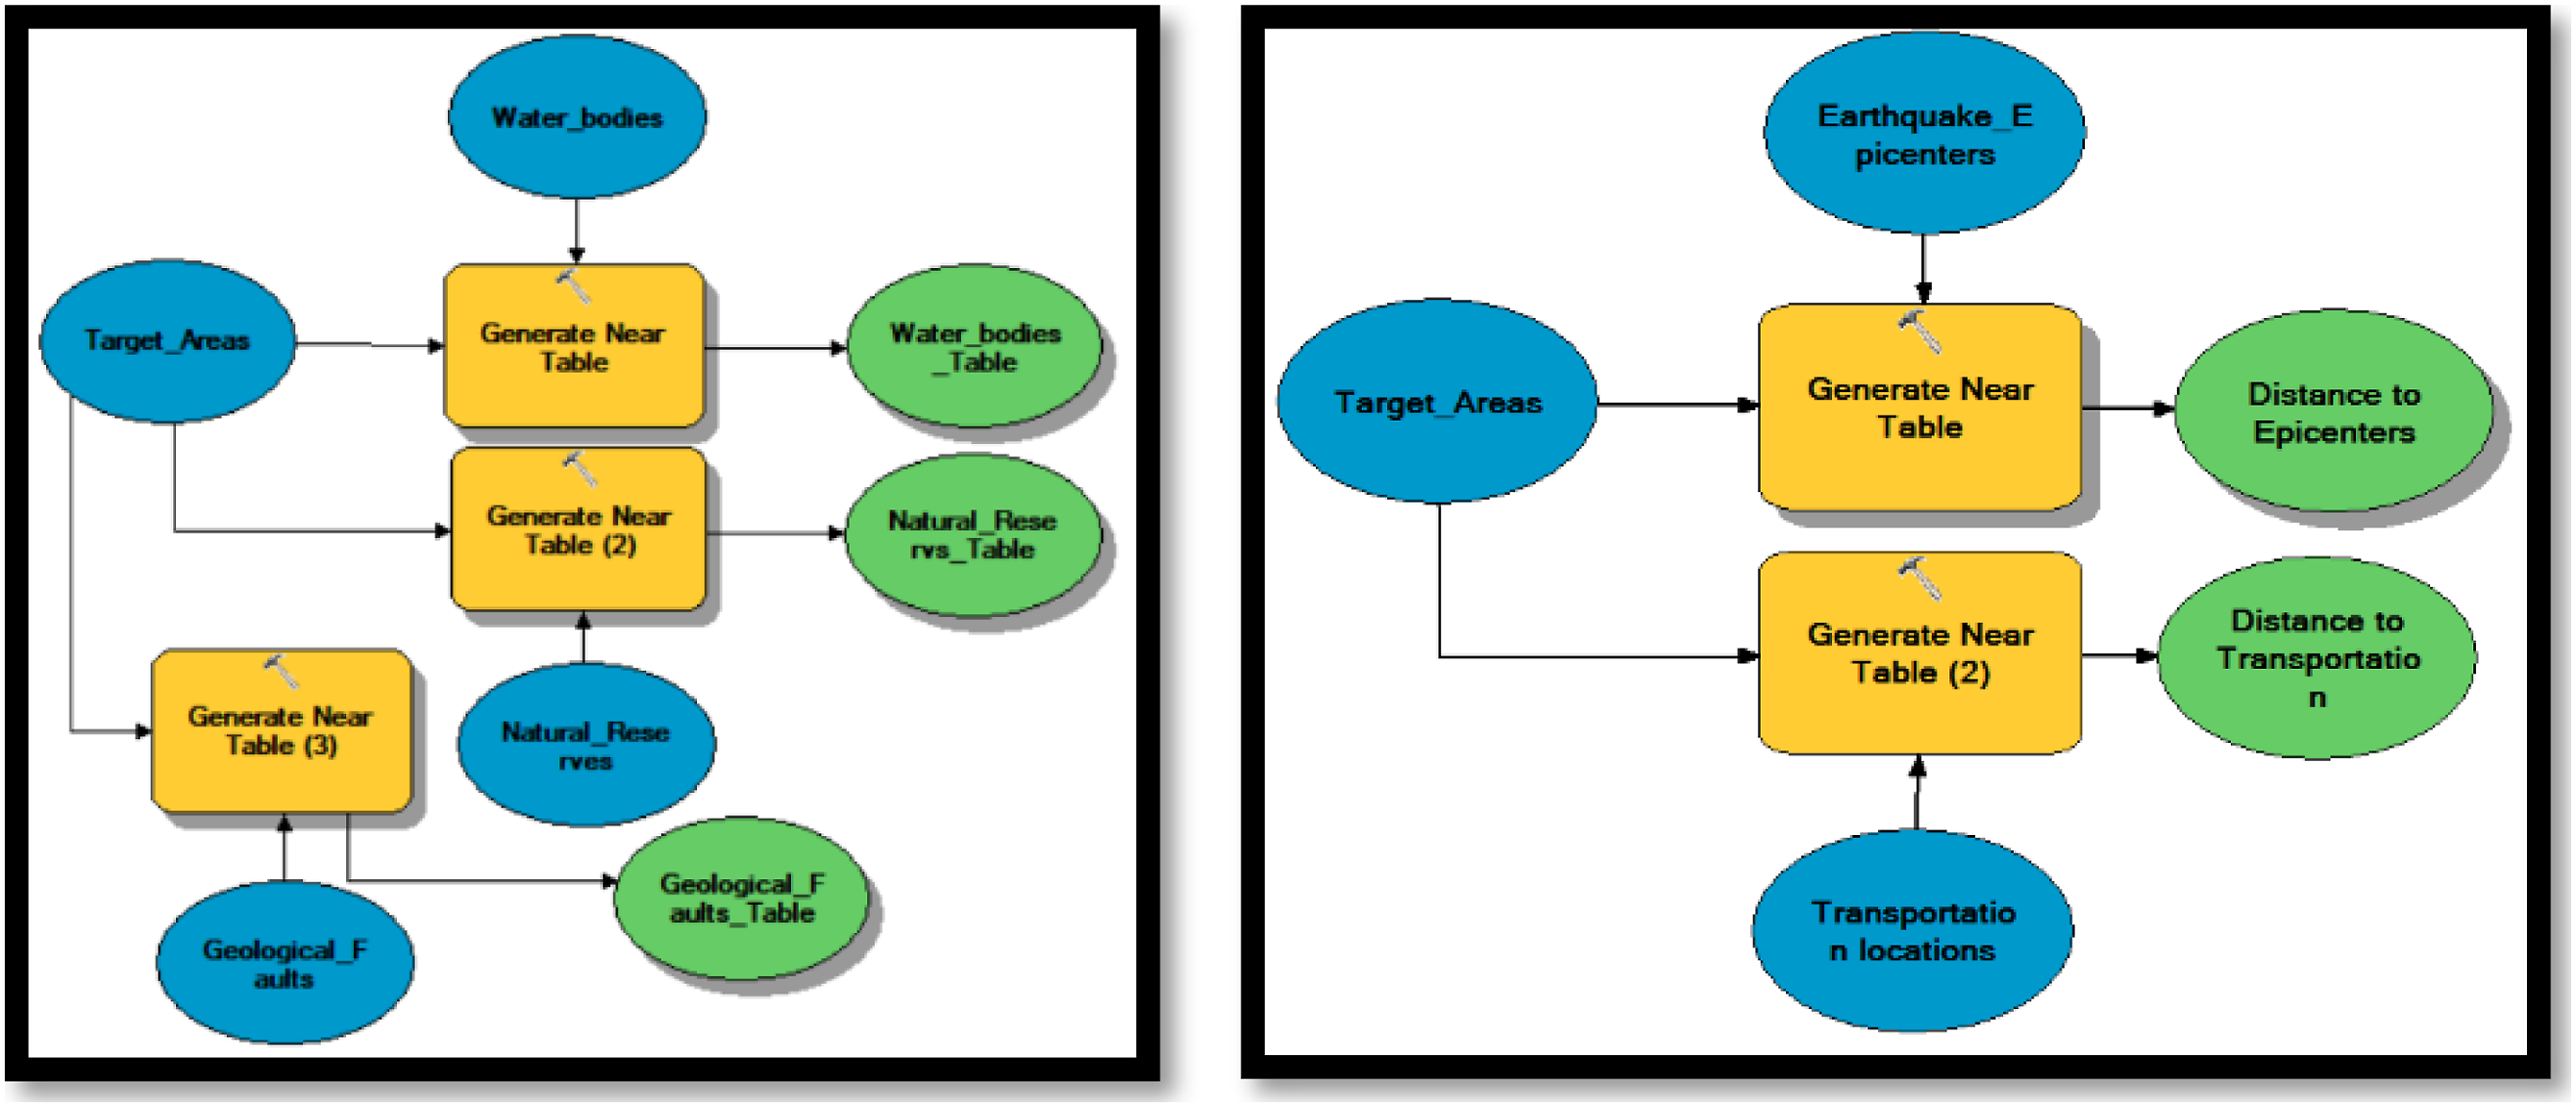
Figure 8 shows an example of the resulted table from Generate near Table tool where IN_FID is the input feature ID defined in the target areas feature class, Near_FID is the ID of the nearest feature in (water bodies, Natural Reserves, Geological faults) and NEAR_DIST is the distance between the two corresponding features in meters (Figure 9). An Example of the Resulted Table from Generate Near Table Tool.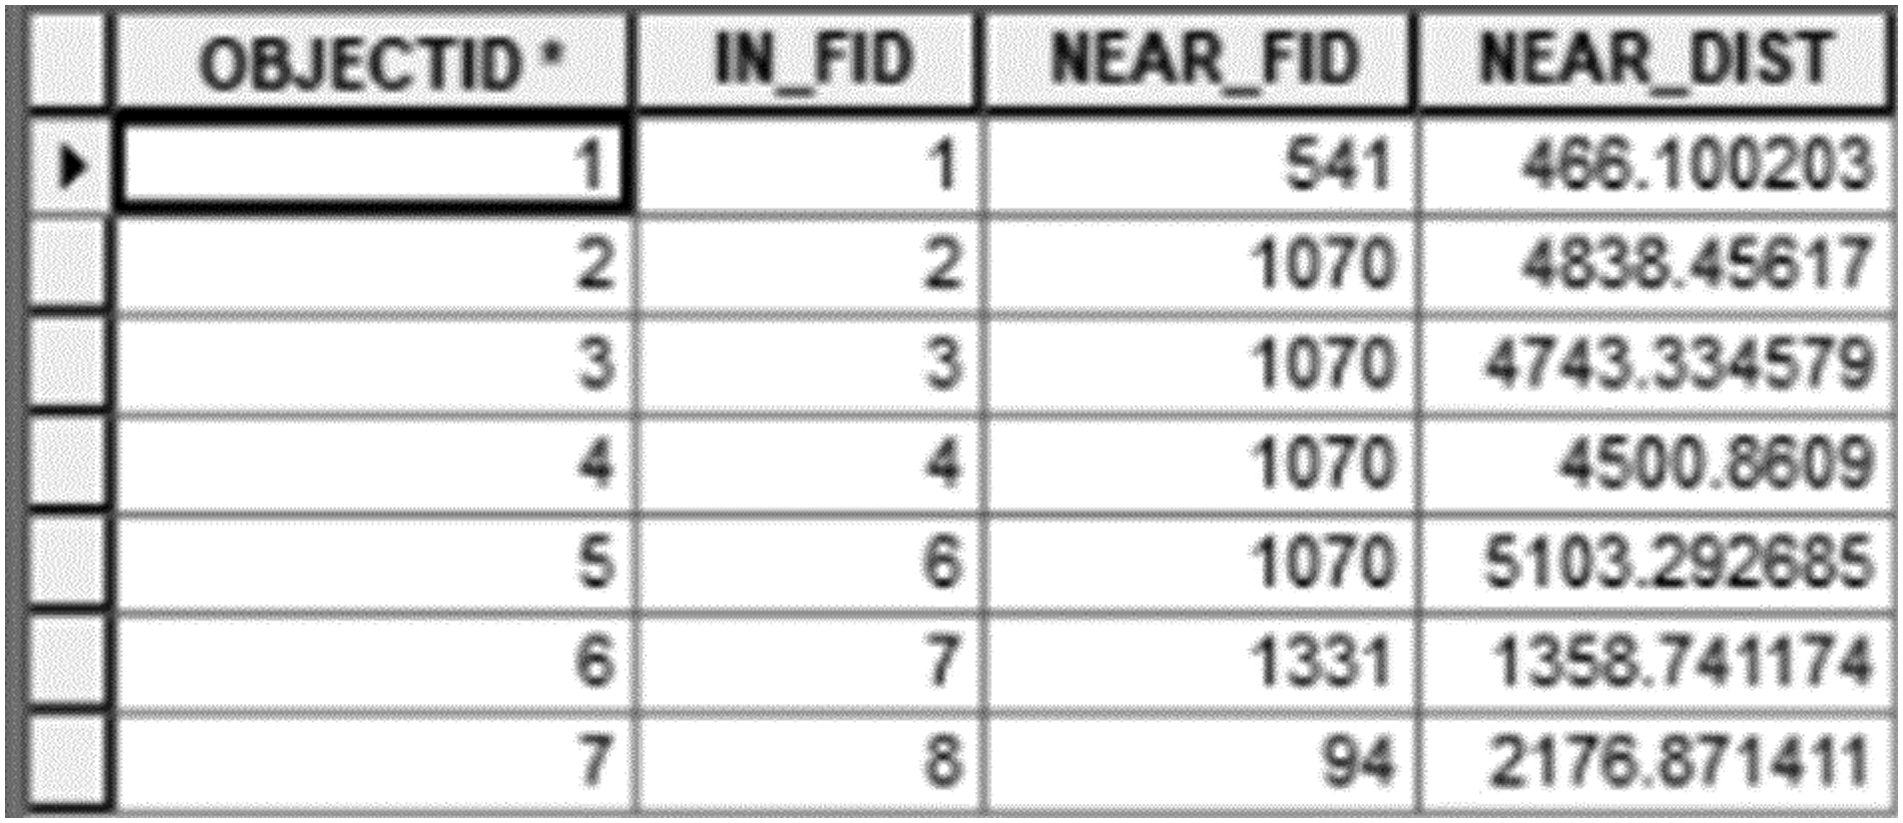
Using Identity Tool to Define the Soil Type, Land-Use, and Ground Water Recharge of the Target Area
The characterization of soil type, along with the description of land-use and groundwater recharge of the target area, is the last step in the analysis. This step allows for the identification of soil erosion and desertification sensitivity. This process could be performed using identity tool to generate a new layer containing the required attributes for the target area, Figure 10 shows the application of identity tool from Arc toolbox > Analysis tools > Overlay toolset > identity. Using Identity Tool to Create New Layers Including Corresponding Data Between Two Layers.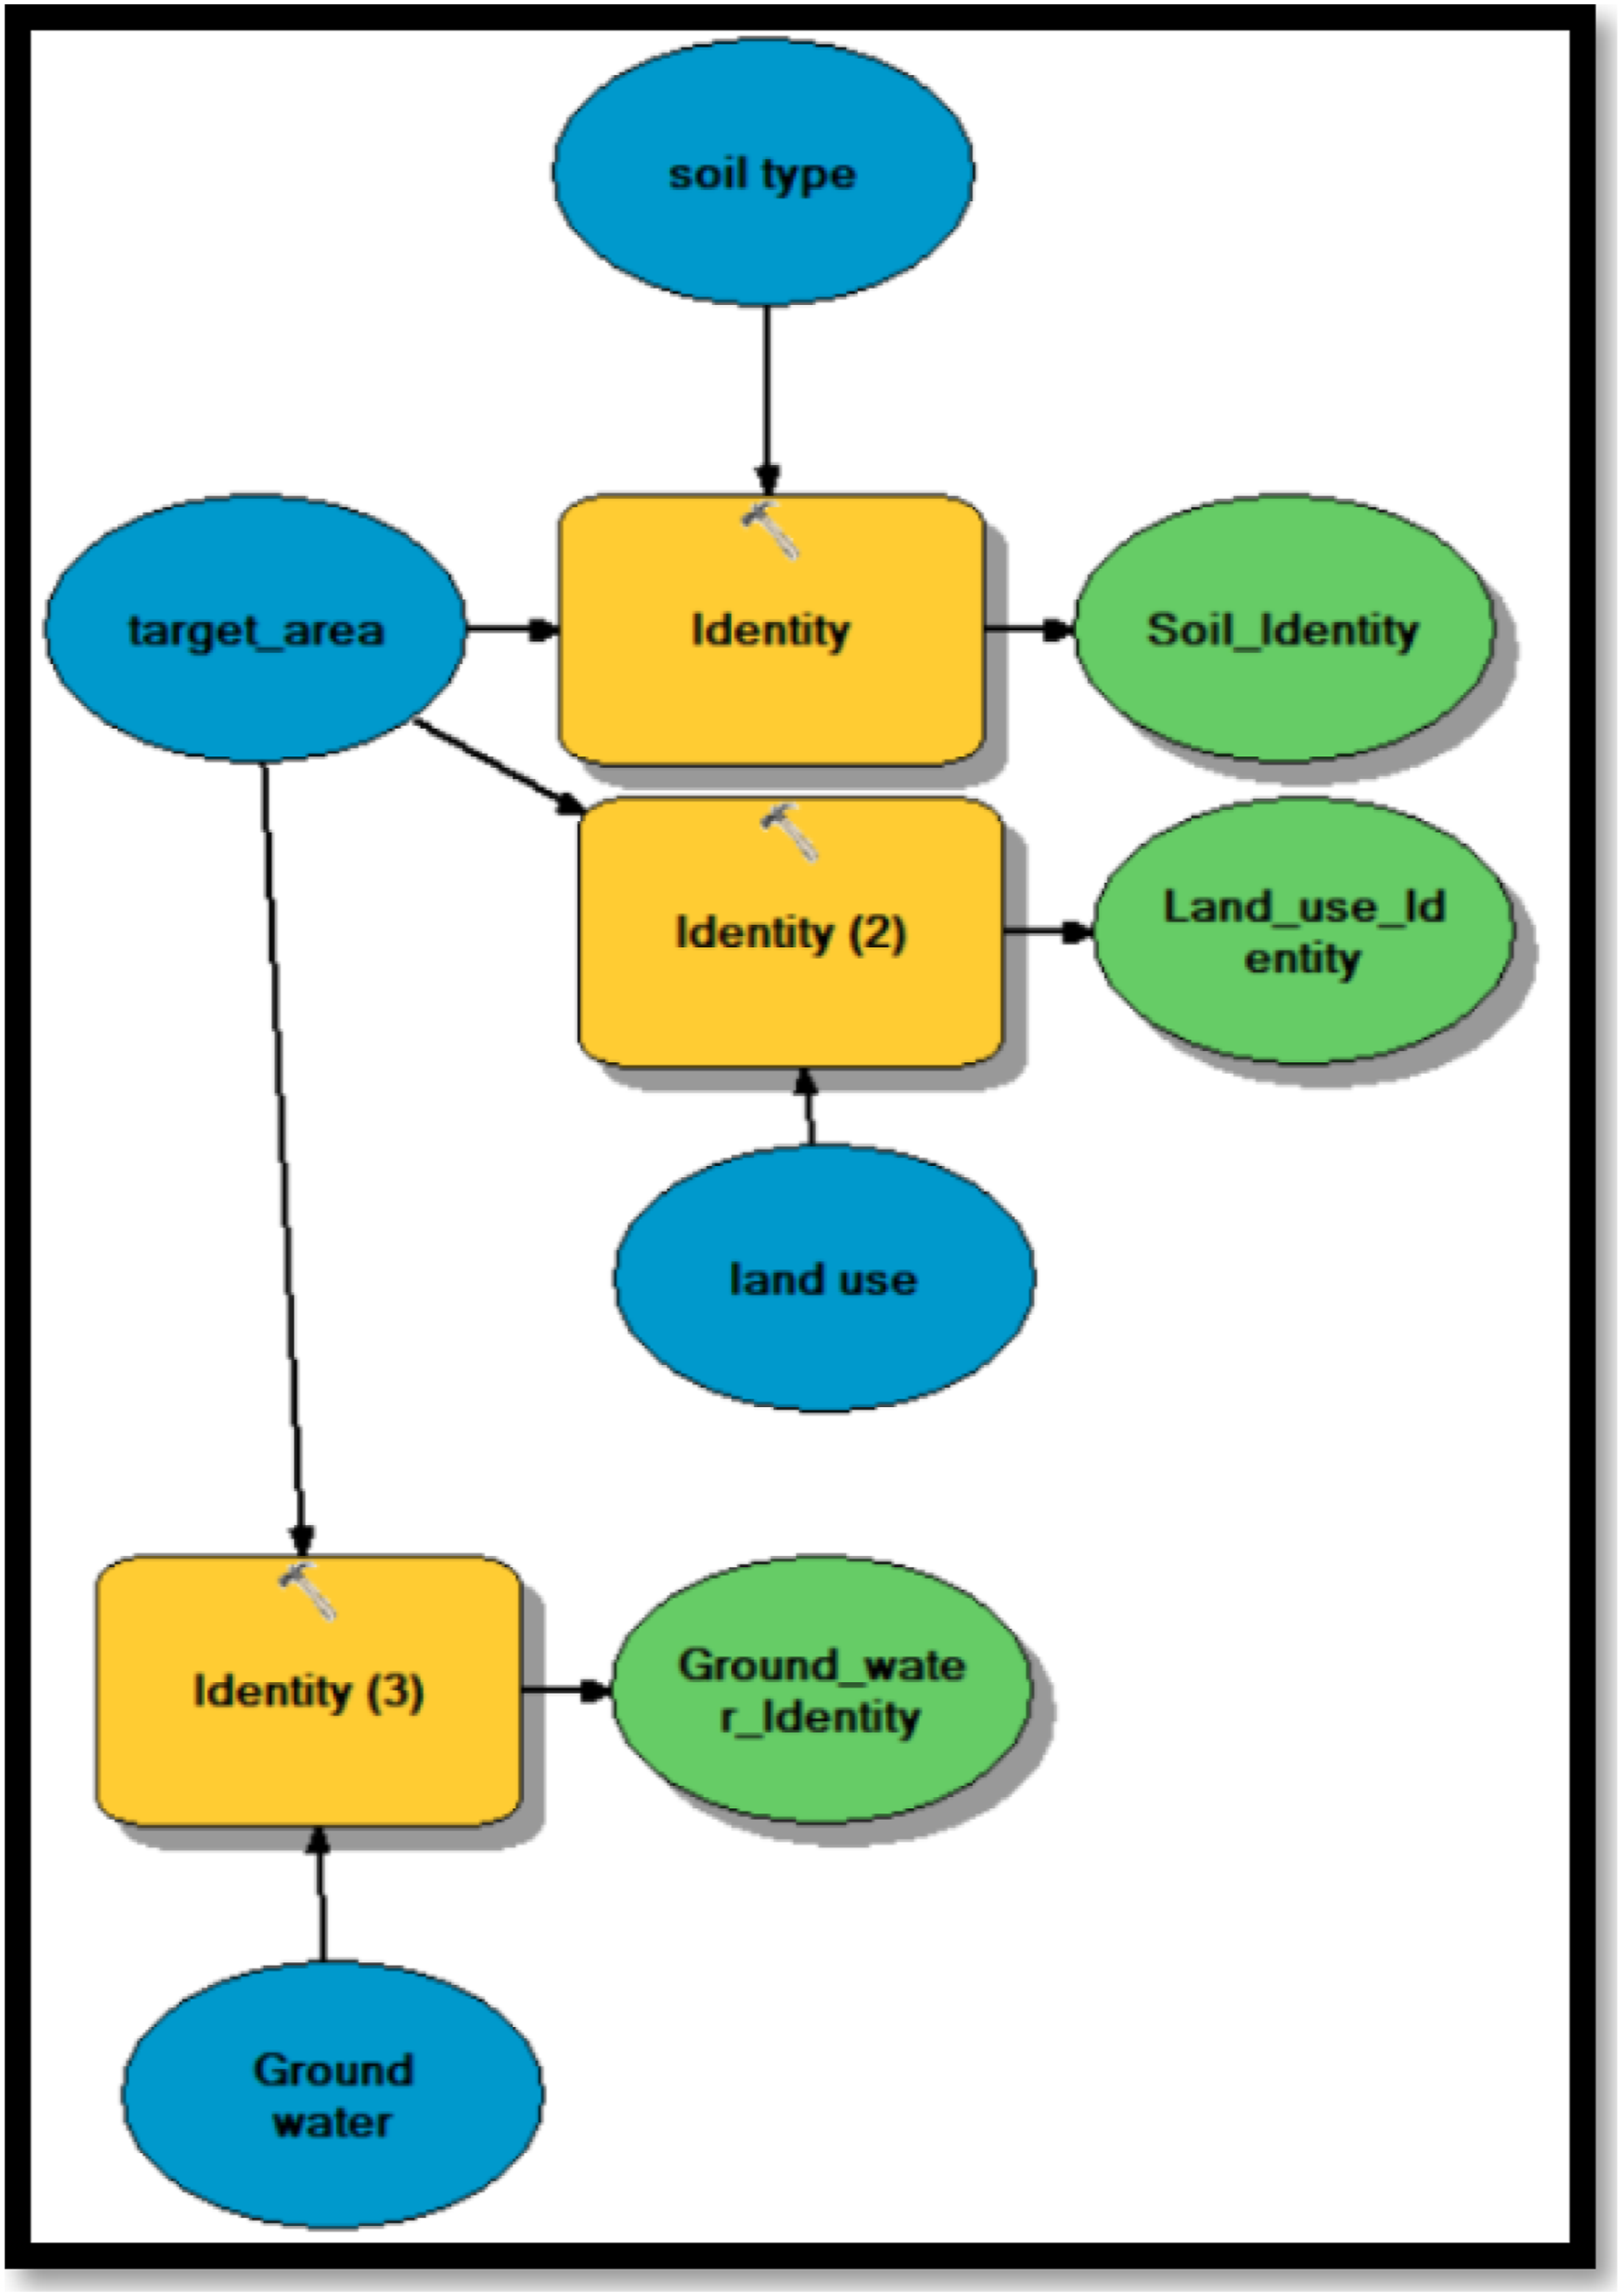
The result from this process is a layer collecting the attributes of specific entity intersected with the target area.
Soil_identity: Is the resulting layer identifying soil types of the target area.
Land_use_identity: Is the resulting layer identifying land-use of the target area.
Ground_water_identity: Is the resulting layer identifying groundwater recharge values for the target area.
Applying Results
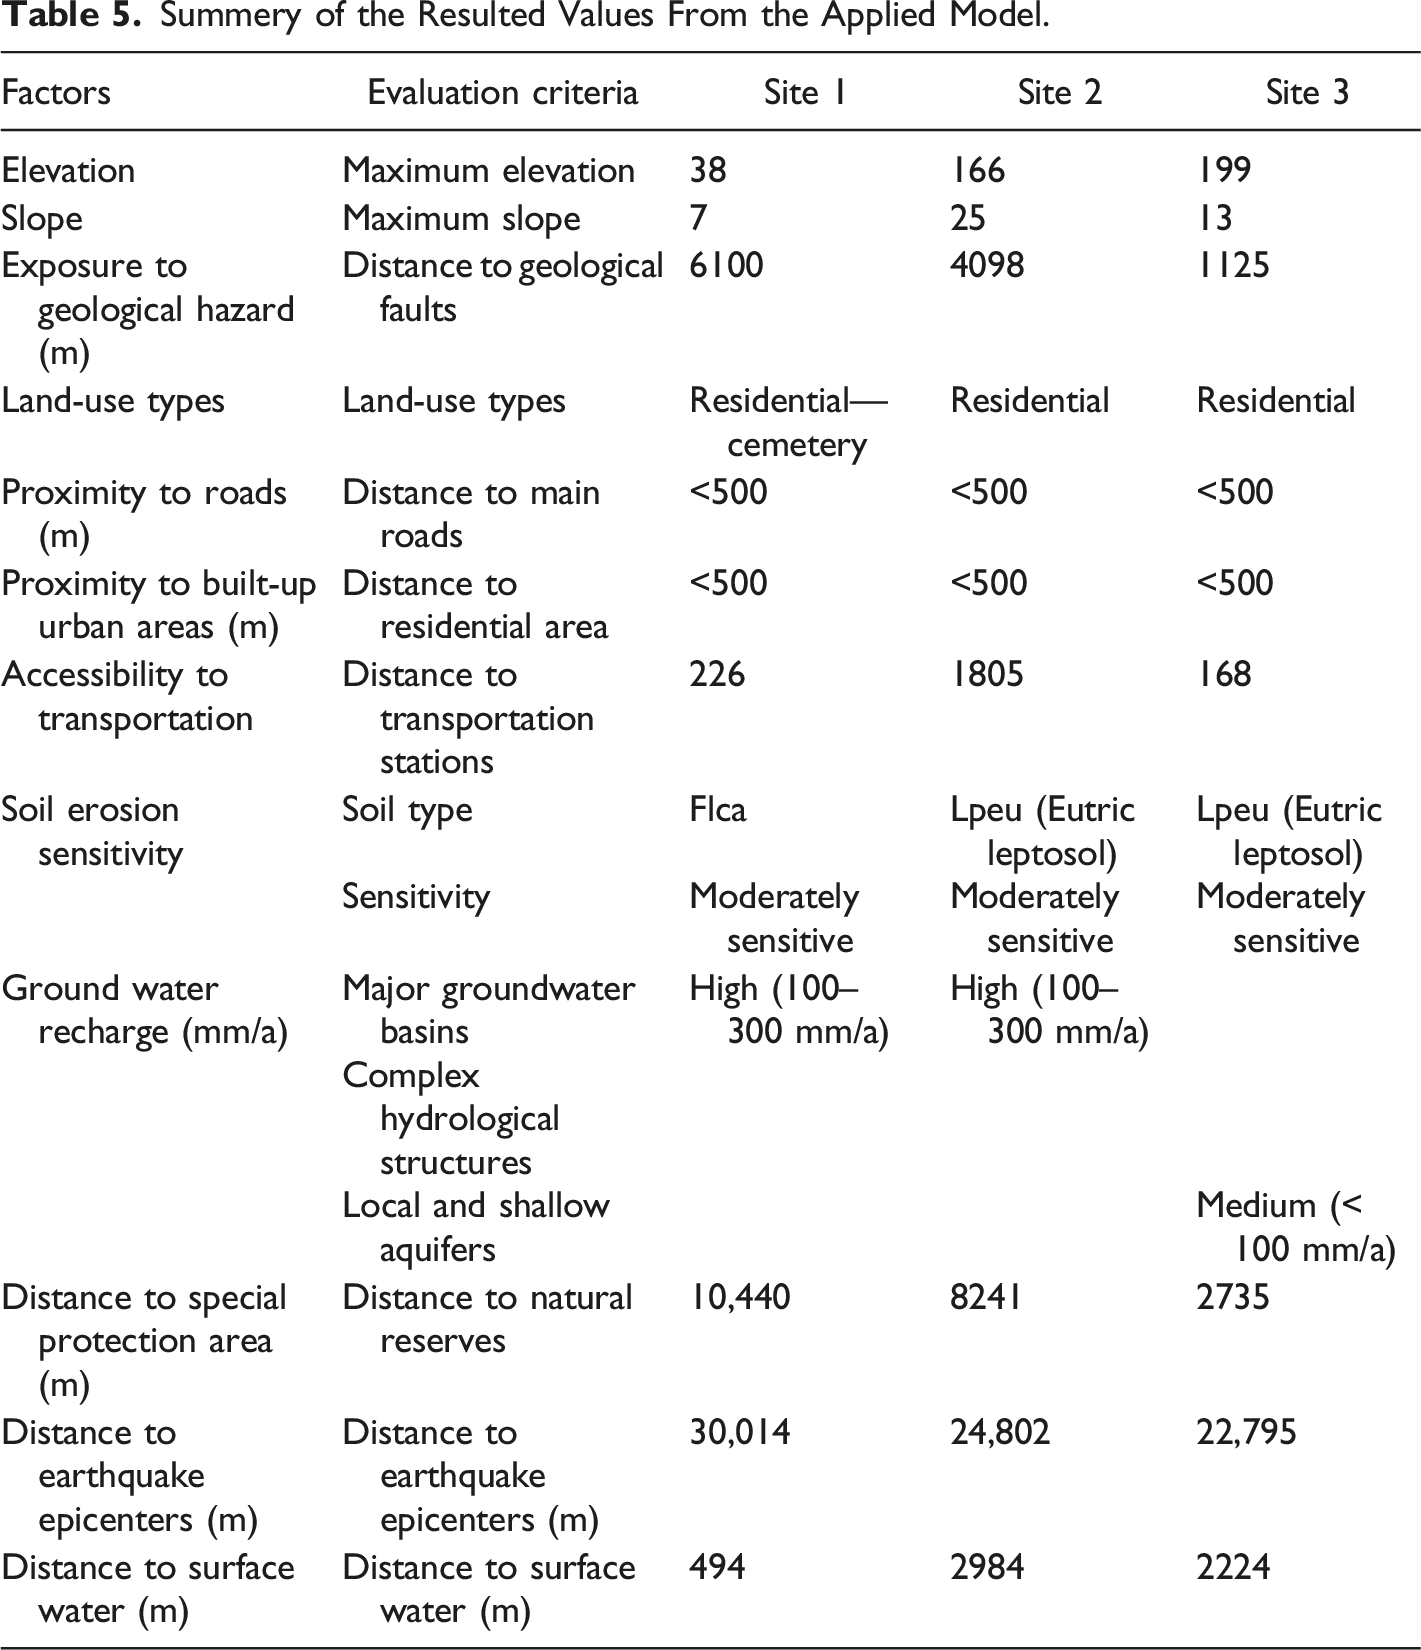
Summery of the Resulted Values From the Applied Model.
The elevation of the tree proposed relocation sites has been extracted from model results; the outputs are shown in Figure 11. It was found that site 1 had the smallest result for the elevation factor (38 m), followed by site 2 (166 m), and then site 3, which had the highest elevation of (199 m). Representation of Elevation.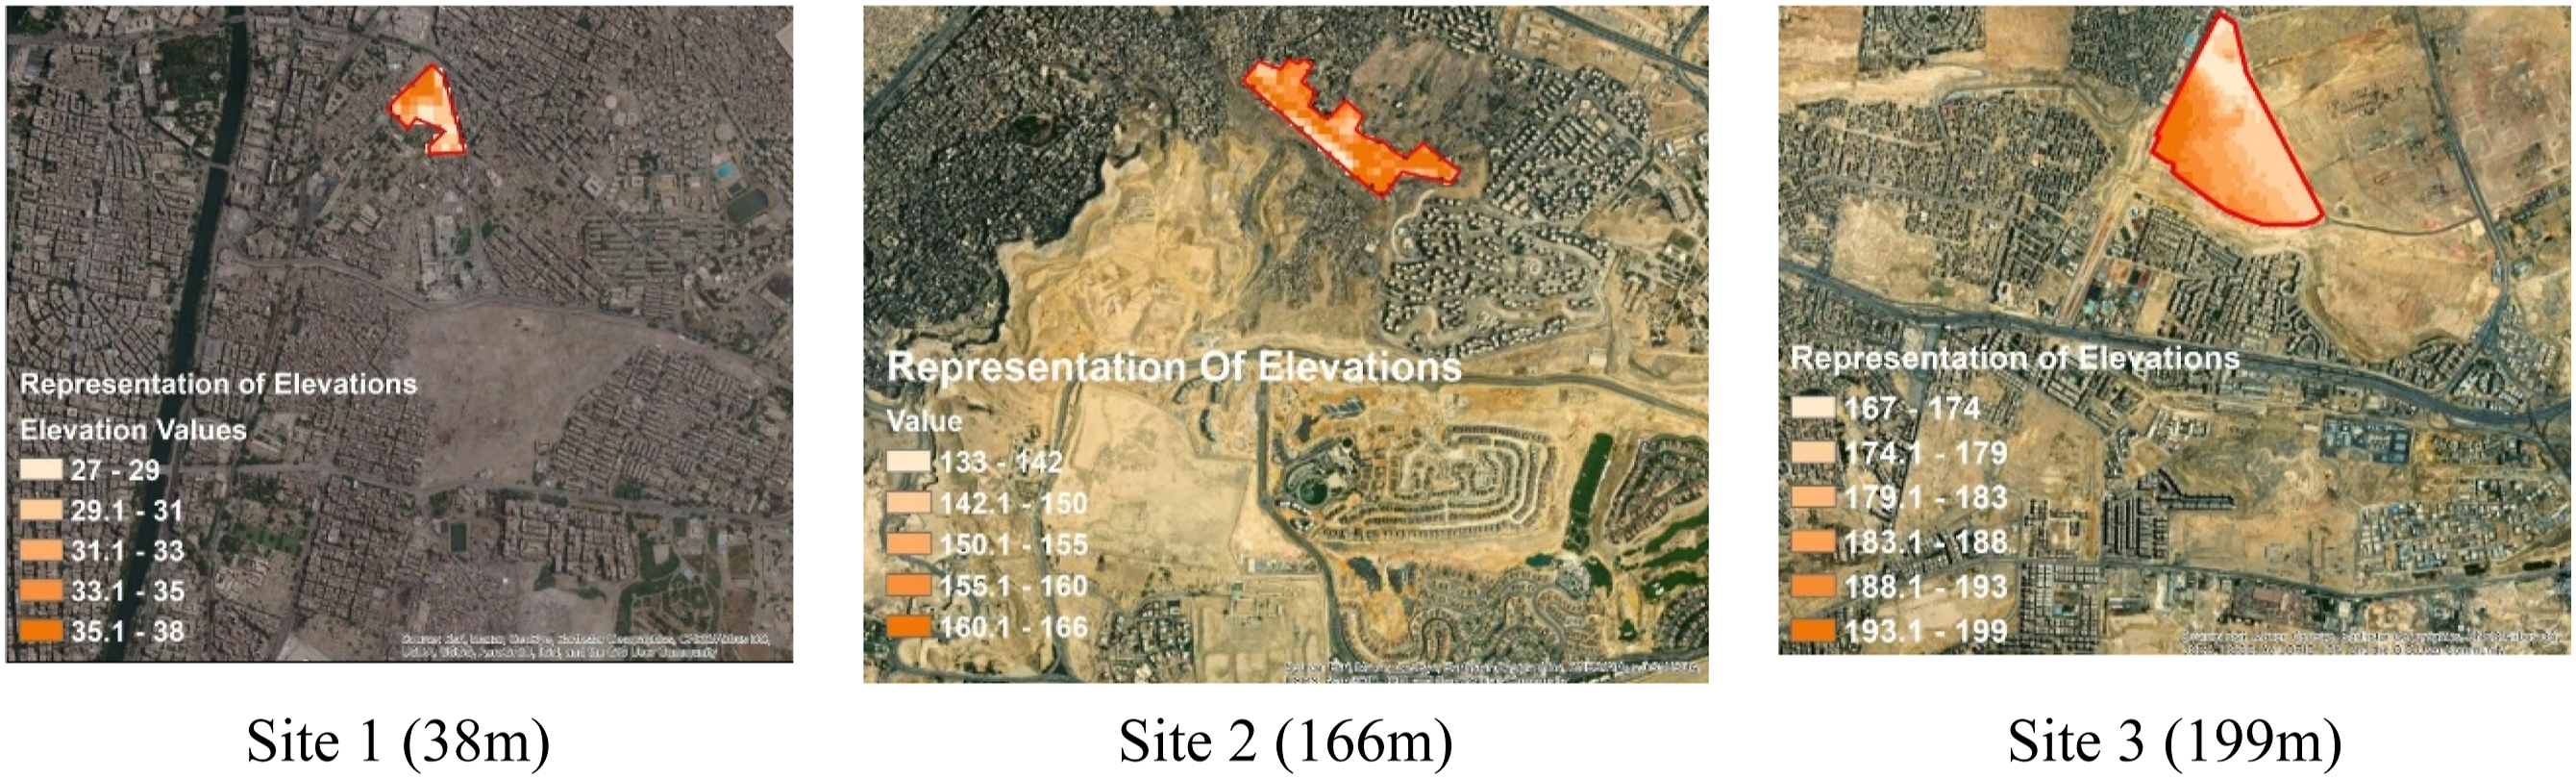
The resulted slopes are shown in Figure 12, site 2 had the lowest slope value (7) while site 3 had slope value (13) and site 3 had the highest slope (25). Representation of Slopes.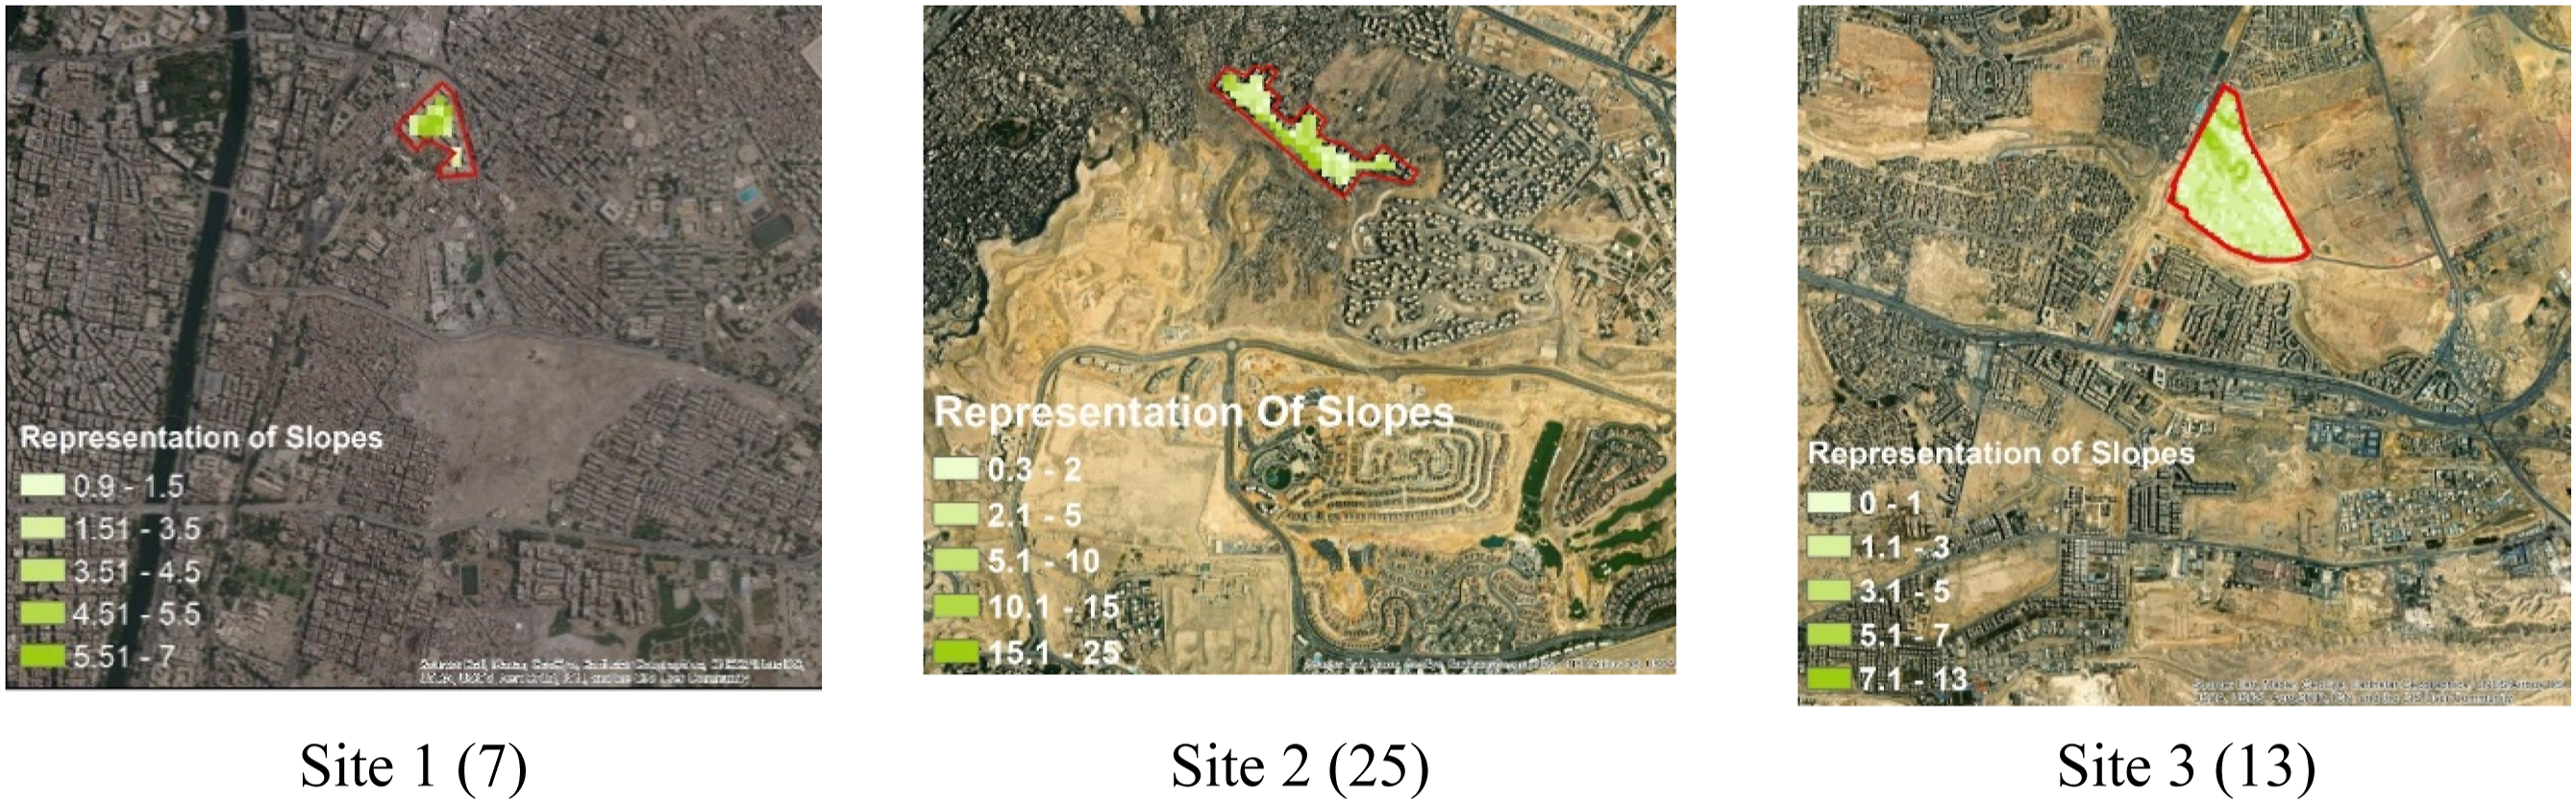
Employing the model builder tools, the distances to the nearest geological faults were measured as shown in Figure 13. It was found that site 3 has the shortest distance to geological faults (1.125 km), followed by site 2 (4.098 km), and site 1 had the greatest value (6.1 km). Exposure to Geological Faults.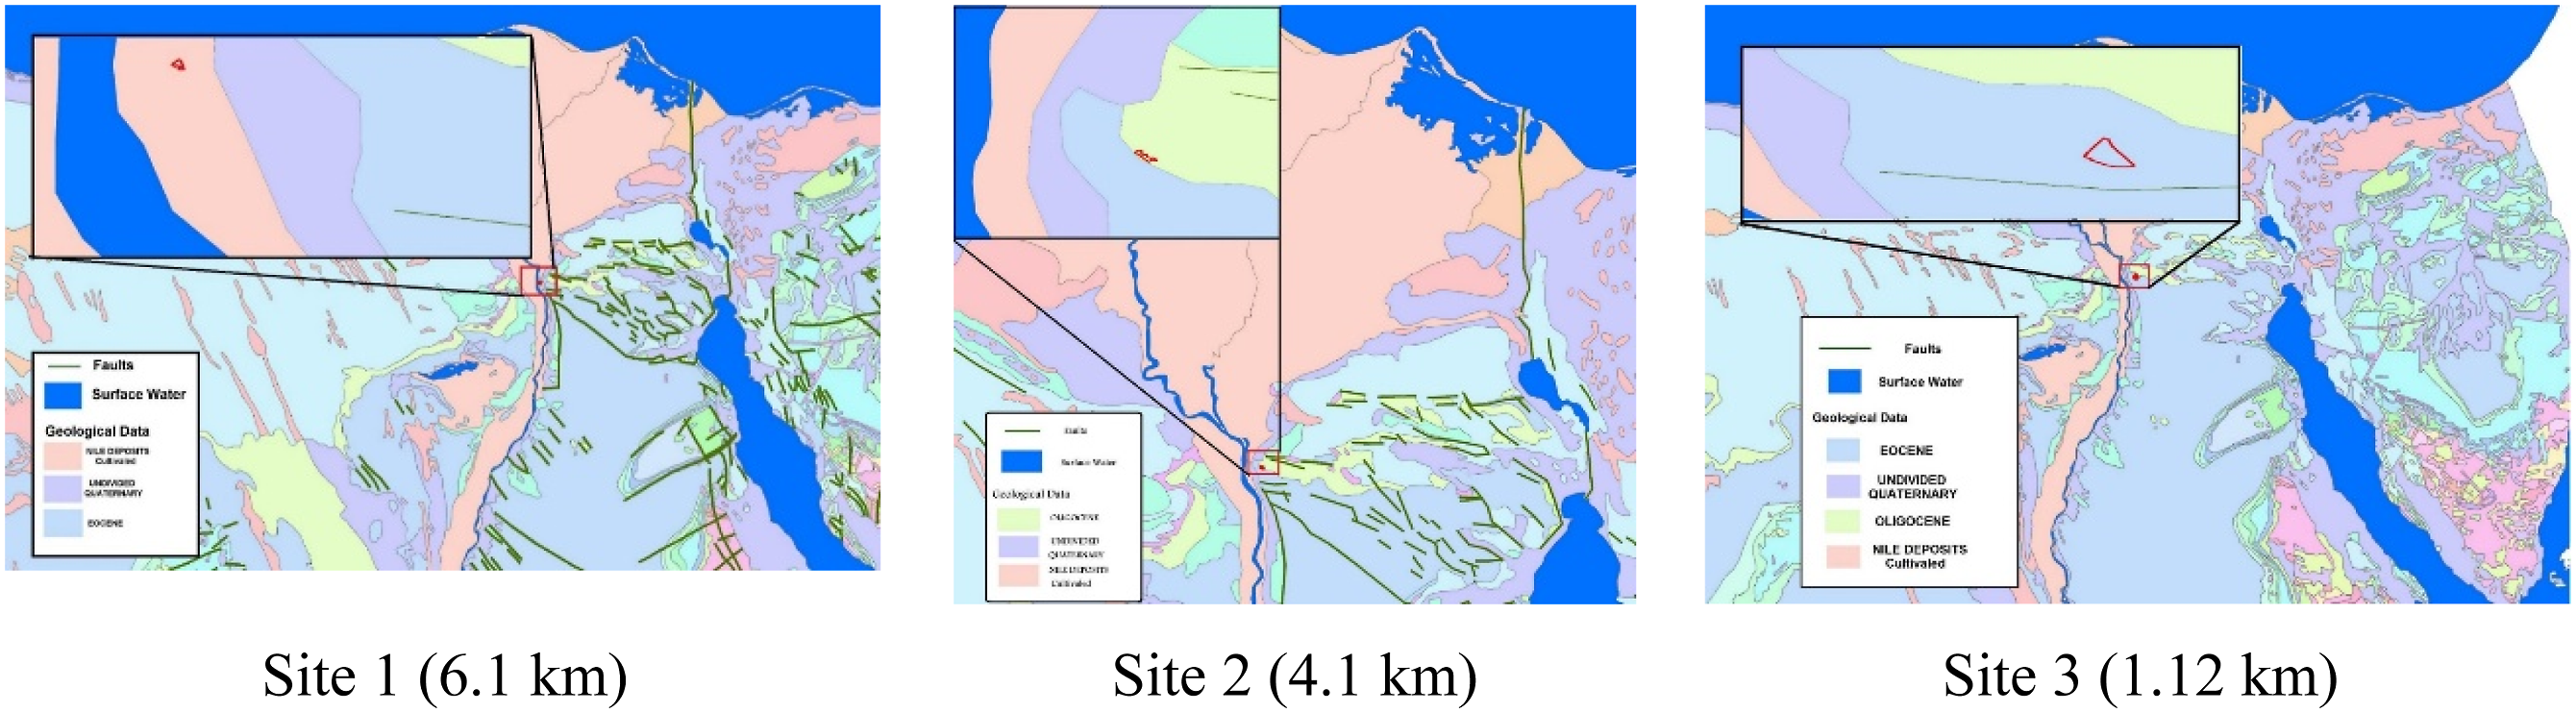
By overlaying a 500 m buffer polygon from the three study locations, the distance to residential areas and roads was assessed. It was discovered that all regions are within 500 m of roads and residential areas, indicating a strong prospect for urban expansion as shown in Figure 14. Land Uses Representation.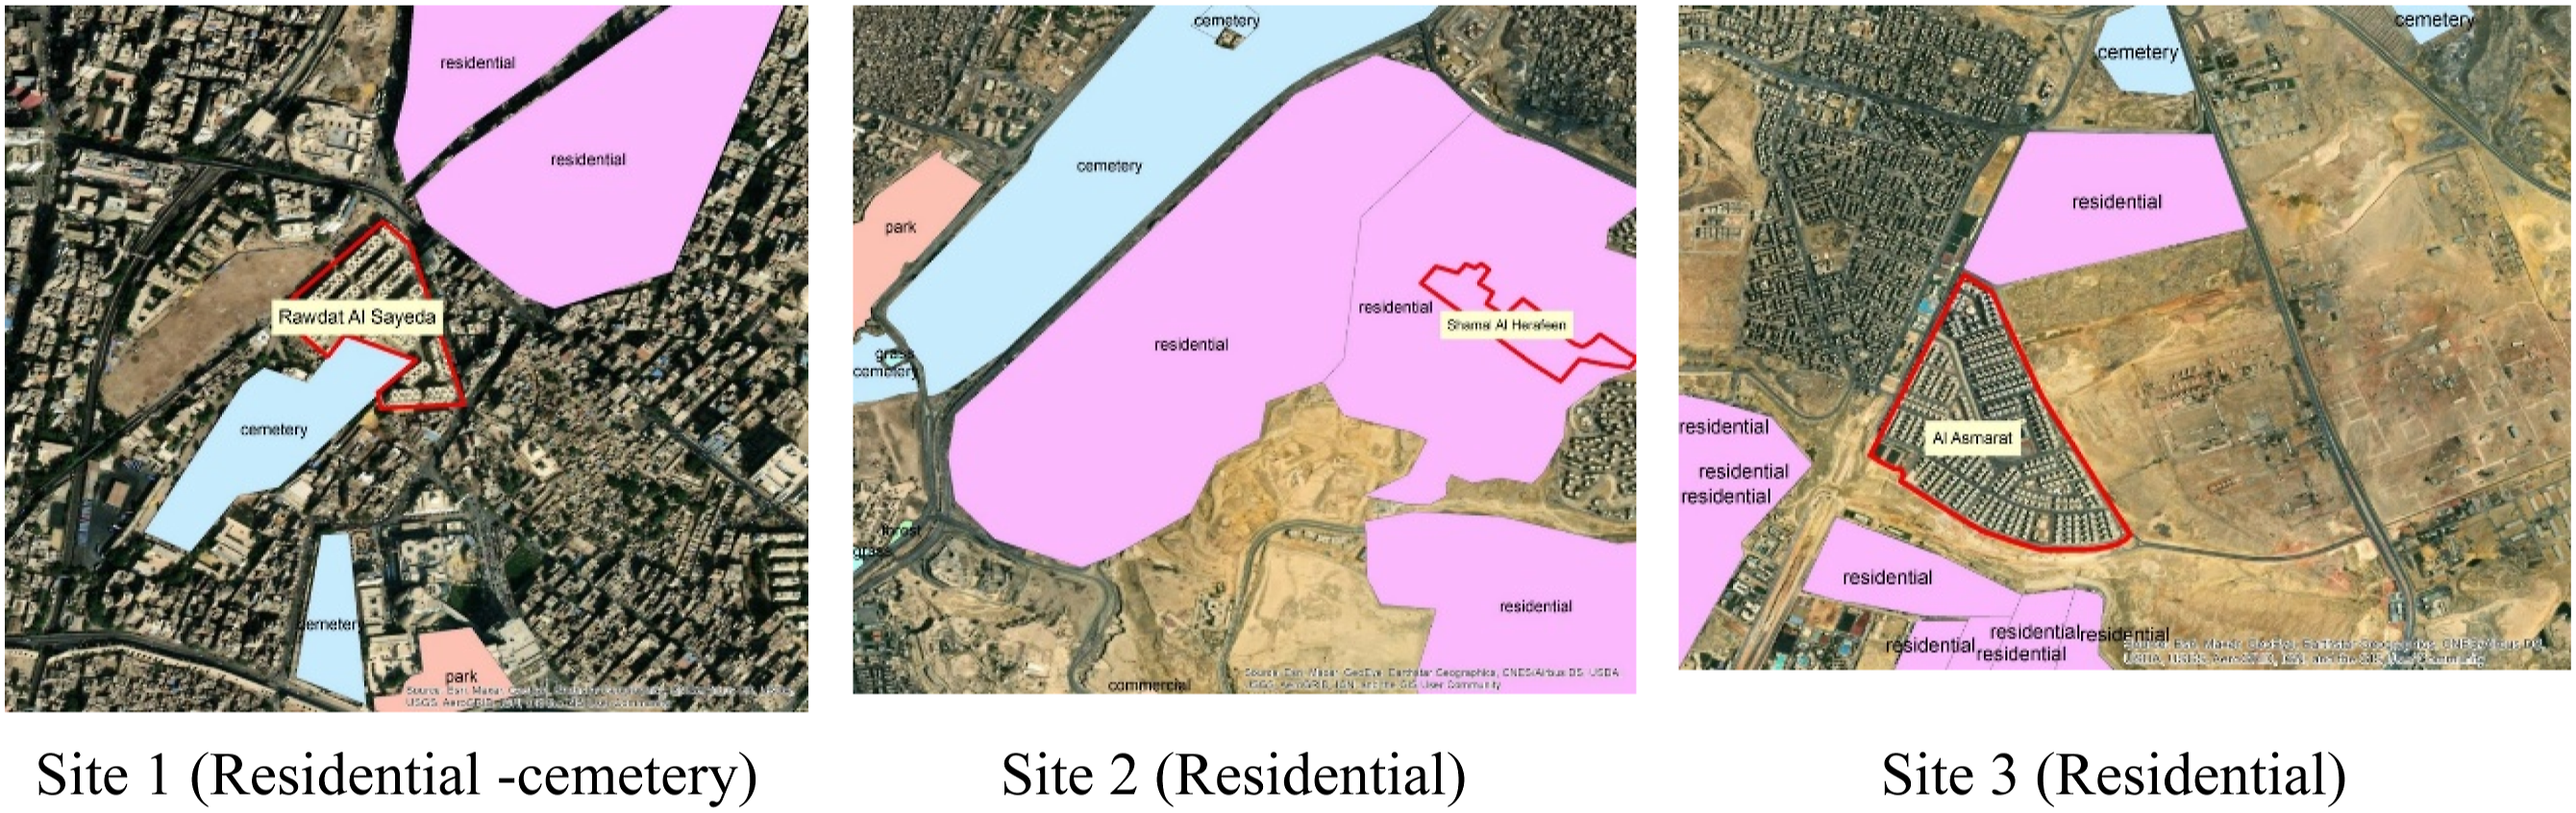
Evaluations of soil types are employed in the model, shown in Figure 15, it was revealed that the FLca soil type is found in the site1 region ( Soil Types Representation.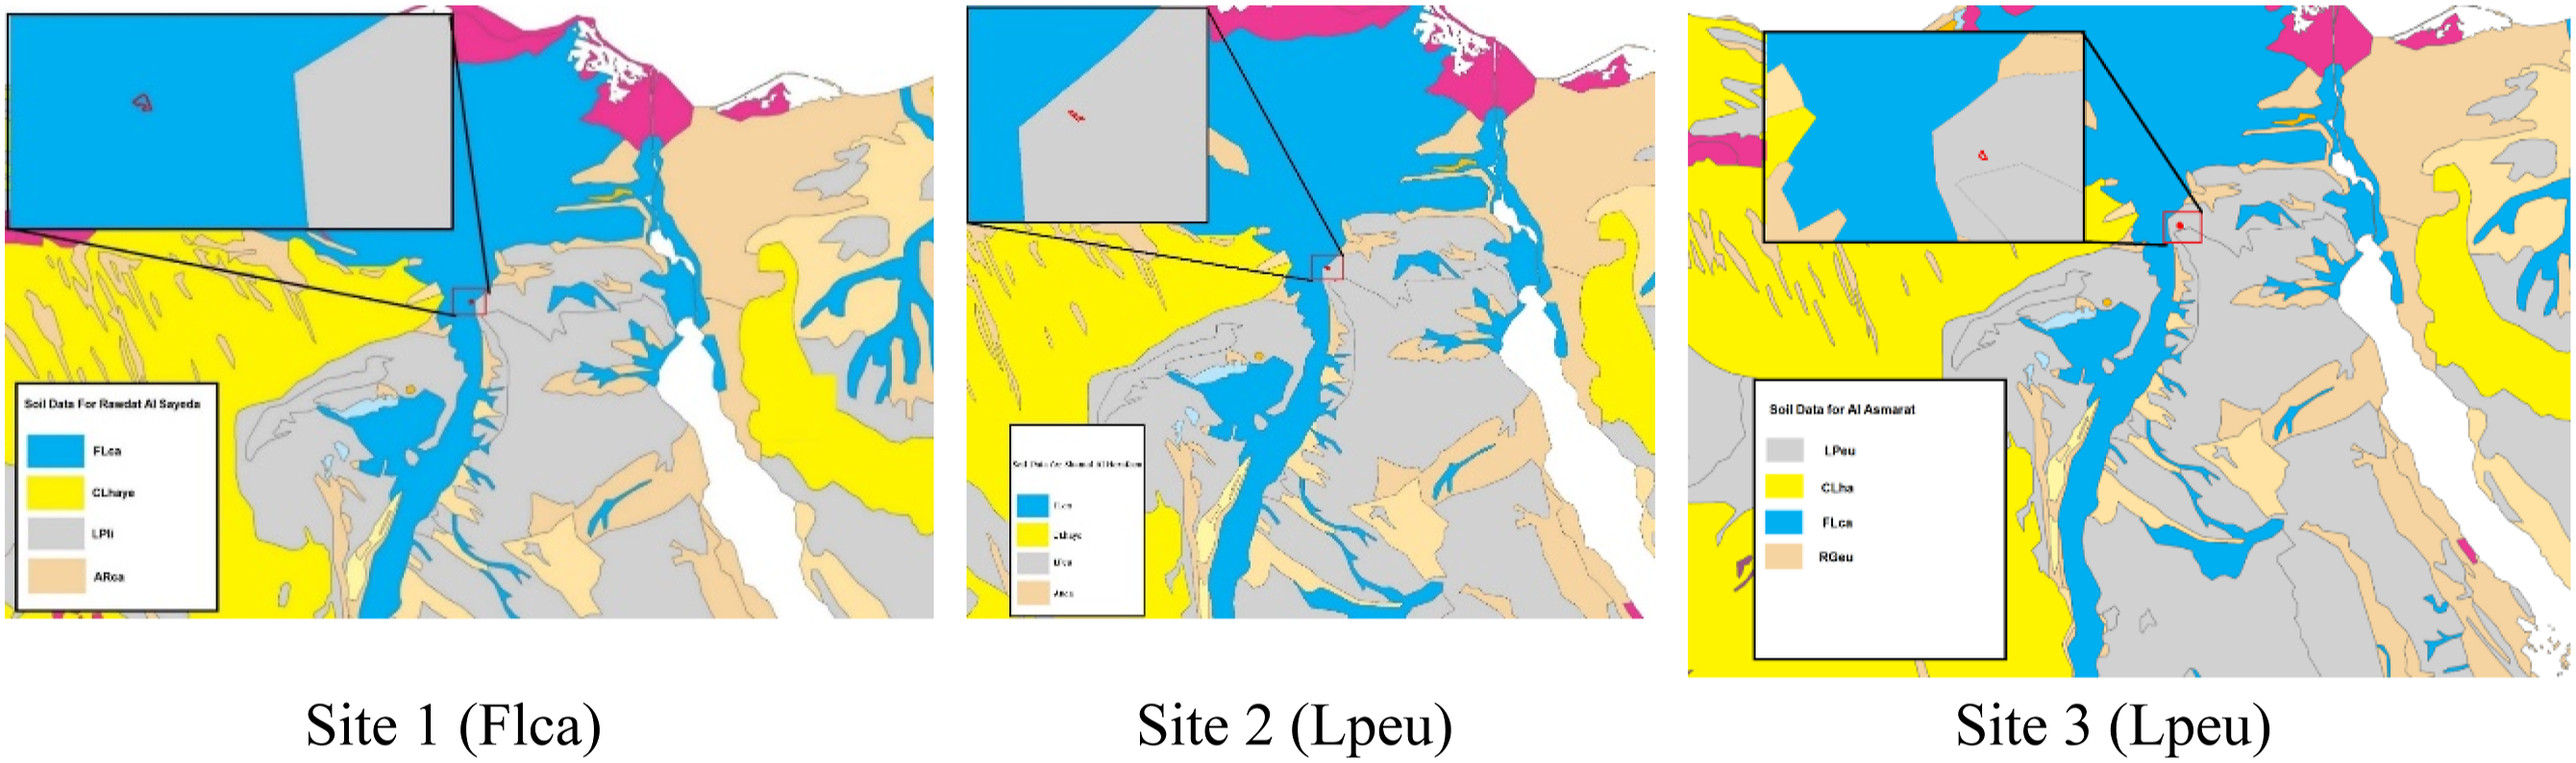
After a groundwater recharge assessment, as shown in Figure 16, it was discovered that site 1 and site 2, located in major groundwater basins, have high groundwater recharge (100–300 mm/a), whereas site 3 has medium groundwater recharge (<100), which is located in local and shallow aquifers. Groundwater Recharge Representation.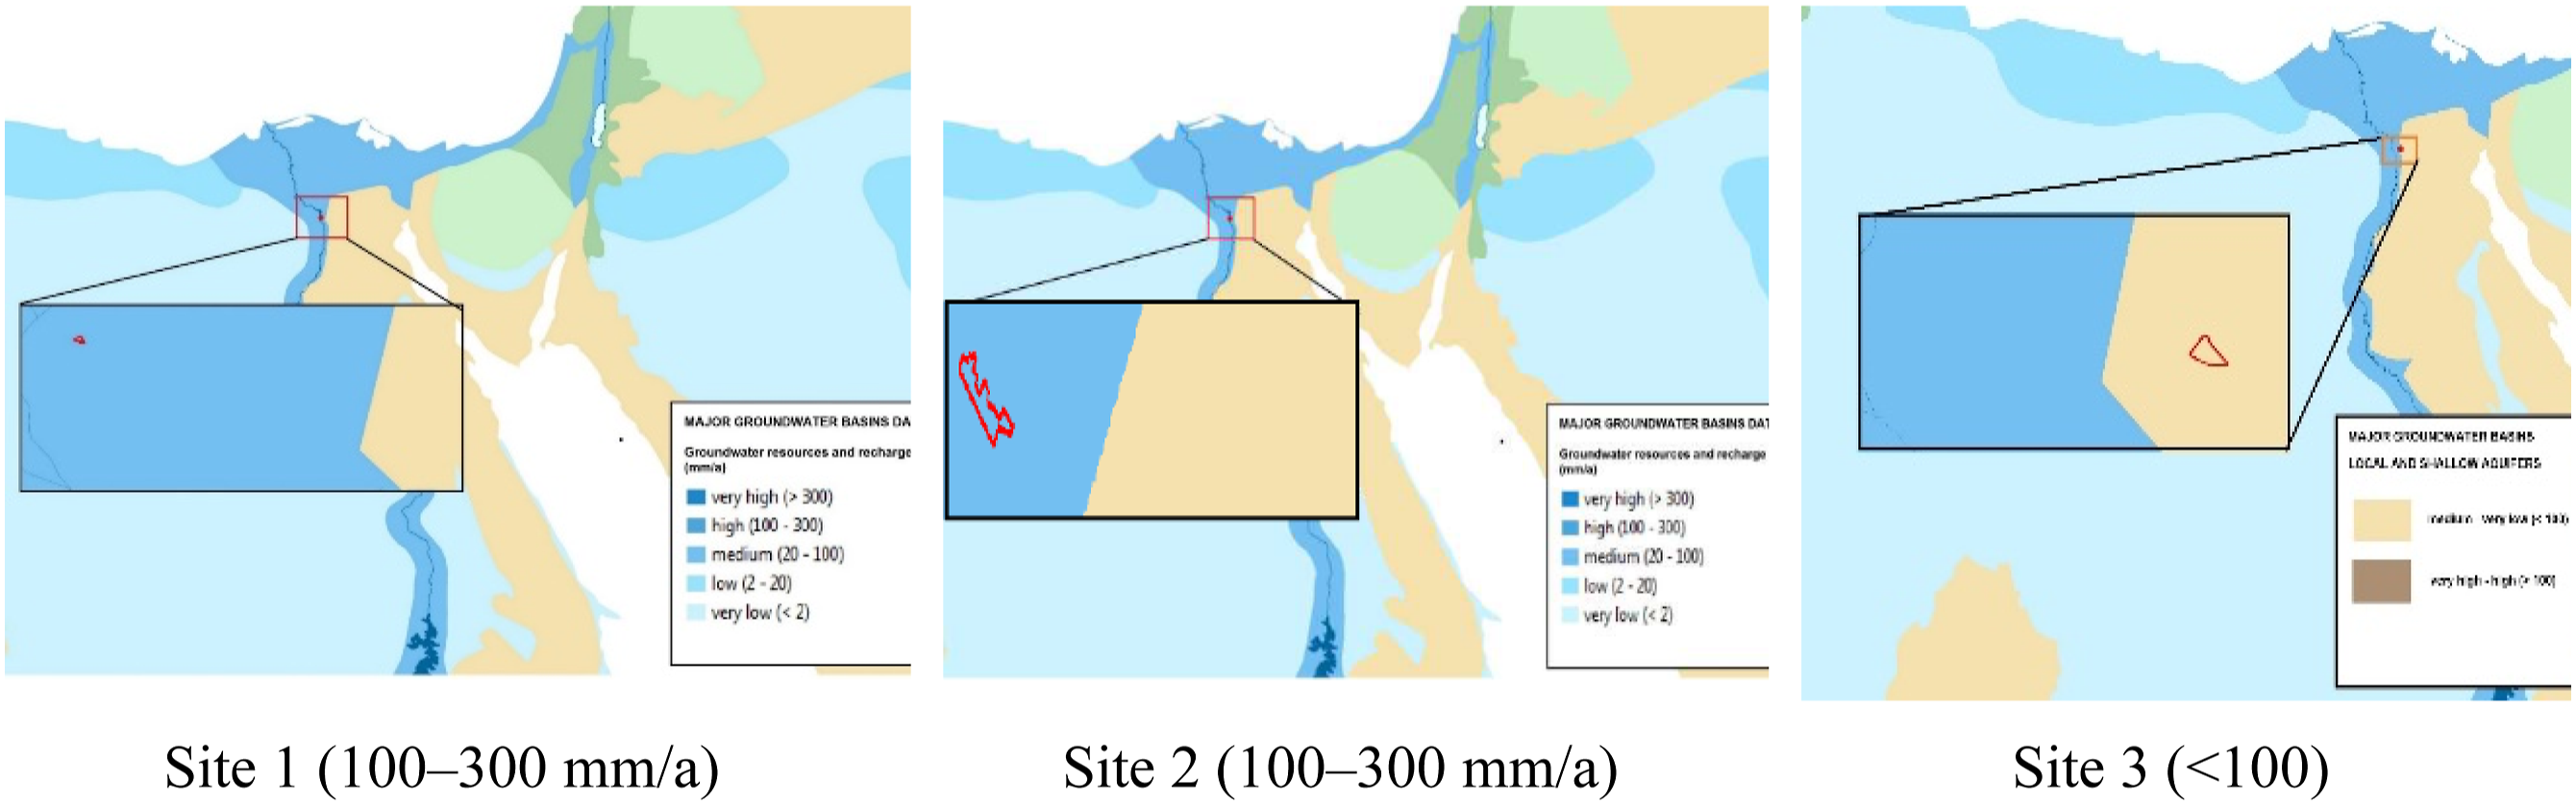
Results and Discussion
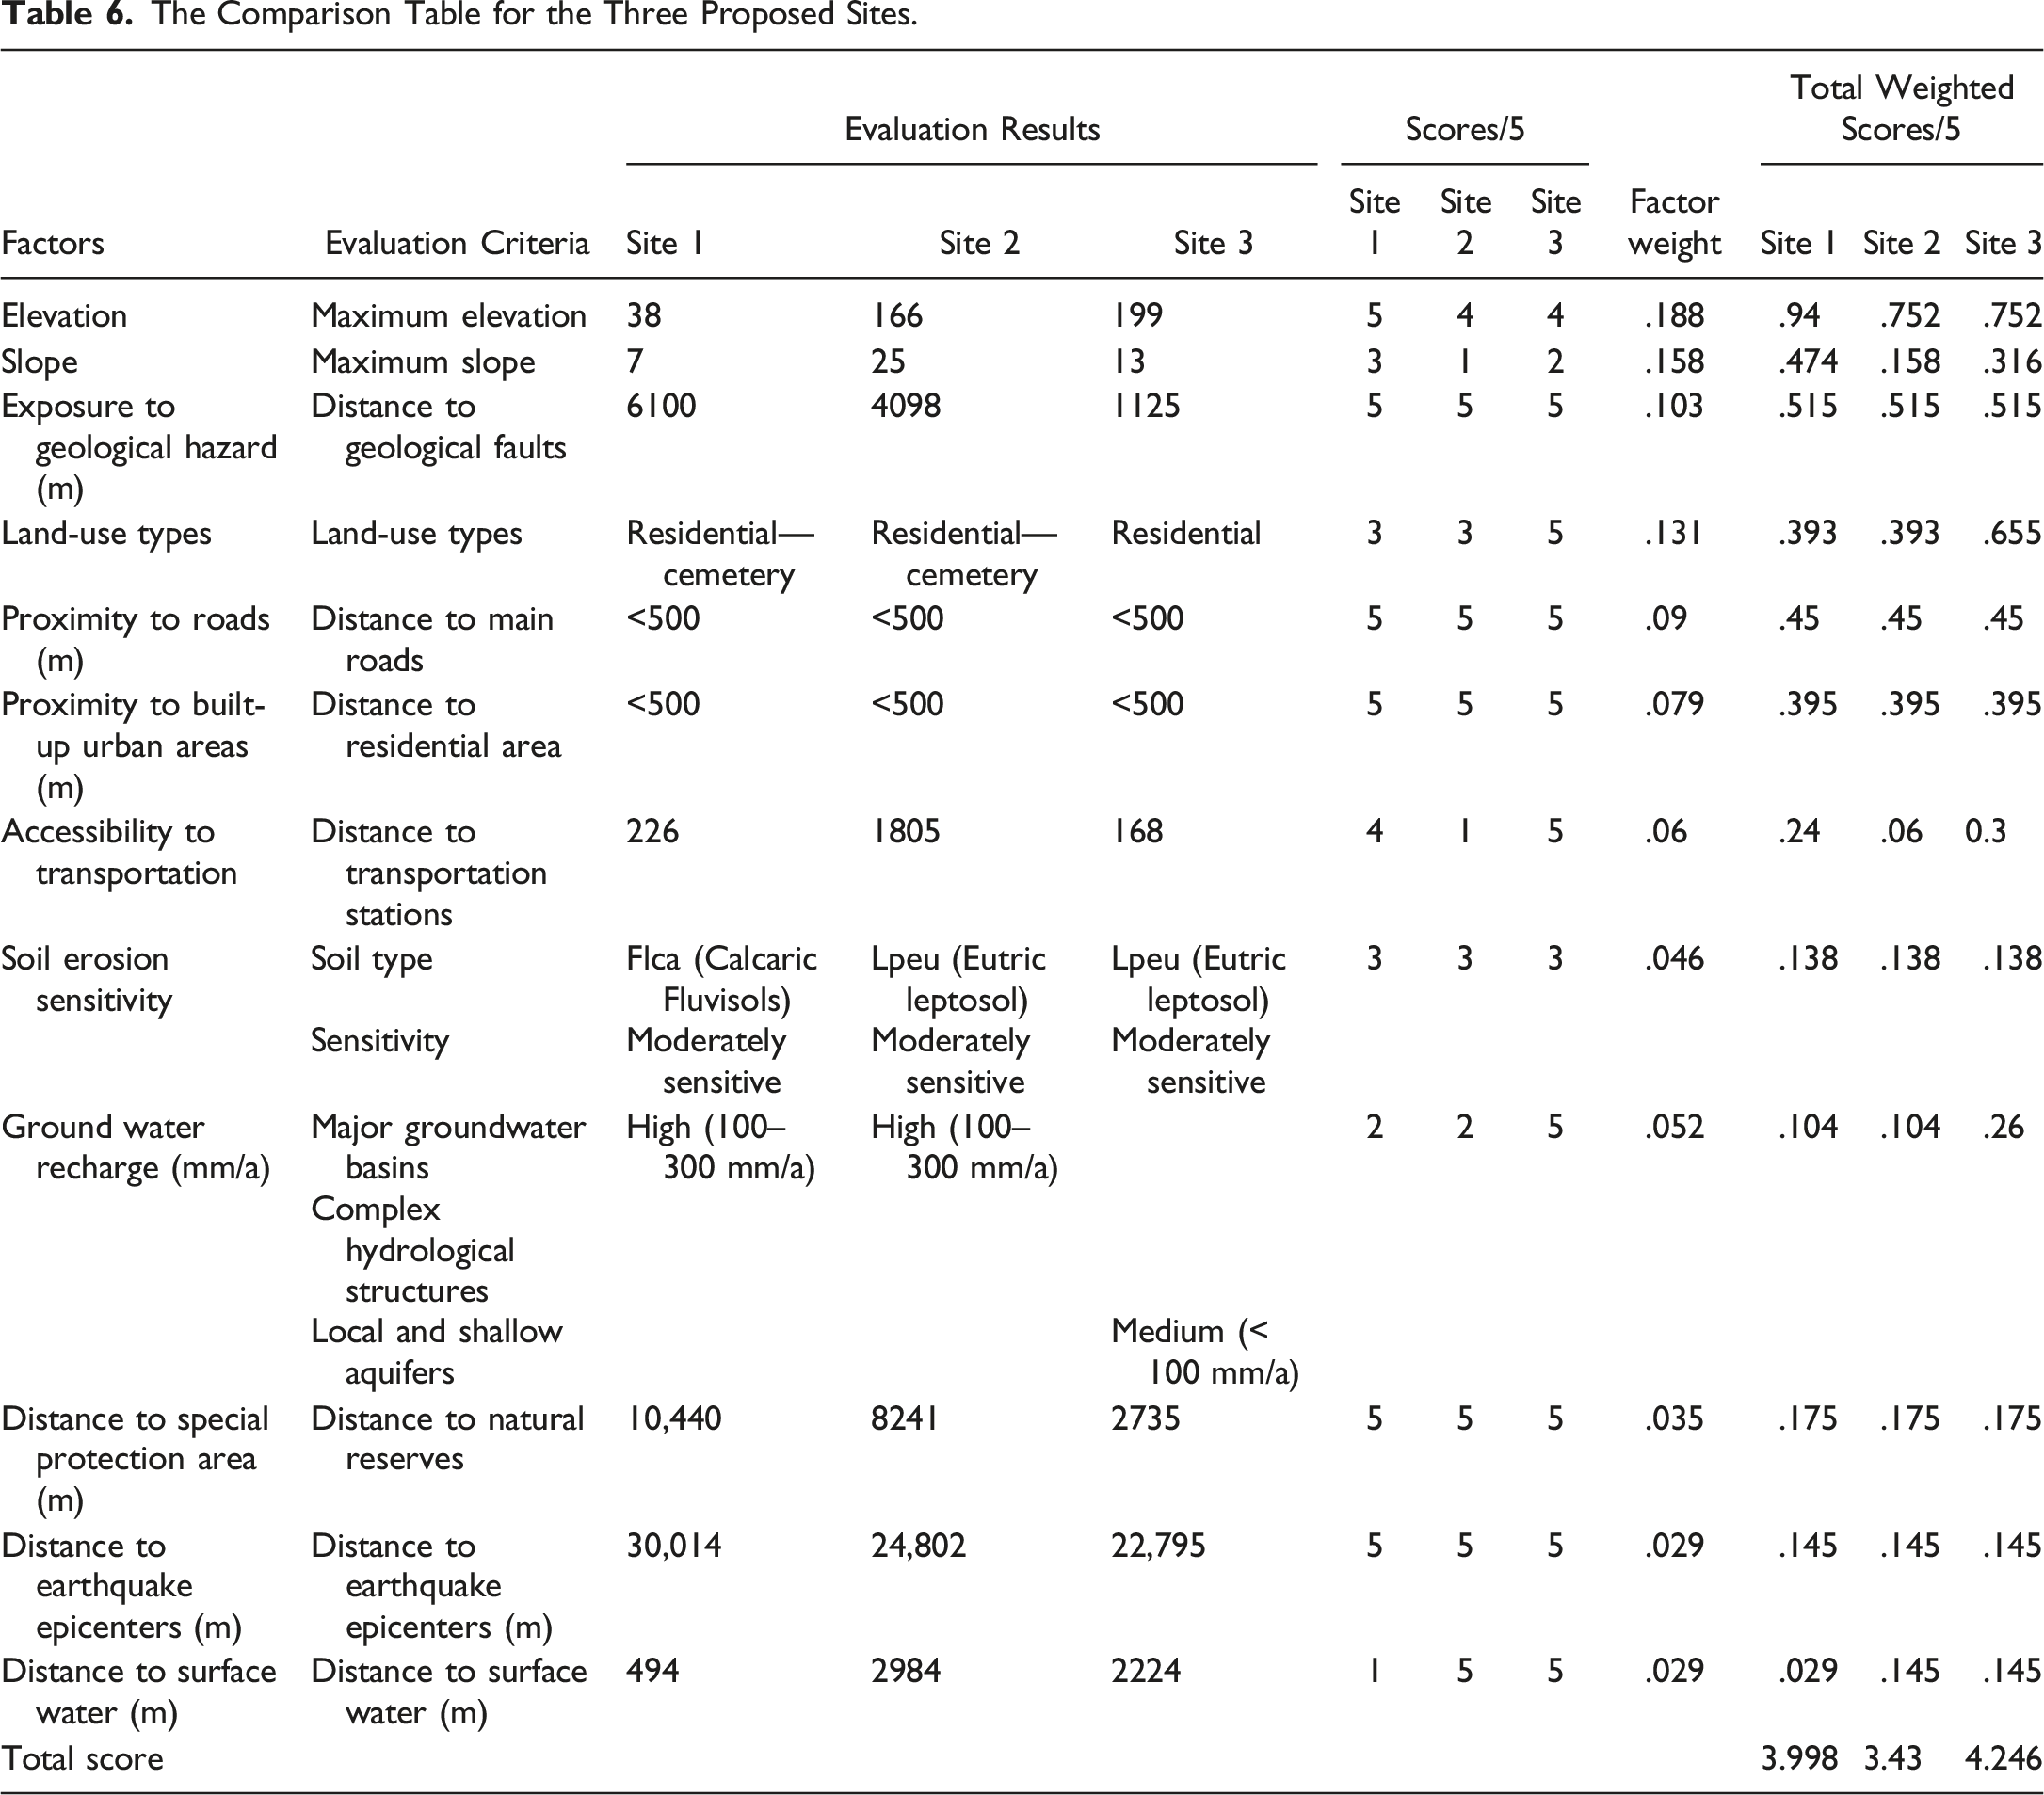
The Comparison Table for the Three Proposed Sites.
Conclusions
MCDA-GIS framework is a critical process which can significantly affect the benefits that can be derived from the land. In the context of application, this case study identified the land with high suitability land for urban use to relocate slums dwellers. It is more expensive to use land that is categorized as moderately suitable. This case study demonstrates that MCDA-GIS based methods can be used in urban land-use planning. The outcome of the study is a process for identifying land suitability for particular uses. It was found that site 3 had the highest level of suitability for the relocation of slums with a score of 4.246 (84%), followed by site 1 and site 2 with scores of 3.99 (79.8%) and 3.43 (68.6%). This research introduced a scientific method for finding the suitable location for the relocation of slum dwellers using a combination MCDA and GIS utilizing the AHP method for applying the weights for the proposed factors for the suitability model. This study revealed that slum resettlement modeling assists slum dwellers in obtaining appropriate housing. These results imply that the proposed approach support for decision-makers to enhance the lives of informal settlement residents.
There are several limitations of case study research including that statistical tests require a larger sample size to ensure that the sample is considered representative of the problem and that the statistical result can be generalized to a larger number of sites.
Footnotes
Declaration of Conflicting Interests
The author(s) declared no potential conflicts of interest with respect to the research, authorship, and/or publication of this article.
Funding
The author(s) received no financial support for the research, authorship, and/or publication of this article.