
Abstract
As the mining industry expands, a comprehensive understanding of its socioeconomic risks and benefits is urgently needed. This paper systematically reviews 71 studies (1996–2021) that utilized spatially integrated approaches to evaluate socioeconomic mining impacts. The number of studies that utilize geographic information systems and remote sensing to study mining impacts increased from 2014 onwards. A framework was used to classify the mining impacts studied in the literature and all eight framework categories – Environment, Land, People, Community, Culture, Livelihoods, Infrastructure and Housing – were captured by the literature though Culture was least studied. Coal mining, active mining phase, Landsat data and classic remote sensing algorithms were most highlighted. Future research should focus on advancing geospatial technology like artificial intelligence (AI) to better capture intangible socioeconomic impacts, under-researched minerals and long-term mine lifecycle components. Spatially referenced social data can improve stakeholder involvement and support spatially explicit planning to ensure sustainability.
Keywords
Introduction
Minerals are a central facet to the workings of modern life. The extraction of these mineral resources, however, is also known to have adverse effects on people and the environment (Githiria & Onifade, 2020). As the demand for mined resources grows, there is a pressing need for a robust understanding of mining's impacts on all stakeholders; this is necessary to enable informed decision-making about the positive and negative effects of mineral resource extraction (Arts et al., 2019; Owen et al., 2022; Sonter et al., 2014; Zhang et al., 2017; Zhang et al., 2015). Social impacts in mining landscapes are dynamic, complex and interconnected, with a variety of beneficial and harmful consequences for liveability, cultural well-being, social cohesion, quality of life and health (Petrov et al., 2018; Shackleton, 2020; Vanclay et al., 2015). While the environmental transformations associated with mining have been the subject of much attention in the geospatial field, further research is needed to effectively study the socioeconomic impact of mineral extraction in and around the mining footprint (Owen et al., 2022; Werner et al., 2019).
Mining can contribute to increased economic activity, poverty alleviation through job creation and supply chain linkages, and to improved livelihoods and well-being through funding for education, healthcare and other basic amenities (D’Odorico et al., 2017; Hajkowicz et al., 2011; Yiran et al., 2012). On the other hand, social tension, conflicts, inequality and loss of access to land can diminish human rights enjoyment and quality of life for people living in mining areas (Aragon & Rud, 2013; Hook, 2019; Loayza & Rigolini, 2016; Owen & Kemp, 2014; Reeson et al., 2012). Given these issues, it is important to understand mining's impacts across space and time, in order to provide a more comprehensive assessment that considers all dimensions (Arts et al., 2019; Hook, 2019; Horsley et al., 2015; Lechner et al., 2017). The Social Framework for Projects (Smyth & Vanclay, 2017) synthesizes a range of existing approaches and methods and is used to support the scope and design of our study.
Applied research on mining posits that mining impacts are the result of local and regional interactions between a project and its unique geological, social, environmental and economic context (Valenta et al., 2019). The positive and negative effects are unevenly felt across societal levels and vary in their spatial extent, extending well beyond the mine operation’s initial location (Franks et al., 2010; Lechner et al., 2019; Owen & Kemp, 2013; Ticci & Escobal, 2015). Despite numerous case studies of the effects of the mining sector on individual towns and communities, relatively little research has been produced about large-scale mining impacts from a geospatial perspective (Devenin & Bianchi, 2019). Limited data availability coupled with high data collection requirements and analysis costs often pose challenges to the assessment of social impacts (Horsley et al., 2015; Uhlmann et al., 2014).
While the utility of remote sensing and GIS for capturing the spatial dimensions of social impacts in mining areas remains under-researched (Bennett et al., 2022; Hall, 2010; Semborski et al., 2022; Werner et al., 2019), there is an established practice of studying health impacts geospatially where GIS is used as the main tool of analysis (DeLemos et al., 2007; Diringer et al., 2015; Shandro et al., 2011; Winkler et al., 2010). It can be anticipated that with technical and conceptual advancement in GIS and remote sensing methods, an increase in their application is inevitable, and insights are likely to improve as a result of improvements in data (e.g. higher resolution) and methodology. Accordingly, a review of past GIS and remote sensing applications to socioeconomic impacts is timely for understanding existing practice and future application.
This paper reviews past research that utilized GIS and remote sensing to study the spatial dimensions of mining's socioeconomic impacts. The review has three objectives: (1) to determine the general information (e.g. geographic location of the mine) and mining characteristics studied in published work, (2) to identify the categories of socioeconomic mining impacts that have been studied in spatially explicit ways, and (3) determine the social science, remote sensing and GIS approaches used for capturing mining impacts. The review focused on assessing the extent to which multidisciplinary approaches have been applied within the Social Framework for Projects, to build knowledge of mining’s impacts on people’s well-being and the social sustainability of projects (Smyth & Vanclay, 2017). We conclude by making recommendations for areas where research on the integration of GIS, remote sensing and social sciences can be improved to better understand socioeconomic impacts in mining areas.
Methods
Search Criteria
A systematic review was applied using the SCOPUS database conducted on the 1st August to 31st of October 2021 using a specified search query (Figure 1) to ensure a comprehensive overview of existing literature and research gaps (Meerpohl et al., 2012). Only peer-reviewed journal articles published in English were queried; conference proceedings, books and non-peer-reviewed articles were not included. A graphical illustration of the systematic literature review search query. The coloured areas in light blue indicate the focus of the literature search query for further filtering.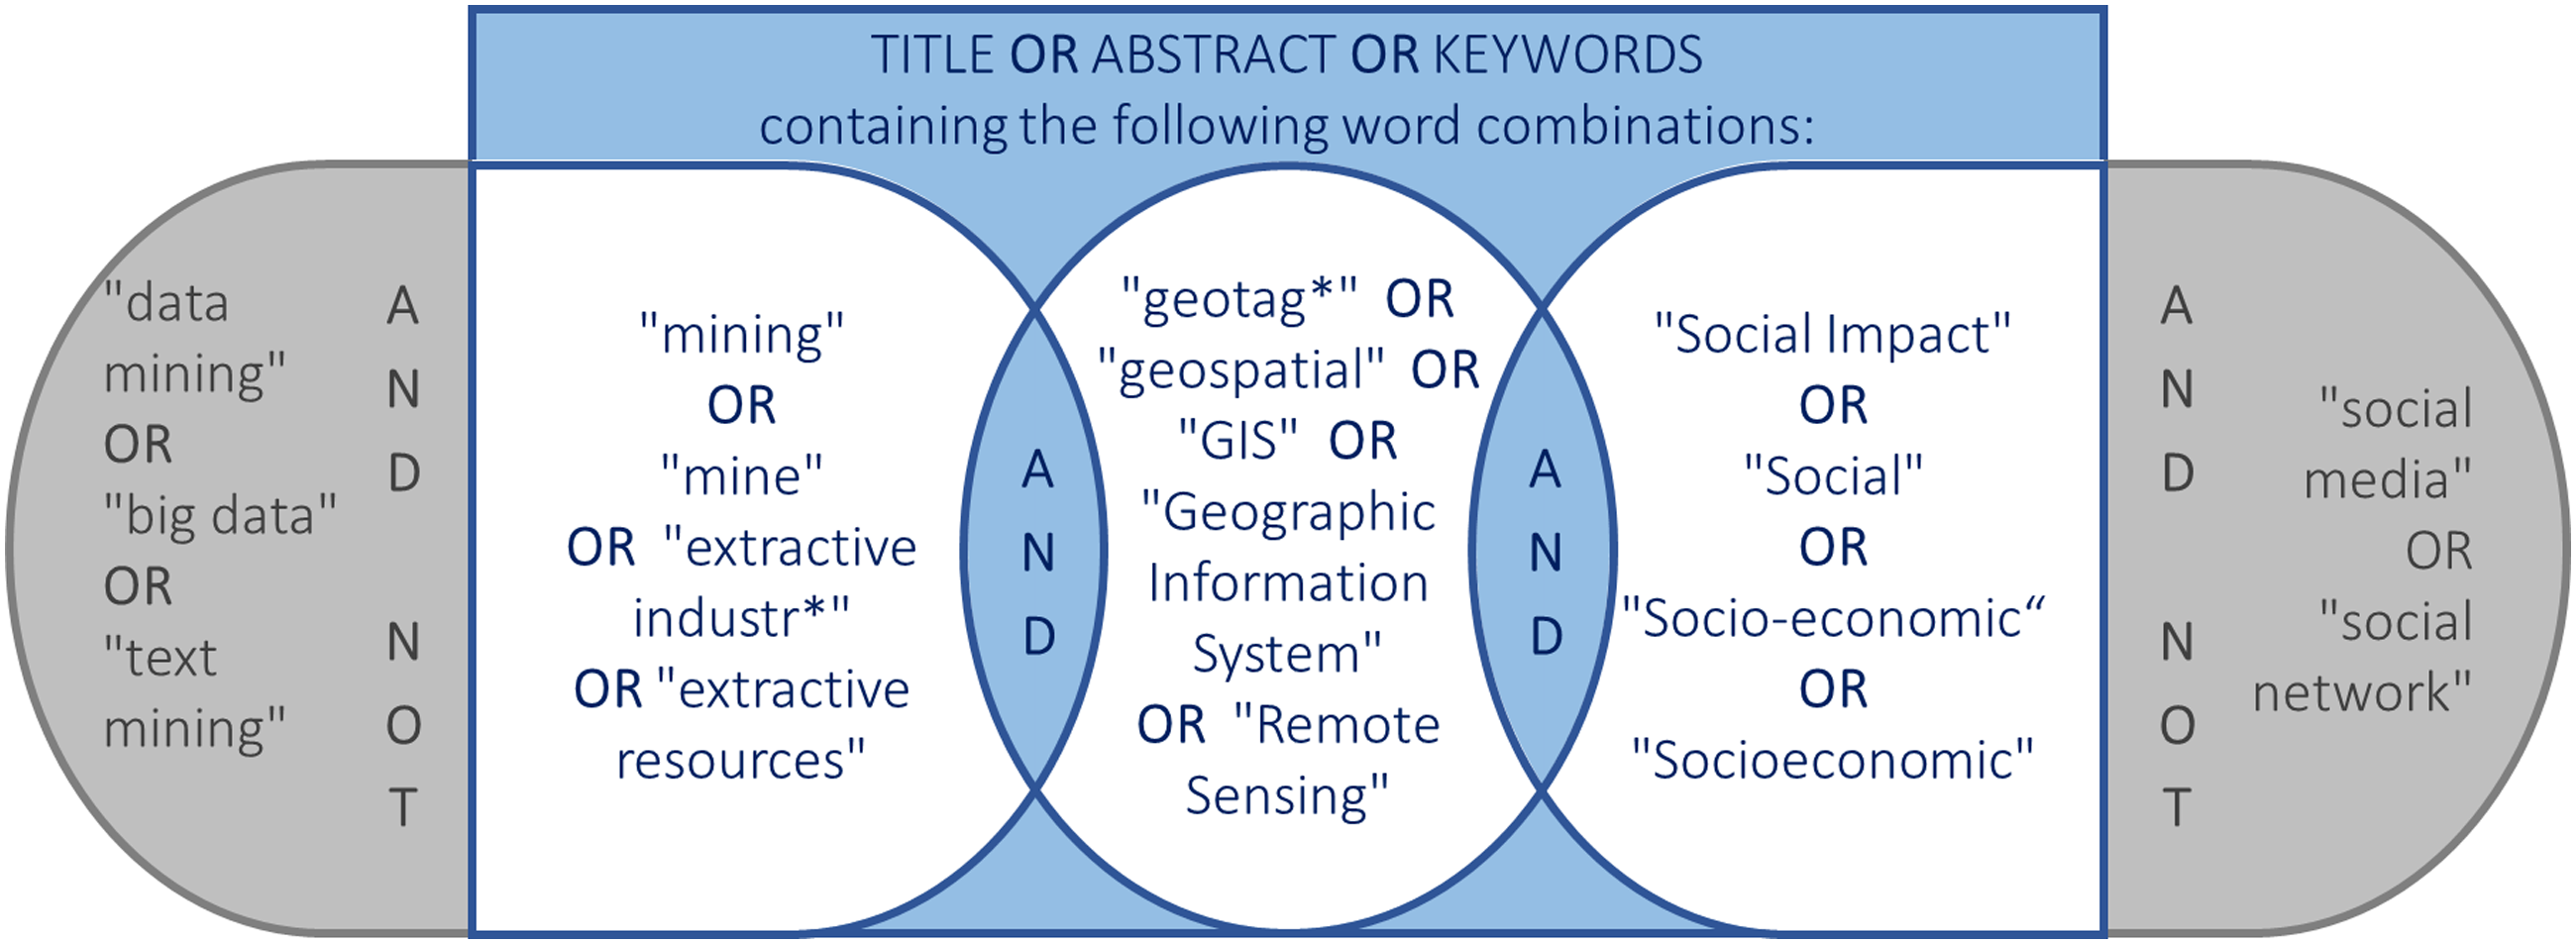
The abstracts (Figure 1) were then manually screened to select studies based on the following criteria: a) Study area included mining site(s) or mining region(s). b) Focused on social and economic mining impacts. Papers that studied environmental impacts were included if they also analysed socioeconomic impacts. c) Utilized GIS and/or remote sensing methods, either as a major or minor component of their methods to capture impacts.
The review included all studies that incorporated geospatial elements, irrespective of how they defined or used these terms. Papers were excluded if GIS or remote sensing were simply used to map or illustrate mining areas or mineral distributions (e.g. Erb-Satullo, 2021), purely technological or methodological advancement literature (e.g. Balaniuk et al., 2020; Kamali et al., 2015; Zhu & Yu, 2016), or which focused on purely ecological mining impacts but did not undertake any social-related impact analysis (e.g. Cosimo et al., 2021; Kiere et al., 2021; Lifeng et al., 2009; Peng et al., 2016; Wedding et al., 2013).
Data Compilation and Analysis
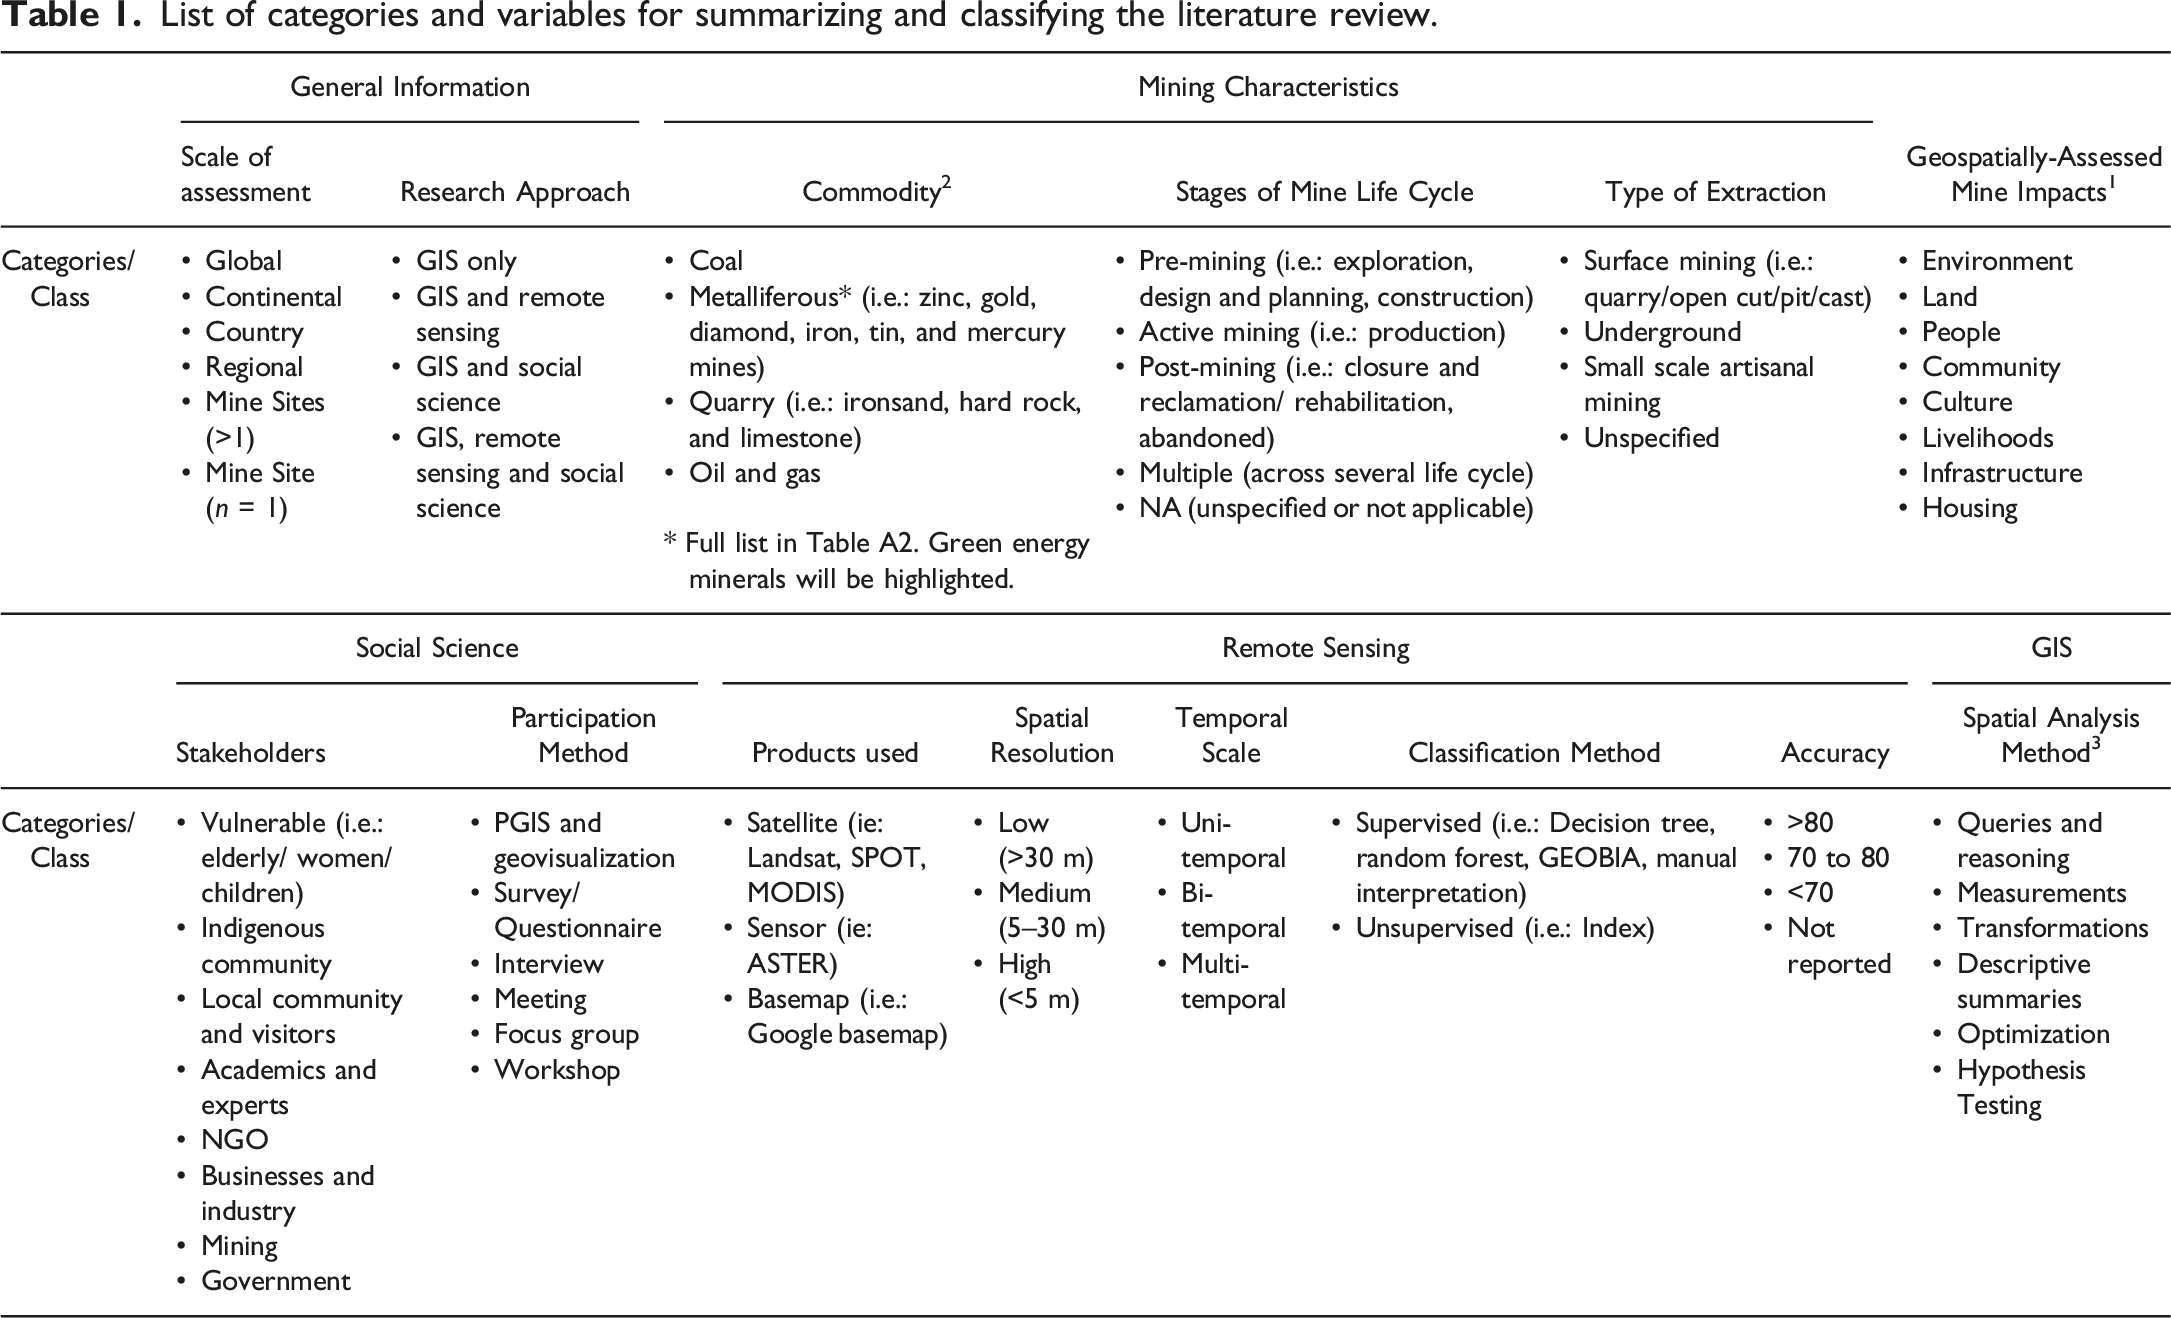
List of categories and variables for summarizing and classifying the literature review.
Objective 1: General Information, Research Approaches and Mining Characteristics
The Definition of the Four Research Approaches Used to Classify the Literature. * The Definition of Data Generation Method for Each Study Method Category is Italicized and Bold.

Objective 2: Categories of socioeconomic mining impacts spatially studied
The Social Framework for Projects (Smyth & Vanclay, 2017) was applied due to its clarity in communicating social and environmental factors related to mining. Using this framework, we classified the geospatially assessed mine impacts using the eight variables: ‘Environment’, ‘Land’, ‘People’, ‘Community’, ‘Culture’, ‘Livelihoods’, ‘Infrastructure’ and ‘Housing’.
Objective 3: Approaches used for capturing mining impacts
Social science
The free and prior informed consent (FPIC) concept establishes the importance of engaging affected communities in project decision-making processes (Anaya, 2011; Owen & Kemp, 2014). As mining impacts most severely affect local and vulnerable people and places (Owen, Kemp, Harris, et al., 2022), we identified the types of stakeholders involved, and the participation method used. This allowed us to determine the extent of public engagement and social science approaches used in accordance with international standards on consultation and consent (Anaya, 2011; Owen & Kemp, 2014). The categories of stakeholders, are divided into ‘Vulnerable’ which includes the elderly, women and children, 4 ‘Indigenous Community’ which are heavily dependent on the land and natural resources, ‘Local Community and Visitors’ which includes people living and working in the area, ‘Experts and Academics’ which includes researchers and field experts, non-governmental organization (‘NGO’), ‘Businesses and Industries’ owners such as those in the agricultural sectors, ‘Mining’ authorities and employees, and ‘Government’ officials. The participation method was divided into participatory geographic information system ‘(PGIS) and Geovisualization’, ‘Survey/Questionnaire’, ‘Interview’, ‘Meeting’, ‘Focus Group’ and ‘Workshop’.
Remote sensing
To determine the range and nature of the remote sensing approaches applied and to compare the variety of geospatial products used to study various socioeconomic and environmental impact categories, we extracted information on the products used, spatial resolution, temporal scale, land use and land cover (LULC) classification methods and reported classification accuracy.
Remote sensing products included ‘Satellites’ (i.e. Landsat, SPOT and MODIS), ‘Sensor’ (i.e. ASTER) and ‘Basemap’ (i.e. Google Earth). For studies that did not use sensors and instead obtained pre-processed, remotely sensed or geospatial data, the types of data used were categorized based on the Social Framework for Projects (Smyth & Vanclay, 2017). The spatial resolution categories were ‘High’ for resolution less than 5 m, ‘Medium’ for resolution between 5 to 30 m and ‘Low’ for resolution above 30 m. The temporal scale of the studies indicates the measurement period(s) which were grouped into ‘Uni-temporal’ for single timestep studied, ‘Bi-temporal’ for studies using two timesteps and ‘Multi-temporal’ for studies with three or more timesteps.
The remote sensing LULC classification methods were divided into supervised and unsupervised. ‘Supervised’ classification includes Geographic Object-Based Image Analysis (‘GEOBIA’) for studies which utilized segmentation and image-objects instead of pixels for classification. Methods using training samples and machine learning algorithms such as Random Forests, Support Vector Machines (SVM), Classification and Regression Trees (CART), Maximum Likelihood and Convolutional Neural Network (CNN) were also classified under ‘Supervised’ classification, as were those that digitized polygons to manually create classes. On the other hand, ‘Unsupervised’ classification included studies which classified pixels based on indices such as Normalized Difference Vegetation Index (NDVI) and Normalized Difference Build-up Index (NDBI) or other unsupervised methods such as ISOSEG (using k-Means), self-organization cluster analysis (ISOCLUST – from IDRISI), and Iterative Self-Organizing Data Analysis (ISODATA).
Accuracy assessment is important for assessing the reliability and fitness-for-use of remote sensing products such as LULC data (Lechner et al., 2012; Rwanga & Ndambuki, 2017; A Wentz & Shimizu, 2018) such as LULC classification. An accuracy of 80% and above is considered high while 70% is the more commonly applied threshold (Anderson et al., 1976; Foody, 2002; Lunetta et al., 1991). We assessed reported accuracy in papers and used the ‘Not reported’ class for studies which carried out classification but did not perform or report the accuracy assessment results.
GIS
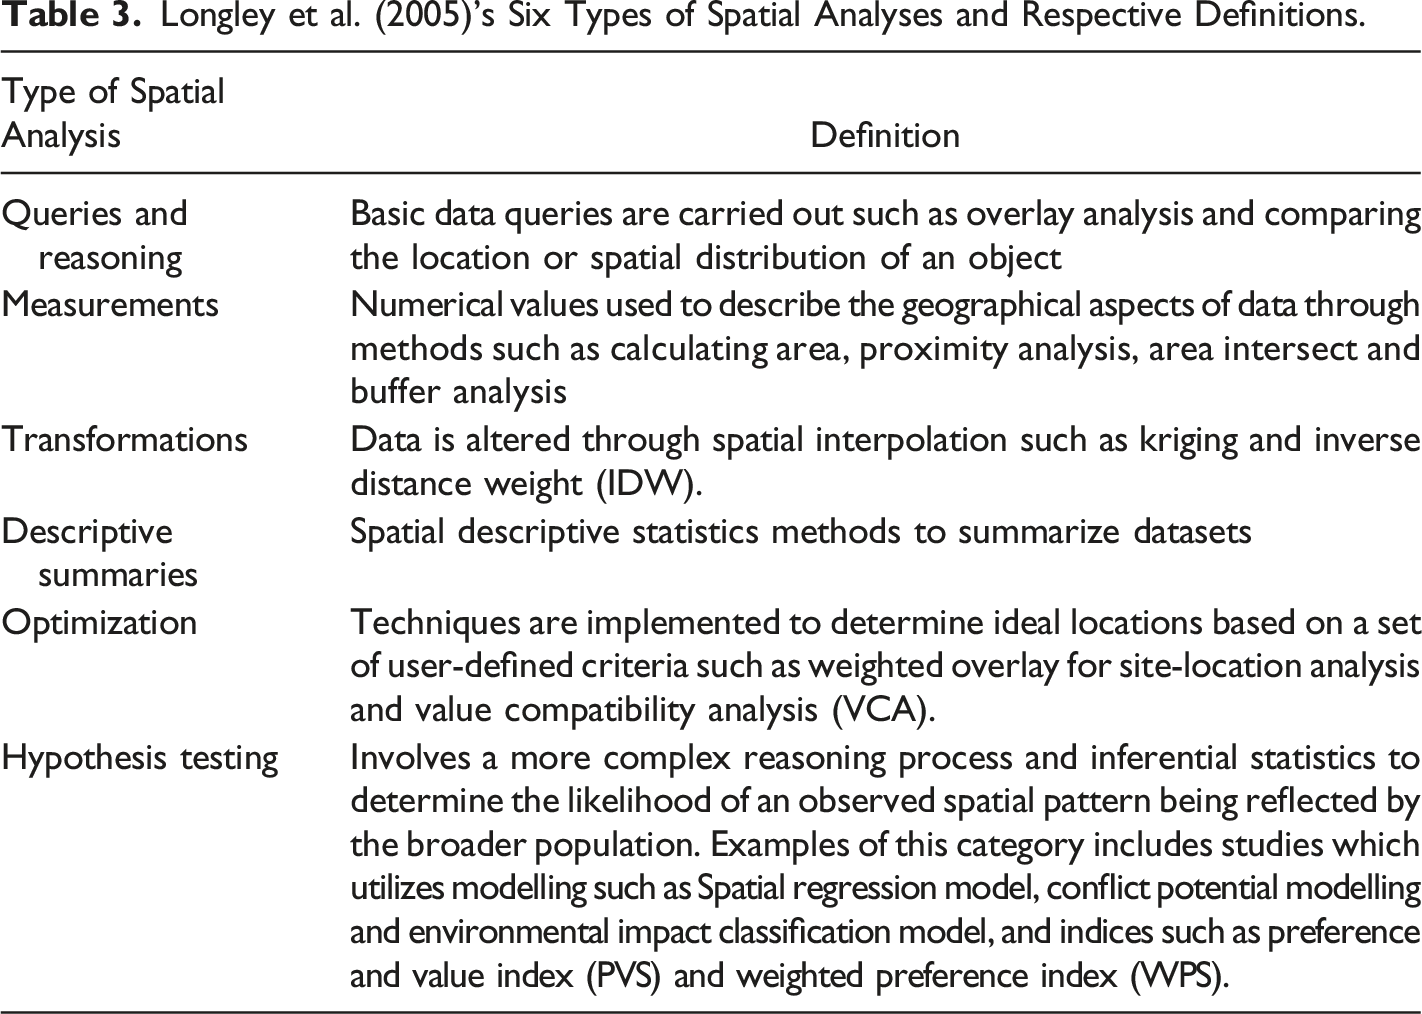
Longley et al. (2005)’s Six Types of Spatial Analyses and Respective Definitions.
Results
The initial search yielded 448 studies published between 1989 and 2021. Of these, only 210 English language articles were published in peer-reviewed journals. The screening to determine if papers undertook GIS/remote sensing analysis of socioeconomic impacts returned a total of 71 studies that were included in the final review.
Objective 1: General information, research approaches and mining characteristics
Of the 71 studies, the earliest was a study in India, South Asia, published in 1996 (Figure 2) that used remote sensing to determine land use and land cover (LULC) changes associated with an increase in mining activity over a 20-year period (Jhanwar, 1996). There were no other studies captured until 2005 but after 2014, there was a steady increase in publications per year. More than three quarters of the studies were published post 2014, with the highest number of 11 papers published per year both in 2020 and 2021. In terms of the geographical distribution, the studies are relatively well distributed across the east and the west with the highest number of studies carried out in Europe and China (Figure 3 A). The distribution of the first authors’ primary research institutions have been compiled in Figure A 1; a higher proportion of authors are based in the western regions, such as North and South America, Europe and Oceania, compared to the east, such as East Asia, South Asia, West Asia and Southeast Asia (SEA). Distribution of studies based on publication year and study area region (N = 71). The total number of studies carried out in each region is indicated in brackets, that is, East Asia (n = 14). The general characteristics of the studies (N = 71). (A) The proportions of study area regions; (B) The various scales at which the studies were conducted; (C) stage of mining lifecycle; (D) types of commodity extraction method; and (E) the categories of commodities extracted.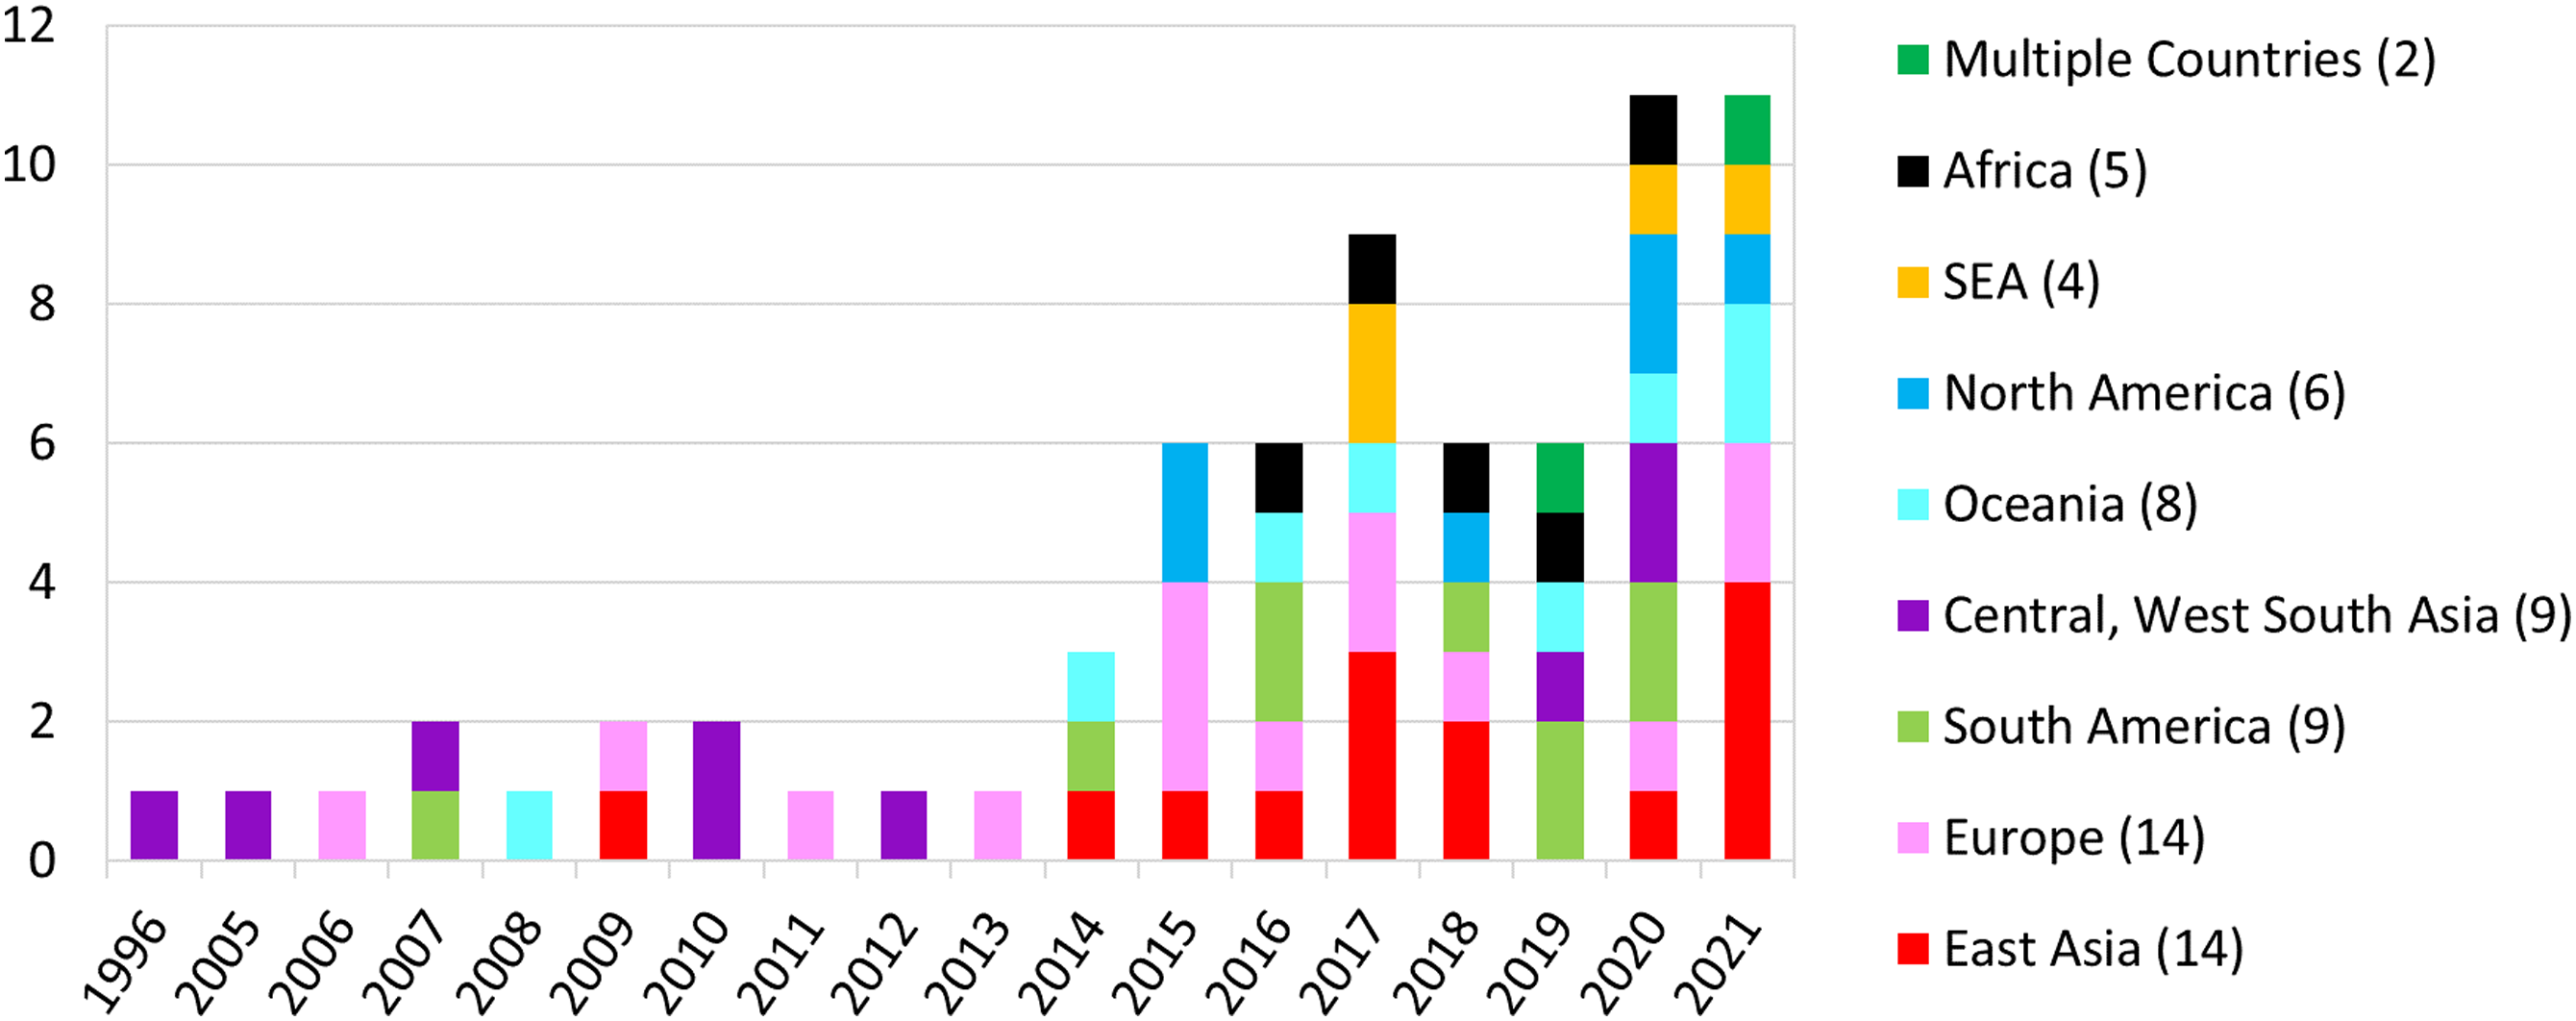
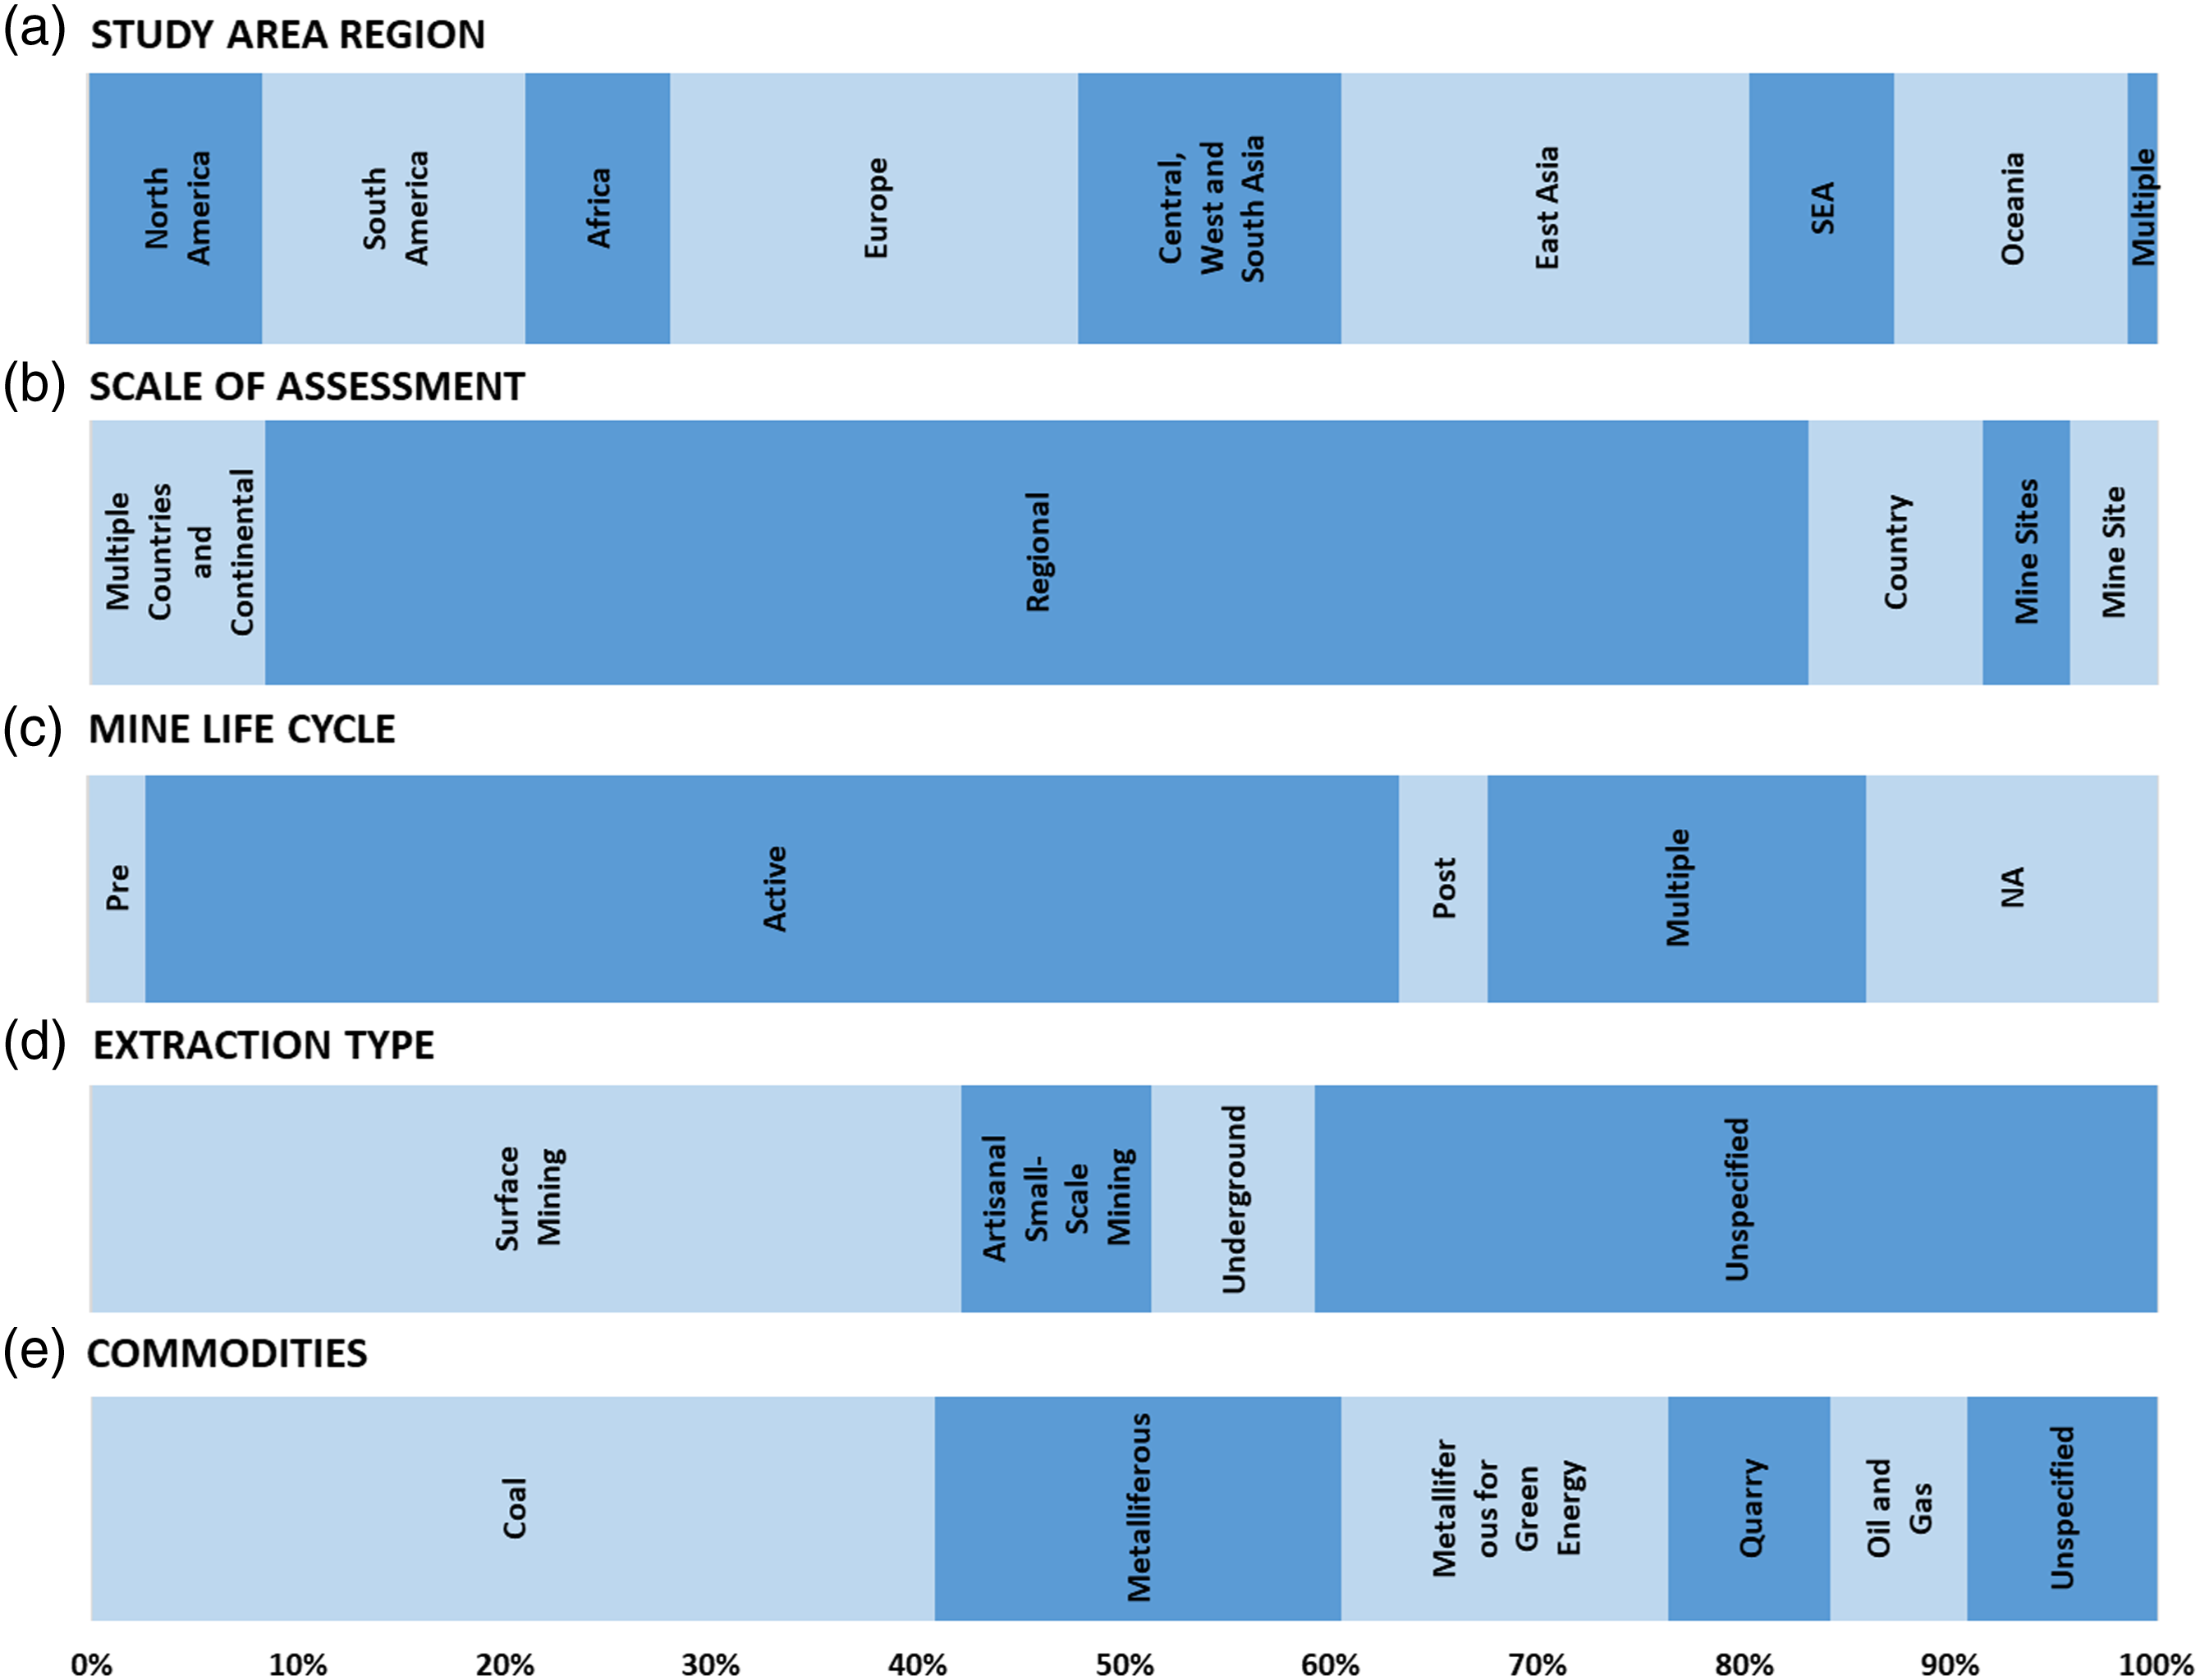
Three quarters of the studies were carried out at the ‘Regional’ scale while the remaining covered areas at the ‘Mine Site’, ‘Mine Sites’, ‘Country’ and ‘Multiple Countries and Continental’ scales (Figure 3 B). The majority of the studies focused on impacts during the active mining (i.e. production) stage (61%), with only 18% of studies analysing impacts across multiple stages of the mine life cycle (Figure 3 C). Only two studies were carried out during the pre-mining stage, both of which used the spatial analytical hierarchy process (AHP) to identify the most suitable location either for pit development (Risk et al., 2020) or a gilsonite processing plant (Kazemi et al., 2020). On the other hand, three studies were carried out on post-mining landscapes (Rich et al., 2015; Tao & Wang, 2021; Werner, Bach, et al., 2020) with 2 studies on coal mines and 1 study on quarry commodity.
Forty papers (56%) reported on the type of mineral extraction studied which included either or a combination of underground, artisanal small-scale mining (ASM) and surface mining (Figure 3 D).
The remaining 31 papers did not specify any extraction type. Majority of these studies (n = 25) disclosed the type of mine commodities while the rest (n = 6) typically had a regional focus on general social and LULC impacts; hence, the extraction type was not the main focus. Seven studies on ASM were linked to gold extraction and were published within the last 4 years (Figure A 2). Four out of the six underground mining studies were coal related. The coal mining studies make up a large proportion of the literature (Figure 3 E) and are concentrated within the last 7 years (81%), peaking in 2021 (n = 7) (Figure A 3). The majority of the coal mining studies were carried out in China (42%) (Figure 4), in line with the increasing amount of coal mined from this country (e.g. 50% of global coal production in 2012 came from China) (Xiao et al., 2017). The number of studies capturing energy transition minerals (ETM) associated with securing a green energy future (Herrington, 2021) (Table A 2) were more frequent within the last decade than prior to this (Figure A 3). Distribution of commodities and study area location.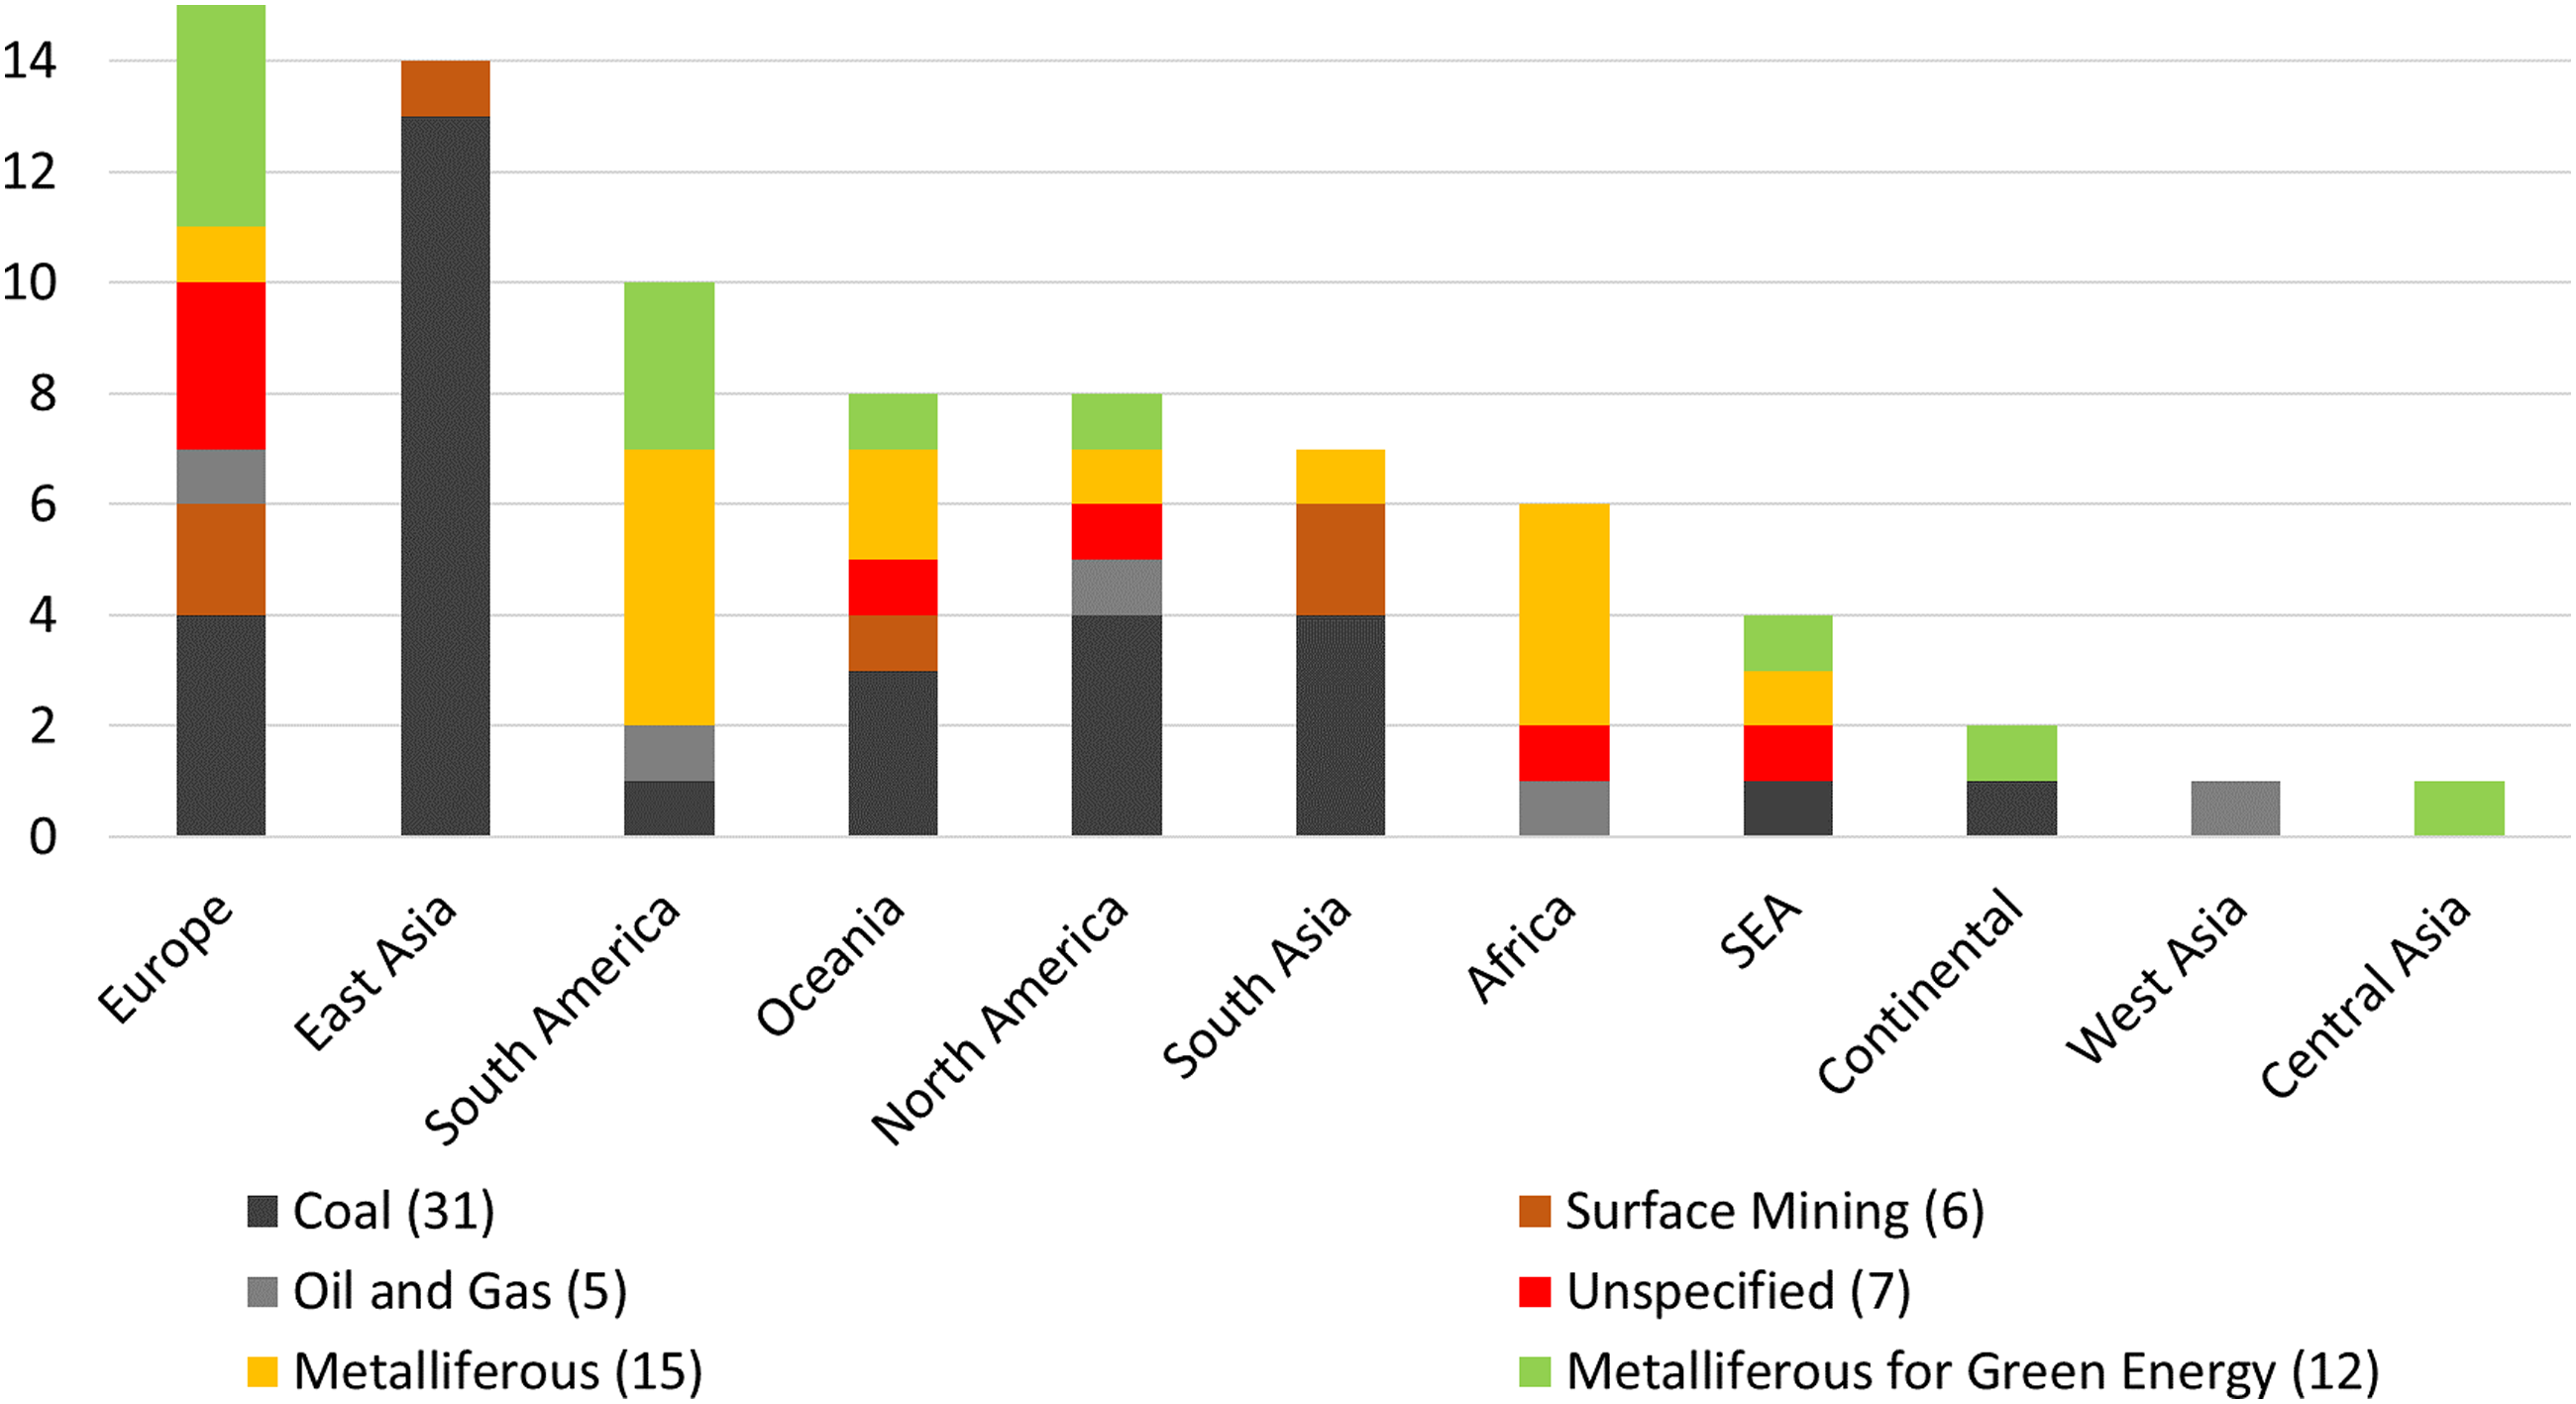
Objective 2: Categories of socioeconomic mining impacts spatially studied
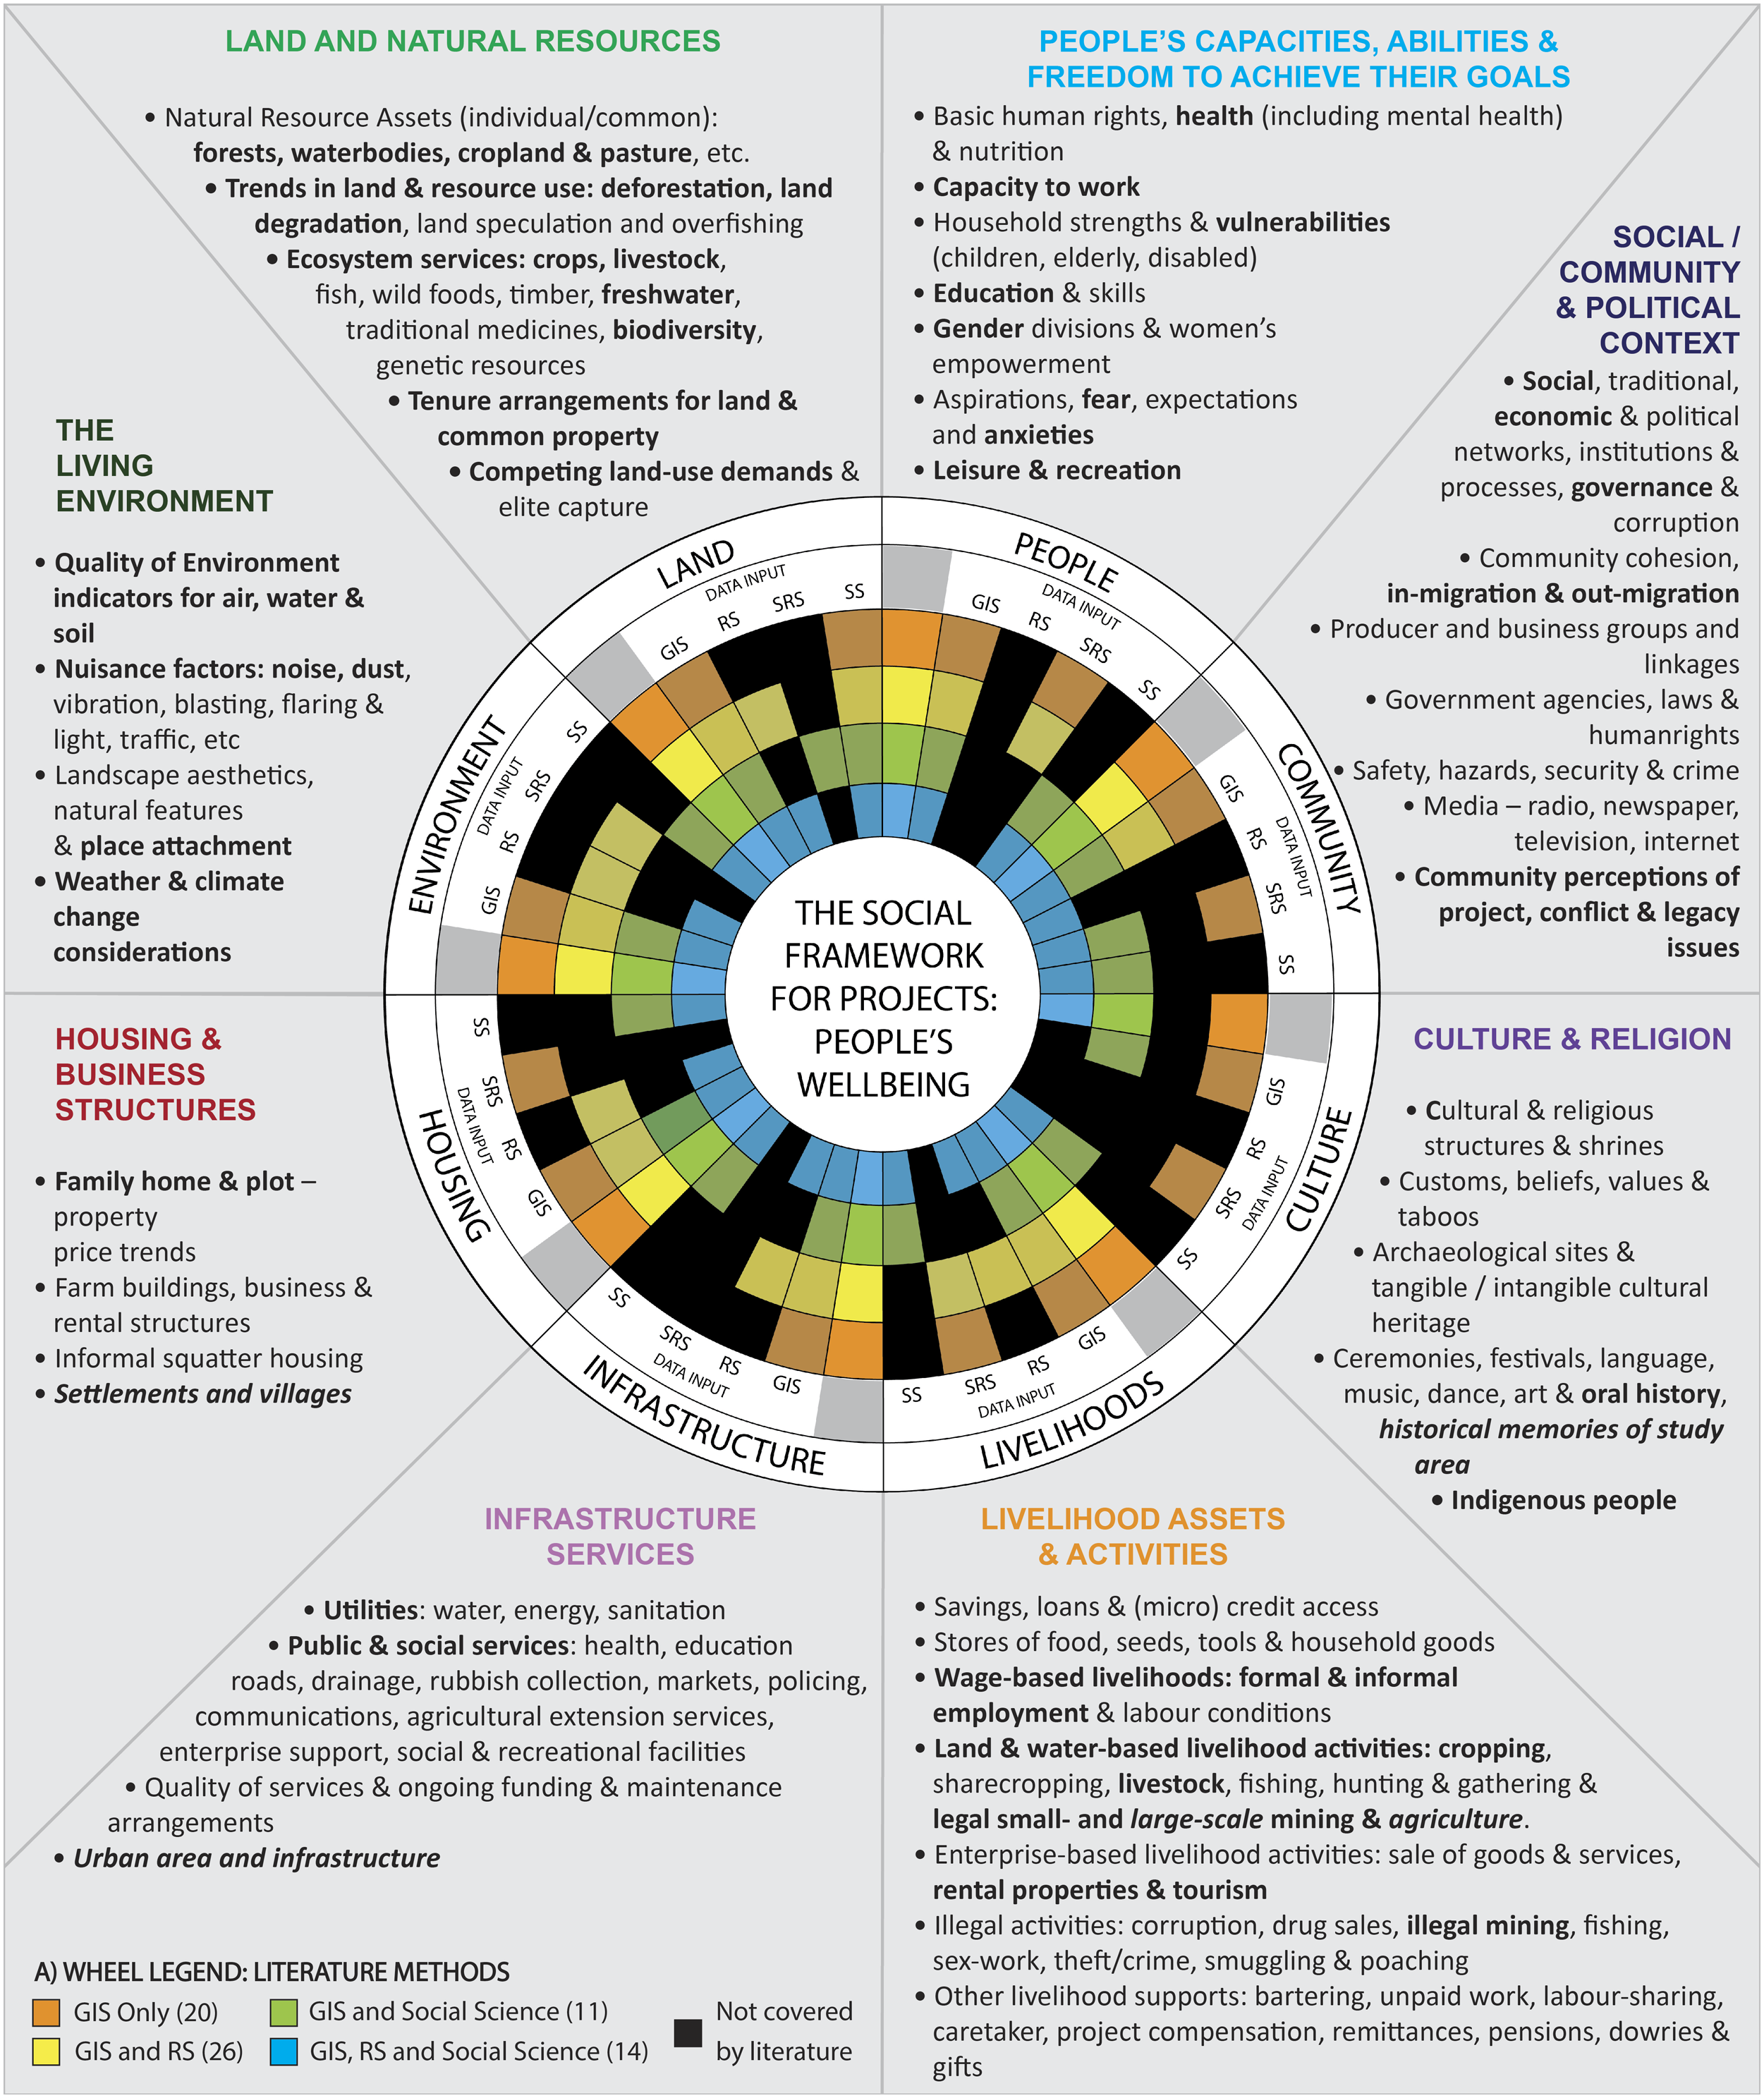
Overall, all eight categories of the socioeconomic and environmental impacts identified by the Social Framework for Projects (Smyth & Vanclay, 2017) were represented in the literature (Figure 6). However, intangible aspects (i.e. ‘Culture’) were rarely captured, especially using remote sensing approaches alone (Figure 5), and instead were only successfully captured with the integration of GIS and remote sensing with social science approaches (Figure 6). Most of the studies considered between two and four categories, with three categories being the modal value (Figure 5A). ‘GIS only’ and ‘GIS and remote sensing’ mostly included three indicators (light yellow bar) per study (Figure 5A). For ‘GIS and social science’ and ‘GIS, remote sensing and social science’ method categories, the studies considered mostly two indicators (orange bar) per study (Figure 5A). From Figure 5A, the highest number of indicators per study was six, and only one paper in the ‘GIS and social science’ category (Pattanayak et al., 2010) successfully included 7 indicators (Figure 5E). A) The proportions of number of indicators per study for each the overall literature (N = 71) and by each of the four method categories. B) The proportions of the eight aspects of the Social Framework for Projects (Smyth & Vanclay, 2017) being studied by the overall literature (N = 71) and by each of the four method categories. A) [At the centre of the figure] the wheel of gaps in knowledge demonstrates the capabilities of each of the following four method categories to capture the aspects of the Social Framework for Projects (Smyth & Vanclay, 2017). Literature coverage is represented by the coloured cells within the four circular layers in the wheel: (1) GIS Only (outermost in orange), (2) GIS and remote sensing (second outermost in yellow), (3) GIS and social science (second innermost in green) and (4) GIS, remote sensing and social science (innermost in blue). The black cells are knowledge gaps that were not covered by the literature. The five subsegments within each of the eight aspects of the framework represent (A) the summary coverage for each major segments, (B) GIS – geospatial data input, (C) SRS – spatially referenced social data input (i.e. PGIS data and census data that was collated into grids or non-political boundaries or regions of interest), (D) RS – remote sensing data input both collected and/or pre-processed (i.e. climatic products and classified LULC), and (E) SS – non-spatial social science data input (i.e. quantitative or qualitative data collected from surveys and interviews with local stakeholders). B) [The grey area surrounding the wheel (A)] is the framework updated with the socioeconomic and environmental impacts that were spatially studied by the literature (in bold). Additional impacts that were not in the original list but found in this literature review are italicized.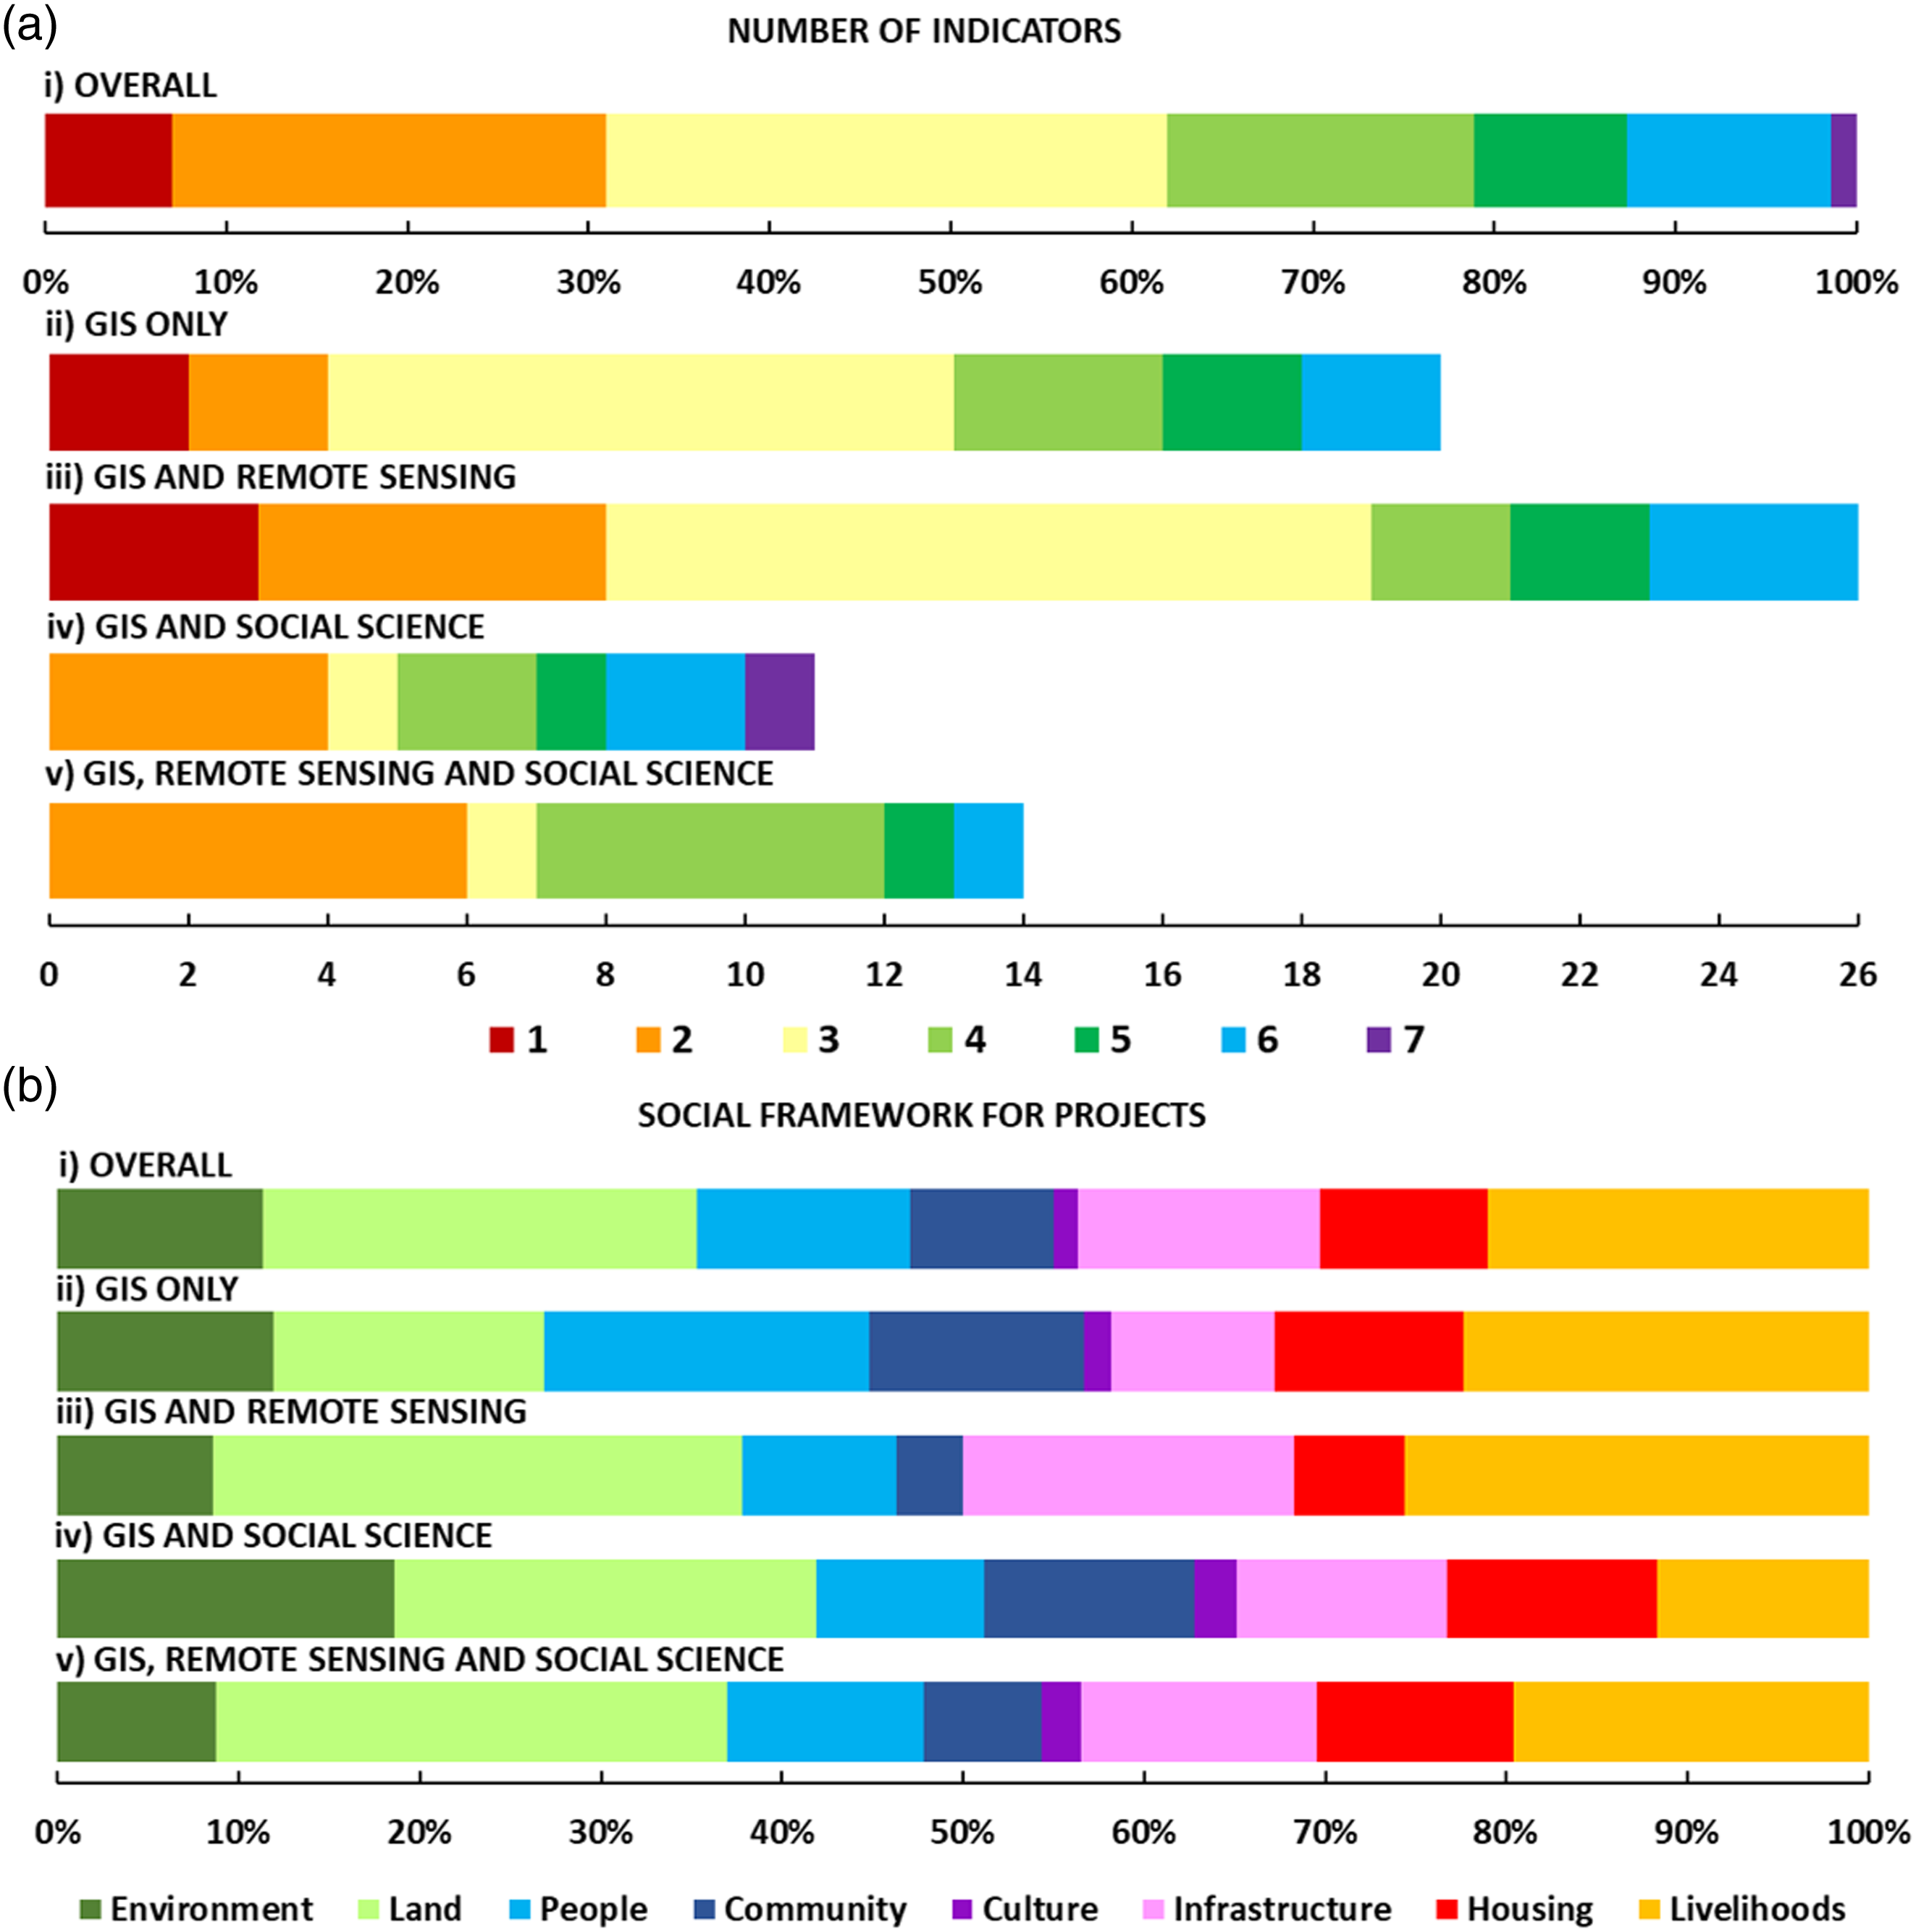
The most studied indicator was ‘Land’ followed by ‘Livelihoods’. For the ‘GIS and remote sensing’ method category, ‘Infrastructure’ was the third most captured indicator while for ‘GIS only’, the number of studies that captured ‘People’ were higher than ‘Land’. The environmental (‘Environment’ and ‘Land’), social (‘People’, ‘Community’, ‘Infrastructure’ and ‘Housing’) and economic (‘Livelihoods’) indicators were well covered by all four Study Method Categories.
Objective 3: Approaches used for capturing mining impacts
Social science
Social science methods were used to derive quantitative and qualitative data from stakeholders in 25 out of the 71 studies (Figure 7). Figure 7 depicts an alluvial diagram illustrating the distribution of data across different variables related to the social science literature and the interrelationships among variables (columns) and categories (rows). Each category is represented by black lines (nodes), with the length of the node indicating the proportion of publications associated with it. The alluvial shows the proportions and correlations between the variables (rows) under the associated categories (columns) for the studies that implemented social science methods (n = 25). Note: some studies may apply one or more combinations of stakeholders and social science methods.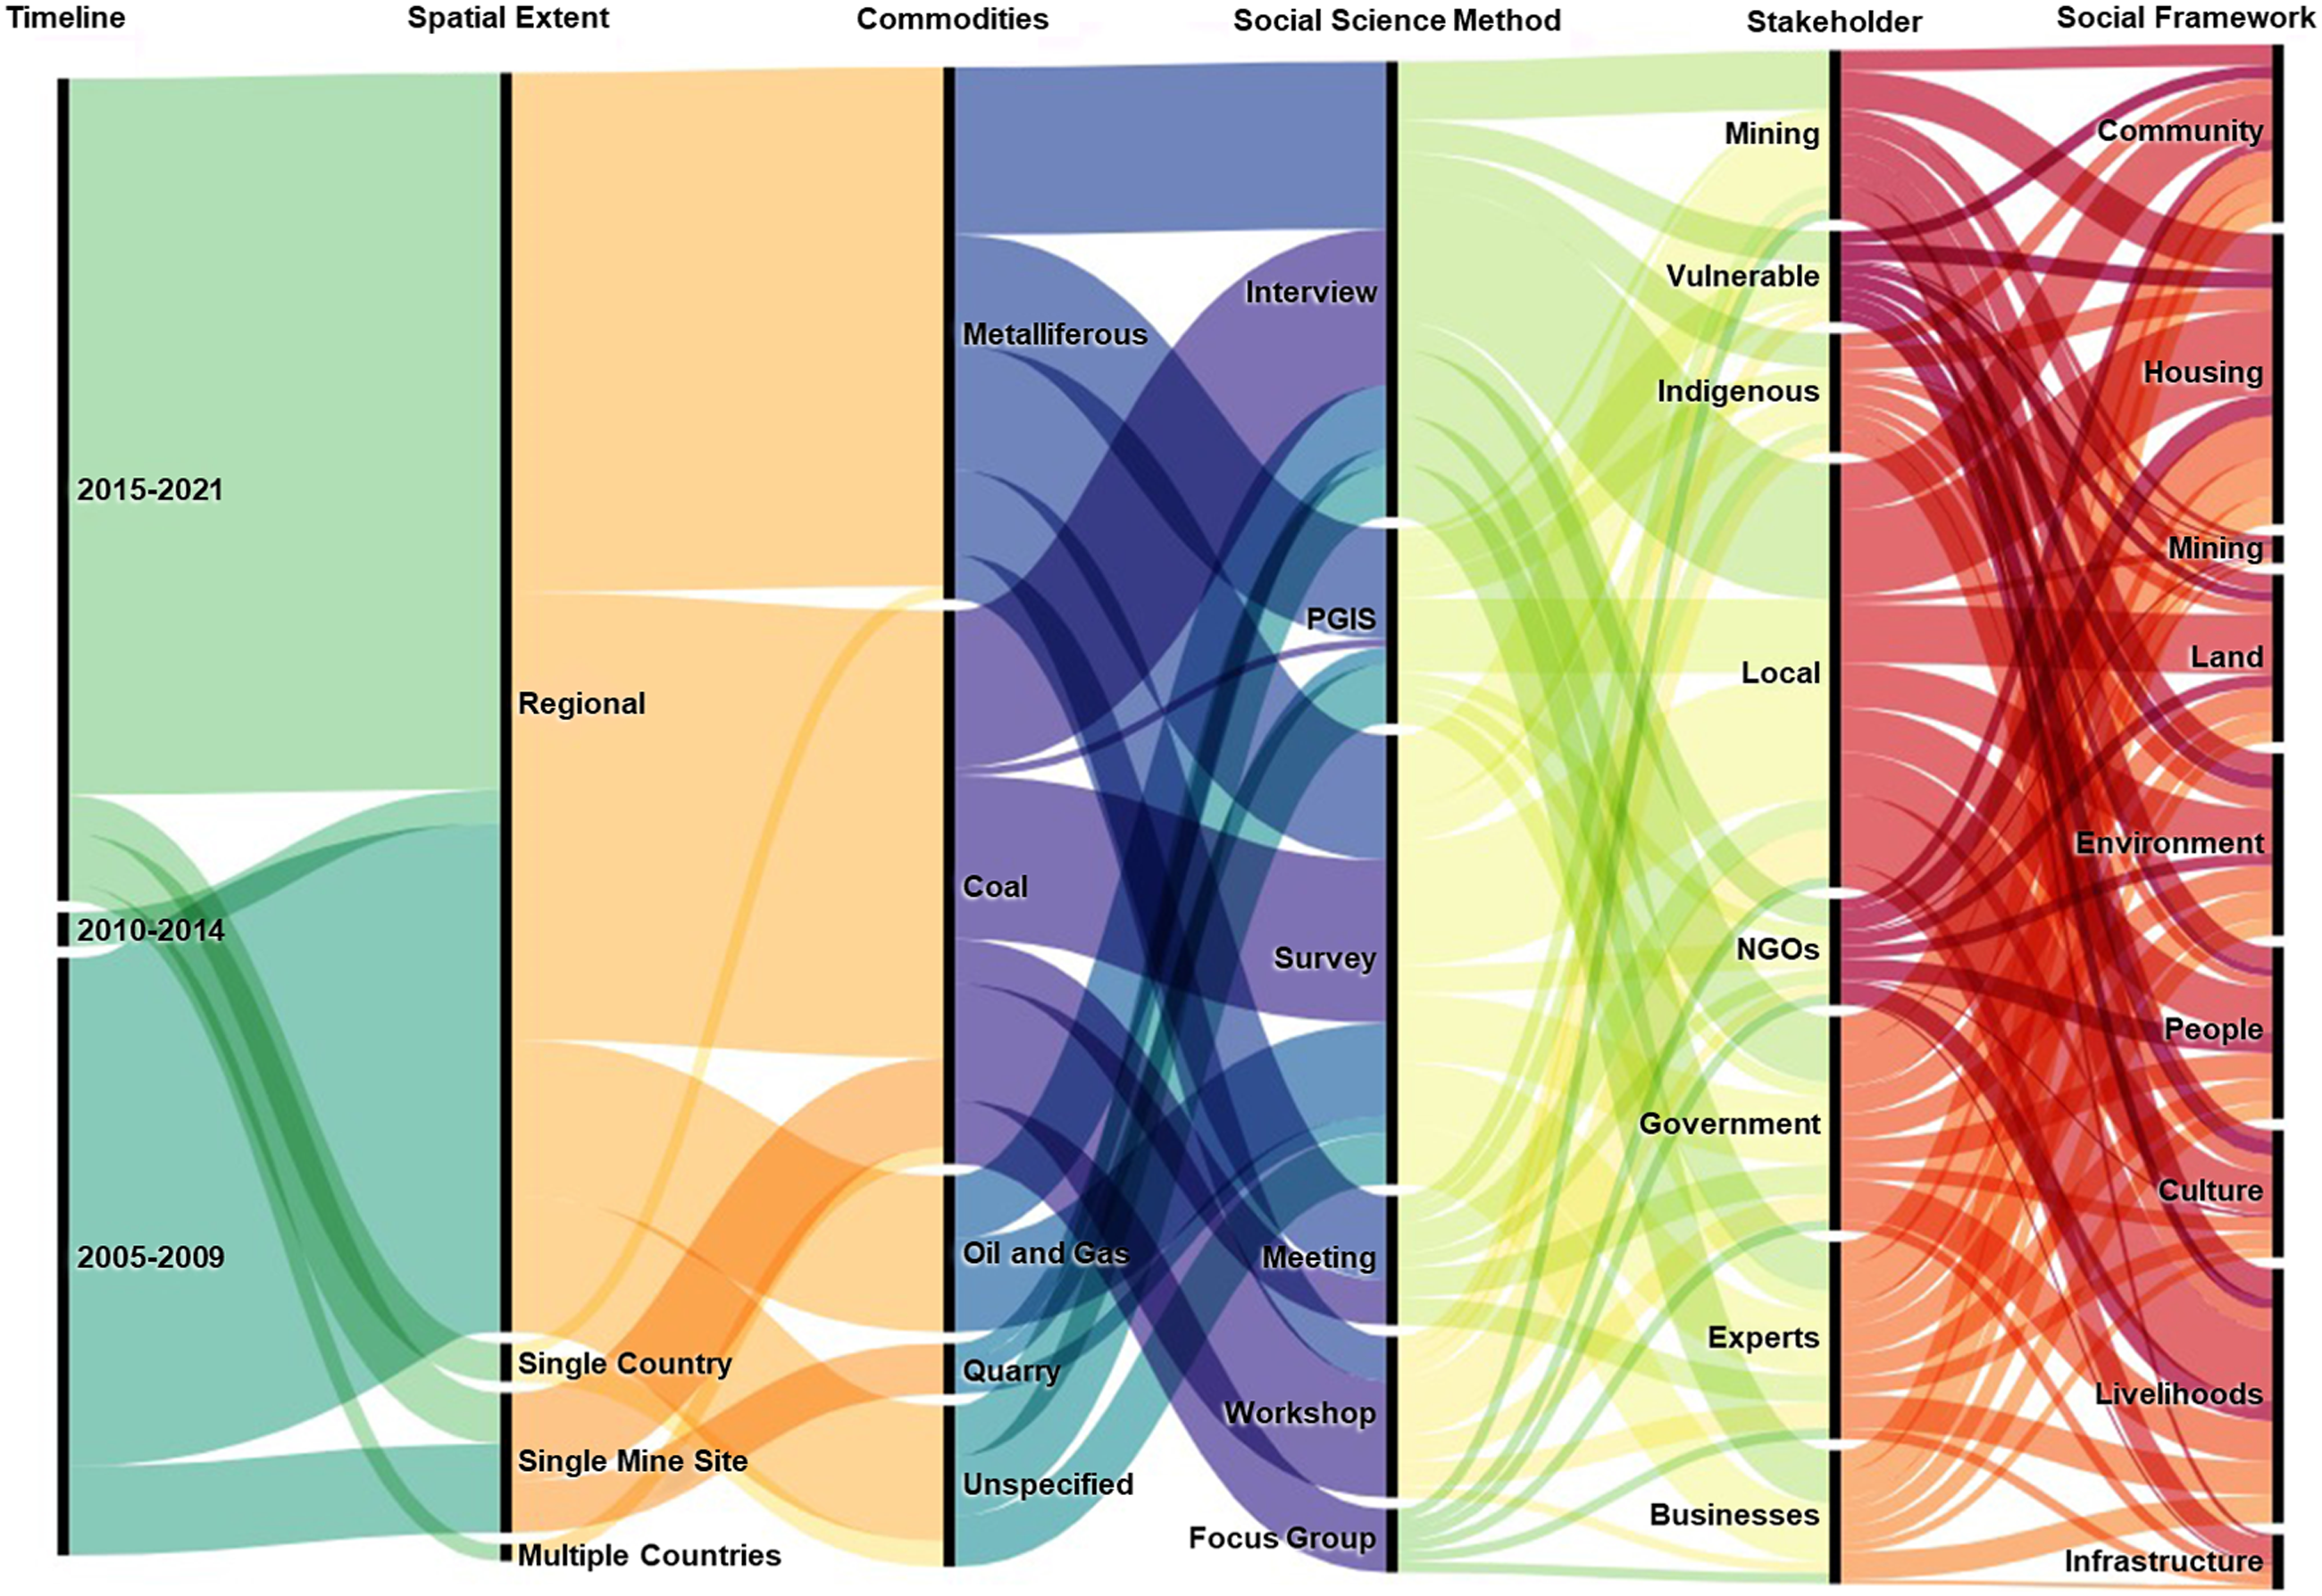
As shown in Figure 7, the majority of studies were conducted at the ‘Regional’ scale with areas mostly mining for ‘Coal’ and ‘Metalliferous’ commodities, followed by ‘Oil and Gas’. The most common methods used were ‘Survey/Questionnaire’ and ‘Interview’. Other methods include Participatory GIS (‘PGIS’) and Citizen Science, ‘Workshops’, ‘Meetings’ and only one study organized a ‘Focus Group’ session (Figure A 4). All studies that utilized social science methods included stakeholder engagement and the top four groups engaged were the ‘Local Community and Visitors’, people in the ‘Mining industry’ and ‘Government’ and ‘Academics and Experts’, in that order (Figure 7). Other stakeholders engaged were ‘Businesses and Industry’ members, ‘NGOs’, ‘Indigenous Community’ and ‘Vulnerable Community’, which includes the elderly, women and children. Although only four studies specifically mentioned involving vulnerable community members, the remaining studies that engaged the ‘Indigenous Community’ and ‘Local Community and Visitors’ most likely also captured the elderly and females. Overall, a variety of stakeholders were represented by the studies that implemented social science methods to capture all eight social framework categories (Smyth & Vanclay, 2017) across all these studies (Figure 7).
Remote sensing
A total of 40 of the 71 papers implemented remote sensing via either of three applications: (1) some utilized remote sensing data in the form of only pre-processed and readily available remote sensing products (n = 4), (2) some only used multispectral satellite imagery processed with classification methods (n = 24) and (3) others used a combination of both pre-processed remote sensing data and processed satellite images (n = 12). Figure 8 provides a visual representation of the distribution of remote sensing categories (rows) across the variables (columns) and their interconnectedness. The black lines (nodes) represent the categories, and the length corresponds to the proportion of publications per category. The alluvial shows the proportions and correlations between the variables (rows) under the associated categories (columns) for the studies that used remote sensing images and classification methods (n = 40).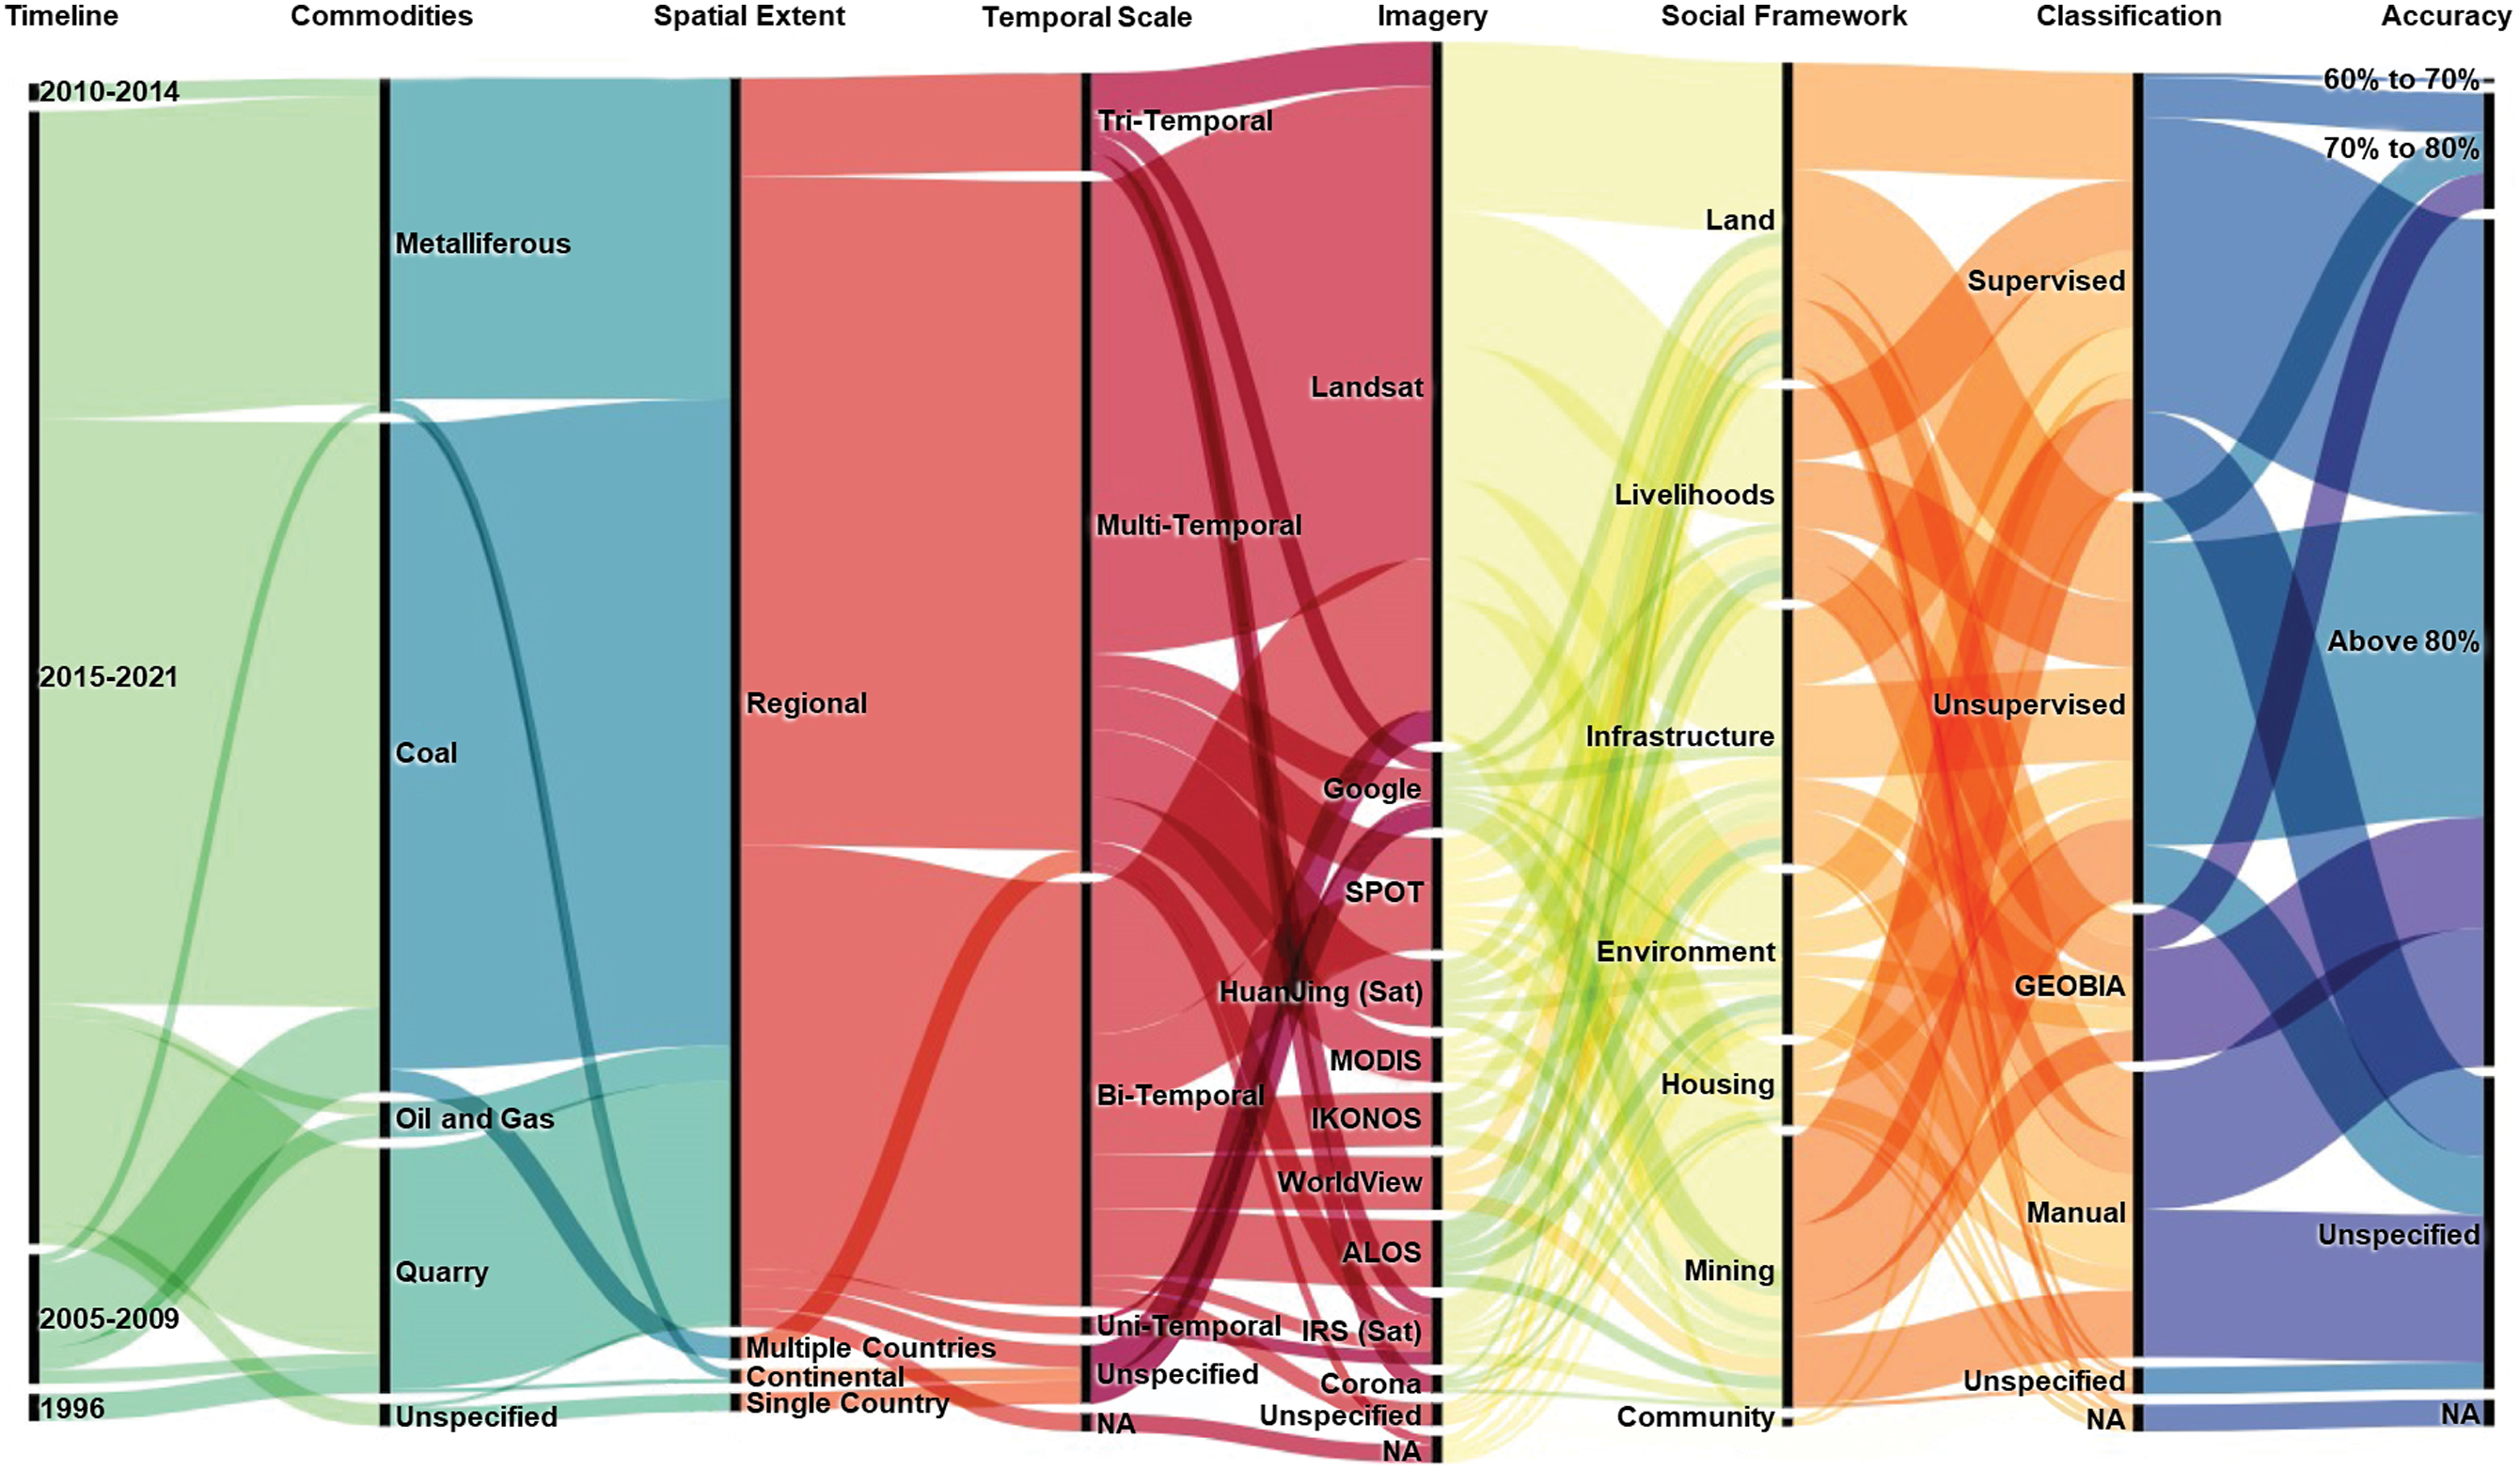
Based on the alluvial chart (Figure 8), a large majority of the studies on ‘Coal’, ‘Metalliferous’, ‘Quarry’ and ‘Oil and Gas’ commodities across the timeline were conducted at the ‘Regional’ scale, with only a handful conducted at the ‘Multiple Countries’, ‘Continental’ and ‘Single Country’ level. Generally, studies were conducted across multiple timescales, although most of them were ‘multi-temporal’, ‘bi-temporal’ and ‘tri-temporal’ assessments (Figure 8). Studies that applied change-detection and time-series analysis especially for land use and land cover (LULC) assessment usually employ multispectral image processing spanning multiple timesteps and across decades.
A variety of image types were used by these studies (Figure 8). The high-resolution satellite products (resolution <5 m) used by 13 studies were ‘Google’ basemaps, ‘SPOT’, ‘WorldView’ and ‘IKONOS’. On the other hand, 29 studies utilized medium resolution satellite image (resolution 5–30 m) consisting of ‘ALOS’, ‘Corona’ satellite, ‘Huanjing’ satellite and ‘Landsat’. ‘Landsat’ products were used by a large majority (n = 26) of the studies that carried out image processing (Figure 8 and Figure A 5).
The classification methods applied included ‘Supervised Classification’ using Object-Based Image Analysis (OBIA), manual visual interpretation and digitization, decision tree, random forest and other supervised methods such as Neural Net Interpretation (Zhang et al., 2016), Convolutional Neural Networks (CNN) (Tao & Wang, 2021), Spectral Angle Mapping (SAM) algorithm (Boakye et al., 2020) and Supervised Support Vector Machine (SVM) algorithm (Schmid et al., 2013). ‘Unsupervised Classification’ included use of the CLASlite software (Ang et al., 2020), and clustering algorithms (full list and references in Table A 3). Indices such as Normalized Difference Vegetation Index (NDVI), Normalized Difference Water Index (NDWI), Enhanced Vegetation Index (EVI), Normalized Difference Build-up Index (NDBI), Built-up Area Index (BAI) and Normalized Difference Coal Index (NDCI) were classified in our analysis as part of the ‘Unsupervised Miscellaneous’ category (Table A 4).
Of the 37 papers that classified satellite imagery, 22 conducted and reported accuracy assessment scores. These scores were grouped into 3 categories; ‘60%–70%’ (n = 1), ‘70%–80%’ (n = 4) and ‘above 80%’ (n = 17). Overall, a higher proportion of studies that utilized ‘Unsupervised’, ‘Supervised’, ‘GEOBIA’ and ‘Manual’ classification methods reported accuracies above 80% (Figure 8). Almost half of the studies that conducted ‘Manual’ classification using visual interpretation of satellite imagery did not conduct or report accuracy assessment scores (Figure 8).
Remote sensing methods only characterized six out of eight of the categories in (Smyth & Vanclay, 2017) Social Framework for Projects (Figure 8). Only one study managed to extract Community indicators in the form of social investment project sites (Ang et al., 2020) which was done with the aid of local knowledge and PGIS methods.
GIS
All studies included some form of spatial analysis (definition of the categories can be found in Table 3 and the full list of the analyses are compiled in Table A 5). The majority of the reviewed studies combined spatial analysis with remote sensing (n = 26), while some analysed GIS data only (n = 20), others used a combination of GIS, remote sensing and social science data (n = 14), and finally, the smallest group only integrated GIS and social science methods (n = 11) (Figures 9 and 6). Overall, ‘Measurement’ was the most implemented spatial analysis while ‘Optimization’ was the least used (Figure 9(a)). A comparison of the spatial analysis method(s) applied by the A) overall literature review (N = 71) and each of the four method categories (full list in Table 2); B) GIS Only C) GIS and remote sensing, D) GIS and social science and E) GIS, remote sensing and social science.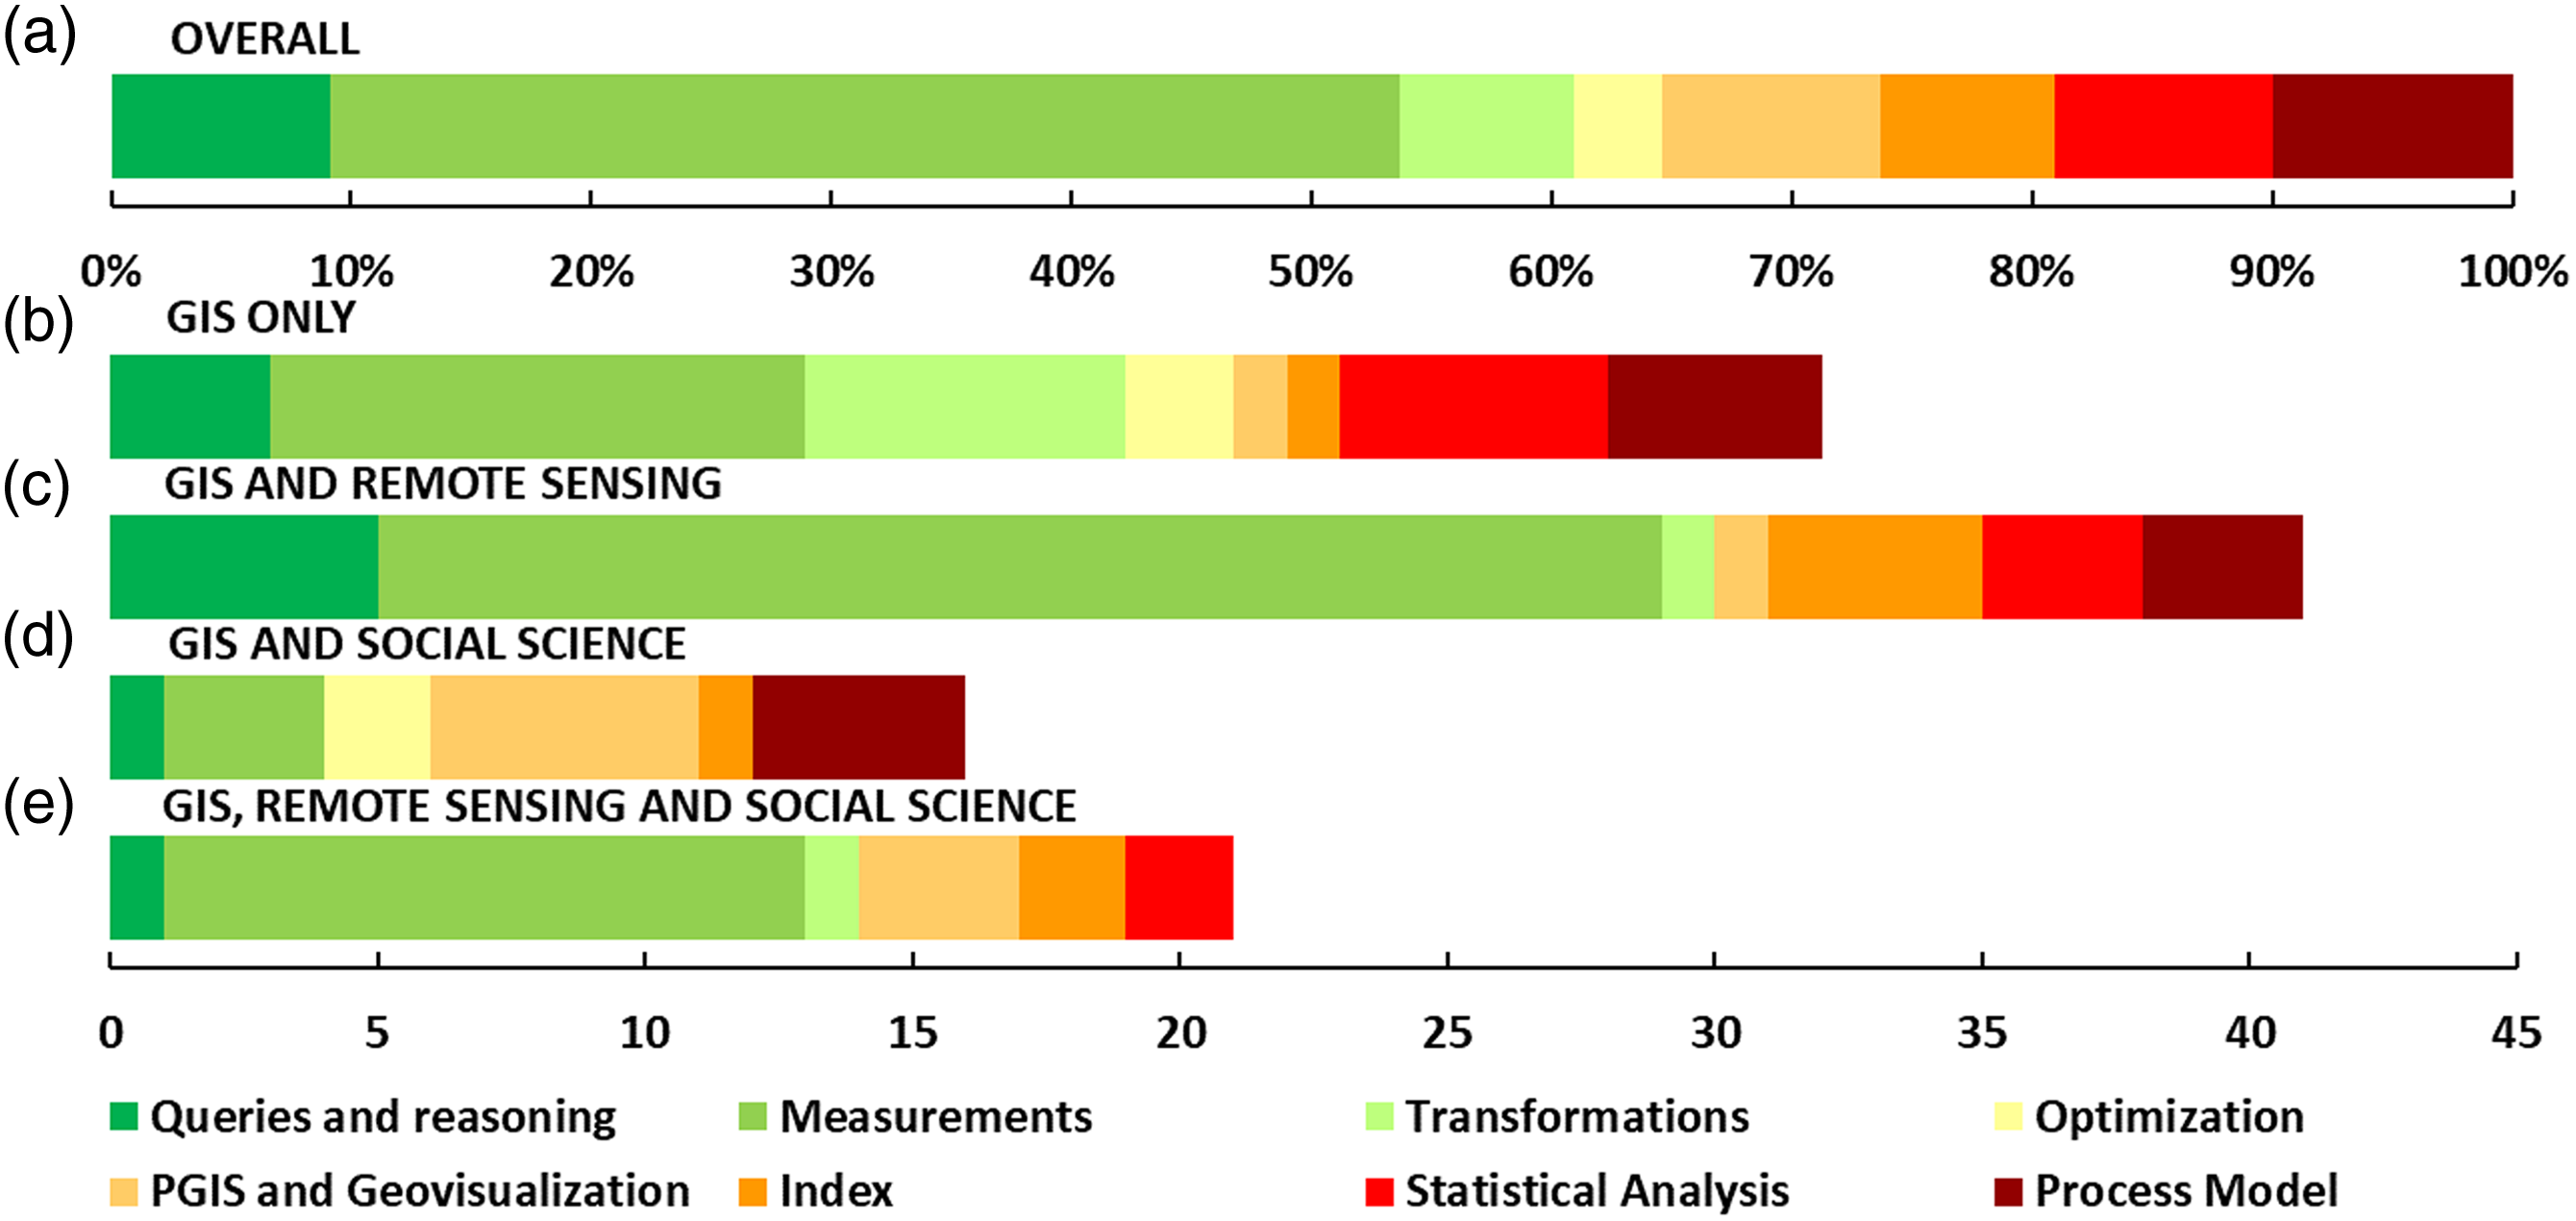
Of the 20 studies using only ‘GIS’ data (Figure 9(b)), the most frequent spatial analyses used were ‘Measurements’, ‘Transformation’ and ‘Statistical Analysis’. Based on the cells highlighted in orange in the outermost circular layer (Figure 6), this category successfully studied all eight Social Framework for Projects categories (Smyth & Vanclay, 2017). It is also clear from Figure 6 that there are GIS data for all eight categories, while spatially referenced social (SRS) data used in this literature category only covered the ‘People’, ‘Community’, ‘Culture’, ‘Livelihoods’ and ‘Housing’ aspect of peoples’ well-being.
Of the 71 papers, 26 combined GIS data and spatial analysis together with remote sensing (Figure 6). A large portion of these studies used ‘Measurements’ (Figure 9(c)). Overall, the integration of remote sensing and GIS analysis managed to spatially capture seven of the eight framework categories as shown by the yellow cells within the second, outermost circle (Figure 6).
Eleven papers (15%) integrated GIS with social science methods (Figure 6). ‘PGIS and Geovisualisation’ and ‘Process Model’ were the most implemented spatial analyses (Figure 9(d)). All five studies that carried out ‘PGIS and Geovisualisation’ spatial analysis used PGIS approaches and citizen science to engage with stakeholders. The green cells in Figure 6 (second innermost circle) demonstrated that this literature category successfully extracted data and produced spatial outputs of indicators related to all framework categories.
Finally, a total of 14 papers (20%) combined spatial analysis with remote sensing and social science methods (Figure 6). ‘Measurements’ were by far the most common spatial analysis used in this group (Figure 9(d)). The second most utilized spatial analysis was ‘PGIS and Geovisualisation’ implemented by three studies. All eight framework categories were captured using this method category as shown in Figure 6’s blue cells within the innermost circle.
Discussion
Overview of current research
The increasing number of studies in the recent decade is linked to the growth in GIS and remote sensing applications in the mining sector (Figure 2 and Figure A 1) (McKenna et al., 2020). Spatially integrated data provide unique information for understanding mining impacts which traditional non-spatial and commonly field-based approaches do not capture. However, certain dimensions of the mining socioeconomic context have received little attention. For example, although impacts occur at all stages of the mine lifecycle (Haslam & Ary Tanimoune, 2016; McKenna et al., 2020), a significant portion of studies were conducted only during the active mine production stage (Figure 3). Coal mining made up a large portion of the literature (Figure 3, Figure 4, Figures 7 and 8). While coal mining has expanded for the past century resulting in massive footprints globally (Lechner et al., 2016; Ma et al., 2021), future demand is predicted to reduce with new commitments being made to phase-out coal (UNFCCC, 2021). This change can be observed in the recent increase in studies on energy transition mineral and metals (ETM) associated with the rise in demand for low-carbon energy technologies (Herrington, 2021; Owen, Kemp, Harris, et al., 2022). Of the coal studies reviewed, only two studies considered the post-mining phase; hence, coal phase-out effects are currently not well captured by the literature (Svobodova et al., 2022).
In terms of the types of socioeconomic and environmental impacts addressed in the studies, there were examples from all eight categories identified by the Social Framework for Projects (Smyth & Vanclay, 2017) (Figure 6, Figures 7 and 8). The ‘Land’ and ‘Livelihoods’ indicators were studied the most (Figure 5), which represent a root causes of community conflict surrounding territorial disputes where the peoples’ livelihoods and/or well-being are threatened or incompatible with mining or unrecognized land ownership and indigenous land rights (Haslam & Ary Tanimoune, 2016; Lechner, Owen, Ang, Edraki, et al., 2019). However, the ‘Culture’, ‘Community’ and ‘People’ indicators were lacking in studies that only used GIS and remote sensing, highlighting the difficulties in extracting and translating intangible properties of people’s well-being into spatial analysis. Fully capturing the social framework is only possible with the integration of GIS, remote sensing and social science approaches. Geospatially integrated social science approaches provide a means and evidence to characterize quantitative impacts spatially an additional dimension useful for capturing mining impacts at various scales and stages of the mine life cycle (Hentschel et al., 2000; Kivinen et al., 2018; Lechner et al., 2019; Li et al., 2014; McIntyre et al., 2016; Rampellini & Veenendaal, 2016; Yiran et al., 2012).
The integration of social science approaches and stakeholder engagement is key to discerning intangible impacts and providing a meaningful context to quantitative spatial evidence (Babidge et al., 2019). The 25 studies that used social science methods, include examples from all eight framework categories (Figures 6 and 7). It is encouraging that all studies in this category attempted to conform with the Free, Prior and Informed Consent (FPIC) concept by engaging with stakeholders as part of their data collection, including ‘Vulnerable’ groups such as elderly, women and children (n = 4) and the ‘Indigenous Community’ (n = 5) (Figure 7 and Figure A 4). The potential of multidisciplinary and integrated approaches was highlighted by these studies, with authors stressing the critical role of stakeholder engagement in validating and complementing mapped environmental observations and impact assessment outputs via inimitable endemic local knowledge (Babidge et al., 2019; Lechner et al., 2019). Stakeholder engagement promotes bottom-up approaches, which are frequently more effective at locating and resolving issues impacting affected communities, and improves understanding of the root causes while preserving the relationship between mining and host communities. (Franks et al., 2010; Pearce et al., 2021; Prno & Slocombe, 2014; Virgone et al., 2018). In addition, the integration of ‘tacit knowledge embodied in life experiences and reproduced in everyday behaviour and speech’ (Babidge et al., 2019), is key to properly incorporating intrinsic and intangible social components, especially in the ‘People’, ‘Community’ and ‘Culture’ categories.
In contrast remote sensing only captured six of eight framework categories (Figures 6 and 8), excluding the ‘People’ and ‘Culture’ categories. This underlines the challenges in incorporating intangible aspects of people’s well-being into spatial analysis in the absence of social science integration. In terms of remote sensing data sources, Landsat imagery is utilized in over half the studies (n = 26) (Figure 8), in part due to its historical data dating to the 1980s, critical for understanding historical drivers of present-day mining challenges (Ang et al., 2020; Kimijima et al., 2021; Lechner, Owen, Ang, Edraki, et al., 2019; Wohlfart et al., 2017). The high-resolution imagery (‘SPOT’, ‘WorldView’ and ‘IKONOS’) used (Figure 8) were critical to capture fine-scale impacts and particularly important for capturing artisanal and small-scale Mining (ASM). For example, high-resolution (<5 m) satellite imagery, Ikonos and WorldView-2 were used by (Ferring & Hausermann, 2019; Hausermann et al., 2018) to map ASM related LULC changes. The majority of the remote sensing studies (n = 37) classified LULC using multispectral classification methods (Figure A 5, Table A 3 and Table A 4) and often for multiple time periods (Figure 8), which are vital for supporting local perspective and providing historical observations of changes at the regional scale (Franks et al., 2010; Krieger et al., 2012).
Geospatially integrated data products were used to comprehensively analyse mining impacts for all eight framework categories (Figure 6). Opportunities for complex analyses, such as hybrid cost–benefit analysis (De Valck et al., 2021) and the multi-dimensional index system (Tao & Wang, 2021), were also enabled via GIS approaches. However, most spatial analysis methods focus on explanatory types of analyses such as queries and reasoning. Additionally, GIS successfully facilitated the spatial visualization of relationships between causes and mining impacts such as the case of conflict and social acceptance mapping (Craynon et al., 2015; Haslam & Ary Tanimoune, 2016; W. Liu & Agusdinata, 2020; Pactwa & Górniak-Zimroz, 2021) while also supporting the consolidation of various socioeconomic and environmental indicators such as with landscape quality assessment (Molina et al., 2016), poverty mapping via socioeconomic outcome indicators (Hentschel et al., 2000; Loayza & Rigolini, 2016; Londono Castaneda et al., 2018) and risk mapping (Chen et al., 2015; Onencan et al., 2018; Risk et al., 2020; Saedpanah & Amanollahi, 2019). Aside from being an effective stakeholder engagement tool, participatory GIS and geovisualization combined allow for the rapid and effective communication of data patterns, useful for assisting decision-making processes to evaluate where, how and why changes have occurred and exactly where to target efforts for mitigation and land use planning.
Challenges and recommendations
GIS provides a unique platform for integrating across datasets, disciplines and methods, particularly remote sensing, GIS analyses and social sciences, supporting the characterization of a range of mining impacts such as those described by the Social Framework (Smyth & Vanclay, 2017). Spatially explicit studies which utilize geographic data can produce location-specific information of socioeconomic variables derived from non-spatial methods such as social surveys to derive spatially referenced social (SRS) data (Lechner et al., 2019), enabling effective site, regional or nationally aggregated analysis (Haslam & Ary Tanimoune, 2016). Not only can GIS support the creation of SRS data, geospatial methods, in particular remote sensing and a plethora of effective indices (Madasa et al., 2021; Orimoloye & Ololade, 2020), can be leveraged to provide a more cost-effective means of acquiring information compared to field work, making them particularly valuable when studying remote regions or when conducting retrospective analyses.
The current literature may represent a bias toward topics which are the most obvious applications for spatial methods such as PGIS, LULC analysis and georeferencing non-spatial social survey data. Future research should focus on integrating spatial-integrated social analysis across the entire mining lifecycle, particularly in stages that have received less attention in the existing literature, notably Exploration Information System (EIS) (Kreuzer et al., 2020; Yousefi et al., 2019; 2021) and mine closure (McKenna et al., 2020; Rich et al., 2015). Other understudied areas include a broader spectrum of resources beyond coal, mapping intangible dimensions of mining such as ‘Culture’, ‘Community’ and ‘People’ indicators, and incorporating different scales of analysis, ranging from specific mining sites to broader contexts such as country-level and global assessments. Moreover, the utilization of remote sensing applications can be expanded to incorporate alternative sensors, such as Sentinel-2, in addition to the commonly employed Landsat sensor, to a wider array of challenging-to-map phenomena, including ASM (Artisanal and Small-scale Mining), and reconcile issues associated with incremental development in the resource footprint. It should also be noted that multi-decadal historical remote sensing data has great potential to uncover historical drivers of mining impacts (Ang et al., 2020; Lechner, Owen, Ang, Edraki, et al., 2019). Future studies should also prioritize accuracy assessment and ensure the production of reliable remote sensing outputs (Rwanga & Ndambuki, 2017) which are fit for use (A Wentz & Shimizu, 2018) as well as explicitly recognize the consequences for error propagation (Lechner et al., 2012). Finally, such approaches can be supported by participatory methods to enhance both the objectives around local decision-making and for the purposes of ground-truthing findings and claims about landscape change. Understanding stakeholder perspectives spatially can be achieved with participatory mapping approaches (Onencan et al., 2018; Pearce et al., 2021; Rich et al., 2015) can be used to crowd source a range social of landscape values (Brown et al., 2015) and also understand how these values vary between different members of the community (Lechner et al., 2020). Crowdsourced social data (Levin et al., 2017) paired with AI techniques represent important potential future research directions for GIS methods.
Moving beyond particular sites and regions, assessing mining consequences on a global scale, albeit in a coarse manner, represents an intriguing future research avenue for advancing the use of remote sensing. Bearing in mind previous research attempts (Liang et al., 2021; Maus et al., 2020; 2022; Werner, Mudd, et al., 2020), there are still no accurate estimates of global mining areas or impact on community lands worldwide, and even the total number of mining locations globally is unknown. This is in part a function of the lack of definition surrounding the term ‘mining footprint’. The development of landcover schematics at site scale highlights the importance of incorporating intersections between the more easily identifiable physical features of a mining complex and the more variable classes of cover, such as villages and agricultural land. These intersections within the mining footprint assist in distinguishing project permit areas (or mining concessions) from areas of impact or influence. Efforts in applying large-scale approaches are frequently hindered by the limited availability of global scale data and sufficient remote sensing tools to automatically process and analyse such massive datasets (Zhu et al., 2017).
To that end, new emerging techniques from computer science, especially based on computer vision, machine and deep learning algorithms can be explored to automate a plethora of geospatial and remote sensing processes and analyses. This has been successfully integrated in other fields such as urban sustainability (Li et al., 2023), and can be applied to the mining context, ranging from building a global remote sensing dataset to automating LULC classification to enhance the mapping of mining footprint. As demonstrated in this review, remote sensing works looking at socioeconomic and environmental mining impacts are mostly limited to using classic remote sensing approaches applied to derive LULC change. Geospatial analysis through sophisticated artificial intelligence (AI) algorithms, particularly those utilizing deep learning and machine learning, have the potential to advance and make substantial contributions to mapping mining landscapes (Camalan et al., 2022; Q. Li et al., 2020; Nava et al., 2022) and for mineral exploration (Kreuzer et al., 2020; Yousefi et al., 2019; 2021). This technological development could potentially result in breakthroughs in our understanding of the magnitude and nature of mining impacts globally. Furthermore, such approaches could be used to continuously monitor dynamic mining landscapes in real time as an independent early warning system.
Conclusion
This review demonstrates the growth in spatial assessment of the socioeconomic mining impacts through the GIS and remote sensing capabilities. This growth is in part fuelled by a greater recognition of the spatial dimensions of mining impacts. However, concerted research efforts are needed to yield the full benefits of GIS and remote sensing, with the goal of a more spatially integrated assessment of socioeconomic mining impacts. Future research should focus on the refinement and evolution of methods for capturing intangible socioeconomic impacts spatially, under-researched commodities and a mine’s lifecycle over time, using advances in GIS and remote sensing technology such as AI. Spatial data integration can enhance inclusive analysis and holistic planning across the life cycle of a mine or mining regions to support a sustainable future.
Supplemental Material
Supplemental Material - Systematic Review of GIS and Remote Sensing Applications for Assessing the Socioeconomic Impacts of Mining
Supplemental Material for Systematic Review of GIS and Remote Sensing Applications for Assessing the Socioeconomic Impacts of Mining by Michelle Li Ern Ang, John R. Owen, Christopher N. Gibbins, Éléonore Lèbre, Deanna Kemp, Muhamad R. U. Saputra, Jo-Anne Everingham, and Alex M. Lechner in The Journal of Environment & Development
Footnotes
Acknowledgments
We wish to acknowledge and thank Cate Heine whose early efforts helped lay the foundation for this project. We are also appreciative of the feedback provided by the anonymous reviewers. This research is supported in part by Google Research Scholar program.
Declaration of Conflicting Interests
The author(s) declared no potential conflicts of interest with respect to the research, authorship, and/or publication of this article.
Funding
The author(s) received no financial support for the research, authorship, and/or publication of this article.
Supplemental Material
Supplemental material for this article is available online.
Notes
Author Biographies
References
Supplementary Material
Please find the following supplemental material available below.
For Open Access articles published under a Creative Commons License, all supplemental material carries the same license as the article it is associated with.
For non-Open Access articles published, all supplemental material carries a non-exclusive license, and permission requests for re-use of supplemental material or any part of supplemental material shall be sent directly to the copyright owner as specified in the copyright notice associated with the article.