
Abstract
This is the first study to examine the fit of Holland’s (1997) RIASEC model of vocational interests within the Finnish cultural context. We conducted secondary analyses of vocational interest data collected over a 20-year period by the Finnish Public Employment Services (PES). The data were extracted from the PES client registry and comprise a nationally representative sample of 20,108 career counselling clients (aged 10–62 years; 62% women), who had completed a RIASEC-based, interest inventory Kiinnostukset [Interests] as part of career counselling offered by psychologists in the Finnish PES. Results from the Randomization Test of Hypothesized Order Relations (RTHOR), Multidimensional Scaling (MDS) and Cosine Function Models (CFM) showed that Finnish vocational interests conform satisfactorily to Holland’s RIASEC circumplex structure in terms of ordinal relationships. Overall, the degree of fit (RTHOR Correspondence Index = .67) was comparable to levels obtained from U.S.-based samples. Differences in model fit by gender or by level of education were not statistically significant. Furthermore, MDS analyses replicated the expected RIASEC circular ordering, although both MDS and CFM results suggest an approximate rather than perfect circumplex fit. Overall, our findings offer support for the continued use of Holland’s RIASEC model in Finnish career counselling and guidance practice.
Introduction
Career decisions made by individuals in terms of career choices have far-reaching consequences both for the individuals themselves and for the societies they live in. Indeed, person-vocation (P-V) fit, i.e., the level of congruence between individuals’ interests, abilities and the characteristics and the requirements of their chosen vocations (Holland, 1997; Vogel & Feldman, 2009) has been demonstrated to predict many important work-related outcomes such as work performance (Nye et al., 2012; Van Iddekinge et al., 2011b) and work satisfaction (Tsabari et al., 2005).
In career counselling and guidance practice, the assessment of individuals’ vocational interests by means of various interest inventories is a common way for career practitioners to help individuals choose careers that fit them well (Hanna & Rounds, 2020). While commonly used interest inventories have been demonstrated to both measure similar basic vocational interests (e.g., construction and music) (Chu et al., 2022) and to accurately predict occupational and educational choices (Hanna & Rounds, 2020), they are not interchangeable (Chu et al., 2022) nor infallible. Considering how important career decisions are to the individual’s life, career practitioners should always ensure that the interest inventories they use show evidence of their reliability and validity in their practice context, so that their use in helping clients can be ethically justified.
For career practitioners working outside the United States, where many popular models and measures of vocational interest have been developed, the question of cultural equivalency (i.e., whether these models accurately describe the structure of vocational interests in other cultural contexts) is also vitally important to consider (Tao et al., 2019). In general, the fit of U.S.-based interest models in other cultures varies highly (Glosenberg et al., 2019; Rounds & Tracey, 1996) and is often not supported (Tao et al., 2019). Thus, where no evidence of equivalency exists, no presumption of such should be made. Therefore, the purpose of this article is to examine the degree of fit of Holland’s (1997) prominent RIASEC model of vocational interests in the cultural context of Finland, where no previously published research exists to either support or discourage its use - and consequently the use of the Finnish RIASEC-based interest inventory Kiinnostukset [Interests]. In a broader sense, we also aim to add to the body of cross-cultural research on the structure of vocational interests, where few studies exist examining the fit of the RIASEC model in the Nordic countries (with the exception of Iceland, see Einarsdóttir et al., 2002).
Holland’s RIASEC Model of Vocational Interests
Vocational interests can be defined as “trait-like preferences to engage in activities, contexts in which activities occur, or outcomes associated with preferred activities that motivate goal-oriented behaviors” (Rounds & Su, 2014). From a developmental perspective, vocational interests become relatively stable during early adolescence (around the ages of 13 to 14), with their stability increasing considerably after the age of 18 and generally enduring for most people over several decades (Hoff et al., 2018; Low et al., 2005; Rottinghaus et al., 2007). Both birth year and age are minimally related to vocational interests, suggesting that differences in interests across age groups are negligible (Leuty & Hansen, 2014). The common practice of using an individual’s current vocational interest profile as a basis for long-term educational and career planning can therefore be generally supported (Rottinghaus et al., 2007).
While several theories of vocational interests have been presented, the most widely used model is Holland’s (1997) RIASEC model (Hanna et al., 2024), which has been used to organize interest types in vocational interest inventories since the 1970s (Chu et al., 2022). Holland’s (1997) RIASEC model sets forth several key assumptions about the nature and consequences of vocational interests. First, that there are six distinct vocational interest types (
Furthermore, a key assumption of Holland’s (1997) model (known as the “calculus hypothesis”) is that these six vocational interest types can be arranged in a hexagonal structure based on their relative similarity, in which interest types adjacent to each other (such as Realistic and Investigative) share a higher degree of similarity than interest types alternate (e.g., Realistic and Artistic) or opposite (e.g., Realistic and Social) to each other. Indeed, the hexagonal structure of the six types is one of the best replicated findings in all of vocational psychology (Rounds, 1995). Hence Holland’s (1997) RIASEC model is sometimes also called the hexagonal, circular or circumplex model of vocational interests. A brief description of the interest types and the theoretical relationships between them is presented in Figure 1. RIASEC interest types and their relative hexagonal arrangement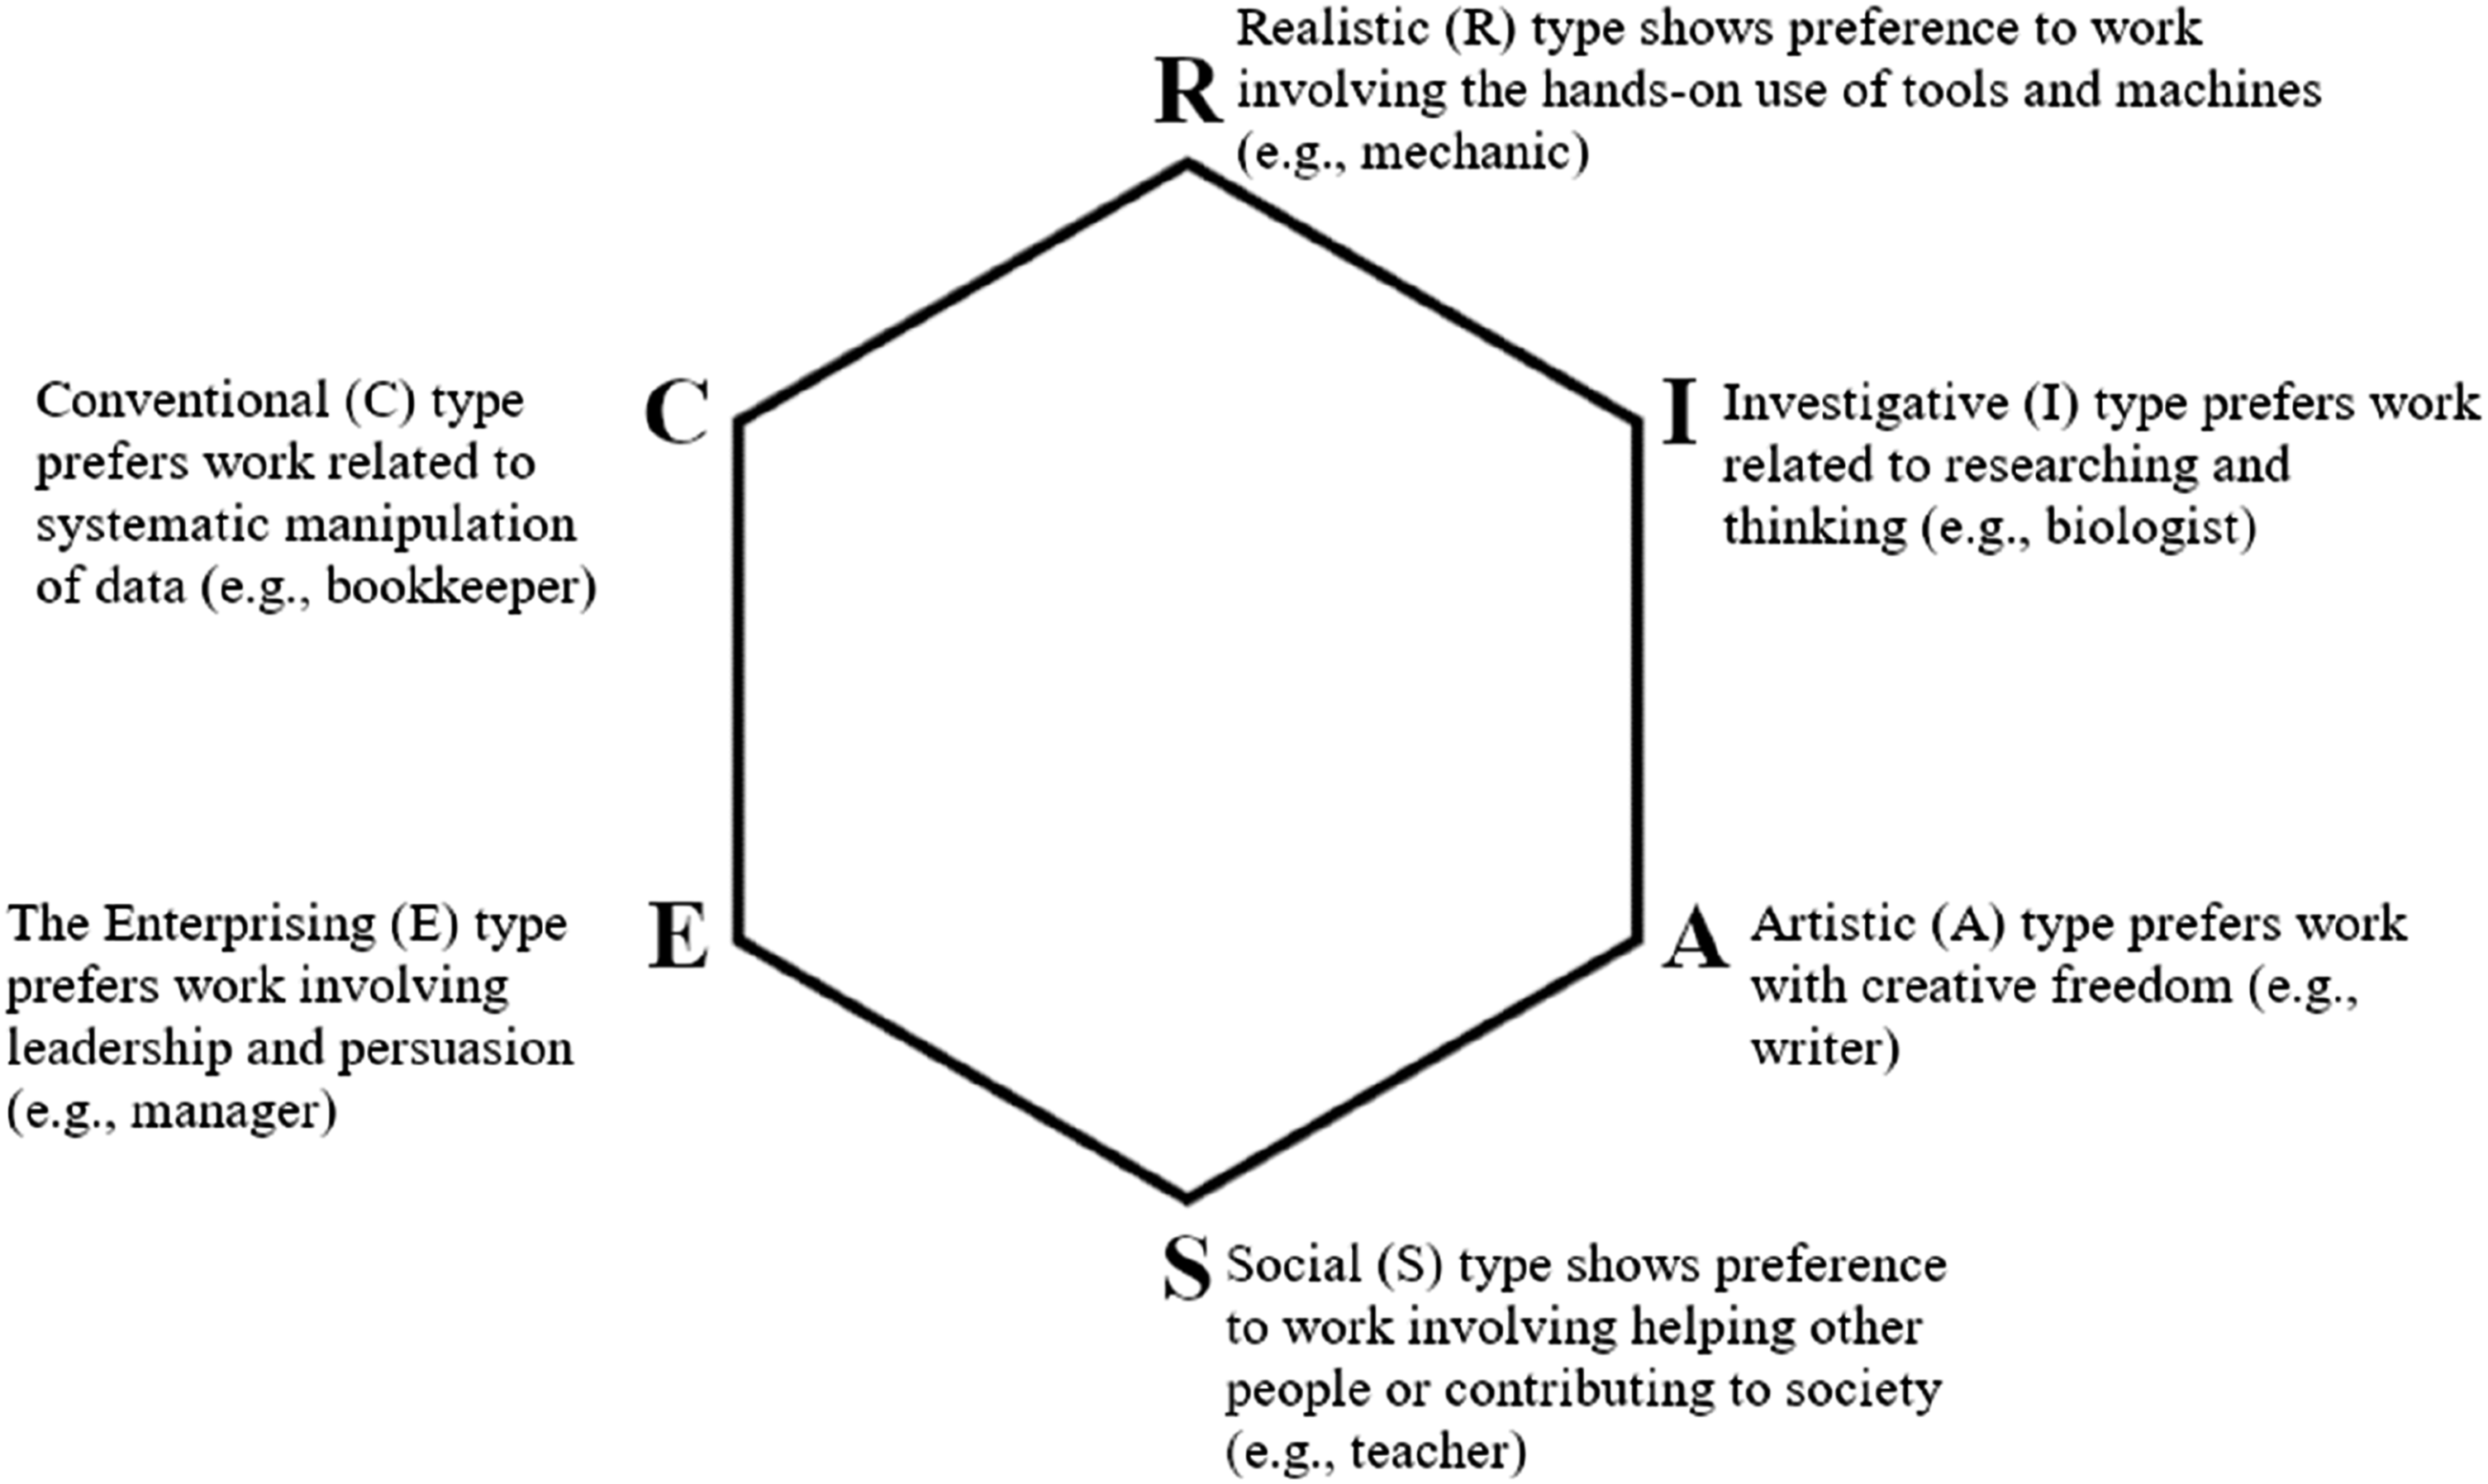
According to Holland (1997), people seek out environments which match the patterns of their interests, allowing them to e.g., utilize their skills and abilities, embody their values and take on agreeable roles. Both positive and negatives outcomes can thus be predicted based on the degree of fit between the individual and the environment (see e.g., Nye et al., 2012; Tsabari et al., 2005; Van Iddekinge et al., 2011b). This is known as the “congruency hypothesis”. Indeed, vocational interests have been shown to have incremental validity over both cognitive ability and personality traits in predicting job performance (Van Iddekinge et al., 2011a) and career success (Rounds & Su, 2014; Stoll et al., 2016). This makes the assessment of vocational interests an appealing practice in career counselling, provided that the theoretical model used in conceptualizing interests captures the structure of vocational interests in the local population. Within the United States, past research has demonstrated that Holland’s hexagonal model adequately represents the interest structure of men and women in racially and ethnically diverse samples (Day et al., 1998; Fouad & Mohler, 2004; Morris, 2016), however, certain enduring gender differences are often observed, which we briefly describe next.
Gender and Cultural Differences in Vocational Interests
Several large-scale studies have investigated gender differences in vocational interests (Baerg MacDonald et al., 2023; Morris, 2016; Su et al., 2009; Tao et al., 2022). As a general trend, men tend to show higher levels of Realistic and Investigative interests, while women tend to have stronger Artistic and Social interests, with results being more mixed for the Enterprising and Conventional domains. Gender differences in vocational interests are at their apex in adolescence and decrease in adulthood (Hoff et al., 2018). Furthermore, Morris (2016) demonstrated that these gender differences have been stable over the past 80 years. However, while the overall pattern of gender differences in vocational interests is rather robust, results from cross-cultural research also suggest that cultural factors such as country-level gender equality (Du et al., 2025) and cultural dimensions such as power distance, individualism, motivation toward achievement and success and uncertainty avoidance (Hofstede & McCrae, 2004) may affect the magnitude gender differences in vocational interests. For example, Tao et al. (2022) demonstrated moderating effects, beyond the effect of country-level gender inequality, between the cultural dimensions of uncertainty avoidance, indulgence and power distance and the size of gender differences, with higher uncertainty avoidance, higher indulgence and lower power distance contributing to larger differences.
In the Nordic context, Icelandic studies (Einarsdóttir & Rounds, 2020; Hoff et al., 2020) focusing on gender differences in vocational interests followed the commonly observed pattern of gender differences: women exhibited higher Social and Artistic interests while men showed higher Realistic and Investigative interests. However, while Iceland and Finland are both Nordic countries, research has found that in terms of Hofstede’s (2001) cultural dimensions, Iceland is more culturally similar to countries such as the United States, Canada and United Kingdom than Denmark, Sweden and Norway (Guðmundsdóttir et al., 2015) particularly due to comparatively higher levels of cultural individualism. Finland, in turn, also differs from the other Nordic countries by sharing more cultural similarities with the Netherlands and Ireland in terms of lower levels individualism and higher levels of uncertainty avoidance that the other Nordic countries (Guðmundsdóttir et al., 2015). Thus, while the Nordic countries share some cultural similarities, e.g., in terms of low power distance (Guðmundsdóttir et al., 2015) and generally egalitarian societies, it would be important to not uncritically use results from Icelandic studies as a stand-in for all other Nordic countries. While we do not expect Finland to dramatically differ from the overall pattern of gender differences in vocational interests established in the current literature, these cultural differences may affect their magnitude (Tao et al., 2022) – provided, of course, that the RIASEC model is appropriate to use in Finland.
As a general rule, the local cultural context should be taken into account in career practice. In spite of this, it is all too common for measures developed and based in one culture (chiefly the United States) to be used in other cultures with a tacit assumption of equally valid administration (Tao et al., 2019). However, as previously mentioned, this equivalency should not be taken for granted. We next turn to the issue of cultural equivalency of the structure of vocational interests.
The Fit of Holland’s (1997) RIASEC Model Outside the U.S.
Famously, in the meta-analysis by Rounds and Tracey (1996) the cross-cultural equivalence of Holland’s (1997) circular model was generally not supported, with only Iceland, Japan and Israel demonstrating an acceptable level of fit to the RIASEC model (notably with Iceland showing superior fit to the U.S. benchmark). More recently Glosenberg et al. (2019) studied the comparative fit of various vocational interest models (including the RIASEC model) and demonstrated varying levels of fit between countries, with higher country-level economic development being associated with better fit. Based on their results, they also cautioned against assuming generalizability of the model without supportive evidence and called for additional research on the cross-cultural validity of vocational interest models (Glosenberg et al., 2019).
This lack of supporting evidence is also an issue in the Nordic countries (i.e., Denmark, Finland, Iceland, Norway and Sweden), where the validity of the RIASEC model has only been formally studied (and supported) in Iceland (Einarsdóttir et al., 2002). In spite of this, Finland, Sweden and Norway have all offered publicly available RIASEC-based online interest assessments as part of their public employment services (Einarsdóttir et al., 2020). For example, in Finland the online vocational choice test AVO Ammatinvalintaohjelma [AVO Vocational Choice Program] (KEHA-keskus (n.d.)) and its associated interest inventory Kiinnostukset [Interests] served the general public for over 26 years, but somewhat shockingly no published reports exist regarding its reliability or validity (Harry Pulliainen, personal communication, March 13, 2025). Indeed, no formal and current published scientific evidence in support of or against the use of Holland’s RIASEC model appears to exist in Finland, Sweden, Norway or Denmark, except for the data provided by Glosenberg et al. (2019) showing some initial evidence of acceptable fit levels in these countries. However, while welcome, such data is not enough to draw any final conclusions. As Glosenberg et al. (2019) point out, they administered their interest inventory in English to participants recruited from an English-language website, thus their sample is likely to consist of English-speaking residents of countries where English is not necessarily a common first language. Consequently, they conclude their results are likely to be meaningfully different from the results that may be gained from testing locals in their first language. Furthermore, Einarsdóttir et al. (2020) note that despite its fit, Holland’s RIASEC model only partially describes the Icelandic vocational interest structure, the full dimensions of which are better captured by indigenously developed emic interest inventories and models (including basic vocational interests such as fishing, humanities and public administration, see Einarsdóttir & Rounds, 2013) and that this may also be the case in other Nordic countries. They conclude that it is necessary for the other Nordic countries to critically evaluate such theories and to empirically test instruments that accompany them. Based on the above considerations we believe that research on the fit of Holland’s RIASEC model in Finland’s cultural context is not only warranted, but long overdue.
Validating Holland’s (1997) RIASEC Model – Factorial and Spatial Approaches
The basic task of studying the (cross-cultural) validity of Holland’s (1997) RIASEC model is to establish if and how well a particular dataset conforms to what is predicted by the RIASEC model. Two forms of structural hypotheses have been proposed: the circular order model and the circumplex model (also known as the hexagonal model) (Rounds et al., 1992). According to the circular order model, which derives from Holland’s “calculus hypothesis”, it is expected that the magnitude of correlations between adjacent (e.g., R and I), alternate (e.g., R and A) and opposite (R and S) pairs of RIASEC types varies systematically based on the theoretical closeness of the types (with correlations being higher the more closely related the two types are, see Figure 1). As a consequence, any statistical test assessing the fit of the calculus hypothesis simultaneously tests whether or not the six types are correctly ordered in a circular fashion according to the RIASEC model (i.e., R-I-A-S-E-C) (Rounds et al., 1992). While spatial analysis techniques such Multidimension Scaling (Jaworska & Chupetlovska-Anastasova, 2009; Mugavin, 2008) can be used to create a spatial representation of the RIASEC circumplex for visual examination, Rounds and Tracey (1996) have argued that a method that explicitly evaluates Holland’s calculus hypothesis is to compare the predicted order relations with the actual magnitude of the correlations (i.e., correlation matrices) among the types using methods such as the Randomization Test of Hypothesized Order Relations (Hubert & Arabie, 1987). To this day, this remains one of the key methods of assessing the fit of the RIASEC model.
The circumplex (or hexagonal) model, in turn, is a more restrictive form of the circular order model, with the added assumption that the six interest types form a circle with equidistant points around the circumplex (thus also forming a hexagon within the circle). The circumplex model therefore adds the expectations that the interpoint distances between interest types are equal – and thus adjacent, alternate and opposite variables around the circle are all equally correlated, with the magnitude of correlations following Holland’s (1997) calculus hypothesis (Guttman, 1954; Rounds et al., 1992). This kind of strict circumplex fit can be studied using Cosine Function Models (a form of Confirmatory Factor Analysis), which test whether the correlations in the data follow the expected cosine function (i.e., that similarity between types depends on their angular distance in a perfect circumplex) (Nagy et al., 2009).
A great deal of RIASEC validation work has thus been based on the spatial model, which views the six interest types as occupying positions in a two-dimensional circumplex structure, with similarity represented as geometric proximity. Indeed, the more traditional factorial model, where vocational interests are treated as six correlated latent dimensions, appears to be less commonly used. Su et al. (2019) note that traditional confirmatory factor analysis (CFA) of vocational interests have generally yielded poor results (Warlick et al., 2018), which Su and colleagues (2019) suggest is due to the inherent complexity of broad-band interests dimensions combined with the restrictive assumptions of CFA that each latent factor must be highly unidimensional, while secondary loadings in interest domains are common. Consequently, Su et al. (2019) recommend the use of Exploratory Structural Equation Modeling (ESEM), which integrates both confirmatory and exploratory approaches, allowing for the specifying of underlying factor structures while simultaneously allowing secondary loadings to be freely estimated when investigating complex dimensional structures.
The Present Study
The overall goal of the present study was to empirically examine the structure of vocational interests in Finland and its correspondence with Holland’s (1997) RIASEC model of vocational interests. In practical terms, this meant our first goal was to evaluate the psychometric properties of the Finnish computer-based vocational interest inventory Kiinnostukset using confirmatory factor analysis and exploratory structural equation modelling to establish its reliability and validity as a RIASEC interest measure for both research and counselling purposes.
Our second goal was to study the fit of Holland’s RIASEC model of vocational interests in the Finnish cultural context based on response data from the aforementioned Kiinnostukset interest inventory. Specifically, we used a variety of sophisticated statistical methods (i.e., the randomization test of hypothesized order relations (RTHOR), multidimensional scaling (MDS) and cosine function models (CFM)) to analyze response data from a nationally representative sample (n = 20,108) of people (aged between 10 and 62, 64% women) who had sought career counselling at the Finnish Public Employment Services (PES) between August 2002 and May 2022. We hypothesized that the RIASEC model would fit the data, as was the case in Iceland, since these two Nordic countries share many cultural similarities and prior research including some Finnish-respondents has shown promising results in this regard (Glosenberg et al., 2019).
In sum, our study thus aims to establish the reliability and validity of the use of Holland’s (1997) RIASEC model to both measure and theoretically conceptualize vocational interests in Finland, both for the benefit of Finnish career counselling and guidance practice and to add a previously missing Finnish perspective to the body of literature assessing the cross-cultural fit of Holland’s (1997) RIASEC model in the Nordic countries.
Method
Participants
Our sample consisted of data from 20,108 Finnish-speaking career counselling clients who had completed a bespoke, computer-based Finnish vocational interest inventory Kiinnostukset
The gender distribution of the clients in the data was 12,817 women (64%), 7290 men (36%) and one client with missing gender data. The reported age range of the clients was 10 to 62 years (M = 29.28, Mdn = 26.00, Mode = 19.00, SD = 10.90). In terms of age groups, 3.3% of the sample was aged 15 years or below, 18.4% was aged 16–19 years, 22.6% was aged 20–24 years, 25.1% was aged 25–34 years, 18.2% was aged 35–44 years, 11.1% was aged 45–54 years, and 1.2% was aged 55 years or above.
The clients’ levels of vocational or professional education (i.e., education excluding basic education and general upper secondary education) was reported as follows: 9600 clients (45%) had no vocational or professional education, 8332 (39%) had a vocational upper secondary qualification or equivalent (European Qualifications Framework (EQF) level 4 or 5), 2121 (10%) had a post-secondary education (a now defunct level of education previously offered in Finland) or university of applied sciences degree (EQF level 6) and 1141 (5%) had any level of university degree (EQF level 6, 7 or 8). Finally, the education data for 188 clients (1%) were missing.
Distribution of Study Sample by Administrative Region and Gender With Comparisons to the General Finnish-Speaking Population*
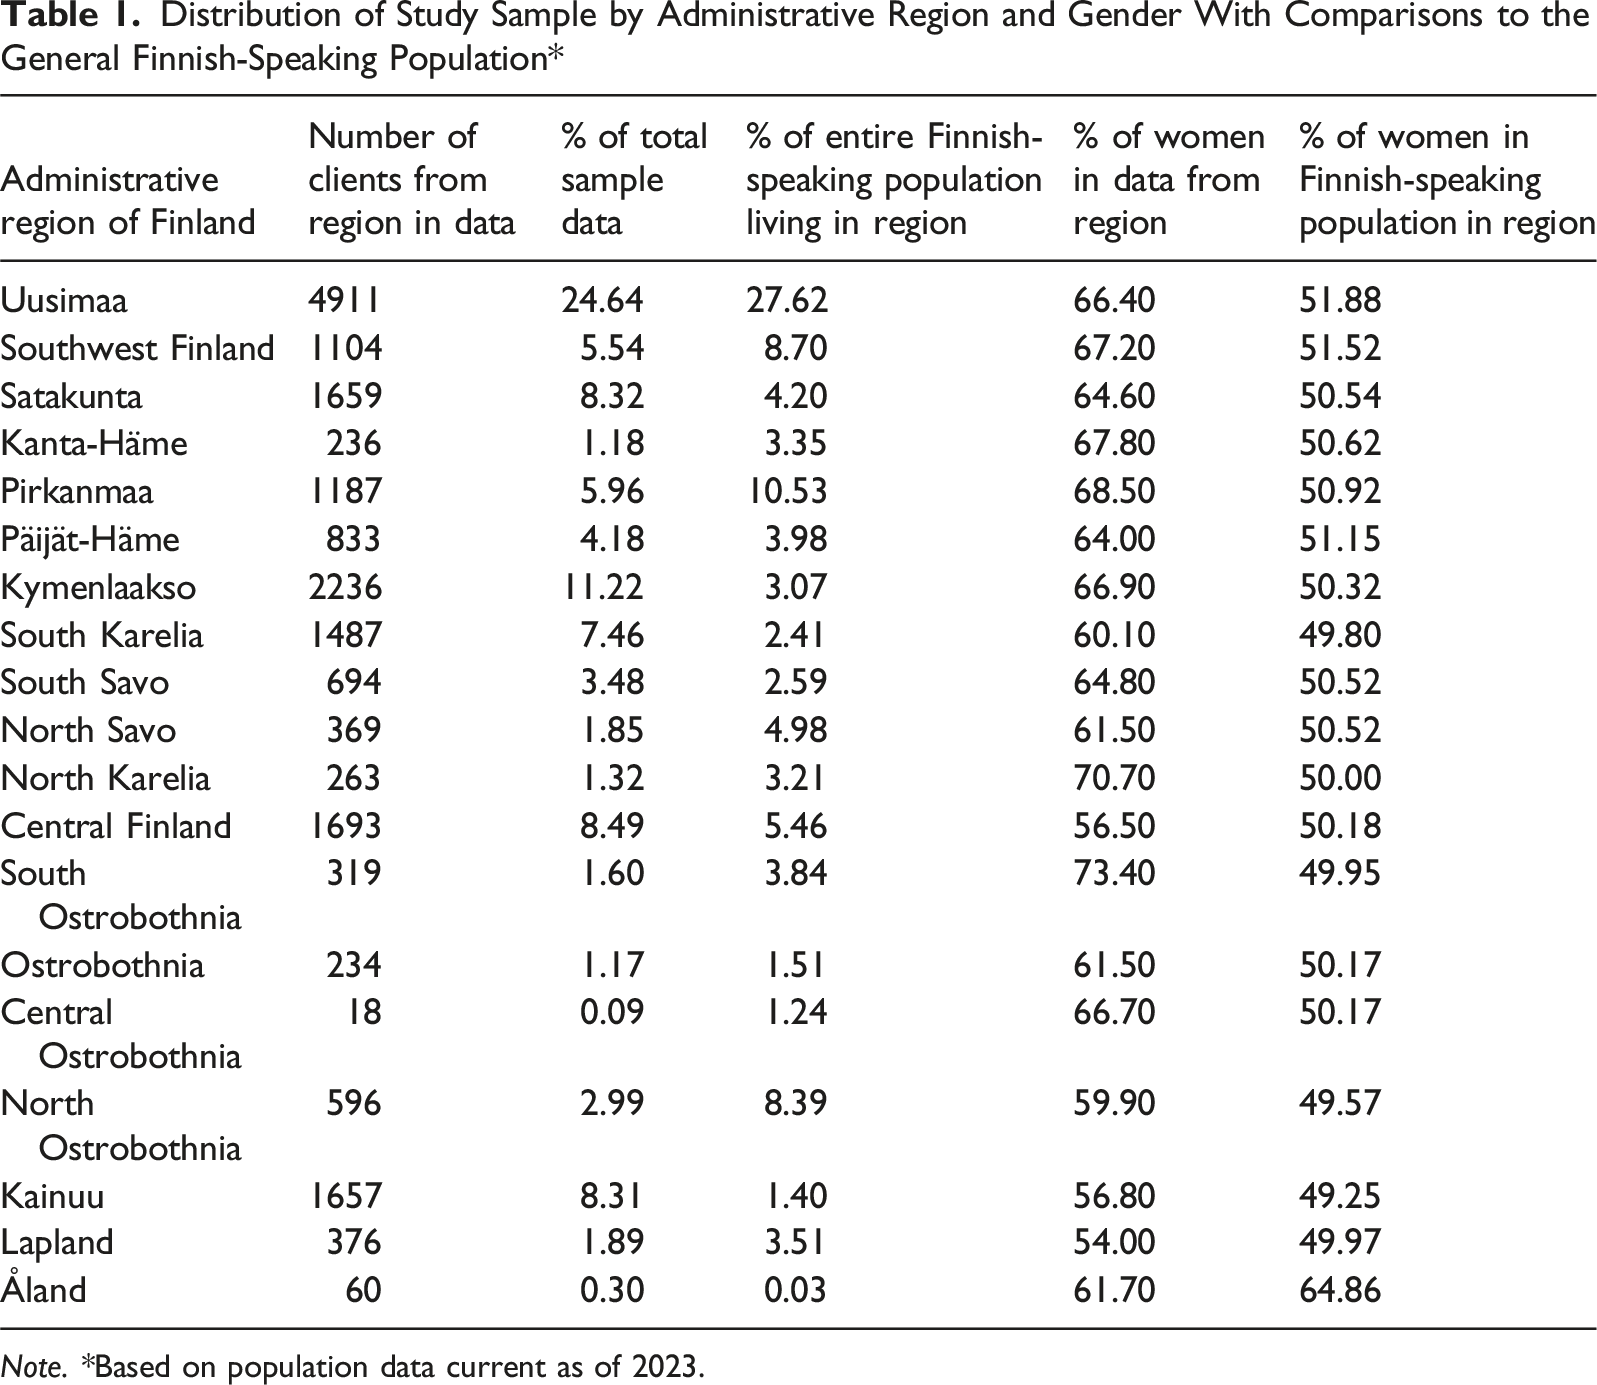
Note. *Based on population data current as of 2023.
Notably, the roughly 2:1 ratio of women to men in our sample is consistently higher than the ratio in the general population of each region, which may reflect, e.g., a difference in the rates of independently seeking or being offered (and subsequently agreeing to participate in) career counselling services offered by the Public Employment Services.
Furthermore, we note that although the geographic distribution of our sample is statistically different from the distribution of the Finnish-speaking population (χ2(18, N = 4 777 408) = 17,584.1, p < .001, Cramér’s V = 0.06), the effect size is below the conventional threshold for a small effect size (V = 0.10), suggesting minimal practical difference between the two distributions. We conclude that because our data sample is large, regionally diverse and collected as part of genuine career counselling processes, it is particularly well-suited to the task of assessing the structure of vocational interests in Finland.
Procedure
The data for this study were obtained from the Finnish Development and Administration Centre for ELY Centres and TE Offices (KEHA Centre), which is the competent authority for granting access to the Finnish PES registry data for research purposes. In Finland, neither legislation nor the guidelines of The Finnish National Board on Research Integrity (TENK) require ethical review by an ethics committee for research based purely on registry and documentary data or archive data, unless there are data security risks associated with data that is combined from several sources. Furthermore, according to Finnish legislation the requirement for informed consent is not required in case of registry-based research. In order to manage possible data security risks, we drafted and submitted a Data Management Plan to the KEHA Centre and minimized the amount of demographic data requested in our research permit application to include only basic de-identified data necessary to appropriately describe the data sample. The research permit was approved by the KEHA Centre on 28th of July 2022 and a copy of the data was securely transferred over to the principal researcher for analysis.
Measures
The premier Finnish vocational interest inventory, Kiinnostukset [Interests], is a computer-based interest inventory originally developed by the Finnish Ministry of Labor based on Holland’s (1997) RIASEC model. The test is freely available online as part of the public vocational choice program AVO Ammatinvalintaohjelma [AVO Vocational Choice Program] (KEHA-keskus (n.d.)). It consists of 72 items assessing levels of interest in various vocational activities or qualities (e.g., “Would you be interested in editing photos?”) on a 4-point Likert scale (1 = Not at all interested, 4 = Very much interested). The sum scores from six sets of 12 items each form the six main interest scales based on the RIASEC model (Realistic, Investigative, Artistic, Social, Enterprising and Conventional).
Data Analysis
We used various complementary statistical methods and software tools to study the fit of Holland’s (1997) RIASEC model to our data. Basic descriptive statistics were obtained using IBM SPSS Statistics (IBM SPSS Statistics for Windows Version 28, 2020). Possible gender differences in vocational interests were analyzed using a one-way multivariate analysis of variance (MANOVA) using gender as the independent variable and the six RIASEC scales as dependent variables.
In order to examine the structural validity of the Kiinnostukset interest inventory, we ran both Confirmatory Factor Analysis (CFA) and Exploratory Structural Equation Modeling (ESEM) using the Mplus statistical software (Muthén & Muthén, 1998-2017). Su et al. (2019) reviewed past literature and noted that in vocational interest research exploratory methods are more common than using CFA, the latter of which has generally yielded poor model fit results. However, similar poor results have also been demonstrated when running CFAs on several widely used personality inventories (Hopwood & Donnellan, 2010). Su et al. (2019) suggest that this may be partially explained due to the inherent complexity of interest and personality dimensions and by the restrictive assumptions of CFA requiring high levels of unidimensionality for each latent factor. Consequently, Su et al. (2019) recommend the use of ESEM, as it integrates both confirmatory and exploratory approaches, allowing for the specifying of underlying factor structures while simultaneously allowing secondary loadings to be freely estimated. We thus performed both CFA and ESEM, using the following fit indices and values for acceptable model fit: the root mean square error of approximation (RMSEA) (≤.08), the Comparative Fit Index (CFI) (
For assessing the fit of Holland’s (1997) RIASEC model to our data, our first method of analysis was the Randomization Test of Hypothesized Order Relations (RTHOR) (Hubert & Arabie, 1987), computed in R Statistical Software (version 4.4.2) (R Core Team, 2025) using the RANDALL and RANDDIF programs developed by Tracey (1997). The RTHOR is a confirmatory analysis of a hypothesized pattern of order relations of any (dis)similarity matrix (e.g., a correlation matrix) (Tracey, 1997) and has long been used to study the fit of interest data to the RIASEC and other models of vocational interests. The RTHOR yields a correspondence index (CI) ranging from −1 to 1, with a CI value of 1 indicating perfect fit and a value of −1 indicating perfect misfit to the model defined in the analysis. Furthermore, the RTHOR produces a p-value as the probability of obtaining the CI value under the null hypothesis of random ordering – in other words, a p-value below .05 is seen as evidence that the correlation matrix is consistent with the circular model defined in the analysis (Hubert & Arabie, 1987). In our case, we are interested in our data’s fit to Holland’s circular order hypothesis (i.e., the correlations between adjacent interest types (e.g., R and I) are expected to be stronger than the correlations between alternate interest types (e.g., R and A), and the correlations of alternate types are expected to be stronger than the correlations between the opposite types (e.g., R and S), see also Figure 1) (Deng et al., 2007) - in other words verifying whether the data conforms to the circumplex structure in terms of ordinal relationships. A benchmark value of .70 with a lower bound 99% confidence interval of .66 demonstrates a degree of fit similar to those obtained in US-based samples (Rounds & Tracey, 1996).
While the RTHOR offers information about the general degree of circumplex fit, it does not help easily visualize the degree of potential (mis)fit. Therefore, the second statistical method we used to study was ordinal (i.e., non-metric) multidimensional scaling (MDS) using the R package smacof (Mair et al., 2022). MDS is an exploratory data analysis technique that can be used to condense large amounts of data into a relatively simple spatial map that relays important relationships in the data (Mugavin, 2008; for a more detailed review of the MDS procedure see Jaworska & Chupetlovska-Anastasova, 2009). Two diagnostic fit indexes can be used to assess the quality of the MDS model: Stress and Variance Accounted For (VAF), the latter of which is expressed as the R2 coefficient. Stress values indicate the model’s goodness-of-fit and range from 0 to 1, with values equal or below .10 considered excellent and values from .15 and up unacceptable (Kruskal & Wish, 1978). In turn, the minimum acceptable R2 coefficient is .6 (Meyer et al., 1992), with values closer to 1 indicating better fit. In the present study, we are particularly interested in using the visuospatial map for evaluating Holland’s hypothesis that the six interest types are ordered in a circular manner and in the expected order of R-I-A-S-E-C (see Figure 1 before).
While MDS helps visualize the ordering of types, importantly, it does not explicitly enforce or test for a circular structure in the data. Therefore, for our final analysis we utilized a cosine function model (CFM; Nagy et al., 2009), a special case of Browne’s circular stochastic process with a Fourier series (CSPF; Browne, 1992) using a combination of the R package holland (Hartmann et al., 2021) and Mplus version 8.6 (Muthén & Muthén, 1998-2018). The CFM is a form on Confirmatory Factor Analysis (CFA) (Nagy et al., 2009) that can be used to evaluate the fit of data to various circumplex models (such as Holland’s (1997) RIASEC hexagon) by testing whether the correlations in the data follow the expected cosine function (i.e., that similarity between types depends on their angular distance in a perfect circumplex). Model fit was evaluated using the χ2 statistic, the root mean error of approximation (RMSEA; Browne & Cudeck, 1992), the Comparative Fit Index (CFI; Bentler, 1990) and the standardized root mean square residual (SRMR; Jöreskog & Sörbom, 1993). Acceptable fit for the aforementioned indicators are values ≤.08 for RMSEA and SRMR (Browne & Cudeck, 1992; Hu & Bentler, 1999) and values ≥.90 for CFI (Bentler, 1990; Brown, 2006).
Results
Descriptive Statistics and Reliabilities
Means and Standard Deviations of the RIASEC Scale Scores by Gender
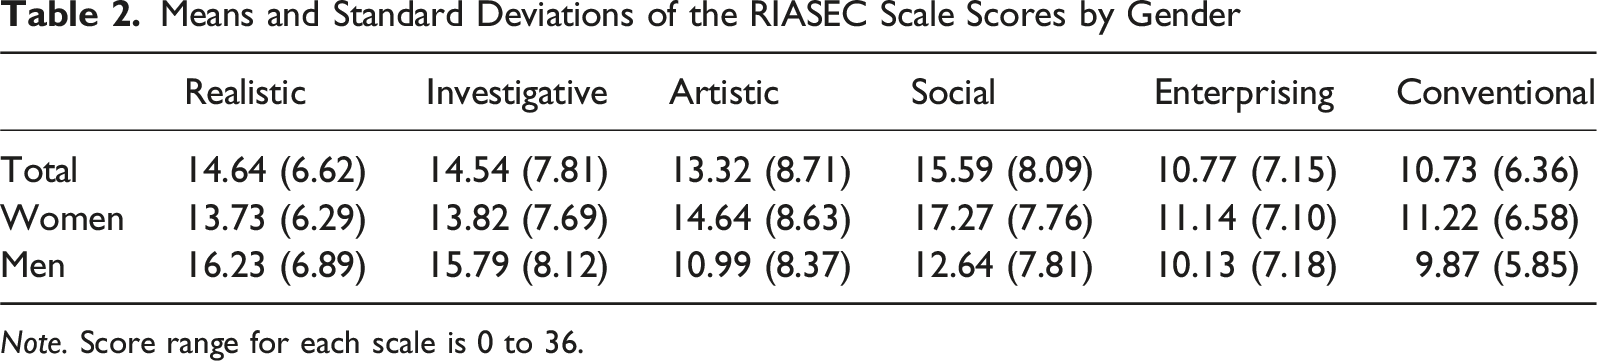
Note. Score range for each scale is 0 to 36.
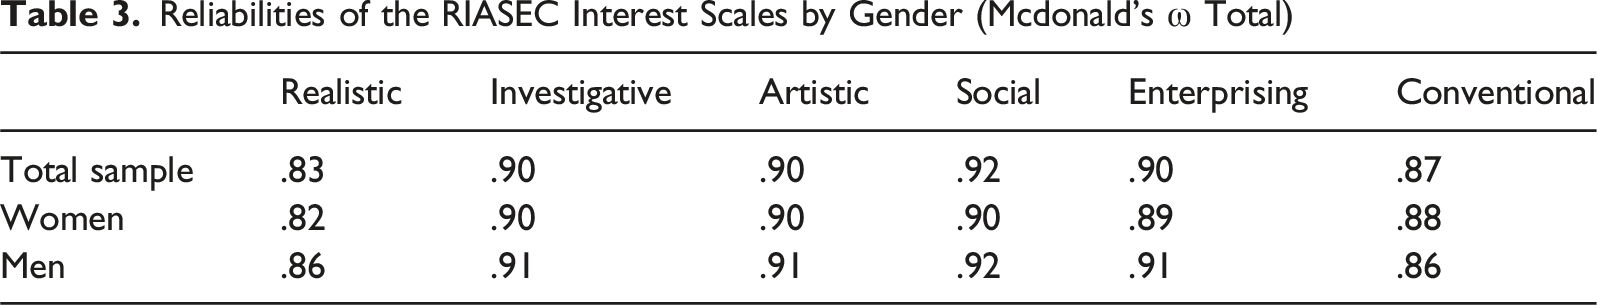
Reliabilities of the RIASEC Interest Scales by Gender (Mcdonald’s ω Total)
Correlations Between RIASEC Scale Scores
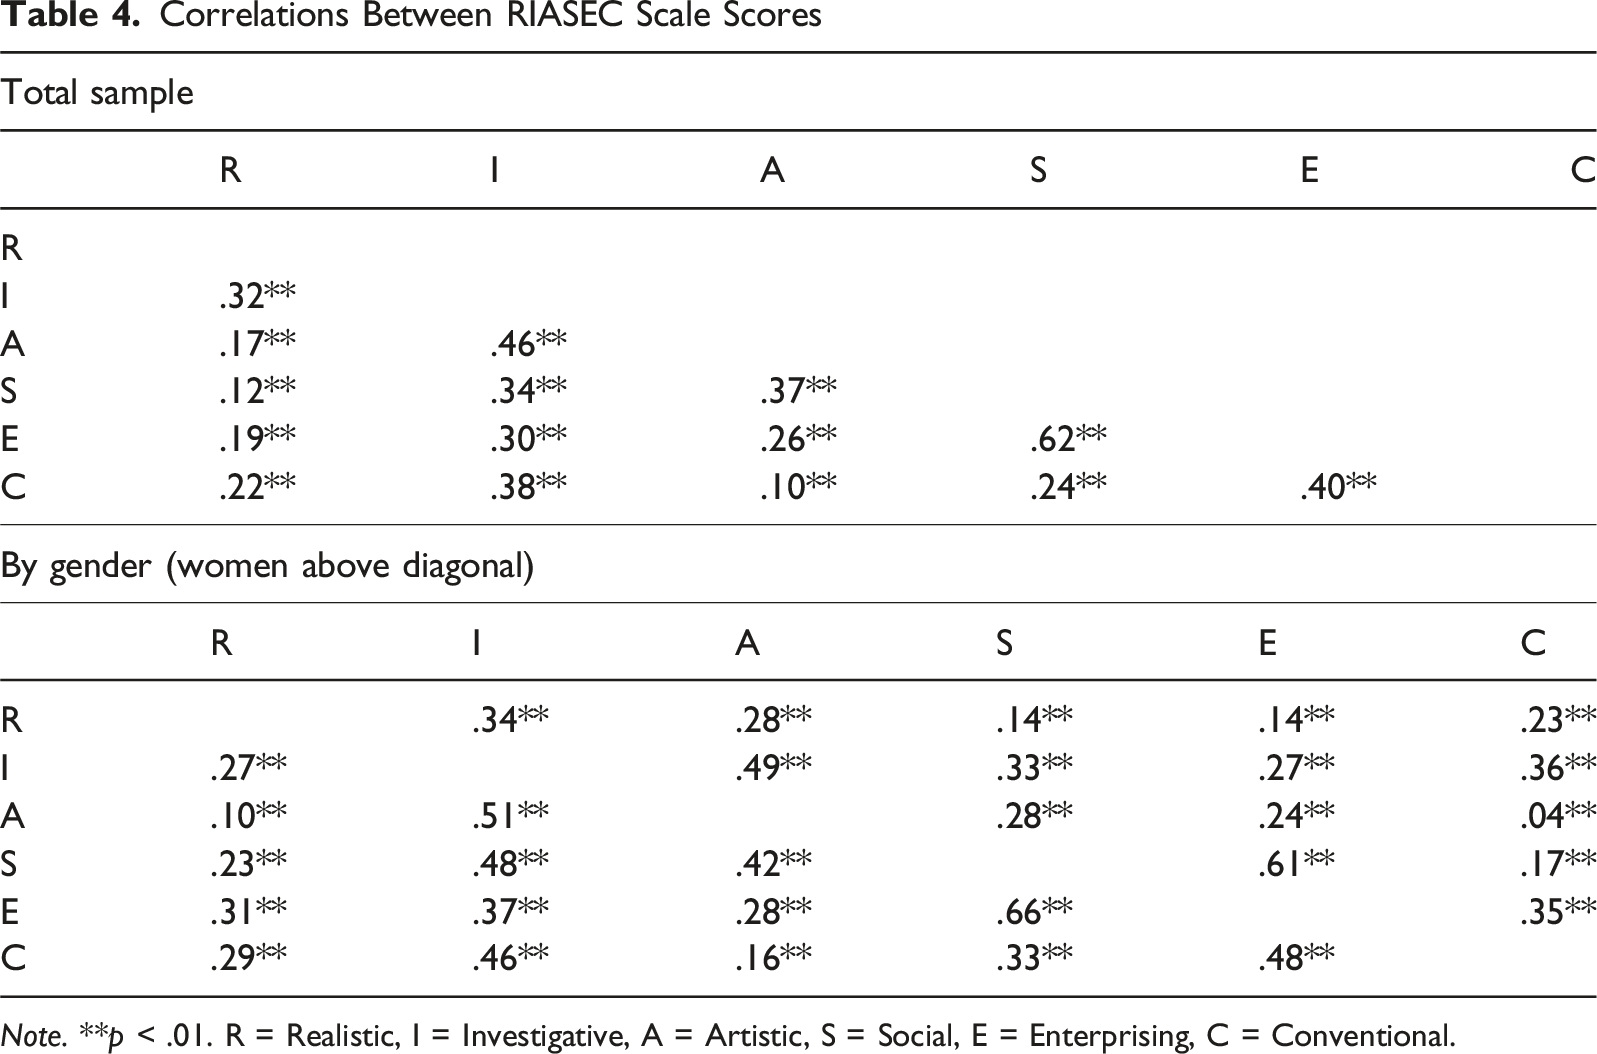
Note. **p < .01. R = Realistic, I = Investigative, A = Artistic, S = Social, E = Enterprising, C = Conventional.
The multivariate effect of gender on the RIASEC scale scores was significant (Wilks’ L = .756, F (6, 20,100) = 1080.18, p < .001, η2 = .244), indicating that approximately 25% of the overall variability in vocational interest scores could be attributed to gender. Univariate ANOVAs found significant gender differences across all RIASEC scales: In general, men scored higher on the Realistic (F (1, 20,105) = 684.35, p < .001, η2 = .033) and Investigative scales (F (1, 20,105) = 292.99, p < .001, η2 = .014) while women scored higher in the Artistic (F (1, 20,105) = 851.57, p < .001, η2 = .041), Social (F (1, 20,105) = 1648.63, p < .001, η2 = .076), Enterprising (F (1, 20,105) = 93.99, p < .001, η2 = .005) and Conventional scales (F (1, 20,105) = 210.88, p < .001, η2 = .010). To facilitate comparisons of effect sizes with Su et al. (2009), the partial η2 values were converted to approximate Cohen’s d values. The effect sizes ranged from moderate in the Social scale (d = −.57) to small in the Artistic (d = −.41), Realistic (d = .37), Investigative (d = .24) and Conventional scales (d = −.21) and negligible in the Enterprising scale (d = −.14).
All correlations between the interest scales were positive and statistically significant at the .01 level, both when examined at the total sample level and when examined separately by gender. The highest correlation at the total sample level appears between the Social and Enterprising scales (r = .62). For the most part, the correlations in our sample appeared to be consistent with the expectations of Holland’s (1997) hexagonal RIASEC model in that correlations between adjacent interest scales (e.g., Realistic and Investigative, r = .32) appeared to be larger than correlations between alternate (e.g., Realistic and Artistic, r = .17) and opposite (e.g., Realistic and Social, r = .12) scales.
The Structural Validity of the Kiinnostukset Interest Inventory
Fit Indices for the Kiinnostukset Interest Inventory
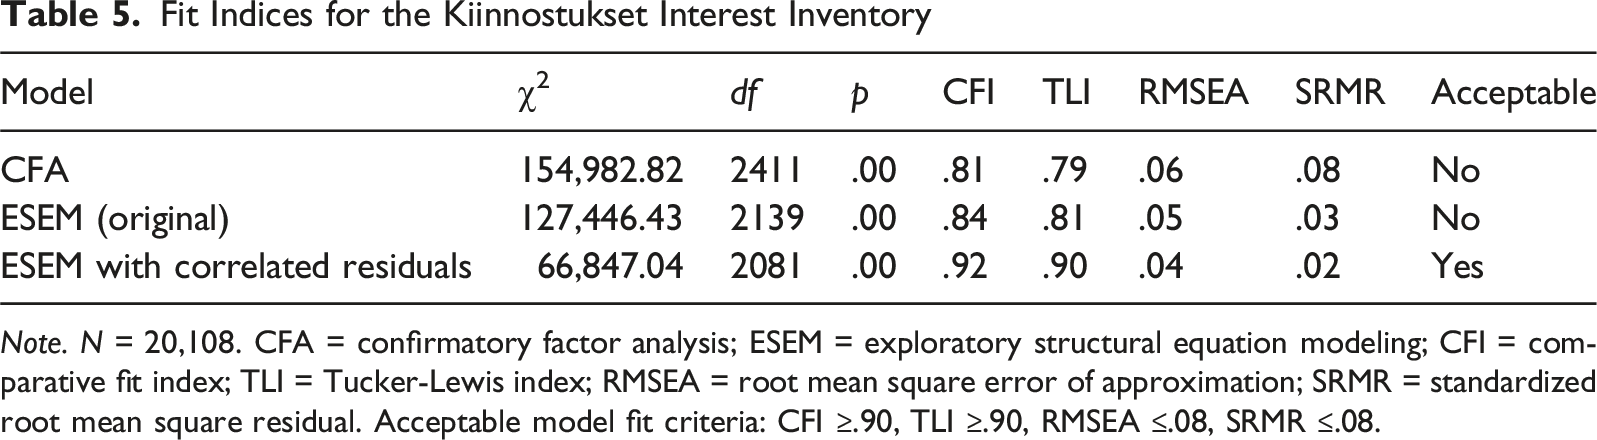
Note. N = 20,108. CFA = confirmatory factor analysis; ESEM = exploratory structural equation modeling; CFI = comparative fit index; TLI = Tucker-Lewis index; RMSEA = root mean square error of approximation; SRMR = standardized root mean square residual. Acceptable model fit criteria: CFI ≥.90, TLI ≥.90, RMSEA ≤.08, SRMR ≤.08.
Results From Exploratory Structural Equation Modeling (ESEM) of the Kiinnostukset Interest Inventory (With Correlated Residuals)
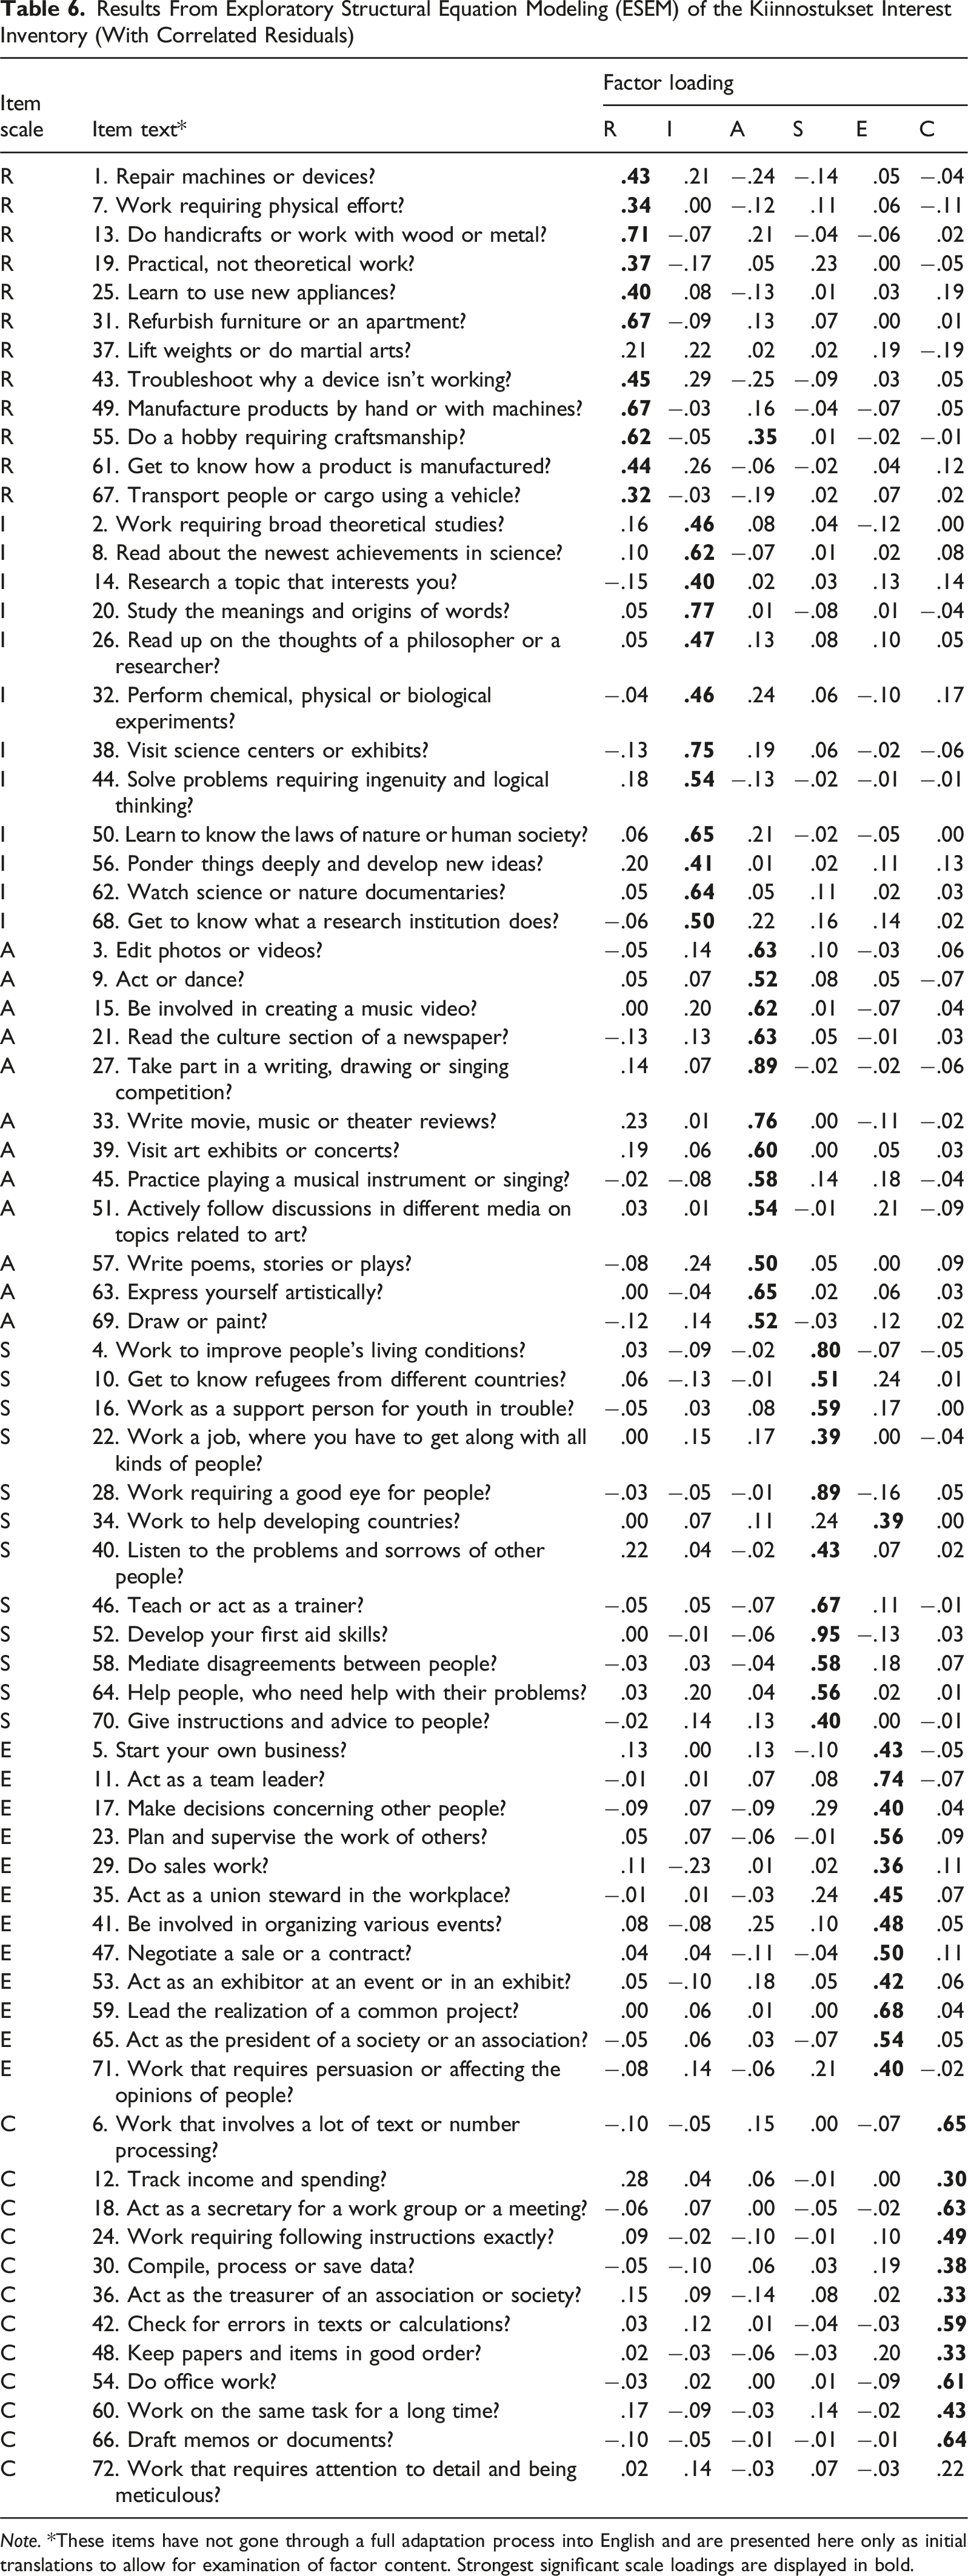
Note. *These items have not gone through a full adaptation process into English and are presented here only as initial translations to allow for examination of factor content. Strongest significant scale loadings are displayed in bold.
Randomization Test of Hypothesized Order Relations (RTHOR)
Results From the Randomization Test of Hypothesized Order Relations (RTHOR) by Gender and Level of Education
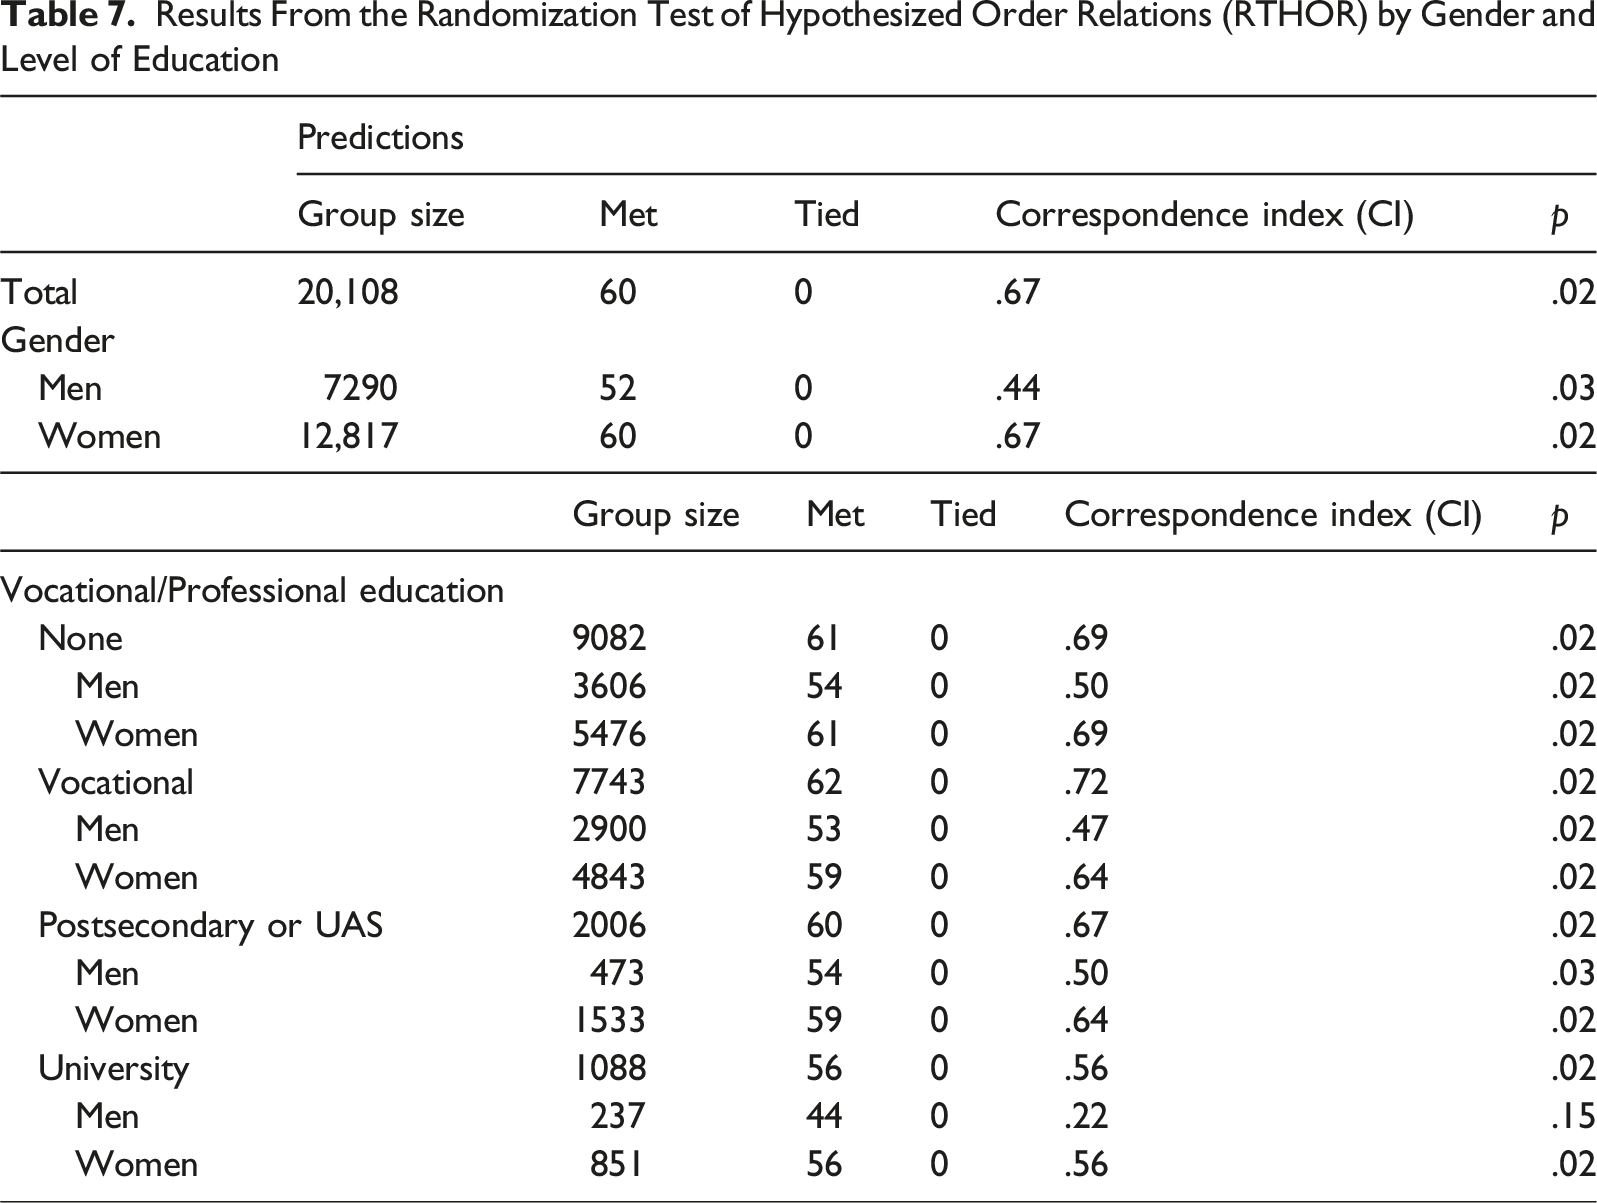
Examined by gender, we note a rather large difference in the fit value between women (CI .67, p = .02) and men (CI .44, p = .03), although the test of difference in fit indicated a similar number of met predictions between genders (p = 0.10). Notably, the trend of higher CI in women remains consistent when examined by level of education, with university-educated men showing a particularly poor fit (CI .22) (see Table 7).
An examination of CI values by level of education produced values of .69 (no vocational or professional education), .72 (vocational upper secondary qualification or equivalent), .67 (post-secondary or university of applied sciences degree) and .56 (university degree), indicating an acceptable fit value for all but university-educated clients, although again the test of difference in fit indicates a similar number of predictions met across differently educated groups, with p-values ranging from .91 to .95.
Multidimensional Scaling
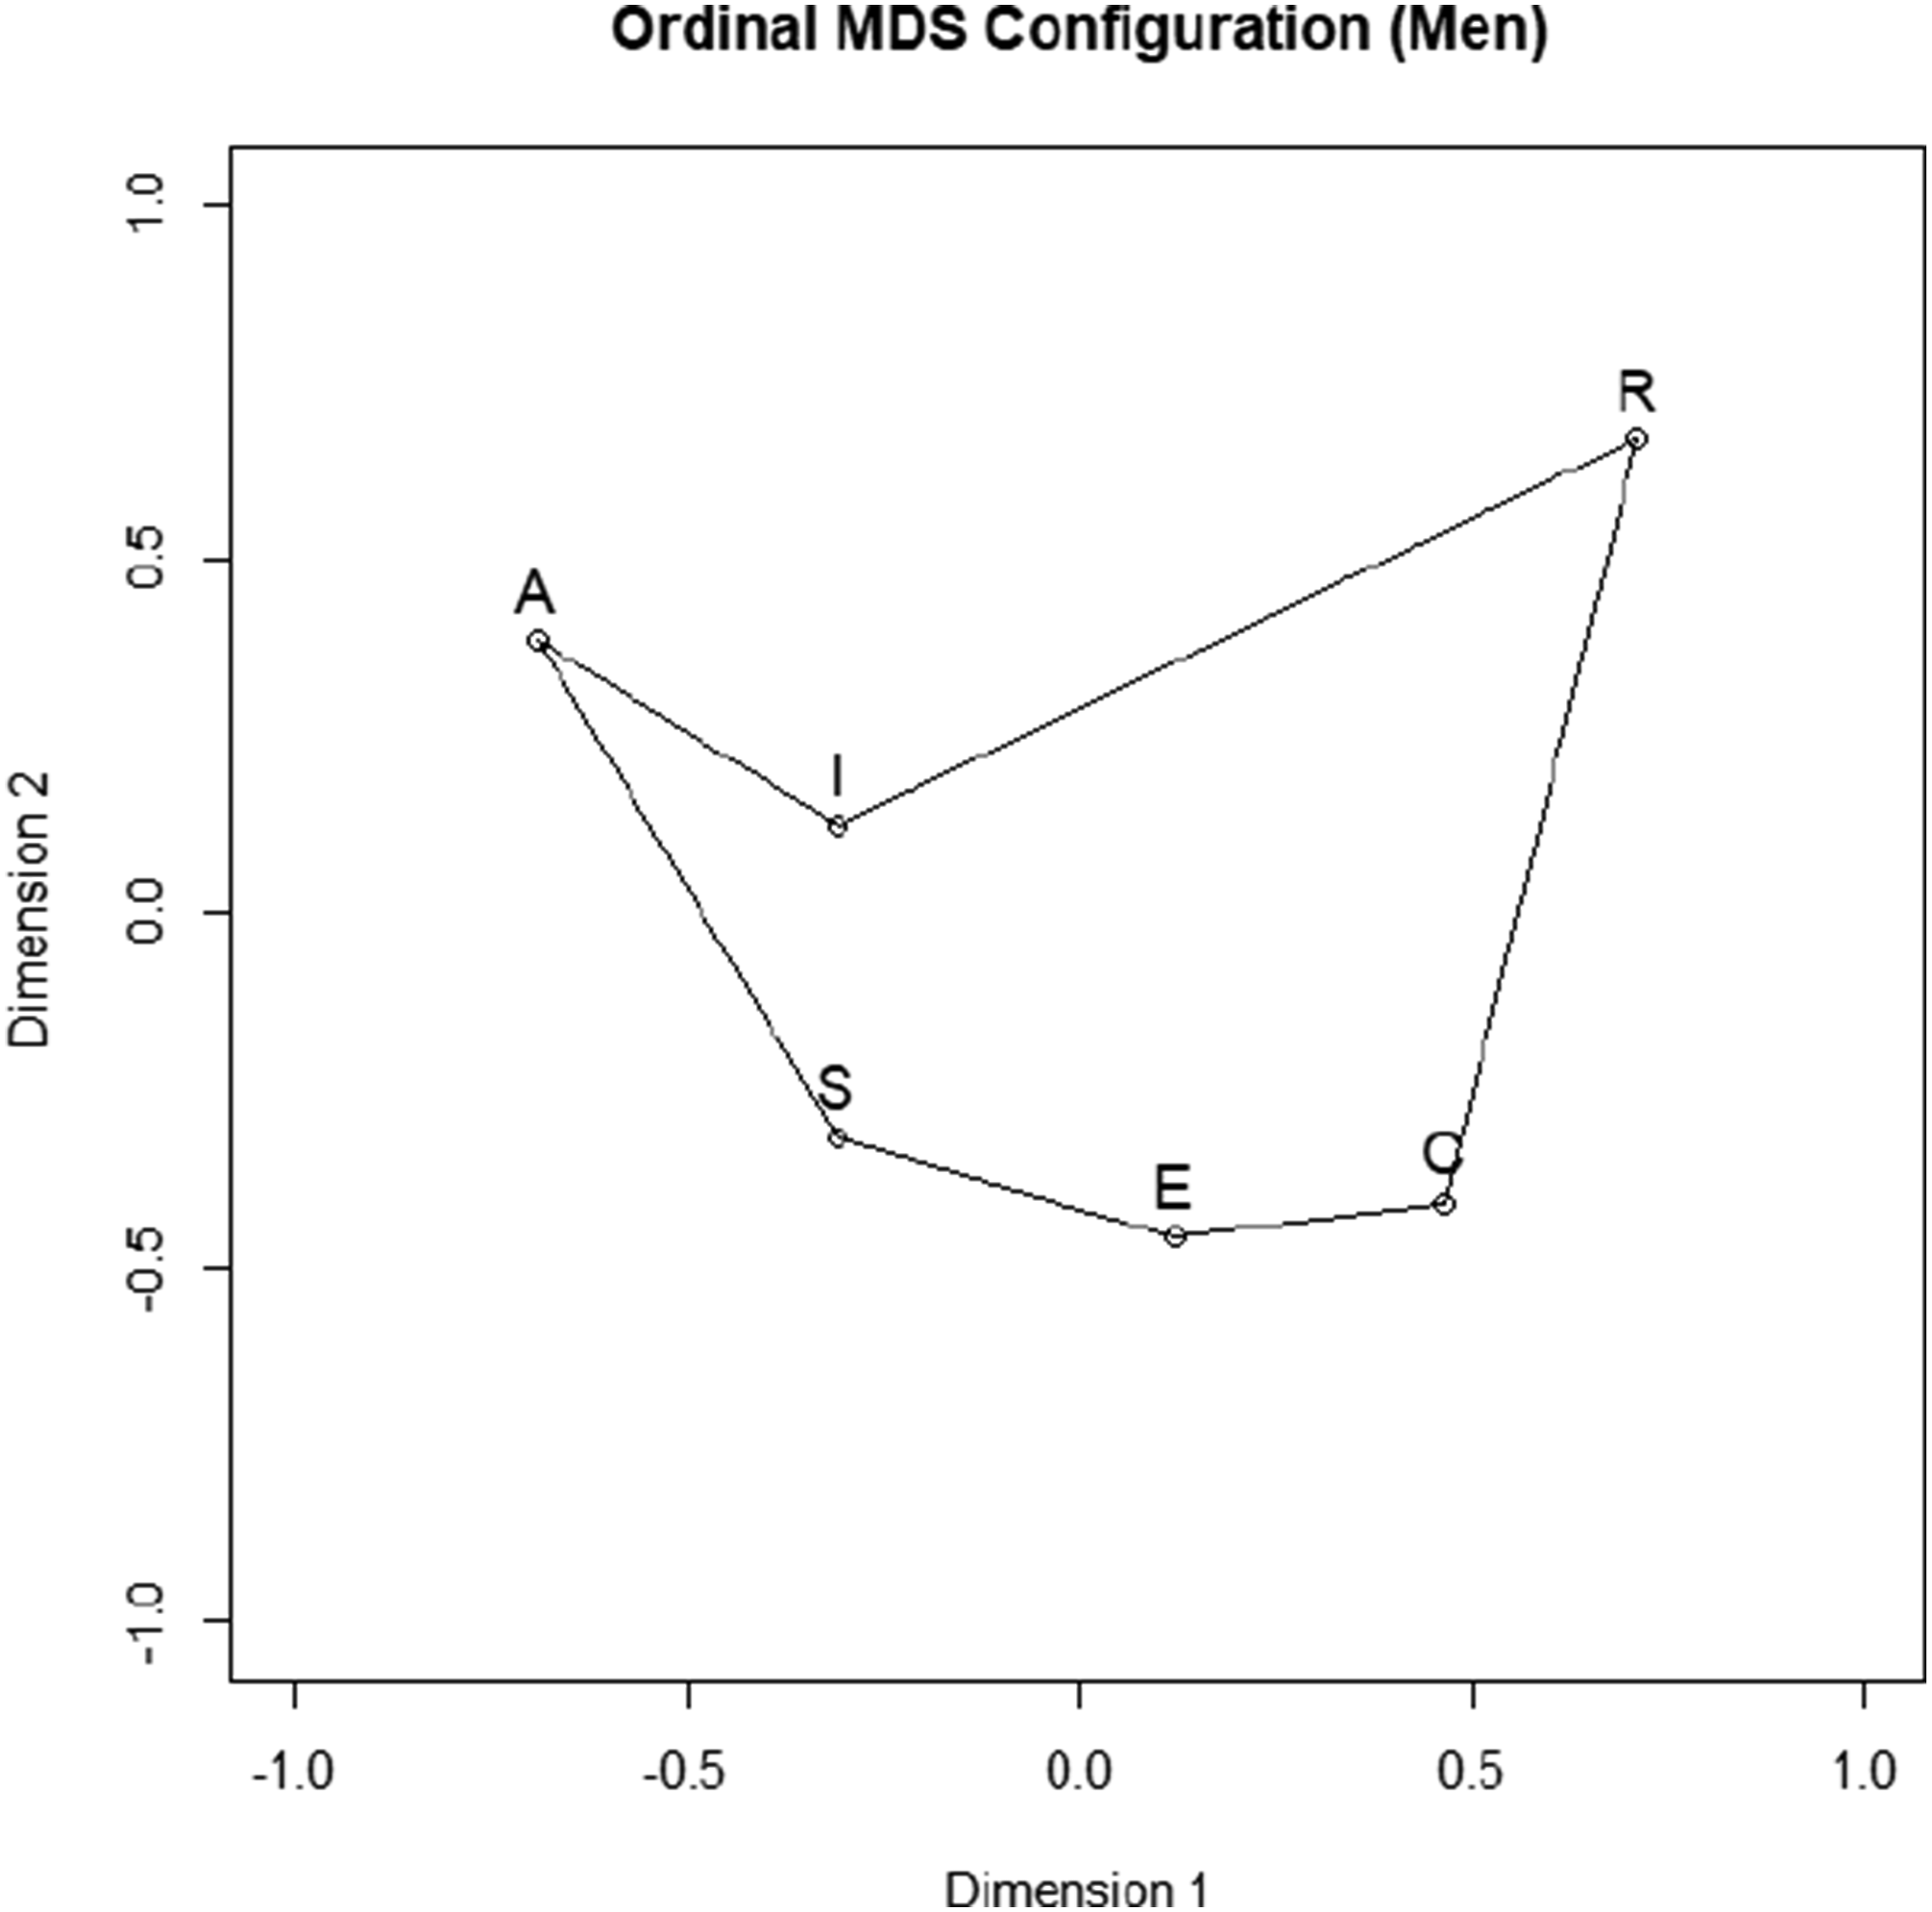
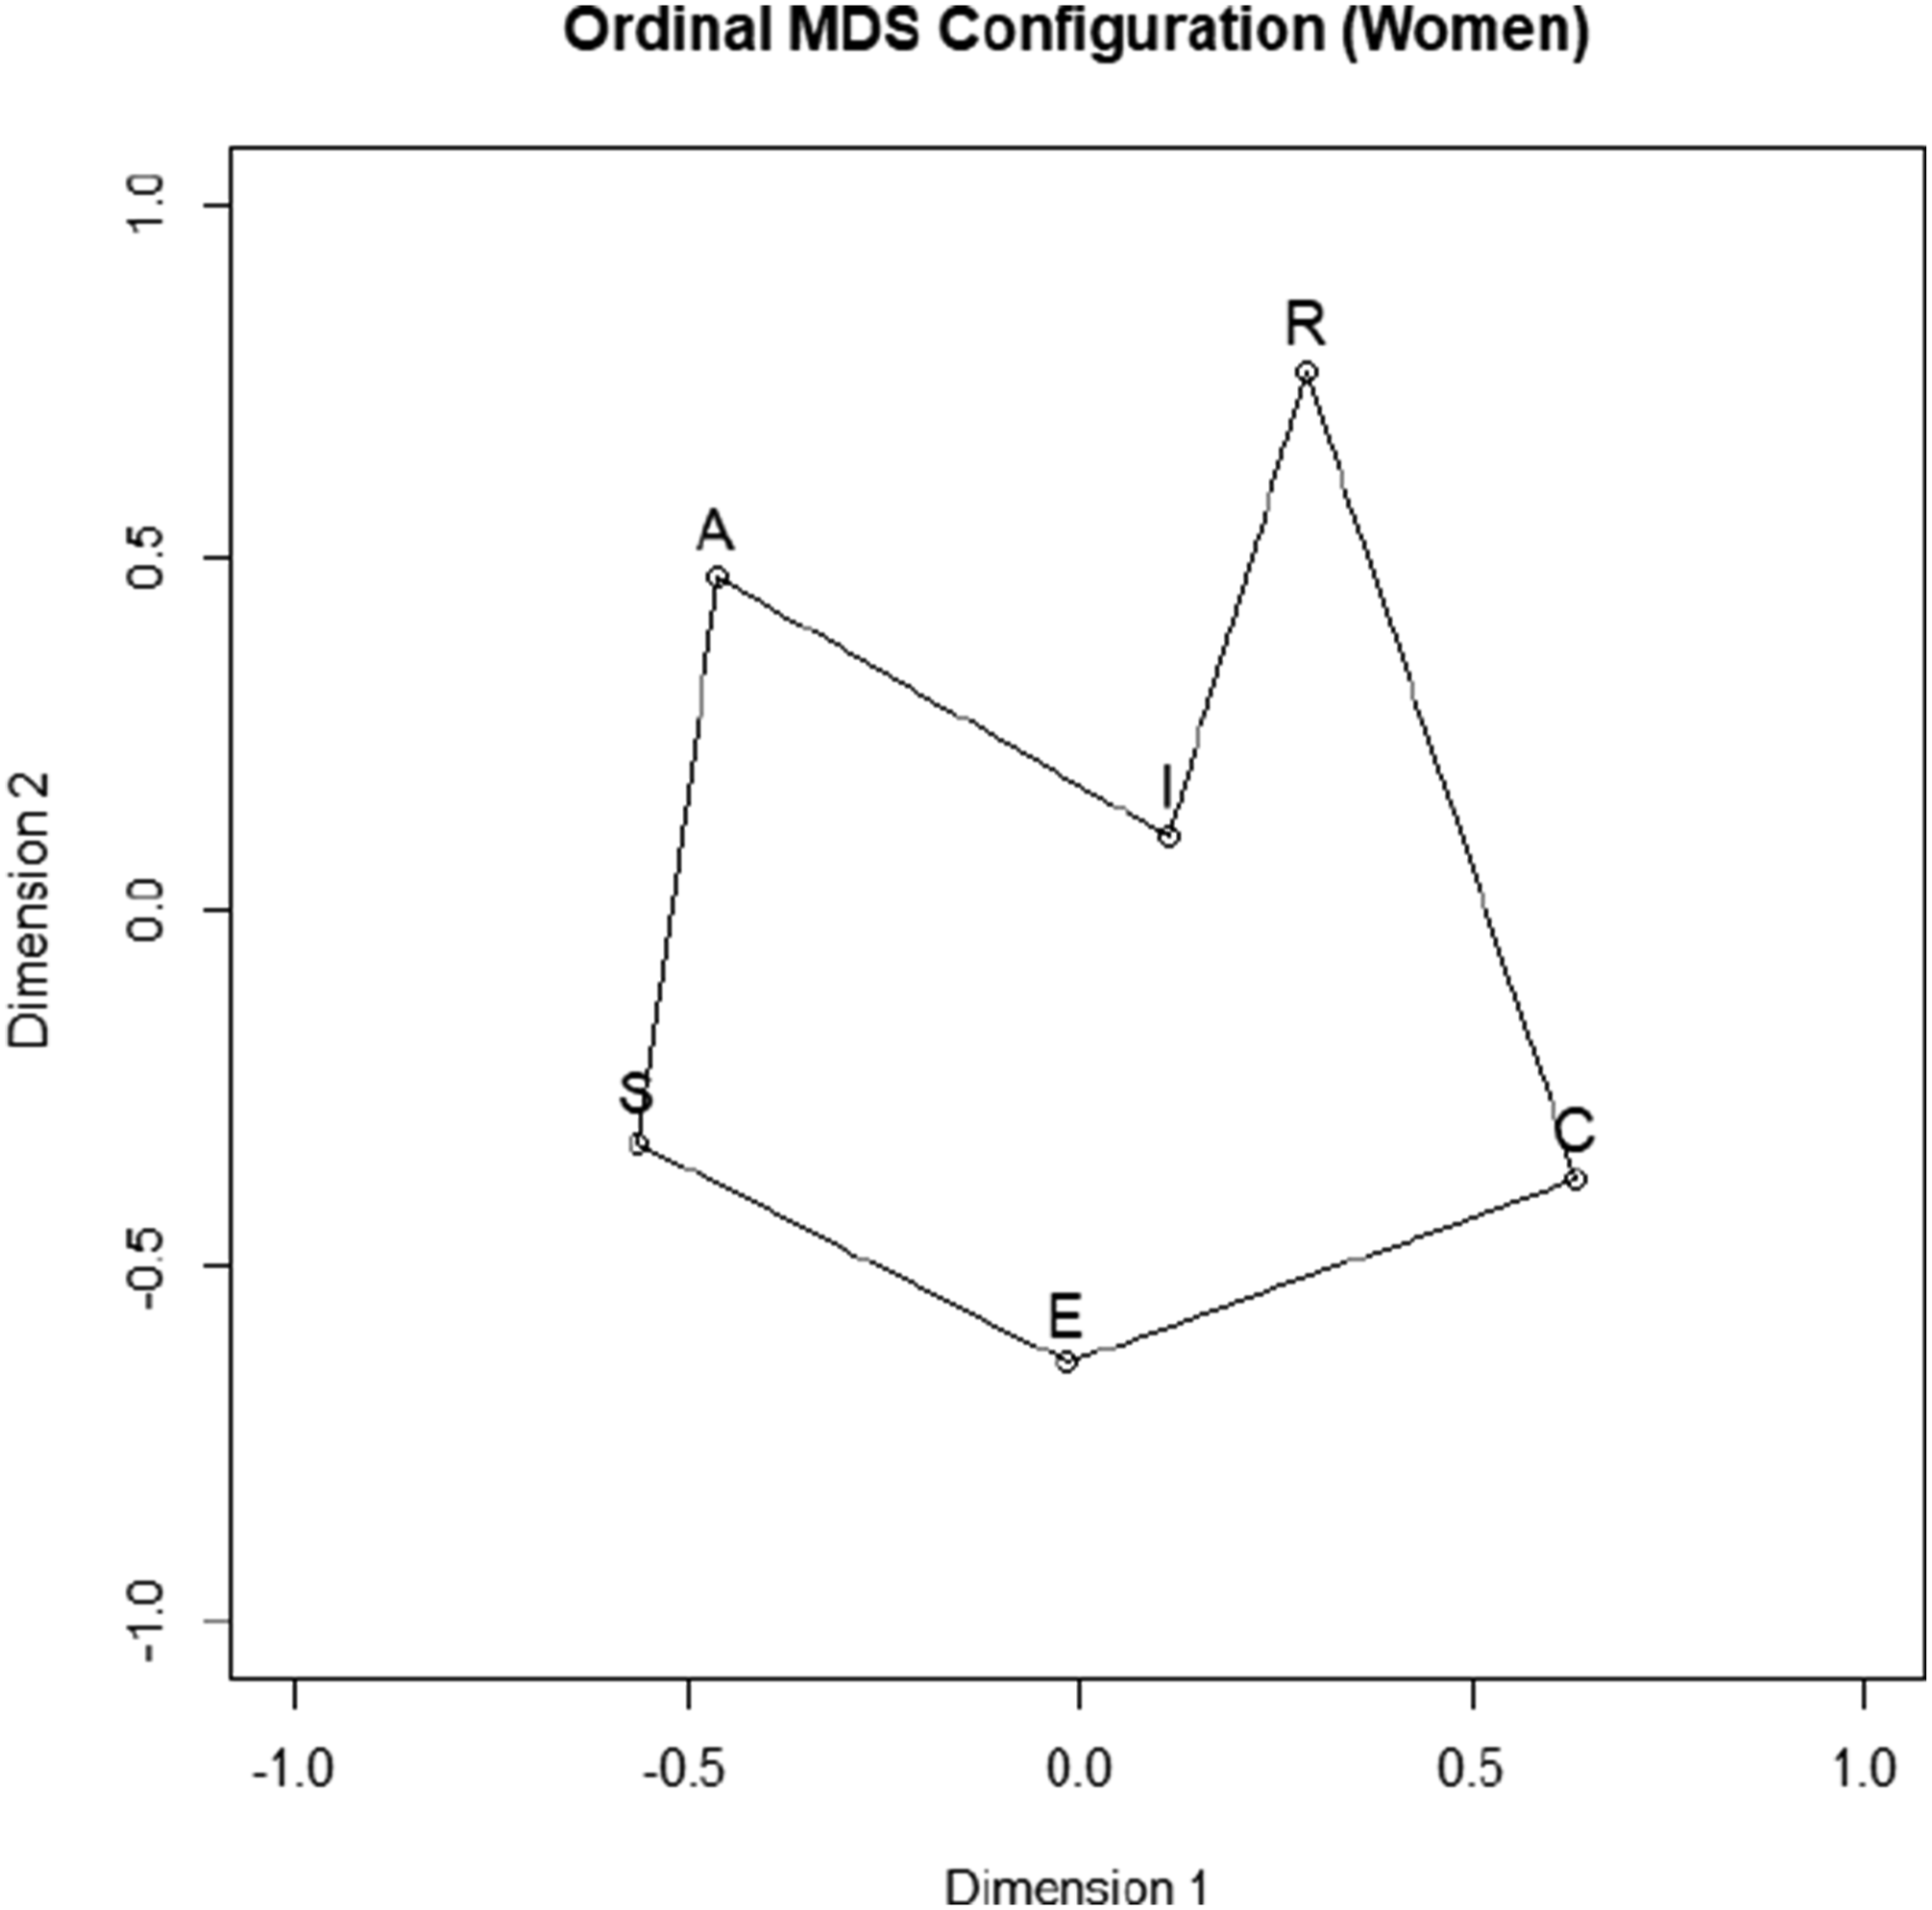
We performed ordinal (i.e., non-metric) multidimensional scaling (MDS) to further examine and visualize the degree of fit of Holland’s (1997) RIASEC model to our data. MDS was performed to the total sample and separately be gender. Stress values were .01 for the total sample, .02 for women and .06 for men, indicating an excellent goodness-of-fit (i.e., values <.10) with few discrepancies between the original data and the two-dimensional MDS solution. Variance Accounted For (i.e., R2) coefficients were .79 for the total sample, .65 for men and .81 for women, in turn indicating acceptable levels of fit (≥.60).
Examined visually, the interest domains in the overall sample and when separated by gender appear to follow the RIASEC circular ordering (i.e., the interest domains are positioned in the expected order relative to each other, see Figure 1), although they were spatially arranged in a relatively similar misshapen polygon with the Investigative type closer to the other types than expected instead of the theoretically ideal equilateral hexagon (see Figures 2–4). This kind of finding is not unexpected (see e.g., Rounds et al., 2021) in fact, Holland himself stated that “at best, the hegaxons resulting from real-word data are misshapen polygons – the hexagon is an ideal” (Holland, 1979, p. 43). In sum, based on the MDS results we conclude that the overall data appears to reflect Holland’s (1997) circumplex to an adequate degree, but more so for women than men (as was to be expected based on the RTHOR results presented earlier). MDS solution for RIASEC scales of the Kiinnostukset interest inventory (whole sample) MDS solution for RIASEC scales of the Kiinnostukset interest inventory (men) MDS solution for RIASEC scales of the Kiinnostukset interest inventory (women)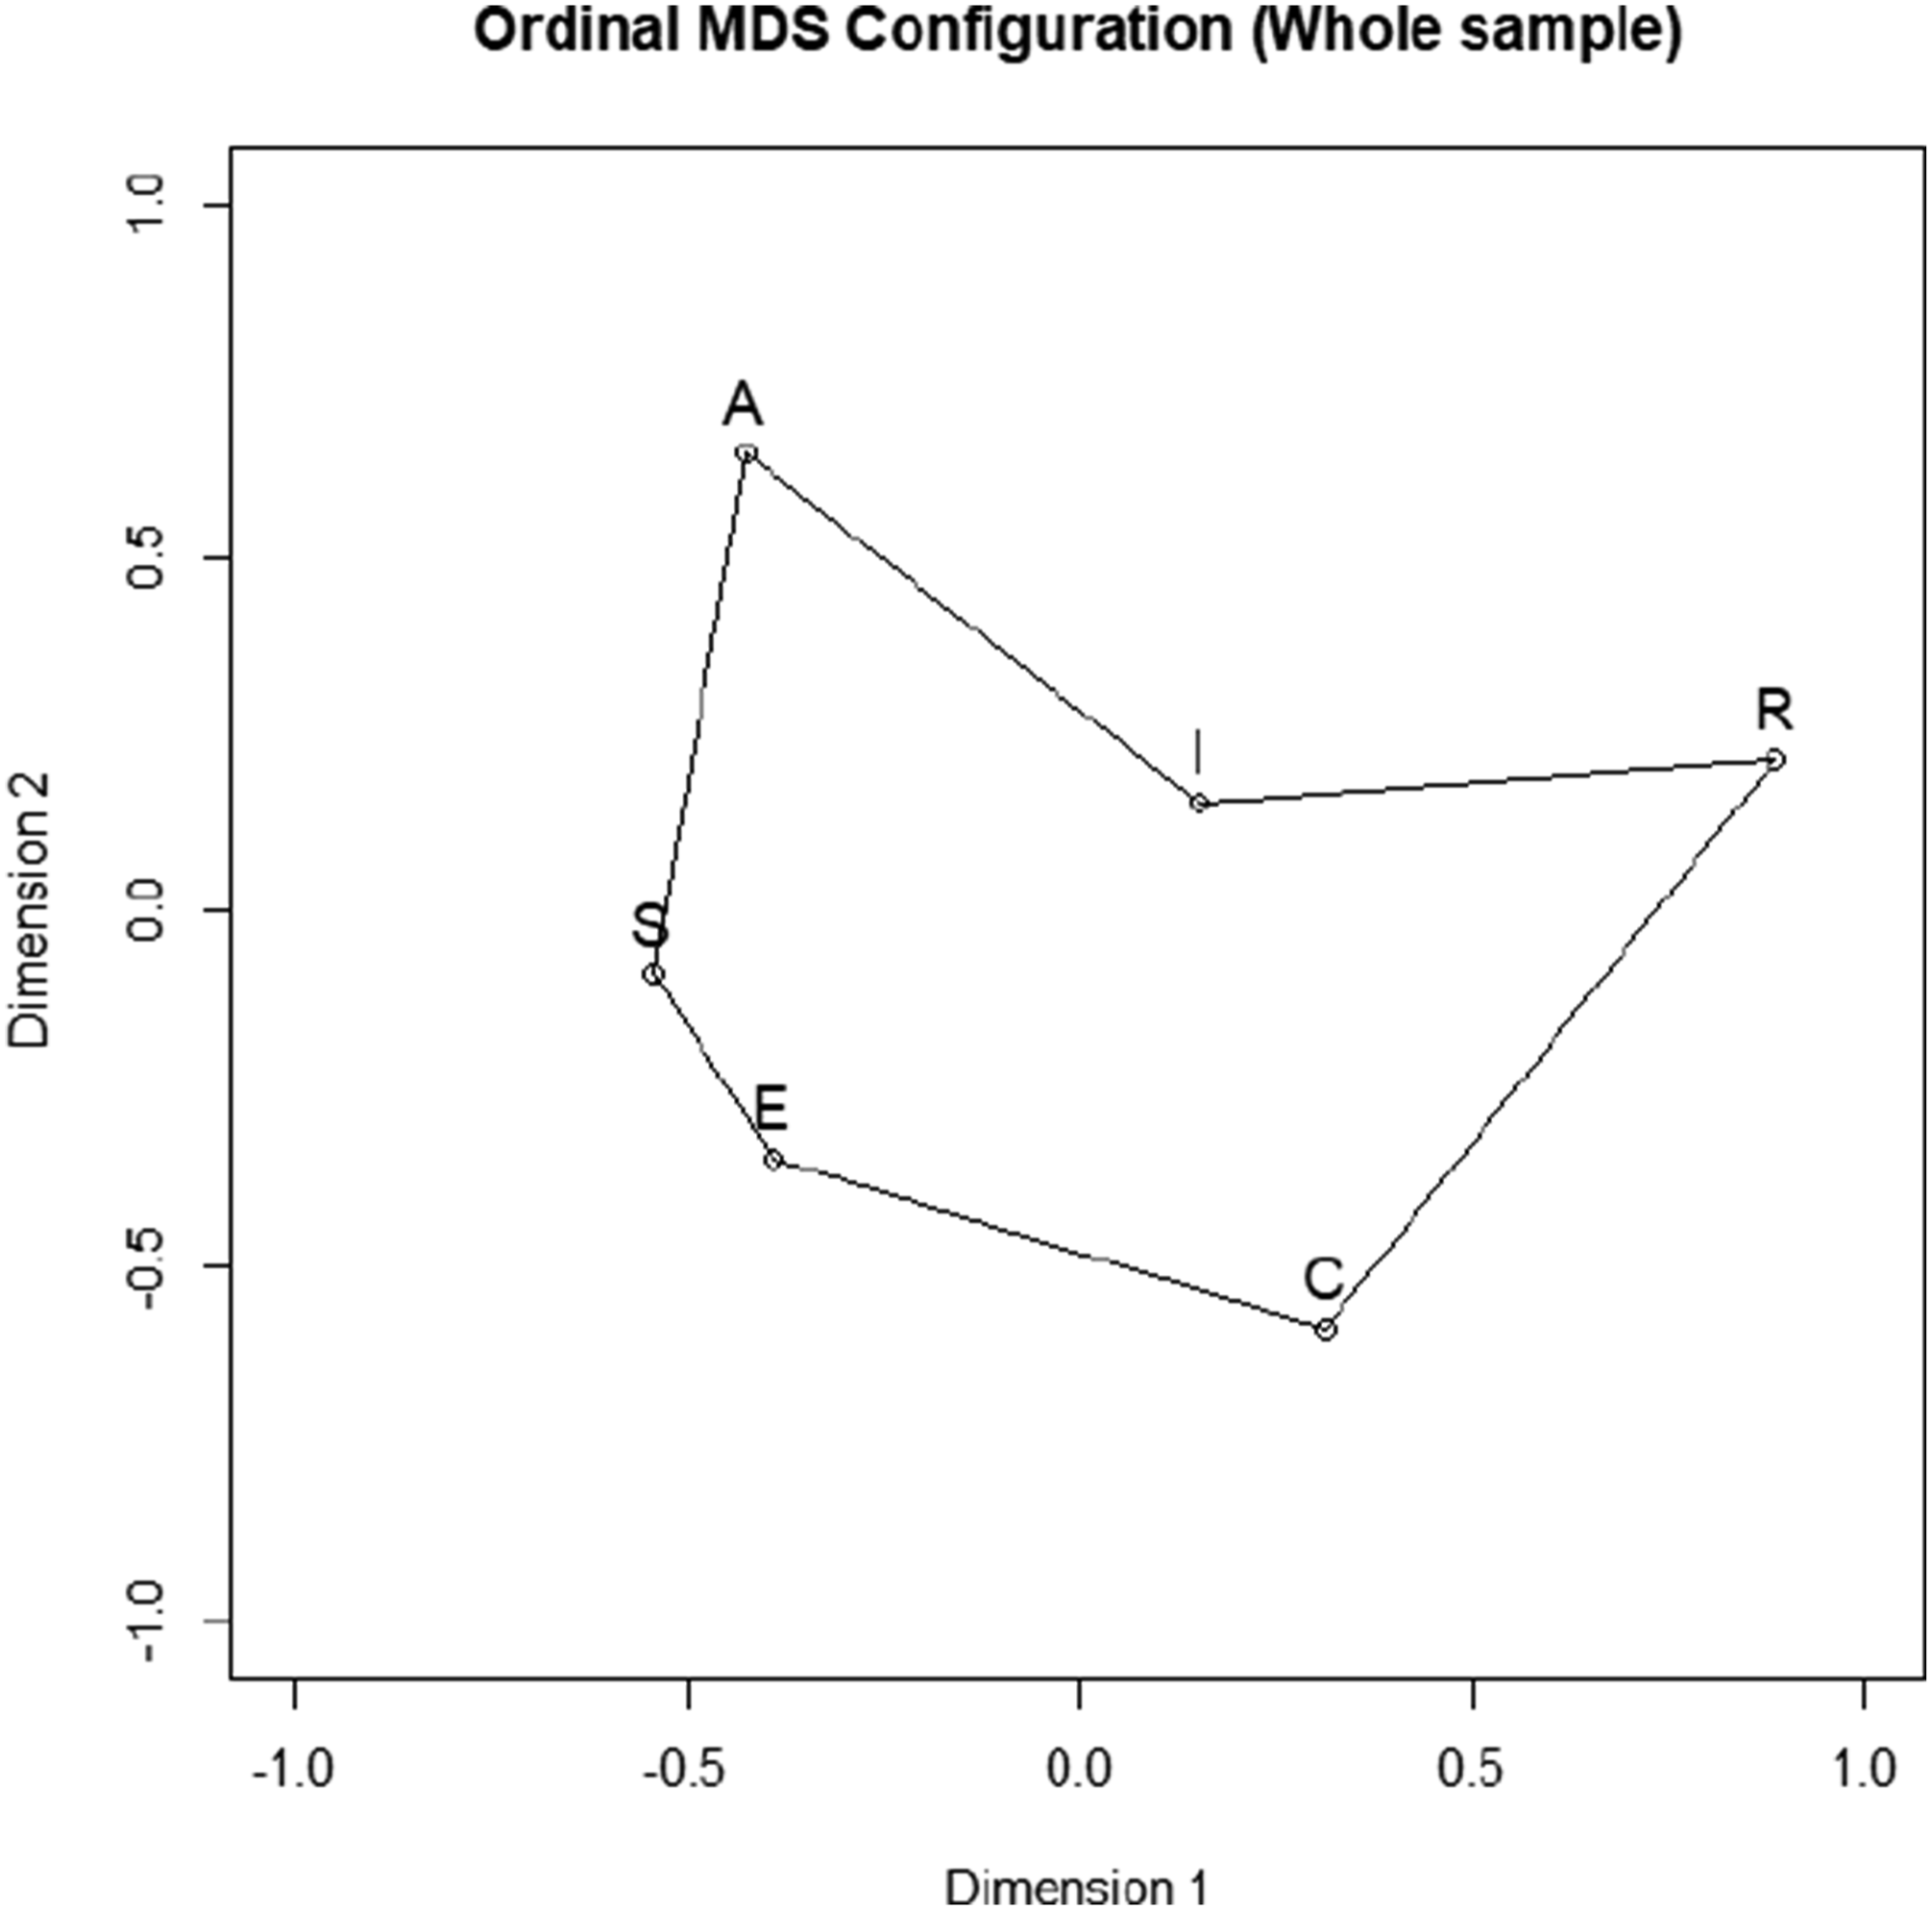
Cosine Function Modelling
Fit Indices for Alternative Cosine Function Models
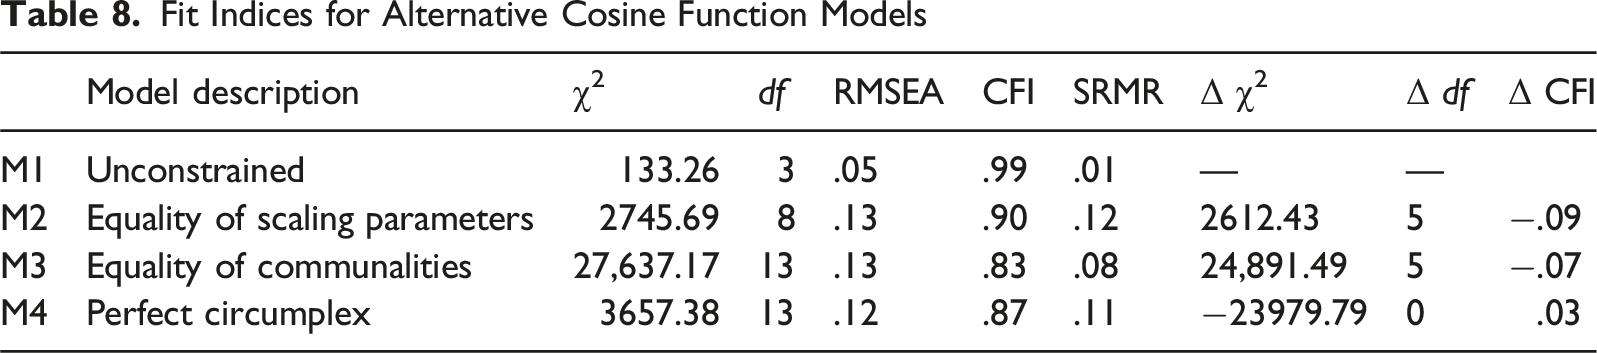
The fit indices of the CFMs indicate that the unconstrained model (M1) showed a reasonable fit, suggesting a circumplex pattern in the data. However, imposing constraints of equality in scaling parameters (M2) and communalities (M3) significantly worsened fit, indicating that the six RIASEC types vary in their contributions and explained variance within the circumplex. While the perfect circumplex model (M4) demonstrated a somewhat better fit than M3, it failed to reach the cutoffs of good fit. The hypotheses of equal scaling parameters (M2), equal scale communalities (M3) and of a perfect circumplex structure (M4) were therefore not supported. Taken together, the results support the idea of a flexible, rather than perfect circumplex structure (cf. Holland, 1979, p. 43; Rounds et al., 2021).
Discussion
This study is, to our best knowledge, the first one to explore the structure of vocational interests in Finland and its fit to Holland’s (1997) RIASEC model of vocational interest with the goal of establishing its validity for the benefit of Finnish career counselling and guidance practice. Furthermore, the present study is one of the few studies investigating the fit of Holland’s (1997) RIASEC model within the cultural context of the Nordic countries (Denmark, Finland, Iceland, Norway and Sweden), where a notable gap in the literature has existed until now for all countries but Iceland (Einarsdóttir et al., 2002).
The Reliability and Validity of the Finnish Kiinnostukset Interest Inventory
To assess whether Finnish vocational interest data conforms to the expectations of Holland’s (1997) RIASEC model, we first performed a psychometric evaluation of the Finnish computer-based vocational interest test Kiinnostukset to determine whether it is a reliable and valid measure of the six RIASEC vocational interest types. As we hypothesized, this was indeed the case:
Exploratory structural equation modeling (ESEM) showed acceptable model fit, with all six RIASEC dimensions clearly emerging and items generally showing highest loadings on the correct factors with few aberrant or cross-loadings. In the overall sample, the RIASEC scale reliabilities (McDonald’s ω total) ranged from .83 (Realistic) to .92 (Social), with an average value of .89, suggesting that the scales capture their underlying interest constructs well. Taken together, we conclude that the Kiinnostukset interest inventory can be used by Finnish career practitioners and researchers as a reliable measure of the RIASEC interests for both research and counselling purposes, although we suggest reviewing the use of items 37 (poor item functioning), 34 (loads primarily on E instead of S) and 55 (correct primary loading on R, but also strong secondary loading on A) and to use scale means instead of sum scores for results where strict item adherence to the RIASEC scales with no strong cross-loadings is desired.
Gender Differences in Vocational Interests in Finland
We found significant gender differences in vocational interests based on our data. The results were largely in line with those previously found in the meta-analysis by Su et al. (2009): namely, in our data men had higher scores in the Realistic (d = .37) and Investigative (d = .24) scales while women had higher scores in Artistic (d = −.41), Social (d = −.57) and Conventional (d = −.21) scales. However, in contrast to the results obtained by Su et al. (2009), there was a statistically significant gender difference in the Enterprising scale favoring women in our data, although with a negligible effect size (d = −.14).
The most notable difference between our results and those by Su et al. (2009) is the considerably lower magnitude of the effect size of gender difference in our Realistic scale (d = .37 vs. d = .84). In their study Su et al. (2009) demonstrate that this kind of finding could be partially explained by the item development strategies chosen while creating the interest inventory, although unfortunately we have no access to information on the item development process of Kiinnostukset and can therefore make no accurate determination. In the same vein, past research has shown that results from interest inventories measuring vocational interest via rating vocational activities (like Kiinnostukset does) tend to show smaller gender differences than results from inventories where occupations are rated directly (e.g., “How interesting would you find the job of a nurse?”) (Ludwikowski et al., 2020). Regardless of the reason, although the magnitude of the effect size was lower than in some previous studies, the gender difference in the Realistic scale was nevertheless observed.
This is not surprising, as similar gender difference patterns have also been robustly replicated in more recent studies: In their meta-analysis focusing on gender differences in adolescents’ vocational interests in an international context, Baerg MacDonald et al. (2023) demonstrated that adolescent men showed higher interests in Realistic and Investigative careers, while adolescent women showed higher interest in Social and Artistic careers regardless of the year of the study, national gender equality rating or interest scale type. Adolescent interest patterns therefore reflect those found in adults (Baerg MacDonald et al., 2023). In a more culturally similar context, Einarsdóttir and Rounds (2020) similarly showed that Icelandic men were higher on Realistic, Investigative and Enterprising interests, while Icelandic women were higher in Social and Artistic interests. They also note that women’s preference for working with people and men’s preference for working with things in general reflects the enduring and extensive gender segregation in the Nordic labor market (Melkas & Anker, 2001).
To summarize the general trend in literature, gender differences in vocational interests appear to be more robust for the Realistic, Investigative, Social and Artistic scales and more mixed for the Enterprising and Conventional scales. In line with this, vocational interests in Finland are also substantial, a rare exception to the findings demonstrating negligible gender differences in most psychological variables (Hyde, 2005). This is not to be taken as support for gender essentialist notions of “men’s and women’s jobs or interests”, rather these results are likely to be a testament to the powerful force of gendered socialization (Charles & Bradley, 2009). For example (Gottfredson, 2005), posits that children begin orienting to gender roles already at 6 to 8 years old, with the local culture pushing genetically diverse individuals to adhere towards common average gender types and therefore narrowing possible self-concepts and later vocational experiences in adolescence and beyond. Negative reactions from the environment may therefore discourage and suppress interest in activities seen as “inappropriate” for their gender, thus resulting in a more limited horizon of occupational choices.
When discussing gender differences, a somewhat controversial idea called “gender equality paradox” (GEP) is often brought up. According to the GEP hypothesis, gender differences in various psychological variables (such as vocational interests) become more pronounced in countries with higher levels of gender equality (Marsh et al., 2021); see Herlitz et al. (2025), for a review). Accordingly, since Finland ranks very high in country-level gender equality (World Economic Forum, 2023), gender differences in vocational differences should therefore be higher in Finland than in most other countries. However, our results indicate lower effect sizes of gender on vocational interests than those obtained by (Su et al., 2009) in both the Realistic and Social interests, which are the archetypal “things” and “people” interests where the most pronounced differences would be expected. Thus, the results from this study do not appear to support the GEP hypothesis. This is not and cannot be conclusive evidence, of course, and the debate around GEP still continues. We consequently refer interested readers to a recent methodological critique of GEP research by Ilmarinen and Lönnqvist (2024).
We end this section by noting that despite the evidence of gender differences in vocational interests, career practitioners work with unique individuals, not average statistics. While being aware of the general effect of gender on vocational interests is important, even more important is helping guide individuals with diverse interest profiles towards careers that best fit their interests regardless of their gender. After all, a good person-vocation fit is linked to job satisfaction and staying in the chosen occupation (Van Iddekinge et al., 2011b), which not only benefits the client but society at large.
Evidence Supporting the Use of Holland’s (1997) RIASEC Model in Finland
The Randomization Test of Hypothesized Order Relations (RTHOR)
Overall, the Correspondence Index (CI) of our sample (.67) was comparable to the US benchmark of .70 set by Rounds and Tracey (1996). Furthermore, comparing our results to those obtained in Iceland (Einarsdóttir & Rounds, 2020) - another Nordic country - we note that the Correspondence Index obtained from Kiinnostukset is similar in level to that obtained from the indigenous Icelandic interest inventory Bendill (Einarsdóttir & Rounds, 2013) in a sample of Icelandic working adults aged 18-61 (CI = .65). Both these CIs are, however, considerably lower than what was obtained by Glosenberg et al. (2019), who received CIs of .89 for Iceland and .78 for Finland. The magnitude of difference affecting both the Finnish and Icelandic CIs suggests to us that this may be due to the differences in sampling methods and scale used between the studies, since Glosenberg et al. (2019) recruited English-speaking participants online to respond to an interest inventory in English, while Einarsdóttir and Rounds (2013) and ourselves targeted local populations using local instruments offered in local languages.
When examined by gender, the CI values for men (.44) appeared to be considerably lower than those of women (.67), but this difference was not statistically significant (p = .10). Similar to our results, Einarsdóttir and Rounds (2020) note that “the hexagonal structure does not seem to hold up as well when tested for men and women separately using the randomization test.” Indeed, the aforementioned Icelandic working adult sample had CIs of .49 for women and .60 for men. The CI values did not vary significantly by level of education, although university-educated responders showed an absolute value (.56) below the desirable cutoff, in contrast to the other educational level groups. Given that the RTHOR evaluates whether the data conforms to the RIASEC circumplex structure in terms of ordinal relationships, the lower correspondence index for university-educated respondents may reflect broader and, consequently, less differentiated endorsement of interests across multiple domains, thereby weakening the level of circumplex correspondence. The particularly poor fit among university-educated men, in turn, may further reflect the fact that this was the smallest subgroup in the data (making up roughly 1%) and due to selection effects it may represent a relatively narrow range of academic or occupational backgrounds.
Nevertheless, we conclude that the sum of current evidence suggests that the structure of Finnish vocational interests overall conforms to the RIASEC circumplex structure in terms of ordinal relations to similar degree as U.S.-based samples do and to similar extent as the indigenous Icelandic interest inventory Bendill (Einarsdóttir & Rounds, 2013) does in Iceland with the local working adult population.
Multidimensional Scaling (MDS) and Cosine Function Models (CFM)
Multidimensional scaling showed that model solutions for the overall sample and by gender were appropriate, with stress values <.10 and variance accounted for (VAF, i.e. R2) values ≥.60. For all solutions, visual examination showed a circular ordering structure resembling Holland’s (1997) hexagon (i.e., the interest domains were positioned in the expected order of R-I-A-S-E-C), although the Investigative scale was “dented” in towards the other scales rather than “pointing” outwards, meaning the Investigative scale showed relatively weaker distinctiveness in comparison to the other interest domains. This may be due to, e.g., the Investigative scale items sharing features with items from the other interest scales or a general tendency in the sample to endorse Investigative items. However, as noted earlier, Holland stated that “hegaxons resulting from real-word data are misshapen polygons – the hexagon is an ideal” (Holland, 1979, p. 43). In fact, a rather similar dented shape can be seen in the MDS solution of the O*NET Interest Profiler Short Form (Rounds et al., 2021, p. 100), an interest inventory widely used for career exploration and planning purposes in the U.S. Taken together, the MDS solutions also offer support for the fit of Holland’s (1997) RIASEC model to Finnish vocational interest data.
Finally, we used cosine function models to test the fit of our data against a theoretically perfect circumplex. Given the previous results from Multidimensional Scaling, it is not surprising that cosine function models with more stringent constraints did not show acceptable levels of fit, while the unconstrained model in turn did. In sum, we conclude that Holland’s (1997) RIASEC model shows a satisfactory, flexible fit to Finnish vocational interest data.
Limitations and Future Directions
Some limitations should be noted regarding our study. First, ideally, we would have liked to establish the criterion validity of the Kiinnostukset interest inventory, either in terms of predictive or concurrent validity. Unfortunately, as our dataset only contains minimal demographic data in addition to the interest inventory responses, we are unable to do so. Thus, establishing the criterion validity of Kiinnostukset remains a task for future research. In a related vein, we believe it would be worthwhile for future studies to examine possible differences in RIASEC fit between Kiinnostukset and an adapted Finnish version of one of the “highly regarded” interest inventories listed in Su et al. (2009). This might help shed light as to why exactly our results somewhat differ from those obtained by Glosenberg et al. (2019) in terms of lower CI values.
Second, while our sample can be considered representative of the Finnish-speaking population, we note that Finland also has a sizeable Swedish-speaking minority (about 5% of the population) and an indigenous Sámi people population. As our data contains no information on the clients’ first language or indigenous identity, we are unable to determine how well these populations are represented in our data. Regardless, future research should adapt vocational interest assessment measures for and study these populations separately in consideration of their linguistic rights based on Finnish legislation.
Third, our sample only consisted of people who had participated in career counselling services offered by the Finnish Public Employment Services. While this is certainly a population of key significance in terms of assessing vocational interests, it also does not fully capture all contexts where the assessment of vocational interests could be important. For example, in Finland, all students must make their first major career decision at the end of ninth grade at around age 15 as they face the transition to upper secondary education (either general or vocational track). However, our data consisted only of 704 adolescents aged 15 or below (roughly 3% of our data). This can be linked to perhaps one of the key limitations of our sample, as it is by its very nature selective. While access to vocational guidance is a right under Article 9 of the European Social Charter (1996), it is not necessarily sought by nor offered to all those who could benefit from it, as the roughly 2:1 ratio of women to men in our sample suggests a gender-based selection effect in access to Public Employment Services provided career counselling psychologist services. In order to get the full picture of vocational interests, future studies should aim to study vocational interests in the Finnish general population as well as in educational settings at the primary, secondary and tertiary levels.
Conclusion
Ethical and evidence-based career practice requires sufficient research evidence in support of the theoretical models and tools used by career practitioners to help clients make important career decisions. In this study, we carefully analyzed interest data from a large, nationally representative sample of Finnish career counselling clients and consequently provided, for the first time, evidence of support to the continued use of Holland’s (1997) RIASEC model in Finnish career counselling and guidance practice.
In general, the foremost Finnish vocational interest inventory Kiinnostukset showed satisfactory psychometric properties and the statistical fit of the RIASEC circumplex structure in Finland was similar in level to US and Icelandic samples. Although the fit was less ideal for men and people with university-level education, these differences were not statistically significant. Having set this baseline, we now call for further research in service of both refining old and developing new interest assessment tools to further support ethical and evidence-based career practice in the Finnish cultural context.
Footnotes
Acknowledgements
We wish to thank Terence Tracey for providing us with the RANDALL and RANDDIF programs. Furthermore, we wish to thank Dragoş Iliescu for providing us with example syntaxes for the RANDALL program and Jörg Heine for providing us with technical insight to the R package holland. Finally, we wish to thank Hannu Auer for being our data liaison and Harry Pulliainen for providing us insight on the development of the Kiinnostukset interest inventory.
Ethical Considerations
Our study is a secondary analysis of de-identified registry data. The study was approved by the Finnish Development and Administration Centre for ELY Centres and TE Offices (KEHA Centre), which is the competent authority for granting permits to access Finnish Public Employment Services registry data for research purposes. In Finland, neither legislation nor the guidelines of The Finnish National Board on Research Integrity (TENK) require ethical review by an ethics committee for research based purely on registry and documentary data or archive data.
Consent to Participate
According to Finnish legislation, informed consent is not required for registry-based studies. Data for historical or scientific research can be obtained from official personal data files by the competent authority’s permission (Data Protection Act 1050/2018).
Author’s Contributions
Funding
The authors disclosed receipt of the following financial support for the research, authorship, and/or publication of this article: This work was supported by the Finnish Cultural Foundation (grant number 00230949).
Declaration of Conflicting Interests
The authors declared no potential conflicts of interest with respect to the research, authorship, and/or publication of this article.
Data Availability Statement
The datasets analyzed in the current study are not available due to the terms of our research permit forbidding the sharing of this data to third parties.