
Abstract
Holland’s RIASEC theory posits that career choices are guided by the desire to establish congruence between individual interests and environmental activity opportunities. Furthermore, the theory states that most individuals exhibit interests that are consistent with the circular ordering of RIASEC domains, thereby rendering specific interest constellations unlikely. Therefore, as activity opportunities provided by many environments are inconsistent with the circular RIASEC order, the question emerges as to which individuals they attract. In this article, we examine the plausibility of three different scenarios that assert inconsistent environments (A) attract individuals with similarly inconsistent interests; (B) attract individuals with consistent, but only partially congruent interests; and (C) attract individuals with overall strong interests. Data collected within three university majors (N = 553)—two consistent (emphasizing either R or S) and one inconsistent (emphasizing both R and S)—support Scenario B, suggesting that inconsistent environments are linked to lower congruence and greater interest diversity.
Keywords
Introduction
For several decades, Holland’s (1997) RIASEC theory has been one of the most influential frameworks for explaining individuals’ career choices. In this theory, vocational interests and environments are described using a taxonomy of six domains of vocationally relevant activities collectively referred to as RIASEC: Realistic (R); Investigative (I); Artistic (A); Social (S); Enterprising (E); and Conventional (C). A key component of RIASEC theory is the concept of interest congruence, which refers to the match between an individual’s interests and the vocational environment’s activity opportunities. RIASEC theory suggests that the desire to maximize interest congruence is the primary driving force behind career choices.
As part of his RIASEC theory, the calculus hypothesis, Holland (1997) suggested that the relationships between interest domains can be represented by a circular arrangement, so that adjacent interest domains can be understood as psychologically similar and opposite domains as psychologically opposed (see Figure 1, left panel). Similar RIASEC domains (e.g., Realistic and Investigative) are correlated positively and positioned adjacent to each other to represent that they reflect similar psychological traits. However, opposite domains (e.g., Realistic and Social) often are correlated negatively and, therefore, are positioned at opposite ends to convey that they represent opposing characteristics. Holland refers to alignment of an individual’s interest profile as interest consistency. The strong empirical support for the circular interest structure (e.g., Armstrong et al., 2008; Etzel et al., 2021; Nagy et al., 2010) implies that most individuals tend to have consistent interest profiles (Nagy et al., 2010). Different Representations of a Hypothetical Interest Profile. Note. Left panel: vector representation of a hypothetical person i’s interest profile with the Data-Ideas and People-Things dimensions. Right panel: model’s expected representation of a hypothetical person i’s interest profile. R = Realistic; I = Investigative; A = Artistic; S = Social; E = Enterprising; C = Conventional; PT = coordinate weights on the axes People-Things; DI = coordinate weights on the axes Data-Ideas; α = profile differentiation; δ = profile orientation; λ = profile elevation (dashed line).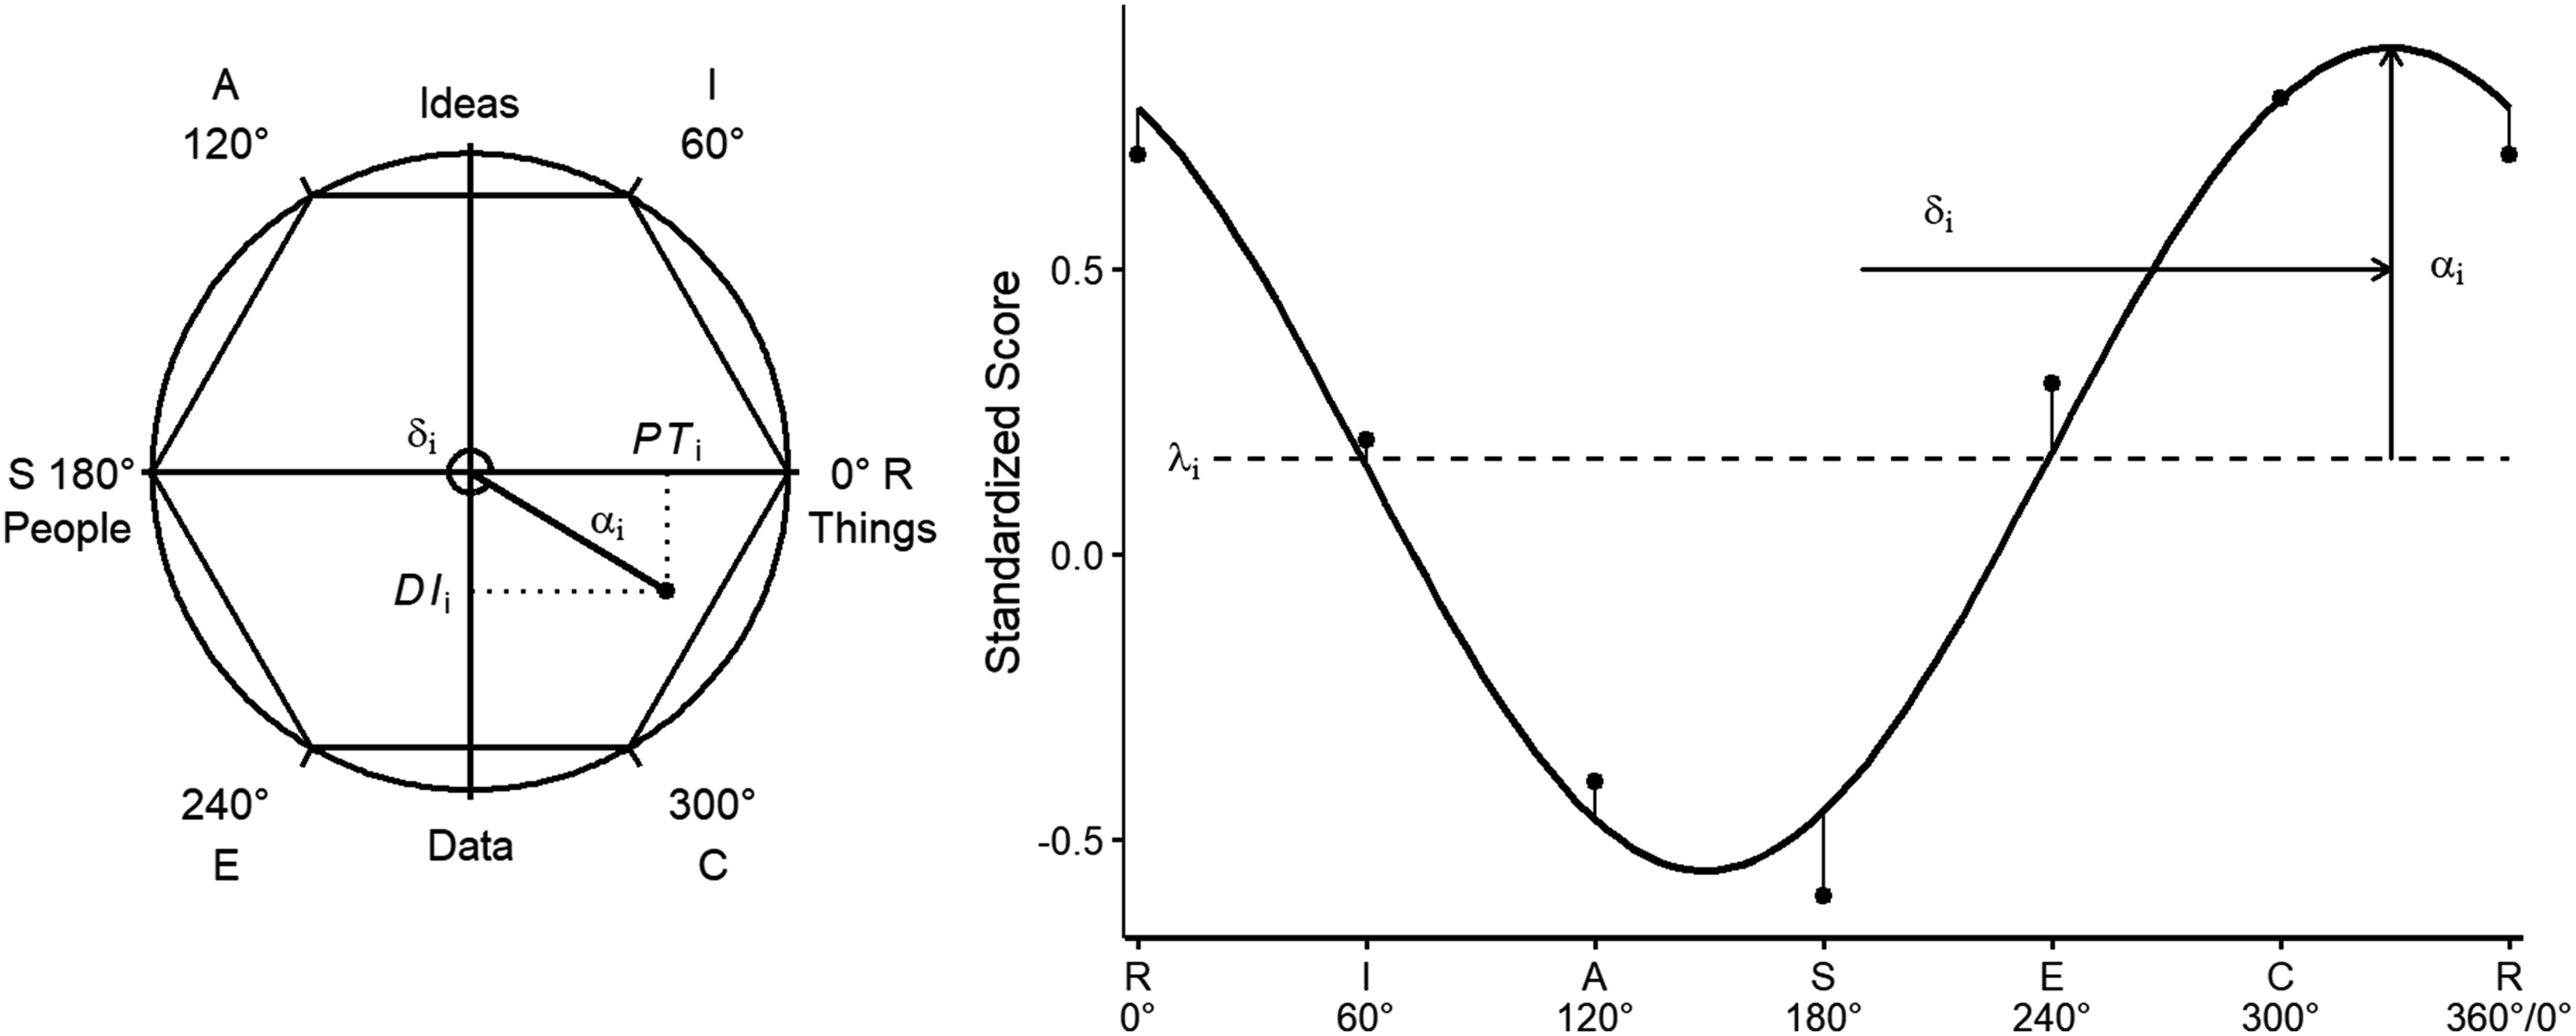
Therefore, to maximize a consistent interest profile’s congruence, it needs to be paired with an environmental profile of activity opportunities that adheres to the same circular structure. However, contemporary work environments also include vocational environments—such as teaching STEM subjects, healthcare, or managing social institutions—in which activity opportunities from opposing domains play a significant role. Thus, these environments can be described as inconsistent (e.g., Deng et al., 2007; Savickas, 2020; Su et al., 2019). For instance, teaching STEM subjects is dominated by technical activity opportunities aligned with the realistic domain and pedagogical activity opportunities aligned with the social domain. This blend of activity opportunities, typically viewed as inconsistent, is a salient feature of such vocational environments. In light of these tensions, a pertinent question arises: What are the interest profiles of individuals who choose vocational environments characterized by inconsistent activity opportunities?
In accordance with RIASEC theory, three potential scenarios or directions can be delineated. The first, Scenario A, comprises maximum congruence due to inconsistency: Inconsistent environments might attract individuals with similarly inconsistent interests. As such, in this scenario, interest congruence is maximized. The second, Scenario B, comprises limited congruence due to consistency: Inconsistent environments’ attractiveness might not be related to interest consistency. As a consequence, most individuals will not reach “maximum” congruence because this would require inconsistently structured interest profiles. The third, Scenario C, comprises congruence due to flexibility: Inconsistent environments might be the most attractive for individuals with very broad and strong interests (Tracey & Robbins, 2005) because unlike consistent environments—characterized solely by similar dominant activity opportunities—inconsistent environments comprise multiple, opposing, dominant activity opportunities, making them particularly attractive to individuals with broadly varied interests.
This research topic was addressed by assigning student teachers majoring in technical and vocational education and training (TVET) to the outlined scenarios based on their vocational interests. TVET served as a prime example of a vocational environment characterized by two opposing (i.e., inconsistent) activity opportunities: Subject-specific teaching content emphasizes technical activity opportunities (R), while pedagogical teaching activities predominantly reflect social activity opportunities (S). Given the three scenarios, in the case of Scenario A, maximum congruence due to inconsistency, TVET students are expected to exhibit both dominant technical and social interests; with Scenario B, limited congruence due to consistency, they would display either dominant technical or social interests; and under Scenario C, congruence due to flexibility, they would demonstrate a strongly pronounced interest in nearly all possible activity opportunities. The scenarios presented appear plausible to us, but are idealized overall, that is, the reality is likely to be more complex (e.g., Reardon et al., 2022). Therefore, the central question guiding our research is whether characteristic interest profiles can be identified using the three scenarios, rather than focusing on identification of a single, overarching scenario.
As assignment of TVET students to the three scenarios was not based on specific metrics, but allowed for some interpretive flexibility, additional comparison groups of students in study majors characterized by consistent activity opportunities—engineering sciences and educational sciences—also were used. These students’ dominant activity opportunities align with one of the two opposing activity opportunities predominant in TVET—technical (R) or social (S) activity opportunities.
Vocational Interests and Choices
Vocational interests are viewed as powerful predictors of career choice. For example, several studies suggest that interest profiles contain predictive power on career choice, with results indicating that individuals tend to choose environments that are congruent with their interests (e.g., Hanna & Rounds, 2020; Nye et al., 2017; Perera & McIlveen, 2018). According to Holland’s (1997) RIASEC theory, interest congruence is associated with higher job satisfaction, greater success, and prolonged job persistence, as individuals can express their interests in their chosen environments. Furthermore, interests generally are viewed as remaining relatively stable from late adolescence and largely resistant to socialization processes (e.g., Etzel & Nagy, 2021; Hoff et al., 2020). Consequently, the observed congruence between interest profiles and environmental activity opportunities is primarily due to selection or allocation mechanisms. These findings support Holland’s (1997) suggestion that career-related choices are driven by the motivation to maximize congruence of interests.
Representing Interest Profiles on the Basis of the Interest Circumplex
Interest profiles offer a comprehensive representation of an individual’s RIASEC domains. As assignment to the scenarios is based on individual interest profiles, this section presents an approach for comparing and interpreting these profiles using various parameters.
As illustrated in Figure 1 (left panel), the representation of interest profiles is associated closely with the interest domains’ circular structure. The calculus hypothesis posits that interest domains are embedded in a similarity structure that can be represented as the edges of a hexagon or as angular locations on a circumplex (Gurtman & Balakrishnan, 1998). This enables localization of all RIASEC domains through implementation of a coordinate system. As presented in Figure 1 (left panel), the circumplex often is represented in a coordinate system with two orthogonal coordinate axes, labeled Data-Ideas (DI) and People-Things (PT) (Prediger, 1982). These axes can be understood as interpretational anchors that define the fundamental characteristics of the activities combined in each RIASEC domain. In the PT axis context, the interest domains R (Realistic) and S (Social) function as the poles Things (R) and People (S), respectively. The interest domains I (Investigative), A (Artistic), E (Enterprising), and C (Conventional) represent a mixture of the poles Things, Ideas, People, and Data, contingent on their spatial location. Thus, all RIASEC domains can be understood as a mixture of the poles from both axes. Therefore, the circumplex can be used to summarize individual interest profiles, providing a more comprehensive framework that extends beyond the mere representation of domain-specific RIASEC scores.
As Nagy et al. (2009) found, a similarity structure compatible with the circumplex means that individuals’ RIASEC profiles can be represented as a function of their axis scores or weights. Figure 1 (left panel) provides an example of hypothetical coordinate weights for a person, i. As presented, each individual configuration of weights can be used to define the end of a vector starting from the origin of the coordinate system. The profile orientation,
The two vector characteristics, profile orientation (
Notably, however, the axis weights and profile parameters presented in the two panels of Figure 1 describe ideal profiles that typically do not fully correspond to the observed RIASEC scores. Discrepancies between observed and model-implied profiles (represented by the vertical bars in Figure 1, right panel) can be quantified by residual profile variability (
Interest Profiles in Inconsistent Environments
Implications of Scenarios A–C, Including an Example Based on the TVET.
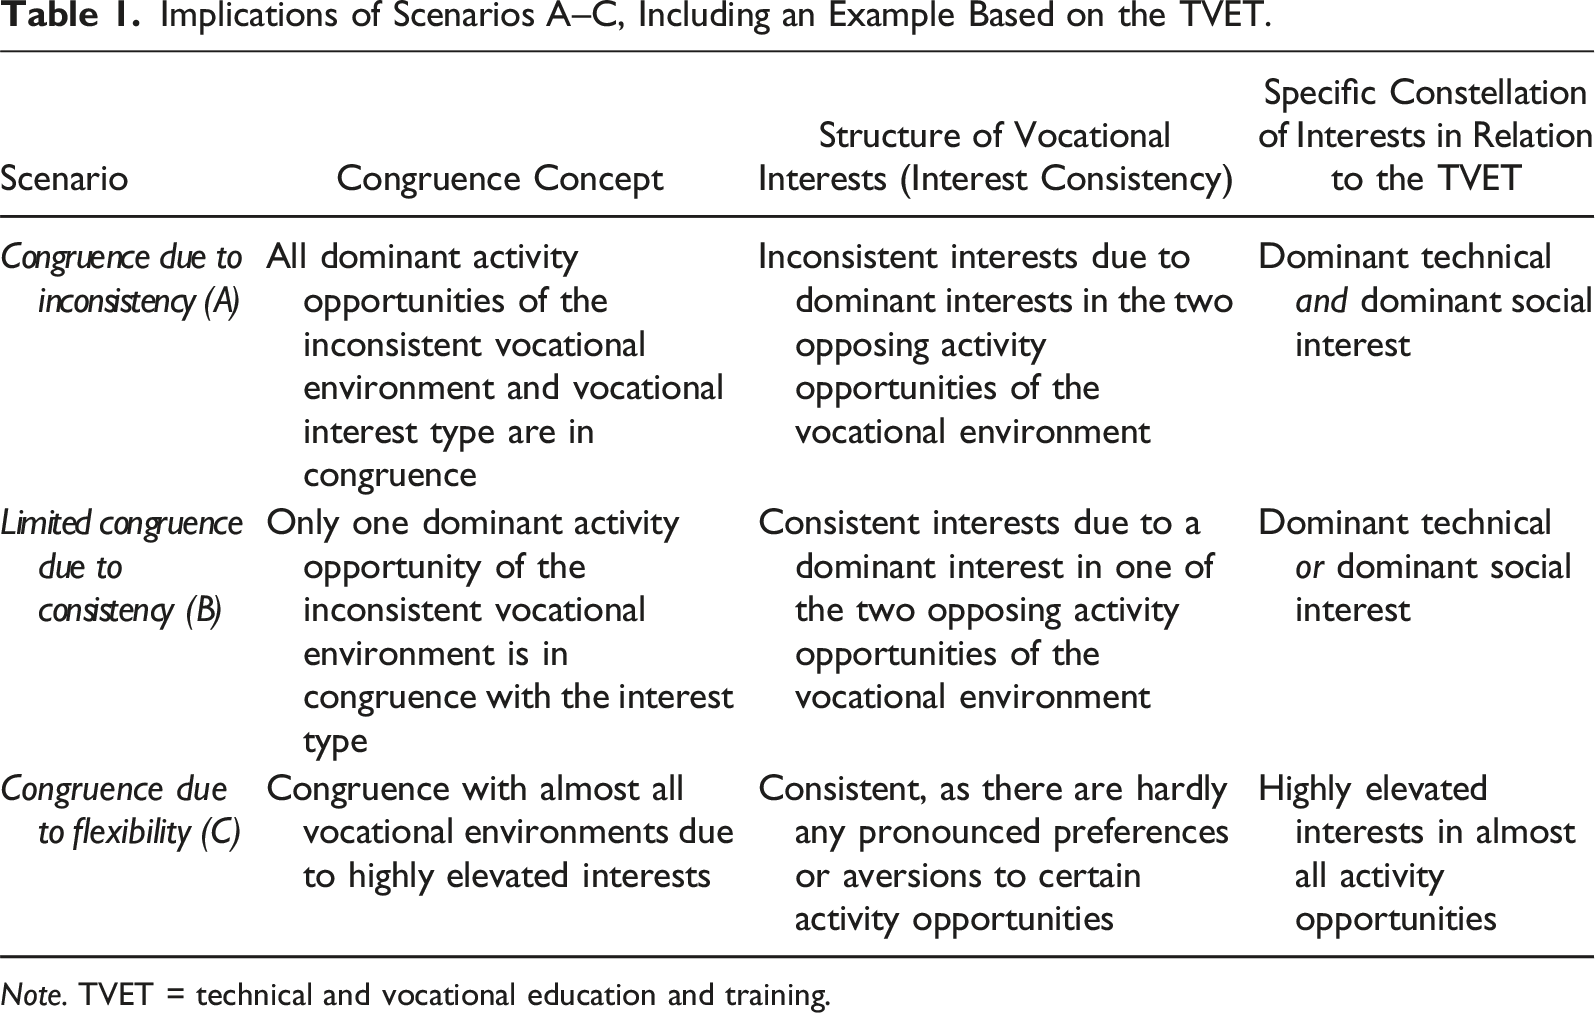
Note. TVET = technical and vocational education and training.
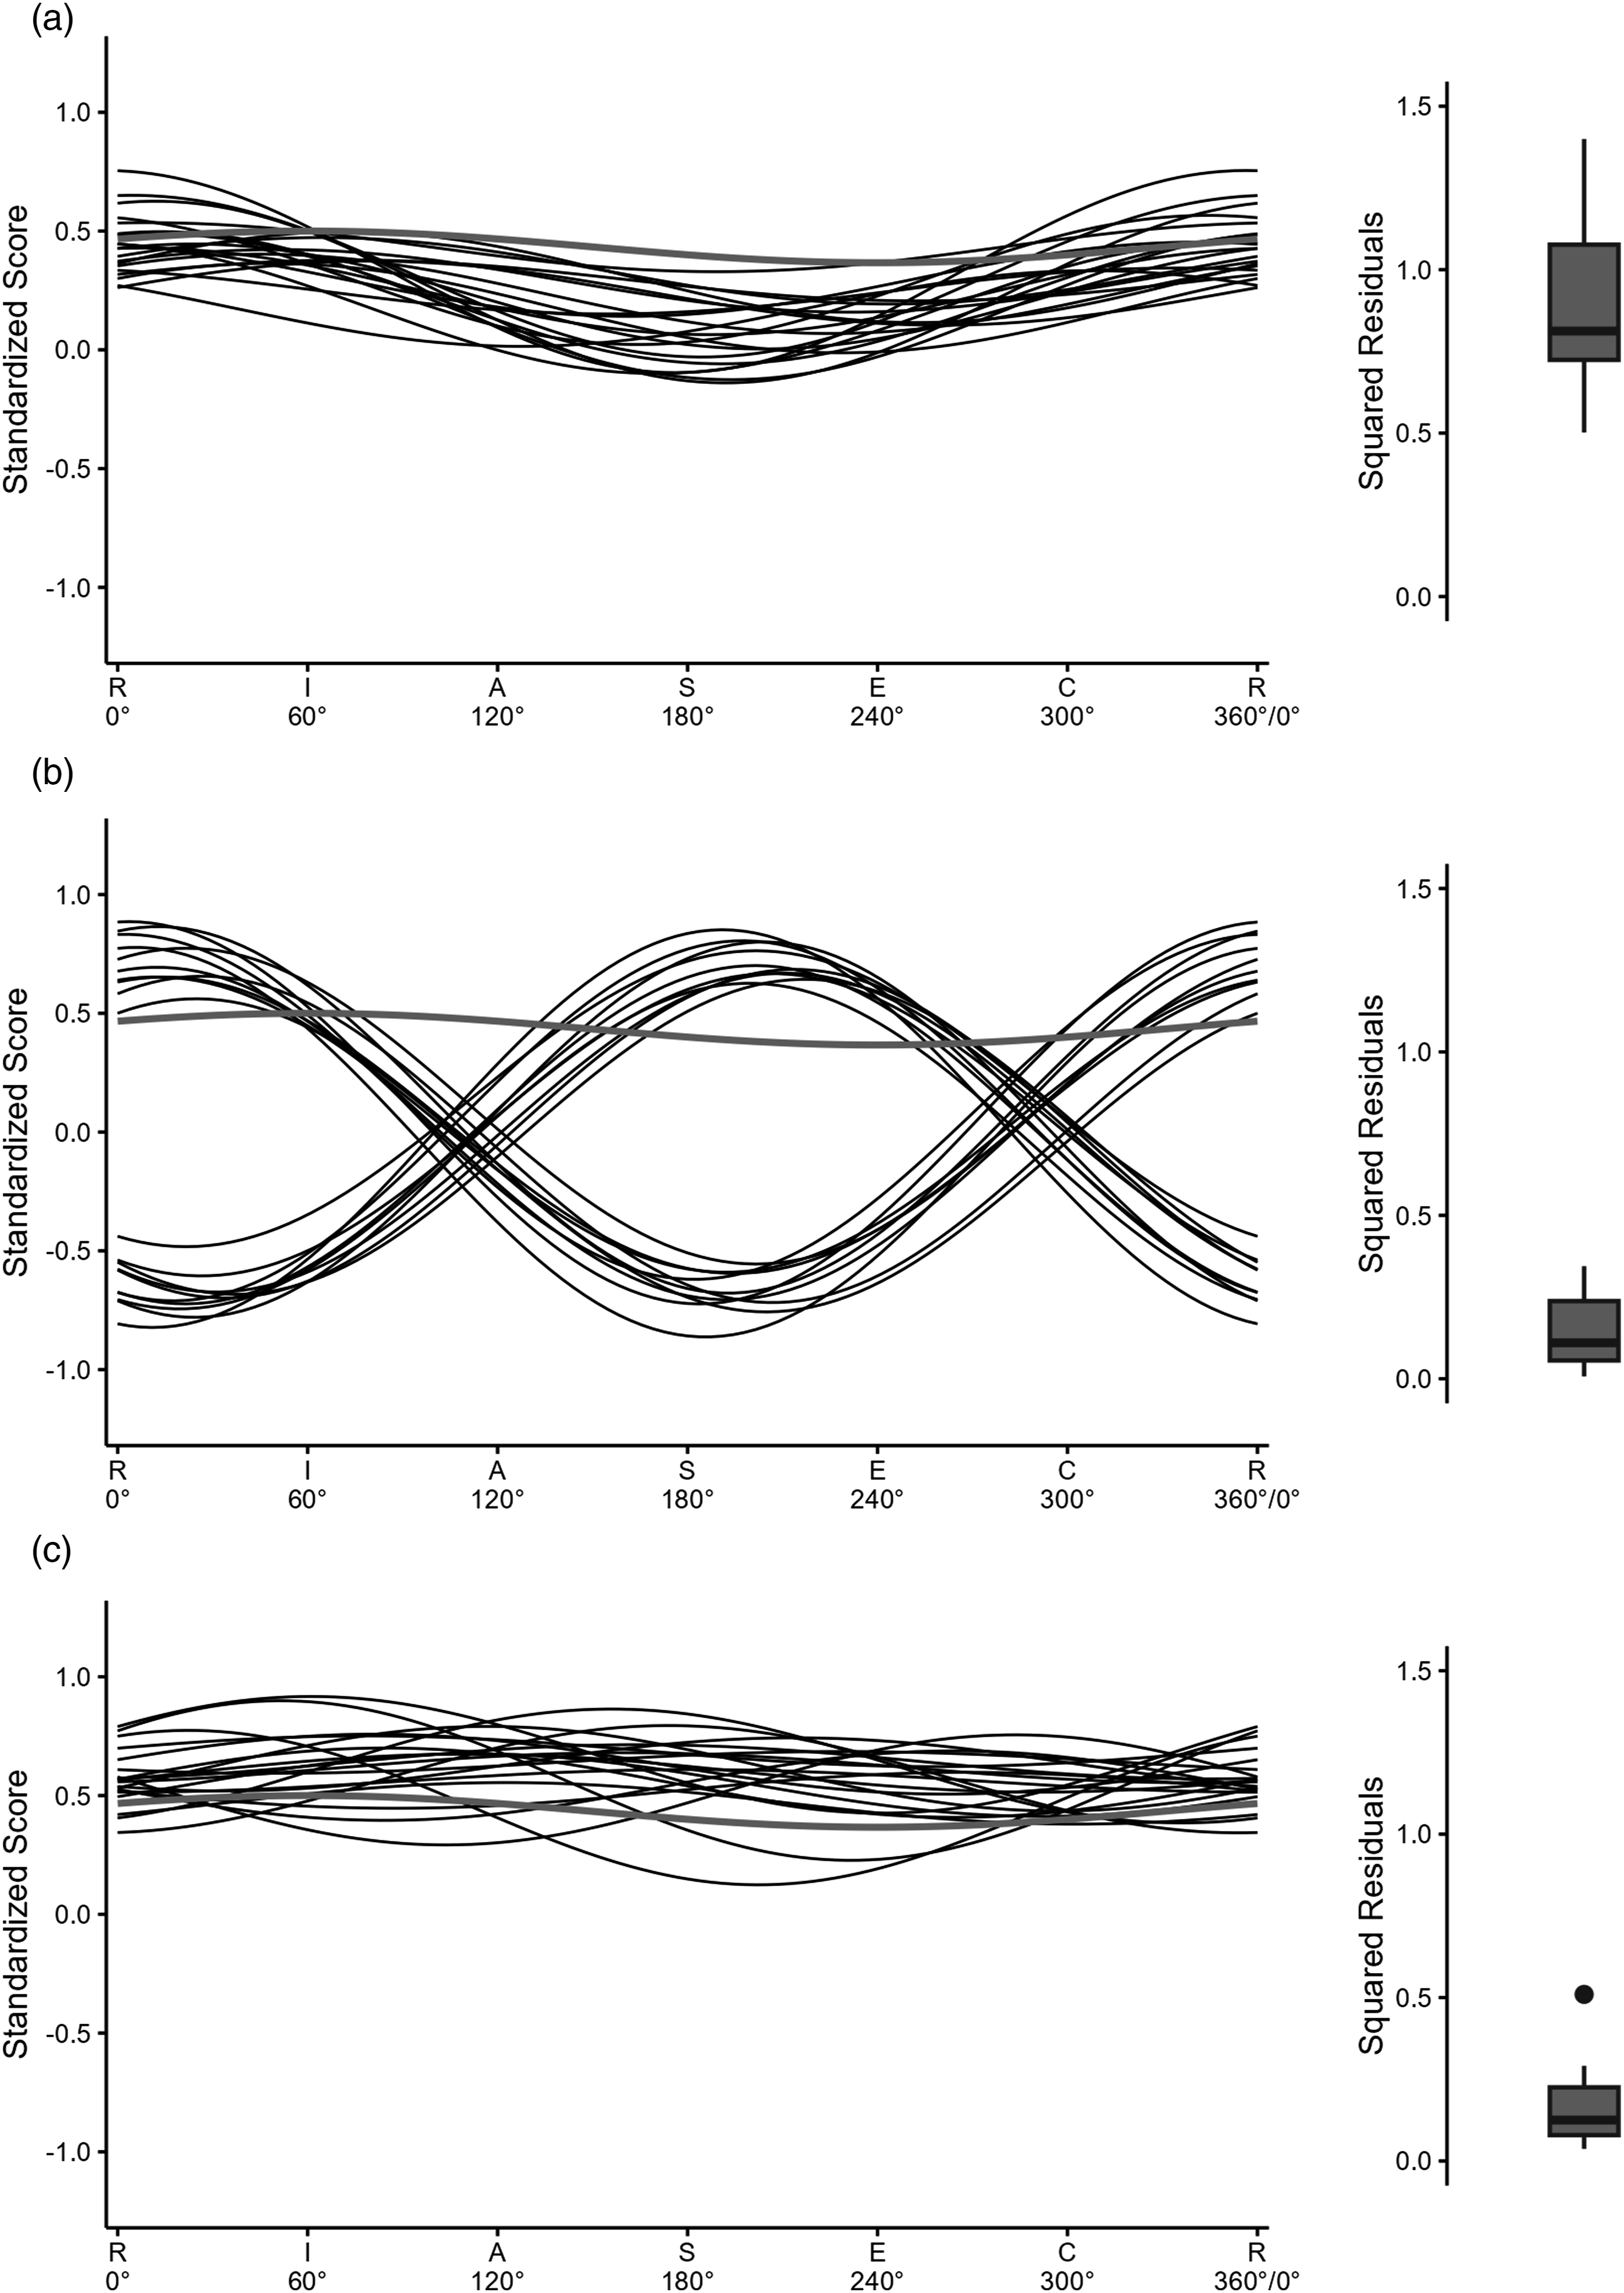
Representation of Prototypical Interest Profiles Based on Scenarios A–C. Note. Left panels: prototypical interest profiles (model-based) representing Scenarios A–C (black) with the activity profile of an exemplary inconsistent vocational environment (gray). Right panels: distribution of the squared residuals of the interest profiles representing Scenarios A–C. R = Realistic; I = Investigative; A = Artistic; S = Social; E = Enterprising; C = Conventional.
Scenario A (congruence due to inconsistency): The TVET students were expected to express dominant technical (R) and social (S) interests, thereby reflecting inconsistent activity opportunities in the TVET environment (Figure 2, upper panels). This implies that while vocational interests may be congruent with the environment, they are inherently inconsistent. Concerning the profile parameters, this suggests that the interest profiles should have lower profile consistency, as indicated by relatively large residuals (see Figure 2, right panels). Furthermore, due to inconsistent focal points of interest, the interest profiles are likely to exhibit reduced profile differentiation (see Figure 2, left panels).
Scenario B (limited congruence due to consistency): In this scenario, it was assumed that the TVET students would express either dominant technical (R) or social (S) interests (see Figure 2, middle panels), that is, corresponding interest profiles are only partially congruent with the TVET environment; however, they are consistent. This implies that the interest profiles should tend to be differentiated (see Figure 2, left panels) and consistent (see Figure 2, right panels). To ensure at least some degree of congruence, individuals with such interest profiles can align their maximum interests with only one of the two peaks of the environmental activity profile. As individuals strive to achieve the highest possible congruence while maintaining interest consistency, two groups of interest profiles with opposing profile orientations can be expected.
Scenario C (congruence due to flexibility): It was assumed that the TVET students would express strongly pronounced interests in nearly all RIASEC domains (see Figure 2, bottom panels). Individuals who exhibit a broad array of interests may find environments such as TVET particularly appealing due to the opportunities they offer for extensive engagement with a diverse range of activity opportunities. This interest flexibility is evident at a high level of profile elevation. A comparison of Scenarios A and C revealed subtle, yet notable, distinctions. Scenario C was distinguished by consistent interest profiles, while Scenario A was associated with inconsistent interest profiles (see Figure 2, right panels).
The Present Study
In the present study, we examined the question of what the interest profiles of individuals attracted to inconsistent environments look like. We aimed to allocate these individuals to one of three potential scenarios, thereby deriving statements regarding configuration of their interests. To this end, we collected data from a sample of TVET students and two comparison groups. The subsequent sections provide a comprehensive overview of the methodology underlying sample selection and the comparison groups’ configuration. This follows an outline of the analytical procedures.
To examine the scenarios’ plausibility, we focused on a vocational environment characterized by inconsistent activity opportunities based on RIASEC theory. For instance, the teaching profession combines subject-specific teaching content (e.g., STEM subjects aligned with R) with pedagogical activity opportunities (aligned with S). To maximize the aforementioned conflict, the TVET major was selected. This major prepares students for the teaching profession at vocational schools, offering an inconsistent environment by integrating both subject-specific technical teaching content (R) and pedagogical teaching activities (S). The technical and social activity opportunities represent the opposing poles of “things” and “people” on Prediger’s (1982) PT axis. Given that allocation of TVET students to the three scenarios was not determined by rigid metrics and allowed for interpretive flexibility, additional comparison groups from related fields were incorporated. These groups were selected based on their dominant activity opportunities, which align with one of the two opposing poles found in TVET: technical (R) or social (S) activity opportunities.
The decision to select TVET students and not TVET teachers as the sample for this study enabled inclusion of students from majors with substantial overlap with the TVET major as comparison groups. The measures used in the analyses were not based on specific metrics and allowed for interpretation flexibility, so inclusion of comparison groups facilitated a more nuanced interpretation of the results and further analytical options. The technical courses in the TVET major are shared with those in the engineering major, indicating considerable overlap in content. Moreover, the TVET major also shares courses with the vocational education major, which predominantly emphasizes pedagogical activity opportunities. The two comparison groups each represent one of the two predominant activity opportunities of the TVET and, simultaneously, one of the two poles on Prediger’s (1982) PT axis. We assumed that the engineering majors would express dominant technical activity opportunities (R), corresponding to the “things” pole on Prediger’s PT axis, and that the vocational education majors would express dominant social activity opportunities (S), corresponding to the “people” pole on the same axis. Therefore, it was presumed that the two comparison groups would facilitate representation of all interest domains deemed relevant to the TVET major.
Our assumption was that Scenario A (congruence through inconsistency) would be supported if the mean profile consistency in the TVET group is lower than in the comparison groups (Figure 2, right panels). Scenario B (limited congruence through consistency) entailed similar profile consistency levels across groups and overlapping profile orientation distributions. Scenario C (congruence through flexibility) necessitated similar profile consistency, but significantly higher profile elevations in the TVET group compared with A and B.
The group comparison results reflected aggregate-level data and did not provide insights into the proportion of TVET students whose interest profiles align with each scenario. To address this, we assigned each TVET student to a scenario based on their interest profile using adaptive mixture discriminant analysis (AMDA) with semi-supervised classification (Bouveyron, 2014; Cappozzo et al., 2020), in which class memberships of engineering and vocational education students were known, while TVET students were assigned to latent classes. This classification complements the aggregate-level analysis and reinforces the reliability of our evaluation of the three scenarios’ plausibility.
Method
Participants
The present study was conducted at two German universities (Technische Universität Dresden and University of Stuttgart). The sample comprised TVET students (n = 75) in these subject-related fields: mechanical engineering; electrical engineering; automotive engineering; information technology; and civil engineering. The first comparison group comprised engineering students (n = 354), and the second comparison group comprised vocational education students (n = 99), a major with predominantly pedagogical content. Data were collected in four cohorts during 2018–2020 (Gräber, 2018; Leon et al., 2018, 2021) through paper-pencil tests. The sample comprised 70% male and 30% female students; however, information on gender and age was missing for n = 207 participants. Notably, the sample contained a gender distribution of 47% women in TVET, 26% in engineering, and 78% in vocational education, corresponding closely to the typical distribution in these majors: 35% women in TVET; 25% in engineering; and 75% in vocational education (Universität Stuttgart, 2018).
To mitigate potential bias in the results from exclusion of students who have dropped out, students in their later semesters (i.e., ≥ 3rd semester) were sought for the sample. This approach was adopted in alignment with Heublein et al. (2017), which indicated that most dropouts occur within the first two semesters. Simultaneously, by incorporating students from later semesters, it can be assumed that these students likely would complete their studies and transition into their respective professional fields. This approach also ensured that these students have spent approximately the same amount of time in their chosen major. However, a significant difference was observed among the student groups in terms of age (TVET: M = 27.18, SD = 6.13; engineering: M = 21.19, SD = 2.05; vocational education: M = 25.89, SD = 3.72). This difference aligned with our expectations. Few TVET students choose this career path directly after general schooling (Ziegler, 2021), as many complete vocational training before starting their studies.
Measure
General Interest Structure Test (GIST-R)
The GIST-R (Bergmann & Eder, 2005) is a widely used instrument in German-speaking countries that is based on Holland’s (1997) RIASEC theory for assessing vocational interests and is viewed as having good structural and external validity (e.g., Nagy et al., 2010). The GIST-R items are nearly identical to those of the more recent GIST-3 (Bergmann & Eder, 2019). Etzel et al. (2016) further demonstrated the convergent validity of the GIST-R with the Personal Globe Inventory (Tracey, 2002), revealing a correlation of .90 for the Prediger axes.
The six interest domains (RIASEC) were measured by means of agreeing or disagreeing with corresponding activities, each with 10 items on a 5-point Likert scale (1 = not interested to 5 = very interested). The internal consistencies were good or very good throughout the six scales (Cronbach’s α = .80–.91). To evaluate the results properly, given the segregated sample, we conducted a standardization of the data using the full sample of the TOSCA-Repeat study (Trautwein et al., 2010). This was a representative study conducted in the context of the reorganization of the upper secondary school in 149 secondary schools of general education, as well as vocational high schools, in one federal state of Germany. The reference sample comprised 4694 students (age: M = 19.5, SD = .80; 54.6% female) who were in their final year of upper secondary education.
Statistical Analyses
Missing Data
Fortunately, the amount of missing values in the GIST (Bergmann & Eder, 2005) was very low in the entire sample (maximum 1.3% per variable). Given the consistent availability of complete scale data, it was feasible to calculate scale values based on mean values, as outlined by Enders and Little (2022). Therefore, a two-way imputation based on Sijtsma and van der Ark (2003) was conducted for the variables underlying the statistical analyses. For this purpose, we used the miceadds package (Robitzsch et al., 2021) in RStudio (RStudio Team, 2022).
Calculation of Profile Parameters
To compute profile parameters, we applied the structural summary method (SSM; Gurtman & Balakrishnan, 1998) to the coordinate weights PT and DI, as proposed by Prediger (1982). The SSM was developed for analysis of circumplex data and, therefore, also is used commonly in the context of research on vocational interests (e.g., Etzel et al., 2019; Nagy et al., 2019; Tracey et al., 2014; Warwas et al., 2009). Using the two coordinate weights (i.e., DI and PT), the SSM translates the interest profile’s vector representation (Figure 1, left panel) into an expected interest profile model (Figure 1, right panel). As can be seen in Figure 1 (right panel), the observed RIASEC values (black dots) result in an estimated interest profile (solid black cosine function) that resembles a shifted cosine function. This can vary based on the location of the profile orientation (
All analyses for this purpose were conducted using RStudio software (RStudio Team, 2022). In this way, individual interest profiles could be modeled as follows:
In equation (1), 


The profile differentiation results from the length of the resulting profile vectors, which could be determined by the squared coordinate weights PT and DI:
In equation (1),
In estimating profile similarity, it was assumed that similar interest orientations are expressed by a spatial proximity of the points defined by the coordinate weights DI and PT. The closer these are spatially, the more similar the interest profiles are. By describing the group-specific areas of the points under the assumption of a bivariate normal distribution with the help of area ellipses (Fox & Weisberg, 2019), statements could be made about the distribution of these. Thus, corresponding intersections of the ellipses indicate similar interest orientations of the respective groups. Furthermore, it can be assumed that statements about interest orientations’ similarity within a group can be made based on area proportions of the area ellipses. For the analyses, we used the RStudio (RStudio Team, 2022) package car (Fox & Weisberg, 2019).
The group differences for the profile parameters were tested using a Welch test, which is robust to violations in normal distribution, as recommended by Rasch et al. (2011). Due to the three subsamples, we also used a post-hoc test, and the different sample sizes necessitated that we follow Ruxton and Beauchamp (2017) and use the Games-Howell test. All statistical analyses assumed a critical error probability of p ≤ .05. For the analyses, we used the rstatix package (Alboukadel, 2021) in RStudio (RStudio Team, 2022).
Semi-supervised Classification of TVET Students to Scenarios A–C
To make statements regarding assignment of the TVET students to the scenarios described, we conducted an AMDA with semi-supervised classification. This approach was first proposed by Bouveyron (2014) and extended by Cappozzo et al. (2020) regarding real-world datasets’ growing complexity. While classical semi-supervised learning algorithms usually are unable to recognize new classes beyond the learning data, an AMDA facilitates semi-supervised classification to consider the case in which some subjects belong to a group that does not appear in the learning set. To detect unsupervised groups of observations in the test set and adapt the classifier to the new situation, AMDA combines unsupervised and supervised learning. To identify unobserved classes in the test set, both the learning and test samples are used to estimate model parameters. Estimation of the model parameters is based on various assumptions regarding the structure of each mixture component’s covariance matrix. For this purpose, different patterned covariance structures proposed by Banfield and Raftery (1993) and Celeux and Govaert (1995) were used. By treating data whose membership is unknown as missing data in likelihood specification, the unknown parameters were estimated using maximum likelihood estimations (Dempster et al., 1977). The test sample’s conditional probabilities were adjusted iteratively, while the learning sample’s conditional probabilities remained fixed. The results (number of classes) may depend on the assumed covariance structure (Banfield & Raftery, 1993; Celeux & Govaert, 1995), so a model comparison based on the robust information criterion (Cappozzo et al., 2020) was used. This is an adaptation of the well-known Bayesian information criterion (BIC; Estimating the dimension of a model, 1978) to conduct a robust model selection.
Based on this, we treated class membership of engineering and vocational education students as known and used both groups as learning samples, representing Scenario B (limited congruence due to consistency). The TVET students represented the test sample and were to be classified using the AMDA. The question was how many of the TVET students could be assigned to the classes of engineering or vocational education students (Scenario B) and how many comprised a separate class (Scenario A and/or C). For the involved analyses, we used the package raedda (Cappozzo et al., 2020) in RStudio (RStudio Team, 2022). To substantiate the findings, regardless of statistical assumptions, the analyses were reinforced through graphical representations.
Results
The findings comparing interest profiles between the TVET majors (inconsistent activity opportunities) and adjacent engineering and vocational education majors (consistent activity opportunities) are presented below. The following sections first outline the group-specific localization on the PT and DI axes. Next, the student groups’ profile parameters are compared (Welch test and Games-Howell post-hoc test). The subsequent step involves assignment of the TVET students to one of the three scenarios (A, B, or C) based on their interest profiles. This assignment was facilitated through an AMDA with semi-supervised classification (Bouveyron, 2014; Cappozzo et al., 2020).
Group-Specific Localization on People-Things and Data-Ideas Axes
Study Major-Specific Mean Values, Standard Deviations, and Results of Welch’s ANOVA for the Profile Parameters.
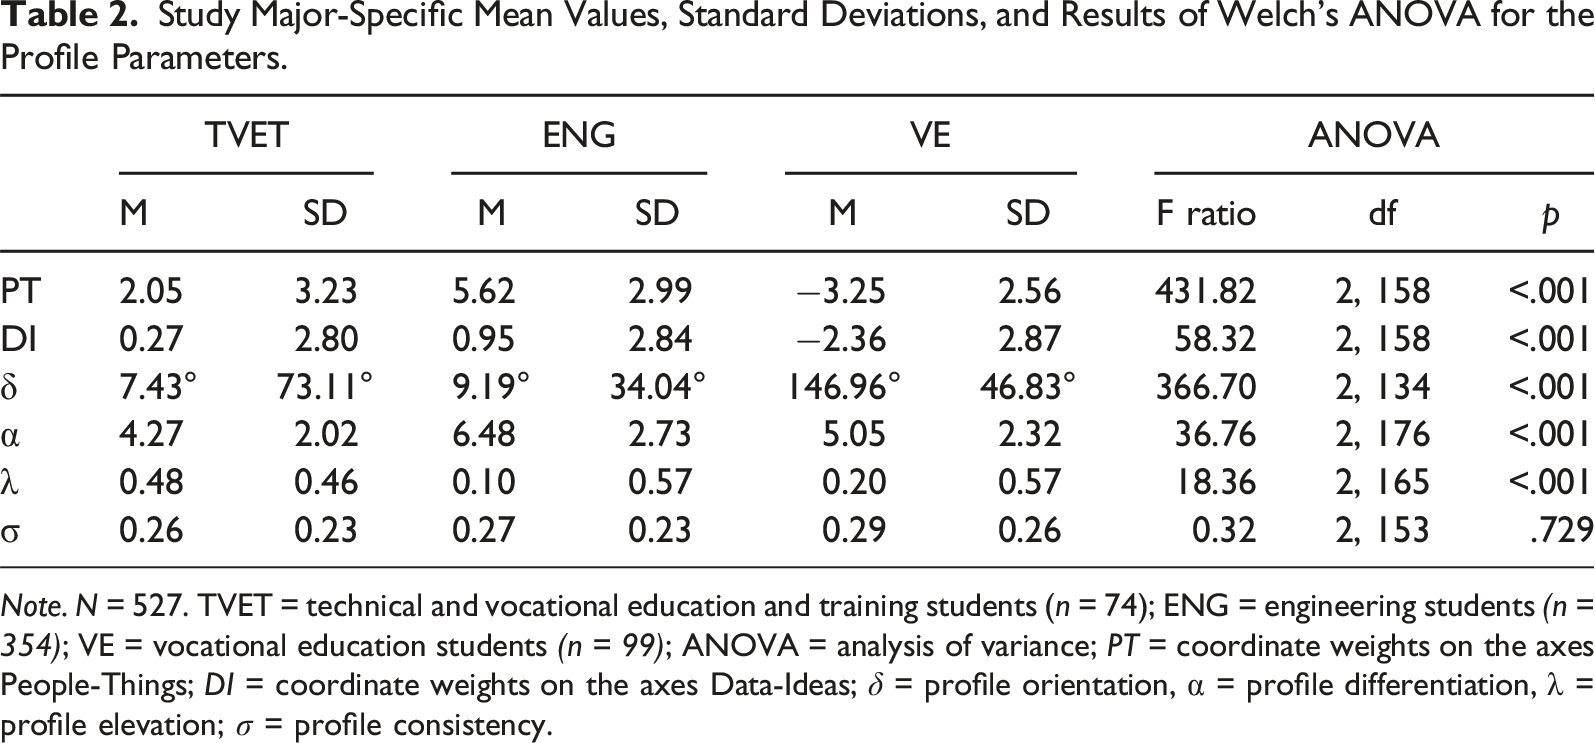
Note. N = 527. TVET = technical and vocational education and training students (n = 74); ENG = engineering students (n = 354); VE = vocational education students (n = 99); ANOVA = analysis of variance; PT = coordinate weights on the axes People-Things; DI = coordinate weights on the axes Data-Ideas;
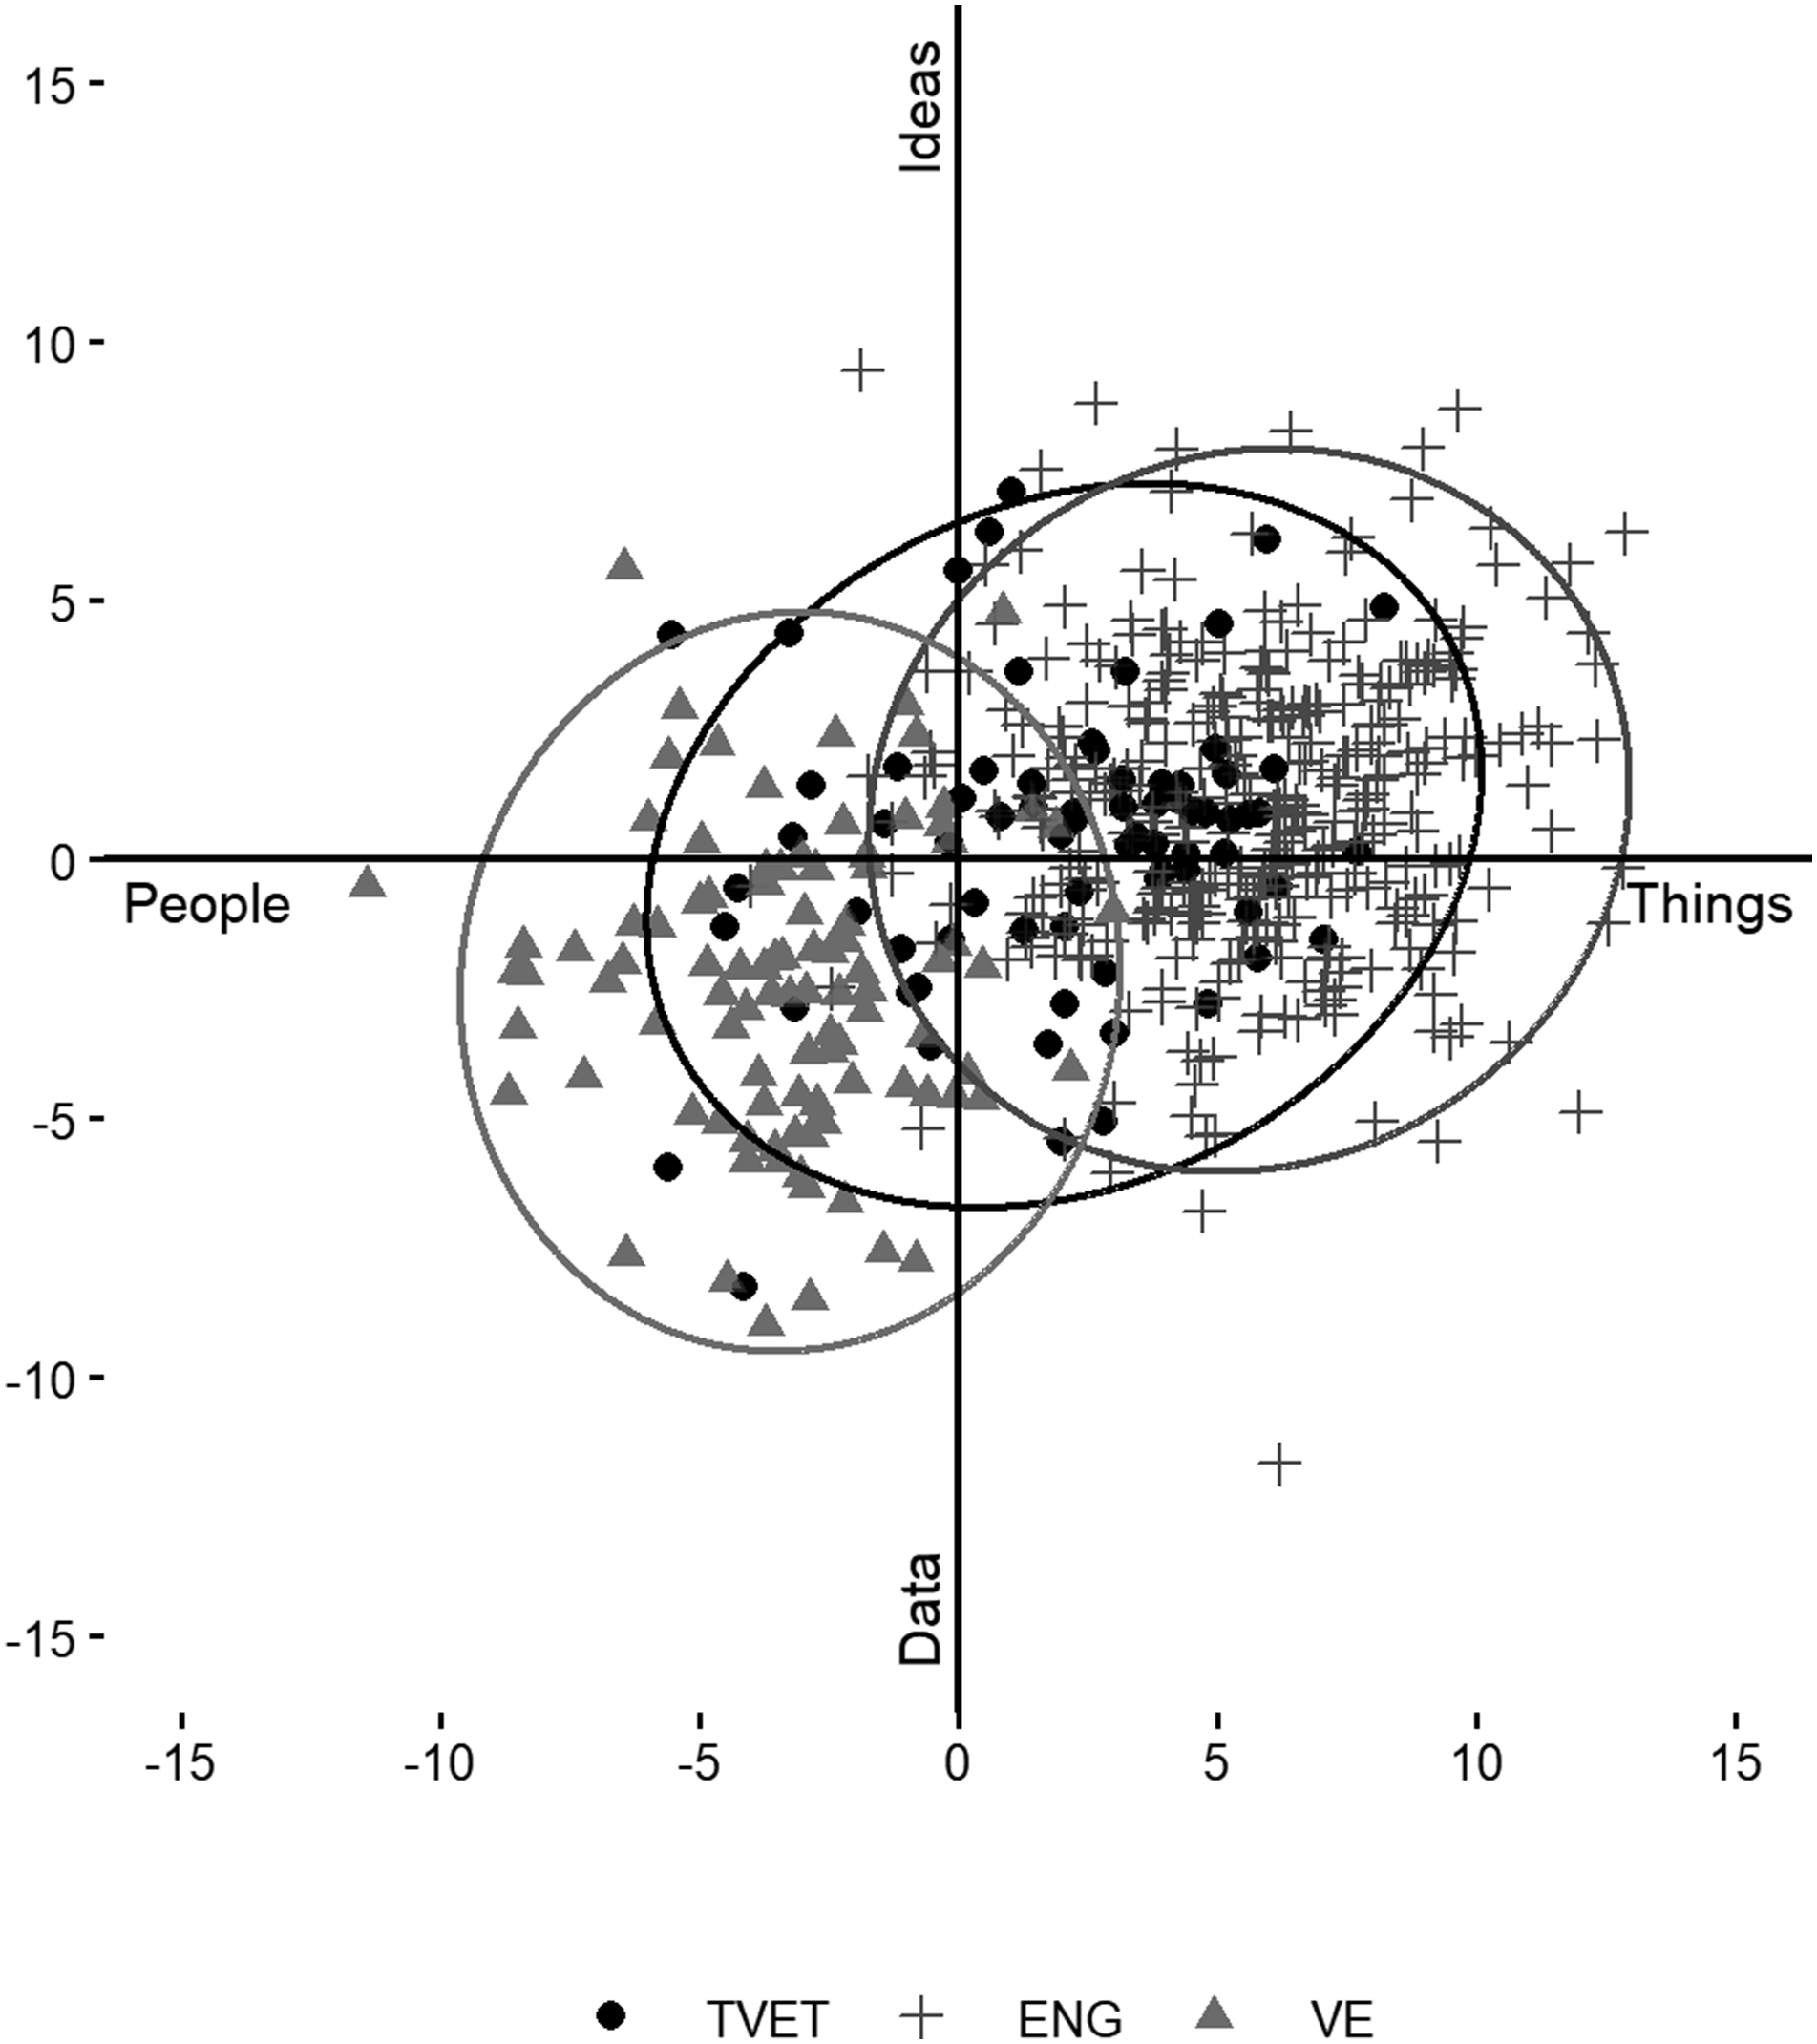
The Study’s Major-Specific Representation of Interest Profiles and the Resulting Area Ellipses. Note. The students’ profile orientations (N = 527) based on the coordinate weights Data-Ideas and People-Things based on the study major. TVET = technical and vocational education and training students (n = 74); ENG = engineering students (n = 354); VE = vocational education students (n = 99).
On the PT axis, TVET students displayed a slight preference for working with things, but this preference was significantly weaker (p < .001) compared with engineering students, while vocational education students exhibited a clear preference for working with people. The Games-Howell post-hoc test revealed significant differences (p < .001) between engineering and TVET students (3.57, 95% CI [2.61, 4.54]) and between vocational education and TVET students (−5.29, 95% CI [−6.37, −4.22]).
On the DI axis, similarly significant differences (p < .001) were identified among the groups. TVET students expressed no distinct preference on this axis and differed significantly (p < .001) from vocational education students (−2.36, 95% CI [−3.66, −1.60]), who expressed a marked preference for working with data. However, no significant differences (p = .143) were found between TVET and engineering students (0.68, 95% CI [−0.17, 1.54]), who exhibited a slight preference for working with ideas.
These results indicate significant differences (p < .001) in profile orientations (δ). While TVET and engineering students have similar profile orientations (δ), those of TVET and vocational education students are almost diametrically opposed. The axis-specific distribution of the groups is presented in Figure 3, indicating that most TVET students are clustered near the coordinate origin. However, the comparison groups are positioned as opposites on the PT axis.
Group-Specific Comparison of Profile Parameters
All findings related to the group-specific comparison of profile parameters’ localization are presented in Table 2 and illustrated in Figure 4(a)–(c). A closer examination of the profile parameters reveals differences between the groups. Distribution of the Profile Parameters. Note. Panel (a): profile differentiation from TVET (black, solid), ENG (gray, long dash), and VE students (gray, dotted). Panel (b): profile elevation from TVET (black, solid), ENG (gray, long dash), and VE students (gray, dotted). Panel (c): profile consistency from TVET (black, solid), ENG (gray, long dash), and VE students (gray, dotted).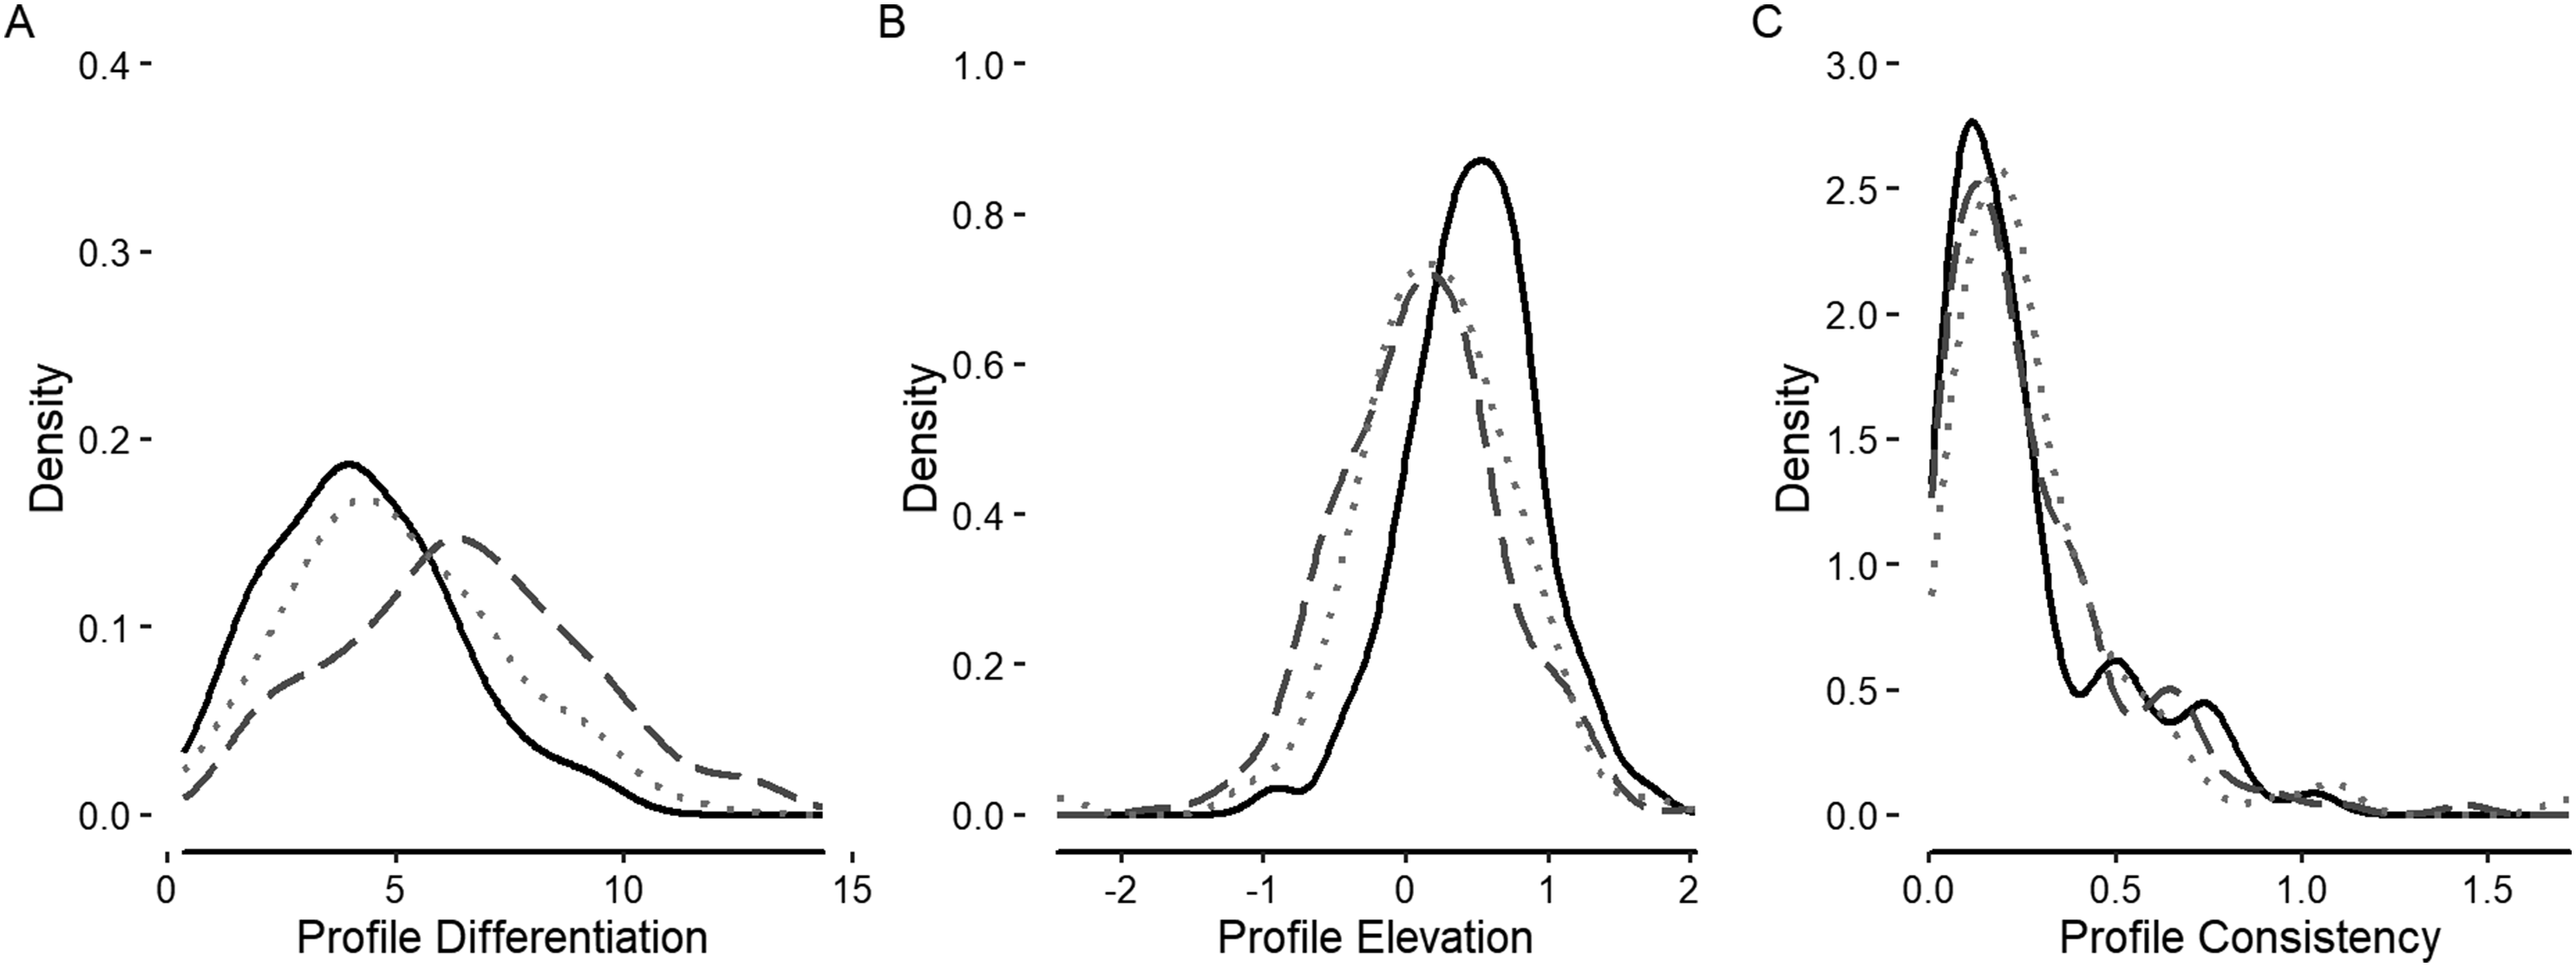
Significant group differences were observed for profile differentiation (α; p < .001). TVET students’ interest profiles were the least differentiated, differing significantly from those of engineering students (2.21, 95% CI [1.56, 2.86]). However, no significant difference was found between vocational education and TVET students (p = .051; 0.78, 95% CI [0, 1.56]). As presented in Figure 4(a), these differences appear to stem from a slight shift in the TVET sample’s distribution.
In terms of profile elevation (λ), TVET students exhibited the highest average values. These differences were statistically significant (p < .001) compared with both vocational education students (0.28, 95% CI [0.47, 0.09]) and engineering students (0.37, 95% CI [0.52, 0.23]). Figure 4(b) indicates that these differences are attributable to slightly higher profile elevation levels across nearly the entire TVET sample, rather than being driven by a subset of students with exceptionally high values.
However, profile consistency (σ) exhibited no substantial group-specific disparities (p = .729). Moreover, the consistency measures’ group-specific distributions (Figure 4(c)) demonstrated no significant variations.
Profile Parameter-Based Classification of TVET Students to Scenarios A–C
The aggregate-level analyses presented here address the conclusions that can be drawn regarding Scenarios A–C. The three groups do not differ in terms of profile consistency (σ; p = .729), so Scenario A (congruence due to inconsistency) appears to have limited relevance in the sample.
Instead, the approximately equal distribution of profile consistencies and substantial overlap in the distribution of individual profile orientations of TVET students with those of the comparison groups (Figure 3) suggest the relevance of Scenario B (limited congruence through consistency). The observed differences in coordinate weights along the PT (p < .001) and DI (p < .001) axes, attributable to the TVET’s opposing activity foci, are consistent with these findings.
Furthermore, Scenario C (congruence due to flexibility) also appears plausible. While profile consistencies did not differ between groups, TVET students displayed significantly higher profile elevation (flexibility of interest) than the comparison groups (p < .001). The pronounced differences in profile differentiation (α; p < .001) between student groups further support Scenario C’s potential relevance.
At this stage, it is not yet possible to distinguish clearly between Scenarios B and C, as they may reflect overlapping characteristics within a single group, rather than two distinct groups. Likewise, Scenario A cannot be ruled out entirely because some individuals in the sample appear to exhibit low profile consistency (see Figure 4(c)). To better understand these scenarios’ relevance for TVET choice, we now turn to classificatory analyses, which are expected to offer further insights into each scenario’s prevalence within the TVET group and refine our understanding of vocational interest profiles’ underlying patterns.
Semi-supervised Classification of TVET Students to Scenarios A–C
Means, Standard Deviations, and Welch’s ANOVA for Profile Parameters Across the Proposed Classes of TVET Students.
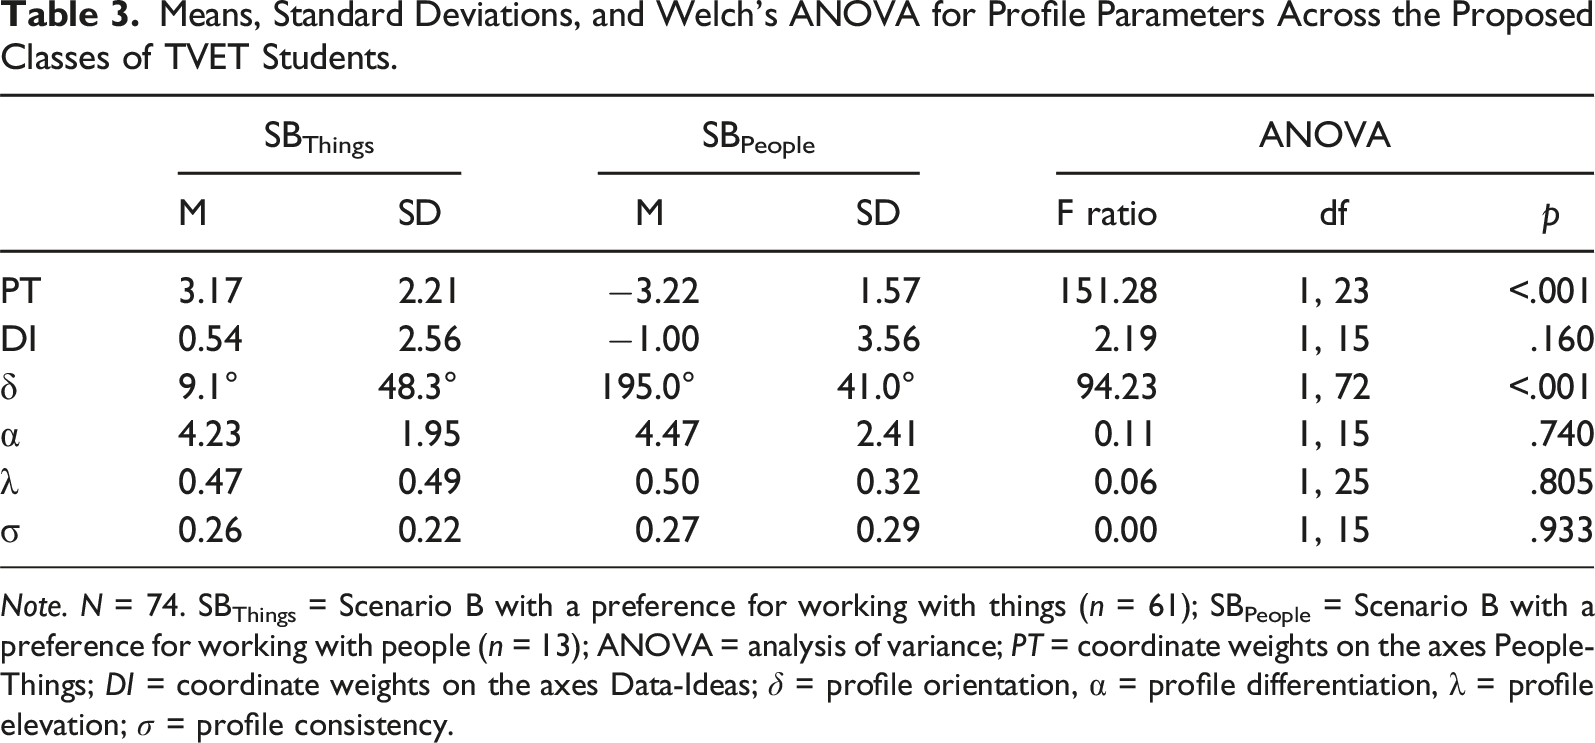
Note. N = 74. SBThings = Scenario B with a preference for working with things (n = 61); SBPeople = Scenario B with a preference for working with people (n = 13); ANOVA = analysis of variance; PT = coordinate weights on the axes People-Things; DI = coordinate weights on the axes Data-Ideas;
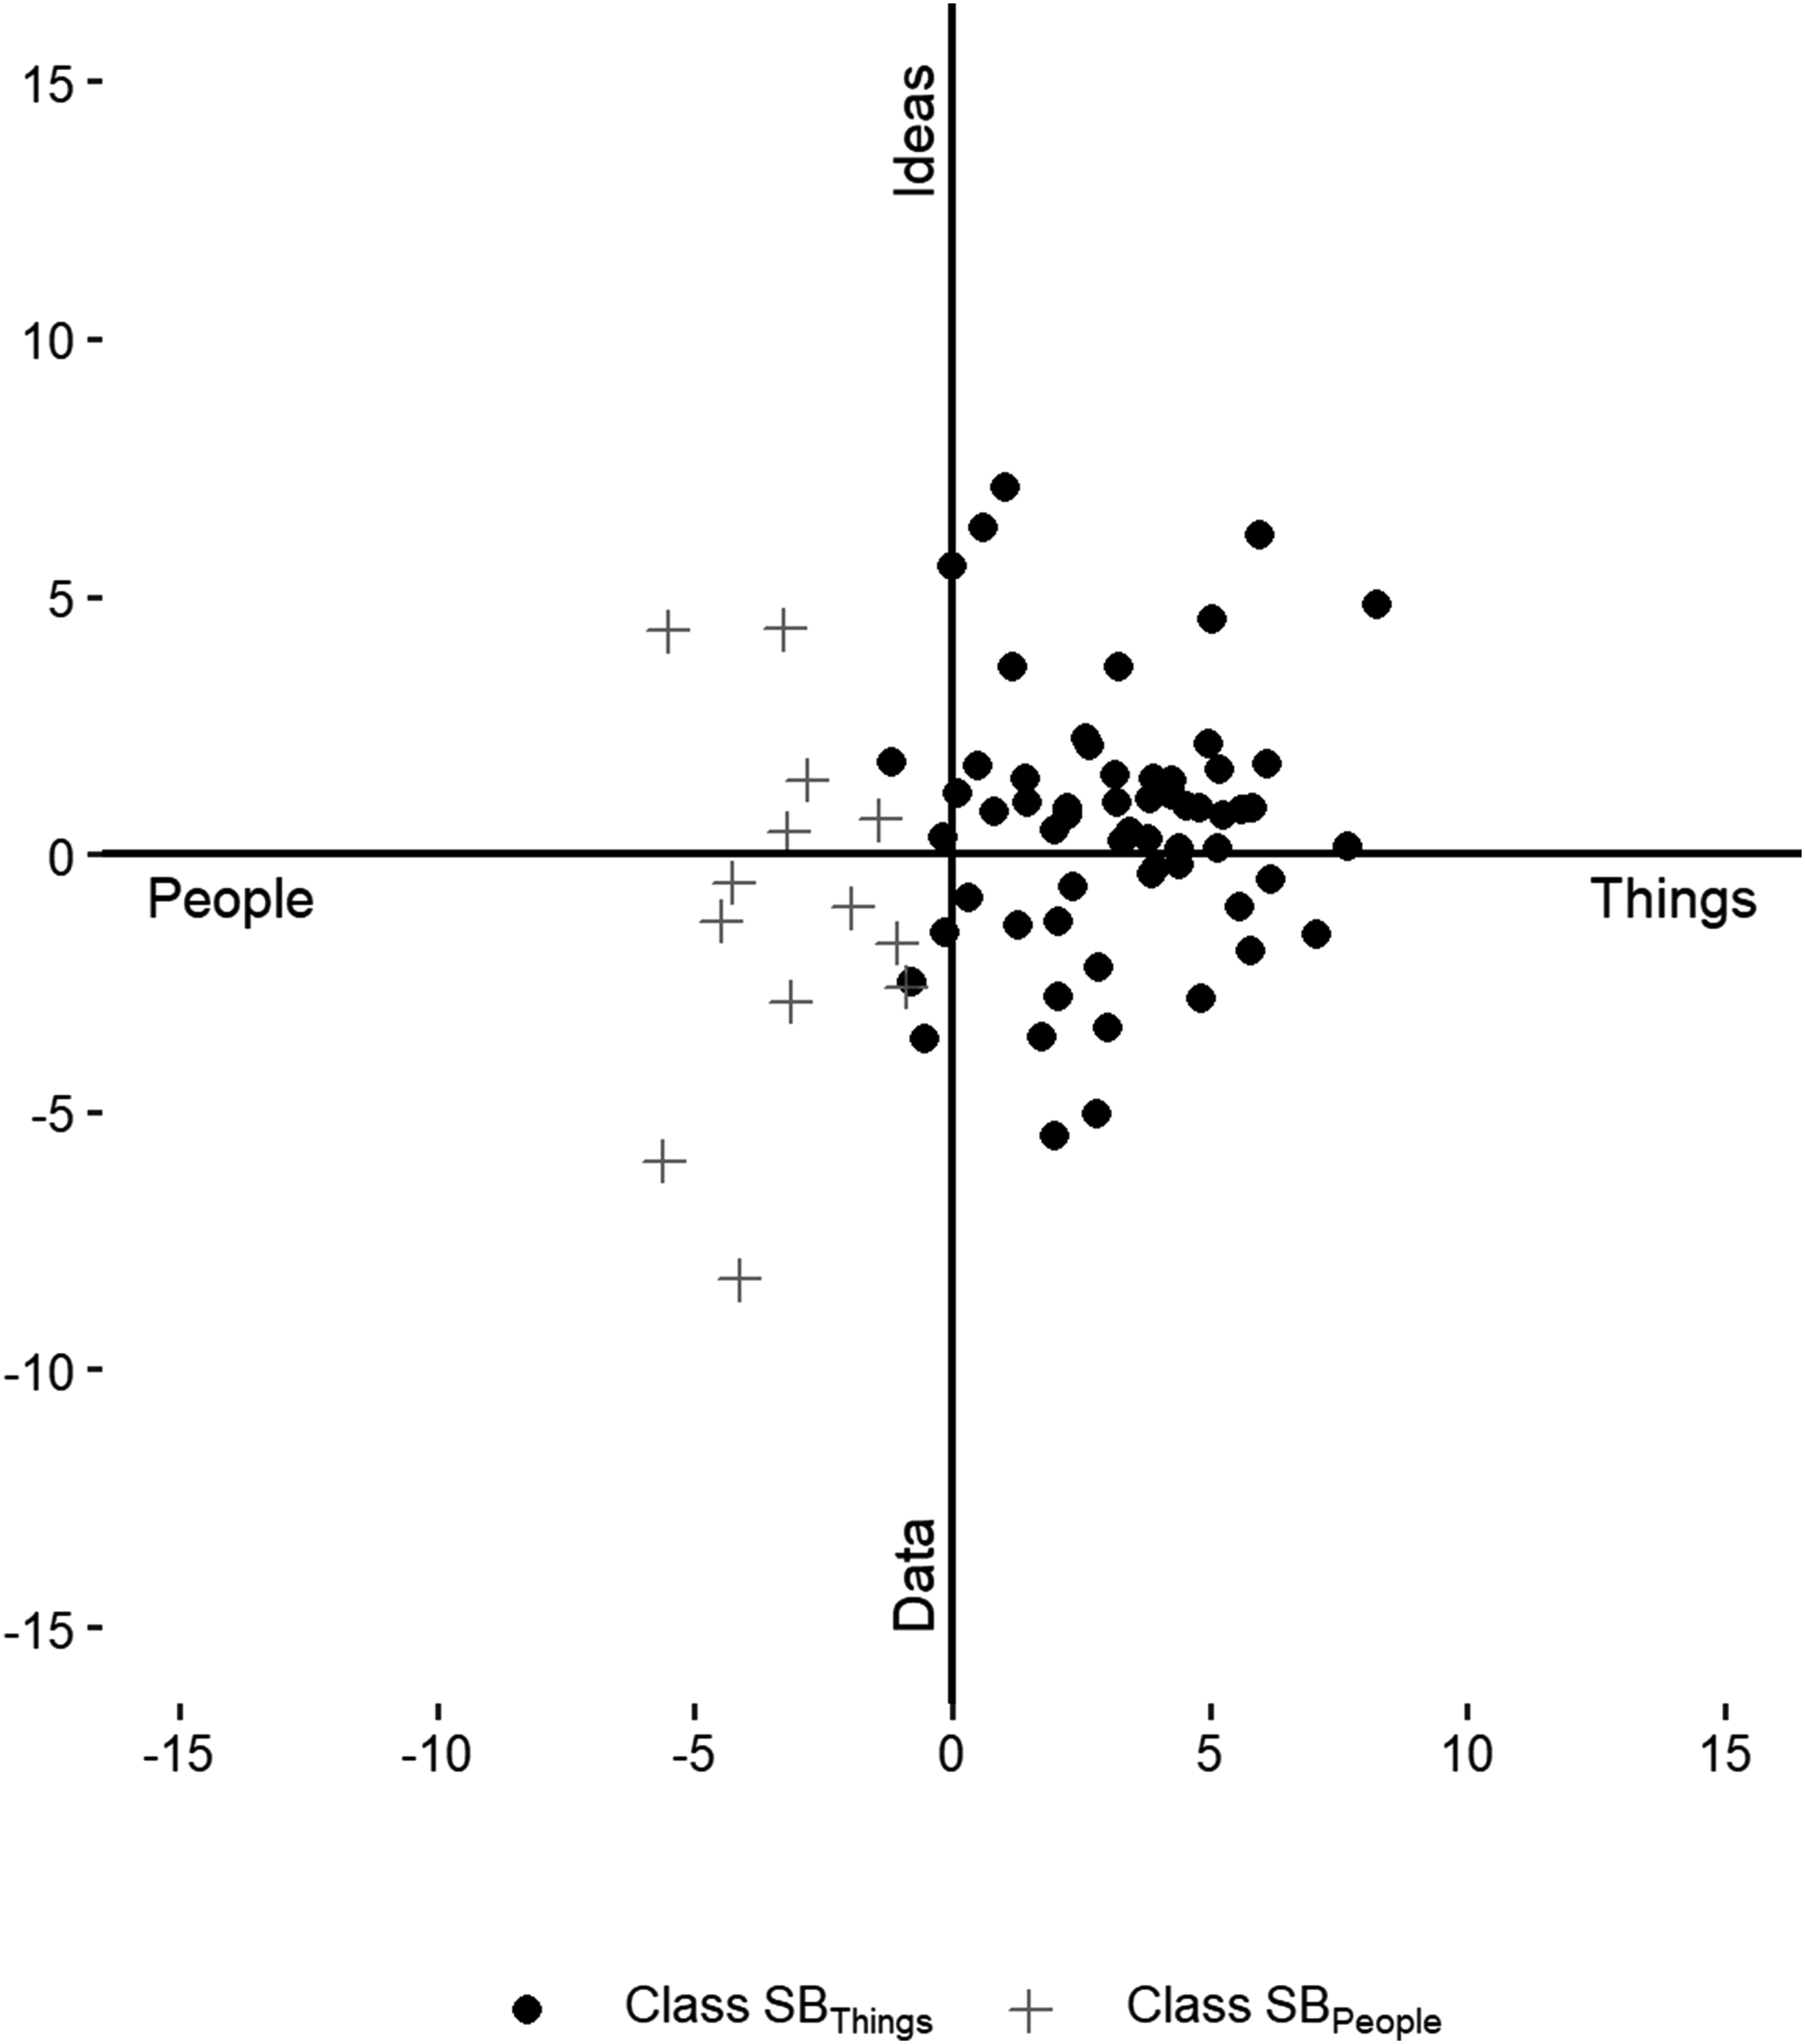
Class-Specific Representation of Interest Profiles. Note. Profile orientations of TVET students (N = 74) based on the coordinate weights Data-Ideas and People-Things based on the class assignment proposed by semi-supervised classification (Bouveyron, 2014; Cappozzo et al., 2020). SBThings = class based on Scenario B, with a preference for working with things (n = 61); SBPeople = class based on Scenario B, with a preference for working with people (n = 13).
Notably, the model consistently identified only two latent classes, indicating that no additional hidden classes were detectable within the TVET sample. This finding supports the results’ robustness and suggests that all TVET students likely align with the classes represented by the engineering or vocational education learning samples, thereby largely supporting Scenario B (limited congruence due to consistency).
The two proposed classes, SBThings (Scenario B with a preference for working with things, represented by engineering students) and SBPeople (Scenario B with a preference for working with people, represented by vocational education students), had proportions of 0.794 (n = 61) and 0.206 (n = 13), respectively. The two identified classes’ interest profiles revealed almost opposite profile orientations (δ; p < .001), primarily due to their differing positions along the PT axis (p < .001). A visual representation of both classes on the Prediger axes further confirmed this class-specific arrangement of profile orientations (see Figure 5). Notably, no statistically significant differences were found between the two classes along the DI axis (p = .160). Both classes exhibited similarly distinct profile parameters, as indicated by profile differentiation (α; p = .740), profile elevation (λ; p = .805), and profile consistency (σ; p = .933). Notably, however, both classes demonstrated slightly weaker profile differentiation (α) compared with the engineering and vocational education students in the training set (SBThings: M = 4.23, SD = 1.95; SBPeople: M = 4.47, SD = 2.41; engineering: M = 6.48, SD = 2.73; vocational education: M = 5.05, SD = 2.32). A similar pattern was observed for profile elevation (λ), in which both SBThings (M = 0.47, SD = 0.49) and SBPeople (M = 0.50, SD = 0.32) exhibited slightly higher values compared with the engineering students (M = 0.10, SD = 0.57) and vocational education students (M = 0.20, SD = 0.57).
Discussion
This study examined the configuration of vocational interests among individuals within inconsistent environments. To address this, three scenarios have been proposed, based on RIASEC theory, to describe potential strategies for navigating such inconsistent environments: (A) interest profiles that are congruent with activity opportunities, but inconsistent; (B) interest profiles that are consistent, but only partially congruent with activity opportunities; and (C) highly elevated interest profiles that could align with most activity opportunities.
Using the structural summary method (SSM; Gurtman & Balakrishnan, 1998), we analyzed the interest profiles of students across three university majors. The study’s primary objective was to utilize these scenarios to better understand how vocational interests are structured within inconsistent vocational environments. Student teachers majoring in TVET were assigned to these scenarios based on their vocational interest profiles. To contextualize these findings, a comparative analysis was conducted of the TVET students’ interest structures against those of engineering and vocational education students—two majors characterized by consistent activity opportunities. Our findings suggest that in contexts characterized by inconsistently structured activity opportunities, individuals predominantly exhibit domain-specific or limited congruence to one of the two opposing activity opportunities, according to Scenario B. Furthermore, individuals in these contexts demonstrated weaker profile differentiation and higher profile elevation, with no significant differences in profile consistency, according to Scenario C. These results suggest that, in vocational choices made within inconsistent vocational environments, the congruence concept may play a less dominant role.
Theoretical Implications
Our findings pose implications for central elements of RIASEC theory (Holland, 1997), the congruence concept, and the calculus hypothesis. In terms of the congruence concept, the question arises as to why individuals do not choose a vocational environment that will enable them to achieve more than limited or domain-specific congruence. Our study suggests that two profile parameters may be of particular importance against this backdrop: profile elevation and profile differentiation. The density plots (Figure 4(a)–(c)) indicated that profile elevation is more pronounced for a considerable number of TVET students, while profile differentiation is less pronounced for some TVET students. Holland (1997) already suggested that individuals with a high profile elevation are more flexible and better able to adjust to diverse vocational environments. Individuals with a higher profile elevation or interest flexibility may be better able to cope with an inconsistent vocational environment. However, in terms of profile differentiation, Holland (1997) suggested that individuals with lower profile differentiation may struggle to develop clear vocational preferences, which could lead them to favor vocational environments with weaker or less-defined dominant activity opportunities. Consequently, profile differentiation is viewed as a measure of profile clarity (e.g., Tracey et al., 2012). Therefore, it may be easier for individuals with less profile differentiation to achieve satisfactory congruence with inconsistent vocational environments, as their dominant activity opportunities are opposed and, thus, less clearly defined. This implies that in this case, predominant profile orientation may be less relevant for vocational choice due to weaker profile differentiation. We also can assume that fewer activity opportunities will be rejected due to the higher level of profile elevation. Thus, it is conceivable that people with related interest profiles tend to match only in the domains relevant to them, as it is difficult for them to achieve complete congruence. Thus, the study’s results support Holland’s (1997) assumption that environments with inconsistently structured activity opportunities are less restrictive in terms of concretely defined interest profiles. Therefore, they may be particularly attractive to people with higher elevated and/or less differentiated interest profiles.
Furthermore, the congruence concept’s subordinate relevance implies that in environments with inconsistently structured activity opportunities, we can assume that individuals with opposing interest orientations are present, that is, the predominant interests of individuals in vocational environments with inconsistent activity opportunities are focused on one of the two opposed (inconsistent) activity opportunities in the inconsistent environment. This is surprising because RIASEC theory (Holland, 1997) assumes that individuals within certain vocational fields should be characterized by similar vocational interest profiles, which also is supported widely by vocational interest profiles’ importance in the context of major choice (e.g., Le et al., 2014; Perera & McIlveen, 2018).
The present study offers implications for the calculus hypothesis, indicating that even in inconsistent environments, most individuals exhibit interest profiles that conform to the circumplex. This is notable because the sample was chosen deliberately from a vocational environment with inconsistent activity opportunities, thereby further supporting a key assumption of Holland’s (1997) theory. Furthermore, our findings can be interpreted as additional evidence that Prediger’s (1982) DI and PT dimensions are central to vocational interests and remain relevant regardless of the specific vocational context. This is interesting because alternative taxonomies of interest increasingly are being proposed to better reflect today’s world of work (e.g., Su et al., 2019).
Practical Implications
Our findings also pose several practical implications, particularly regarding the limited congruence between the vocational environment and individual interests, which is viewed widely as crucial for job performance and satisfaction (Holland, 1997).
First, as already mentioned, it is assumed that individuals with limited interest differentiation struggle to find a suitable work environment. Savickas (2020) even emphasized that inconsistent interest patterns can shape a person’s perspective on life profoundly, often leading to confusion about work, leisure, and relationships. In this context, affected individuals may find inconsistent environments more fitting, as these settings—with their limited range of consistent and explicit activity opportunities—may align better with their unique interest profiles than environments characterized by clearly defined activity opportunities. Career practitioners could encourage their clients to search for corresponding activities explicitly, or they could review job ads and evaluate various aspects of the position through the RIASEC lens. In this context, Prediger’s (1982) dimensions could be used explicitly to examine career options that are inconsistent but might be attractive given the individual’s interest profile. In doing so, one could address the conflict among different activity opportunities/demands explicitly.
Second, a vocational environment with inconsistent activity opportunities entails the presence of opposing activity opportunities (e.g., technical and social). As a result, consistent and differentiated interest profiles can align with only one of these opportunities. Our research suggests that such environments likely include individuals with opposing interest orientations (in this case, technical or social interests). For lecturers, this means that students with different interest orientations within a single major may exhibit varying engagement or interest levels in their lectures. Our findings also highlight the potential consequences from a lack of congruence between individual interests and the environment. Extant research linking congruence to academic success (Tracey et al., 2012) underscores its importance for academic achievement. Furthermore, studies in vocational contexts (e.g., Nye et al., 2017) suggest that interest congruence predicts vocational performance and career choice stability (Donohue, 2006). Therefore, higher performance variance is expected in majors with inconsistent activity opportunities compared with those with consistent ones. Lecturers in such majors should be aware of the challenges posed by inconsistent activity opportunities, particularly regarding potential dropouts.
Limitations and Future Directions
This study has several limitations that should be considered in future research, both in terms of methodology and in addressing open research questions.
First, the sample-specific details—including participants’ age, time spent in their major, and gender—may influence the findings. While missing values’ impact on the research questions and analyses was presumed to be negligible due to the research questions’ independence from gender, a more thorough examination of potential gender-specific biases in the data would benefit future studies.
Second, gathering assessments from participants or teachers on their perceptions of the selected vocational environment would be beneficial. The less-pronounced identity of inconsistent vocational environments raises the possibility of an association with more varied perceptions of the vocational environment. The study’s fundamental supposition—namely, that TVET comprises both person-related and thing-related activity opportunities—has been substantiated predominantly to date by the configuration of the TVET major (KMK, 2016) and anecdotal evidence from individual teachers’ experiences.
The very conscious sample selection refers to a numerically very small course of studies, so that further research with more diverse and larger samples is needed to generalize the findings. For this purpose, analyses in further majors associated with inconsistent activity opportunities—such as physics or mathematics teacher education, healthcare, or managing social institutions—would be conceivable. Simultaneously, an extension of the analyses to other universities would be desirable. Moreover, the findings’ applicability to real-world contexts beyond the university environment remains to be examined.
Our findings also suggest that individuals’ interest profiles are structured mostly based on the circumplex, resulting in limited interest congruence and the presence of opposed interest orientations (R respectively S) within the same vocational group. This is highly interesting and raises the question of the implications from this lack of congruence within inconsistent vocational environments. Potentially, factors such as values, work–life balance, and other aspects may play a more significant role, especially in inconsistent environments. According to the current state of research, interest congruence is related to academic success (Tracey et al., 2012), vocational performance (e.g., Nye et al., 2017), or stability of career choice (Donohue, 2006). Therefore, future studies in the context of inconsistent vocational environments should consider appropriate covariates, such as satisfaction, retention intentions, and persistence in vocational environments.
Footnotes
Declaration of Conflicting Interests
The author(s) declared no potential conflicts of interest with respect to the research, authorship, and/or publication of this article.
Funding
The author(s) received no financial support for the research, authorship, and/or publication of this article.