
Abstract
Dropping out of college is often linked to insufficient academic or psychosocial readiness. Therefore, assessing students’ readiness, preferably before they begin their first year of college, may help identify those at risk of dropping out. The present study aimed to develop and test a multidimensional measure that assesses psychosocial factors promoting student persistence. The Psychosocial Readiness for College questionnaire (PRCq) aims to assess the readiness of students who have deferred entering college to their twenties and comprises six dimensions: Academic Self-Efficacy, Educational Commitment, Social Comfort, Campus Engagement, Self-Discipline, and Resilience. The PRCq was administered to five cohorts of first-year college students in Israel (N = 7,382). The PRCq demonstrated good psychometric properties, and exploratory and confirmatory factor analyses supported its six dimensions. The PRCq demonstrated measurement invariance across age, gender, SES, first vs. non-first-generation students, and institution type. The PRCq’s construct validity was supported by the negligible associations between the scale scores and high-school GPA and pre-college scholastic aptitude test, and the pattern of associations with the Big-5 personality factors. The PRCq’s predictive validity was supported by the student dropout rate after one year. Implications for students at risk of dropping out and interventions to decrease this risk are discussed.
Keywords
Introduction
Attaining a college degree facilitates the graduates’ integration into the world of work (Grebennikov & Shah, 2012; Van Rhijn et al., 2016). College graduates are more likely than non-graduates to achieve higher rates of employment and income and, consequently, make higher tax payments to the state (Ma et al., 2016). College retention rates have attracted the attention of researchers and policymakers (e.g., Ajayi et al., 2021; Krumrei-Mancuso et al., 2013), noting that specific groups have demonstrated relatively lower retention rates. These groups include men (Conger & Dickson, 2017), students of low socioeconomic status (SES), first-generation college students (FGCS; King & Ndum, 2017), and older students (Gilardi & Guglielmetti, 2011). As trends prolonging the high school-to-college transition are growing (Markle, 2015), particular attention to older-age college students is warranted. Thus, the present research aimed to assess psychosocial readiness for college among older-aged students––a common demographic among Israeli students––to identify those most at risk of dropping out.
Conceptual Framework
Tinto’s (1975) theory of student departure and Bean’s (1980, 1983) model of student attrition have generated a long-standing theoretical impact (see reviews by Aljohani, 2016; Burke, 2019; Burrus et al., 2013
Carroll et al. (2009) and Bowles and Brindle (2017) classified the factors that may facilitate or inhibit student retention into three groups: (a) situational factors (e.g., work and family obligations and other life events), (b) institutional factors (e.g., policy, financial aid, and support services), and (c) dispositional factors relating to student characteristics (e.g., age, parental education, motivation, self-efficacy and social engagement). The focal point of this paper is the internal characteristics of students (“pull factors” or “dispositional factors”; Brewer et al., 2021) at a specific critical period– students’ initial transition into college (Casanova et al., 2021). Thus, the present paper focuses on the early detection of students' college readiness and its associations with retention.
College Readiness
Lapan et al. (2012) claimed that “failure to persist in college is a critical college readiness issue” (p. 59). College readiness denotes factors that predict key college outcomes––persistence and achievement (Gore et al., 2019; Komarraju et al., 2013; Radunzel & Noble, 2012). Three types of college outcome predictors have been identified: (a) measures of scholastic aptitude, such as standardized test scores and high school grade point average (GPA); (b) demographic predictors, such as gender, SES, and ethnicity; and (c) psychosocial factors, such as academic self-efficacy, motivation to study, and social skills (Gore et al., 2019; Robbins et al., 2006).
Academic Aspects of College Readiness
Academic readiness has been considered the traditional and primary indicator of college success (Komarraju et al., 2013). It denotes academic aptitude and cognitive abilities associated with persistence and the quality of academic performance (e.g., GPA; Richardson et al., 2012). Standardized scholastic aptitude tests combined with high school GPA and advanced mathematics and science classes were found to predict first-year college GPA and first-to-second-year retention (Huh & Huang, 2016; Robbins et al., 2006). However, studies have shown that scholastic aptitude scores and high school grades account for only 20–25% of the variance in first-year college GPA (e.g., Huh & Huang, 2016; Richardson et al., 2012), highlighting the effects of other factors predicting college success and retention (Richardson et al., 2012).
Demographic Variables and College Readiness
Pre-entry characteristics of students (e.g., gender, age, SES, parents' education, and ethnicity) are incorporated in most models for student persistence (Chung et al., 2017; Pascarella & Terenzini, 2005; Tinto, 1997). Relative to their demographic cohorts, older students (Gilardi & Guglielmetti, 2011), male students (Conger & Dickson, 2017; Ginder et al., 2017; OECD, 2021), low-SES students, and FGCSs are less likely to enroll in college (Choy, 2001) and demonstrate lower persistence rates (King & Ndum, 2017; Radunzel & Noble, 2012).
The number of non-traditional students attending college has increased in recent decades (Biddix et al., 2021; Chung et al., 2017). These students often begin college less academically prepared (Radunzel & Noble, 2012), have more financial difficulties (Martin et al., 2013), and struggle to adjust to college’s social and cultural aspects (Collier & Morgan, 2008).
A particular group of interest is older students; one-third of US undergraduate students are older than 25 (Markle, 2015). These students may be less committed to college and struggle to adapt to university life due to financial difficulties, family commitments, or job responsibilities (Van Rhijn et al., 2016). Conversely, many benefits accrue to those beginning college at an older age: Their maturity and experiences boost their ability to succeed and persist in their studies (Chung et al., 2017; Johnson & Nussbaum, 2012). Older students are likely to have a better self-regulating capacity that facilitates coping with college stressors (Johnson & Nussbaum, 2012), making them more resilient to stress (Chung et al., 2017), a factor also contributing to retention and GPA (Allan et al., 2014). Beginning college and adapting to a new way of life following a relatively lengthy break from formal education is challenging and requires significant adjustment (Casanova et al., 2021).
Whereas beginning higher education at an older age is a feature unique to Israeli students, deferring enrollment in higher education in other countries has become increasingly common (Guidi, 2018). However, compared with other countries, the reason for deferred enrollment for Israeli students (i.e., mandatory military service) does not necessarily indicate an underlying risk factor (SES, FGCS, age, gender, or academic ability), and the delay is more comparable to countries with mandatory military service (e.g., Finland, Switzerland, and Greece; Kosonen et al., 2019) or vocational education tracks (e.g., in Germany; Tieben, 2020).
Psychosocial Readiness for College
Substantial research has addressed college persistence and academic performance by examining non-cognitive factors (for reviews, see Richardson et al., 2012; Robbins et al., 2004). Beyond adequate scholastic abilities, college readiness denotes a set of behaviors, attitudes, and psychological constructs that facilitate coping with the challenges and demands of higher education (Lombardi et al., 2011). Psychosocial factors are academically-related personality facets that tap into broader personality constructs (Peterson et al., 2006), such as academic self-efficacy (Richardson et al., 2012), effort regulation (Richardson et al., 2012), motivation (Baars & Arnold, 2014), social self-efficacy (Elliott, 2016), social skills (Kahn et al., 2002), grit (Bowman et al., 2015), psychological stress (Allan et al., 2014), and time management skills (Krumrei-Mancuso et al., 2013). Psychosocial college readiness facilitates persistence and higher GPA in college, particularly among first-year students (King & Ndum, 2017; Robbins et al., 2004; 2006). A significant feature of psychosocial factors is that they can be enhanced through educational interventions (Fong et al., 2017; Gore et al., 2019). Thus, assessing psychosocial factors before beginning college presents an opportunity to address and diminish risk factors, thus promoting college readiness (Krumrei-Mancuso et al., 2013). Whereas this paper focuses on psychosocial factors, other retention facilitators and barriers need to be acknowledged (e.g., Bowles & Brindle, 2017). As Burrus et al. (2013) noted, “emphasis on stress and coping is much more applicable to the everyday, real-life experiences of students of all demographic characteristics and students attending different types of institutions” (pg. 36).
Measuring Psychosocial Readiness for College
Based on a meta-analysis of psychosocial factors predicting first-year persistence and GPA, ten broad constructs were identified (Robbins et al., 2004) and incorporated into the Student Readiness Inventory (SRI; Le et al., 2005): Academic Discipline, Academic Self-Confidence, Commitment to College, Communication Skills, Emotional Control, General Determination, Goal Striving, Social Activity, Social Connection, and Study Skills. The SRI has been shown to successfully identify students at risk of dropping out (King & Ndum, 2017).
A more recent measure, the Student Strength Inventory (SSI; Gore et al., 2019), comprises six of the ten SRI factors found to be the best predictors of college outcomes, albeit labeled slightly differently: Academic Self-Efficacy, Academic Engagement, Campus Engagement, Resiliency, Social Comfort, and Educational Commitment. Gore et al. (2019) reported the SSI’s adequate internal consistency and construct validity, highlighting its advantage as a brief and applicable tool for detecting students at risk of dropping out of college. Another measure, the College Learning Effectiveness Inventory (CLEI; Kim et al., 2010), comprises six psychosocial scales: Academic Self-Efficacy, Organization and Attention to Study, Stress and Time Press, Involvement with College Activity, Emotional Satisfaction, and Class Communication. The CLEI scales explained 16.3% of the variance in first-semester GPA beyond demographic variables (Krumrei-Mancuso et al., 2013). Despite these measures’ validity and utility, they focus on the respondents’ recent high school experiences. They are thus less suited for assessing the psychosocial readiness for college of Israeli young adults, who are typically older and have experienced a prolonged gap from formal education. Also, given the growing number of older students in other countries, the existing measures may not be appropriate for them as well.
Higher Education in Israel
Unlike young adults in most Western countries, Israeli youth typically do not enter college immediately following their high school graduation. Most serve in the mandatory military (2–3 years) or the alternative optional national civil service (1–2 years). Following their service, many work for several months to save money for a lengthy (typically 6–12-month) backpacking trip and for college (Lipshits-Braziler et al., 2015). Consequently, Israeli first-year students are characteristically older (23–24) than their counterparts in many other countries. Furthermore, Israeli college applicants are required to rank-order the major(s) they wish to study. For most Israeli colleges, admission criteria include their high school GPA (HSG) and a scholastic aptitude test (the Psychometric Entrance Test [PET], the Israeli equivalent of the SAT or ACT), with different weighting and cut-off criteria for the various majors. Thus, most students in Israel are admitted to a particular major and, thus, are likely to have demonstrated the required scholastic aptitude to succeed in their chosen major; however, this screening notwithstanding, not all students remain in college.
Assessing psychosocial readiness for college has yet to be developed in Israel. Only few studies have highlighted the role of non-cognitive factors on persistence in higher education in Israel. Davidson et al. (2011) reported that interventions that improved the individual’s sense of coherence, self-efficacy, and hope enhanced students’ academic adjustment, as reflected in their grades. Lufi et al. (2003) found that personality factors did not distinguish between college persisters and dropouts among Israeli students. They attributed Israeli students’ relatively low dropout rates (8.7% [Central Bureau of Statistics; CBS, 2018], relative to 12% in OECD countries [OECD, 2022] and 18% in the USA [NCES, 2022]) to their older age and greater maturity.
The Present Research
Responding to the call for a multidimensional assessment of psychosocial readiness for college (Gore et al., 2019; Robbins et al., 2004), the present research aligns with Gore et al.’s (2019) suggestion to assess only those dimensions that contribute significantly to first-year college achievement and persistence. We adapted and modified the SSI’s multidimensional approach and applied it to first-year college students about to begin college several years after high school graduation. We report five studies, using five different and large samples of first-year college students, that review the development, psychometric properties, and validity of the Psychosocial Readiness for College questionnaire (PRCq), targeting students starting college in their 20s’. Specifically, we describe the development of the PRCq, a multi-dimensional assessment of psychosocial readiness for college, test its psychometric properties (including exploratory and confirmatory factor analysis and measurement invariance), as well as its convergent and discriminant validity against personality and scholastic measures. We also tested the PRCq’s predictive validity, adopting the criterion of first-year retention.
Study 1: The Development of the Psychosocial Readiness for College Questionnaire
Study 1 aimed to develop the PRCq and explore its six-dimensional structure.
Method
Developing the Psychosocial Readiness for College Questionnaire
We conducted a pilot study to test the initial version of the PRC questionnaire (PRCq), comprising 50 items distributed among six scales. Five of the scales correspond to the SSI scales (Gore et al., 2019): Academic Self-Efficacy, Educational Commitment, Social Comfort, Campus Engagement, and Resiliency. SSI’s sixth scale, Academic Engagement, addressed prioritizing academic tasks related to current high school behaviors (e.g., “I turn my work in on time”, “I often go to class without being fully prepared”). Following a content analysis of the items, we relabeled this scale as Self-Discipline, defining it as the degree to which the individual follows through on commitments and obligations (e.g., “When I make a plan, I can stick to it”), reflecting the individuals’ control over their everyday activities. Thus, we replaced the SSI’s Academic Engagement scale with Self-Discipline in the PRCq.
We reviewed all the SSI items and adjusted them to fit the Israeli higher education setting, taking into account the unique features of older student populations. For example, Academic Self-Efficacy items in the SSI refer to first-year academic achievements common in the American college curriculum, such as required courses in science and English. These items were replaced by general Academic Self-Efficacy items; for example, instead of “I will be able to complete college English requirements with a B or better,” we included an item of general academic self-efficacy: “I am confident I can attain a high GPA.” Finally, the Campus Engagement-scale items were revised and adapted to fit Israeli campus life. For instance, items relating to “joining campus clubs” and “participating in orientation activities” are less common on Israeli campuses; thus, we replaced these with “joining student union activities” and “being involved in campus activities.” These 50 items were administered to 195 students before the beginning of their first year at a research university in October 2011. Based on the results of an exploratory factor analysis and the internal consistency reliability analysis, we deleted ten items and revised 12 others. A second 40-item pilot questionnaire (N = 975) was then administered, resulting in removing four items. Finally, to further shorten the questionnaire, we removed six items (one from each scale) that did not significantly contribute to the scales’ internal consistency reliabilities. Thus, the final version of the PRCq comprised 30 items, five per each scale, in addition to one warm-up and two validity items.
Participants and Procedure
After obtaining the approval of the Institutional Review Board and the Student Administration of a research university, a new sample was recruited to test the structure of the PRCq. We emailed an invitation to the university’s 3,284 first-year students two weeks before the beginning of the academic year. Students agreeing to participate clicked on a link to a brief (6–8-minute) online questionnaire regarding “first-year students’ perceptions of college.” The response rate was 40%. Of those completing the questionnaire, we deleted 84 participants: 62 participants reporting less than 12 or more than 13 years of education, 5 participants younger than 18 or older than 30, and 17 participants who completed the questionnaire in less than 120 seconds or more than 30 minutes. Thus, the final sample included 1,239 university students (58.4% female). The analyses included only students aged 18–30 (M = 22.59, SD = 1.91) reporting12 -13 years of education (M = 12.06, SD = 0.23). We limited the participation age to 30 because we were interested in first-time college students, and many of those above 30 also reported previous post-secondary education.
Instruments
Psychosocial Readiness for College Questionnaire
The final version of the PRCq comprises 30 items, five for each of the six scales: Academic Self-Efficacy (e.g., “I am confident that I can maintain a high GPA”), Educational Commitment (e.g., “I am confident that attaining a college degree is the right goal for me”), Social Comfort (e.g., “I enjoy meeting new people”), Campus Engagement (e.g., “Being involved in campus life is important for my personal development”), Self-Discipline (e.g., “I can be counted on to maintain a schedule”), and Resilience (e.g., “I am easily stressed, even by things that are not really important”; reverse-scored). Participants were asked to rate the extent to which each item describes them on a 7-point Likert-type scale, ranging from 1 (does not describe me at all) to 7 (describes me very well). The warm-up item was: “I have high expectations of my academic studies.” Two validity items were embedded to detect inattentive responses (“I am very pleased when I do well on my exams” and “I don’t mind failing an exam”). One Self-Discipline scale item (“I tend to put off tasks to the last minute”) and all Resilience scale items are reverse-scored. In the present sample, the Cronbach alpha (Cα) internal consistency reliabilities of the six scales were high (.92, .86, .84, .91, .82, and .79, for the six scales, respectively).
Background Questionnaire
Participants were asked to report their age and years of education. We solicited no information regarding the participants' ethnic or religious affiliation, as asking such questions is viewed by many Israelis as invasive.
Results
The 30 PRCq items were factor analyzed using principal component analysis with Promax with Kaiser normalization as the rotation method. The results yielded six factors with an eigenvalue greater than 1, explaining a total of 67.7% of the variance. Appendix A shows that all items loaded on the expected factor (loadings ranged from .67 to .92), and no cross-loadings were observed. The factor contributing the highest variance was Academic Self-Efficacy (26.9%), followed by Social Comfort (12.1%), Educational Commitment (10.6%), Campus Engagement (6.7%), Resiliency (6.2%), and Self-Discipline (5.4%).
Study 2: Confirmatory Factor Analysis and Measurement Invariance of the Psychosocial Readiness for College Questionnaire
Study 2 aimed to verify the six-dimensional structure of the PRCq that emerged in Study 1 by using confirmatory factor analysis and measurement invariance analyses for students from different groups and backgrounds. The effect of socio-demographic variables on academic readiness has been explored extensively (e.g., Chung et al., 2017). Numerous prevention and intervention programs to promote persistence have addressed diverse student populations, designing programs emanating from the students’ socio-demographic characteristics (Jury et al., 2017). After supporting the PRCq’s measurement invariance, an additional goal of Study 2 was to examine whether the six PRC dimensions differ across four demographic variables (gender, age, socioeconomic status [SES], and first-generation college students [FGCS]) and the type of higher education institution (university vs. college)).
Differences Between Groups in Demographic Characteristics
Age
Older students often have greater ambivalence regarding their commitment to higher education due to time constraints imposed by family and job responsibilities (Gilardi & Guglielmetti, 2011; Van Rhijn et al., 2016). Those living off-campus have more difficulty adapting to university life and benefiting from university support, often impeding their integration and engagement in college life (Gilardi & Guglielmetti, 2011). At the same time, older students may benefit from greater psychosocial readiness due to their maturity, and their life experience may contribute to higher resilience and more successful coping with stress (Chung et al., 2017; Johnson & Nussbaum, 2012), two of the factors associated with persistence and scholastic performance (Allan et al., 2014). Hence, we hypothesized that relative to younger students, older students would score lower on Educational Commitment (h1) and Campus Engagement (h2) but higher on Social Comfort (h3), Self-Discipline (h4), and Resilience (h5). Considering that studies on Academic Self-Efficacy have proven inconclusive, we do not posit an age-related hypothesis regarding this scale.
Gender
Gender distinctions have been reported regarding college behavior. Thus, women demonstrate higher attendance rates (Conger & Dickson, 2017; OECD, 2021), GPA (Richardson et al., 2012), persistence, and graduation rates (Ginder et al., 2017; OECD, 2021). Le et al. (2005) found that women scored higher than men on commitment to college, communication skills, and academic discipline. Gore et al. (2019) reported that women scored higher on five of the six dimensions of the Student Strengths Inventory; only on Resilience did men score higher. Given these reported findings, we hypothesized that women would score higher than men on all but one of the PRCq scales (h6) but lower than men on Resilience (h7).
Socioeconomic Status
Socioeconomic Status (SES) is typically derived from family income and parents’ educational attainment (Choy, 2001; Grebennikov & Shah, 2012). For low-SES students and those with diverse backgrounds, non-cognitive factors are especially important contributors to college success (Sedlacek, 2011). Low-SES students are likely to face unique psychological barriers, often characterized by greater emotional distress, negative self-perceptions, and an inclination toward avoidance motivation (Jury et al., 2017). However, other studies have stressed the high motivation and determination of low-SES students who enroll and persist in college despite encountering obstacles (Mckay & Devlin, 2016; Sedlacek, 2011). Psychosocial factors may compensate for inadequate academic readiness (Komarraju et al., 2013). Le et al.’s (2005) study found low associations between ethnicity, family income, and psychosocial factors. Thus, we expected to find small or negligible differences in PRCq scores between low- and high-SES students (h8).
First-Generation College Students
First-generation college students (FGCS) are students whose parents did not earn a college degree. This group often corresponds with SES (Fiske & Markus, 2012) and ethnicity (Harackiewicz et al., 2016). Given their lack of “college knowledge,” FGCS may have greater difficulty integrating into their new social environment, such as accommodating instructors’ expectations or interacting with professors (Collier & Morgan, 2008), and therefore, may experience higher levels of uncertainty about fitting into higher education (Harackiewicz et al., 2016). To take on the role of a college student, FGCS need to contend with relatively more potential stressors (Garriott & Nisle, 2018), making this role more challenging for those whose families lack such experience (Collier & Morgan, 2008). Accordingly, we hypothesized lower PRCq scores for FGCS in Social Comfort (h9) and Campus Engagement (h10).
College vs. University Students
Over the past three decades, Israel’s higher education system has expanded significantly, increasing access to higher education among students from geographically peripheral towns and low-SES backgrounds (Shwed & Shavit, 2006). This change is apparent in the increased number of public and private colleges and, to a lesser extent, research universities. Universities’ emphasis on excellence (Ayalon et al., 2008) is reflected in more selective admission requirements (CBS, 2017). We hypothesized that university students would score higher on the PRCq than college students (h11).
Method
Participants and Procedure
As in Study 1, an invitation email was disseminated to two cohorts of first-year students just before the beginning of the academic year; 4,081 and 4,097 students from a single research university, and 5,049 and 6,671 students from eight and ten academic colleges in Israel, respectively. The response rate was 34% and 24.4% for the university cohorts, and 16.9% and 19.4% for the college cohorts. The final sample included 2,126 university students (58.2% women) and 2,147 college students (65.3% women). The overall mean age was 23.61 (SD = 2.15) for men and 22.42 (SD = 1.83) for women, respectively. Although a small minority of students (about 11%) are younger (i.e., < 21) than the target population of students, we decided to include them in the analyses because the goal was to develop an easily administered assessment that can be used on the entire cohort and not only for those who begin college in their twenties.
The participants were divided into two age groups, two SES groups, and two groups of college generation status. Concerning age, participants were divided into younger students (18–22 for women, 18–23 for men; 48.7%) and older students (23–30 for women, 24-30 for men; 51.3%); the difference in the cut-off points between men and women stems from the differential military service length in Israel (two years for women and three years for men).
SES level was based on the Israel Central Bureau of Statistics (CBS, 2019) classification of Israel’s towns according to 10 SES clusters, ranging from 1 (lowest SES) to 10 (highest SES). The SES code assigned to the town reported as the site of the participants’ elementary school was used for determining the participants’ SES level. For the current analysis, the SES clusters were divided into two groups: low-SES clusters (1-5; 40.7%) and high-SES clusters (6-10; 59.3%). More low-SES students were enrolled in the university (45.7%) than in colleges (35.7%), χ 2 (1, N = 3900) = 40.94, p < .001. Finally, we distinguished between two additional groups: FGCS (28.8%) and non-FGCS (71.2%); more FGCS were enrolled in colleges (36.1%) than in the university (21.7%), χ 2 (1, N = 4006) = 101.78, p < .001.
Instrument
Psychosocial Readiness for College Questionnaire (PRCq)
As in Study 1, participants responded to the PRCq; The median Cα of the six scales was .86 (ranging from .81 to .91).
Background Questionnaire
Participants were asked to report their age, years of education, parents' education (undergraduate or above, post-high school professional training, high school diploma, or less than 12 years of education), and town of residence during elementary school to determine their SES (reported by 91.2% of the participants). We asked for participants’ elementary school location to indicate SES rather than high schools because elementary schools are much more likely to be near their home. FGCS was defined as a student, both of whose parents did not complete an undergraduate degree.
Results
Confirmatory Factor Analysis
Confimatory Factor Analysis and Measurement Invariance for the PRCq Structure (N = 4273) across Gender, Age, SES, (non)FGCS, and Institution Type.
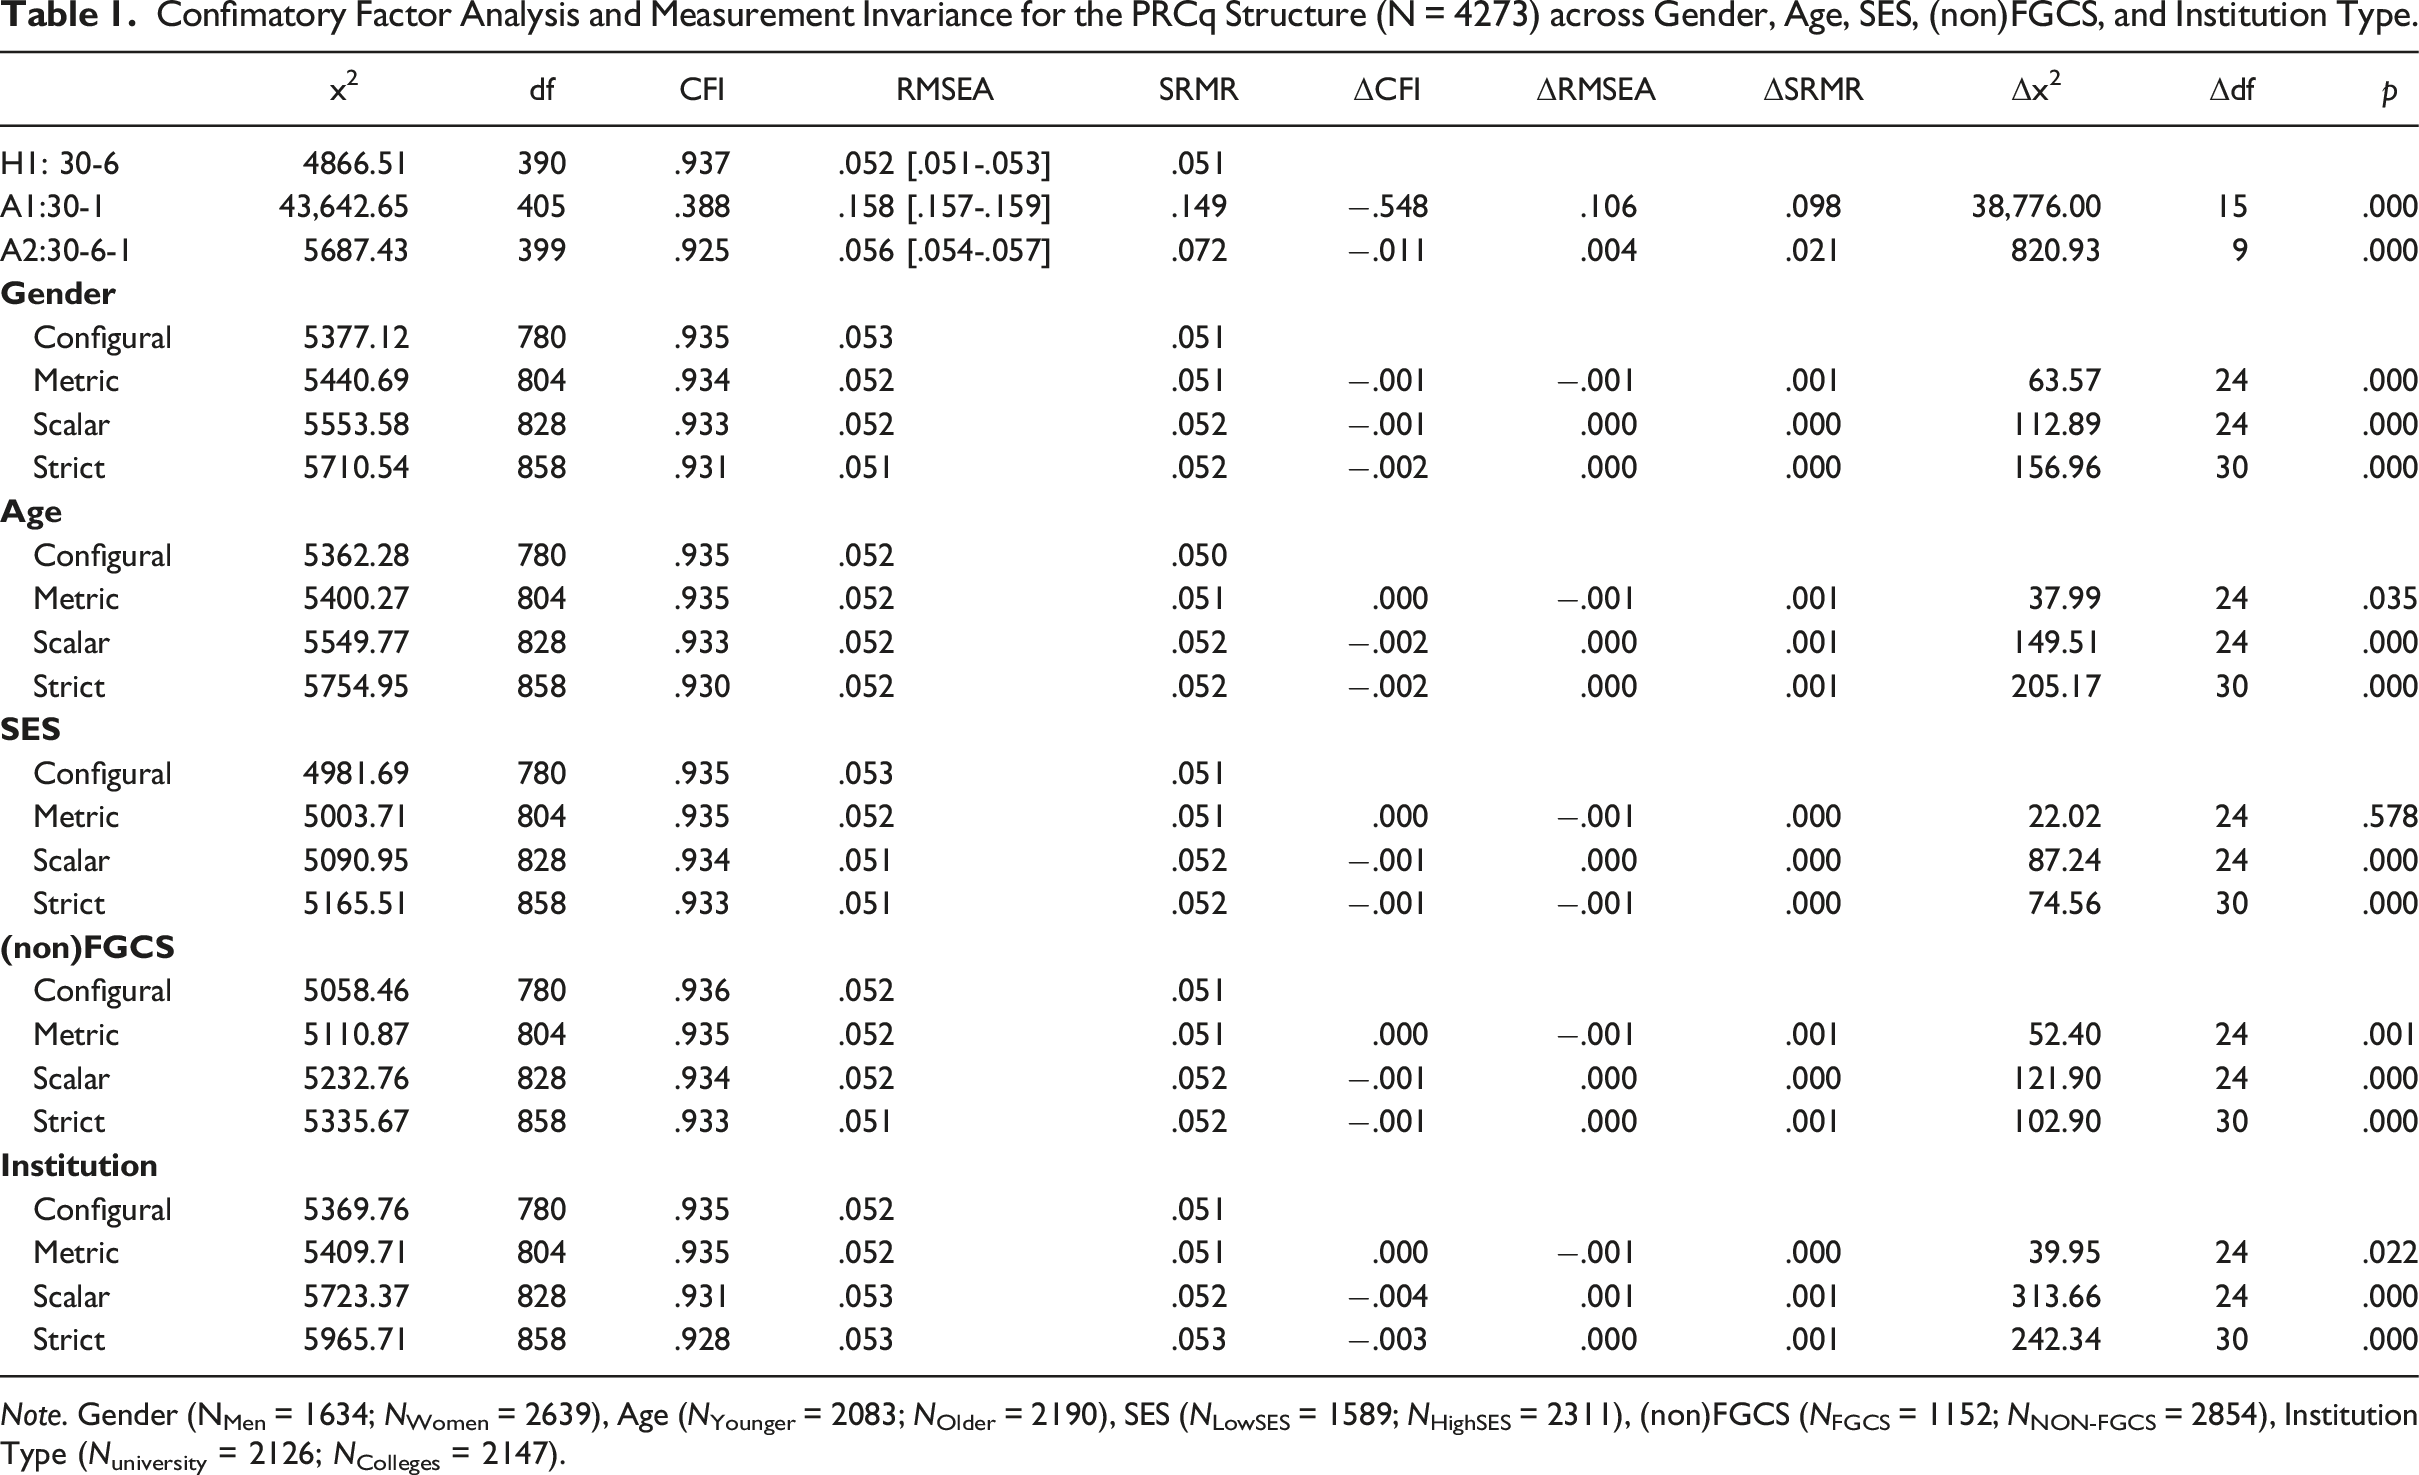
Note. Gender (NMen = 1634; NWomen = 2639), Age (NYounger = 2083; NOlder = 2190), SES (NLowSES = 1589; NHighSES = 2311), (non)FGCS (NFGCS = 1152; NNON-FGCS = 2854), Institution Type (Nuniversity = 2126; NColleges = 2147).
Measurement Invariance
To assess the psychometric equivalence of the PRCq construct across groups, we examined the measurement invariance of the hypothesized PRC model for each of the five independent variables: gender, age, SES, FGCS, and institution type. The CFI goodness-of-fit index and RMSEA were then used to examine the change in fit across groups (Cheung & Rensvold, 2002). Measurement invariance is determined when the difference in CFI in the model fit is under .01, and the difference in RMSEA is under .015 (Cheung & Rensvold, 2002). The results, presented in Table 1, supported measurement equivalence, as the PRCq scale scores demonstrated strict invariance for all five independent variables: gender (CFI ≥ .931 and RMSEA ≤ .053), age (CFI ≥ .930 and RMSEA ≤ .052), SES (CFI ≥ .933 and RMSEA ≤ .053), FGCS (CFI ≥ .933 and RMSEA ≤ .052), and institution type (CFI ≥ .928 and RMSEA ≤ .053). The differences in the goodness-of-fit statistics are all under .01 (ΔCFIs ≤ |.004| and ΔRMSEAs ≤ |.001|).
Group Differences
Group Differences in the PRCq Scales (N = 4273) across Gender, Age, SES, (non)FGCS, and Institution Type.
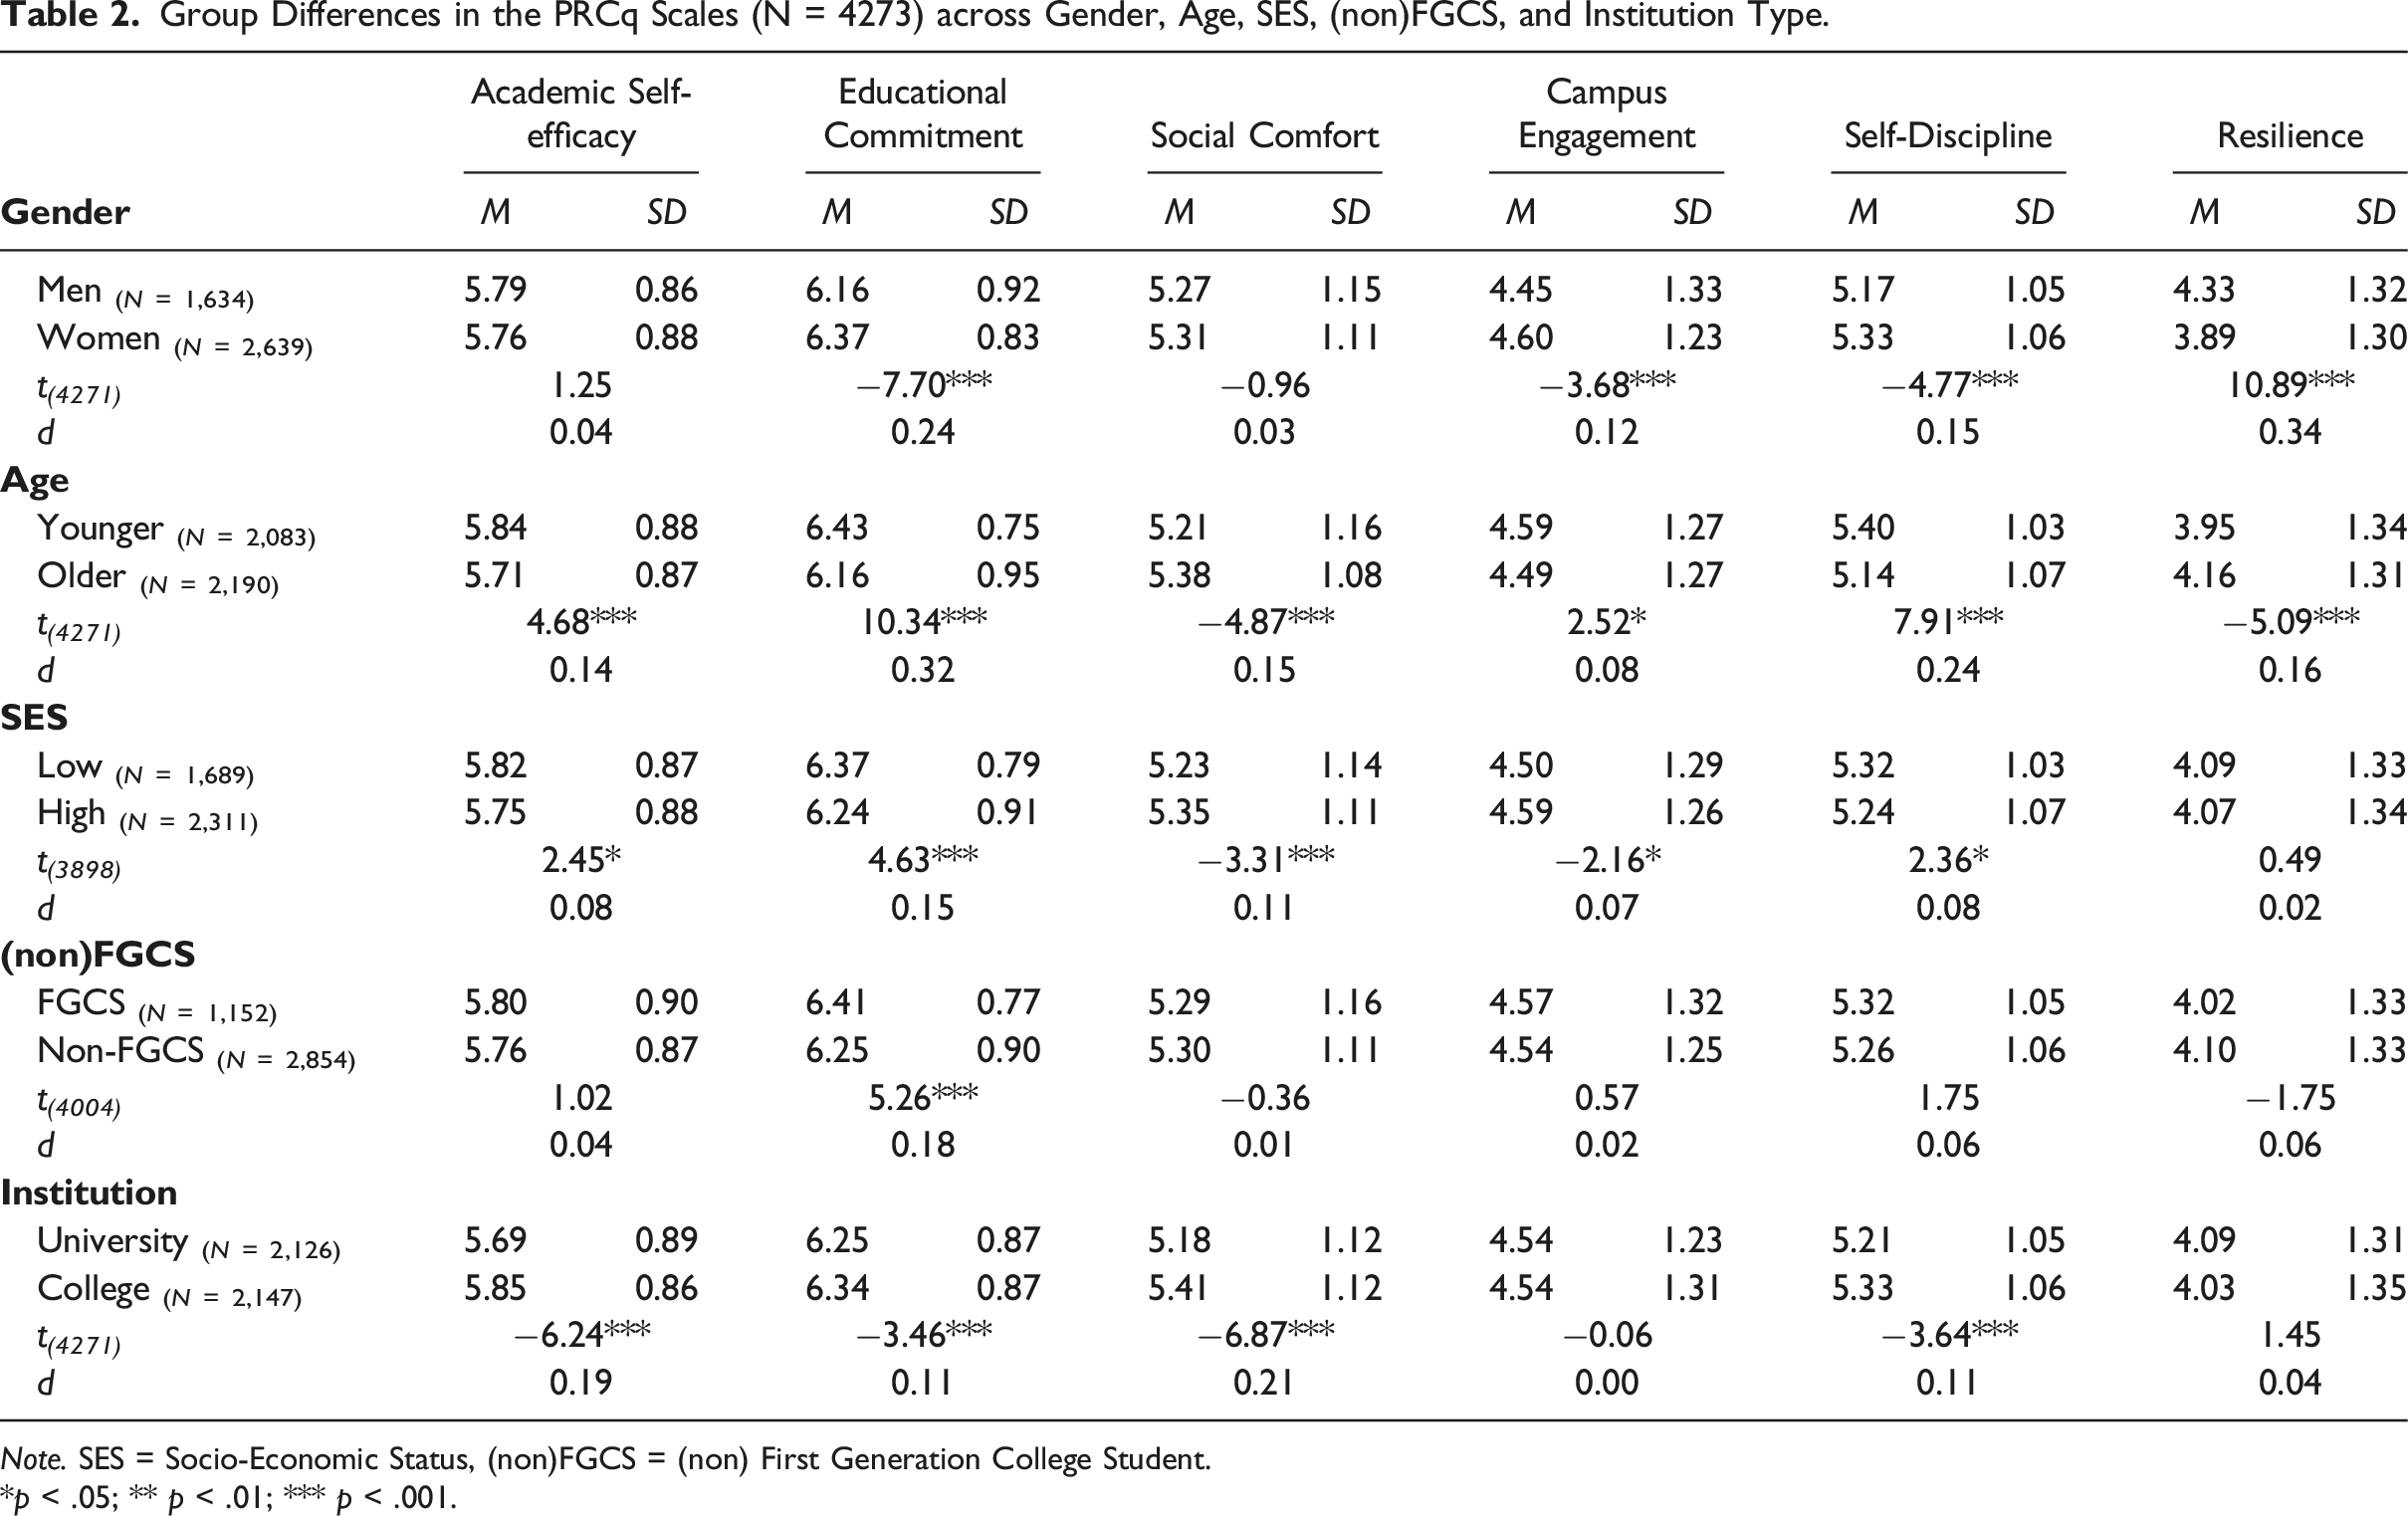
Note. SES = Socio-Economic Status, (non)FGCS = (non) First Generation College Student.
*p < .05; ** p < .01; *** p < .001.
Low-SES students scored higher than high-SES students on Educational Commitment (d = 0.15) but lower on Social Comfort (d = 0.11), thus supporting Hypothesis h8. FGCS scored higher than non-FGCS only on Educational Commitment (d = 0.18); this finding was not hypothesized. The hypothesized lower PRCq scores for FGCS in Social Comfort (h9) and Campus Engagement (h10) were not supported. Finally, for institution type, college students scored higher than university students on Academic Self-Efficacy (d = 0.19), Educational Commitment (d = 0.11), Social Comfort (d = 0.21), and Self-Discipline (d = 0.11), findings that do not support Hypothesis h11.
Study 3 – The Associations Between Psychosocial Readiness for College and Scholastic Aptitude
Academic aptitude and cognitive ability have been associated with college outcomes, primarily persistence and first-year GPA (Richardson et al., 2012). Scholastic aptitude tests (e.g., SAT, ACT) and high-school GPA are commonly used as predictors of first-year college GPA and first-to-second-year retention (Gore et al., 2019; Huh & Huang, 2016; Robbins et al., 2006). Whereas these factors have been the traditional predictors of college success, they account for only 20–25% of the variance of first-year college GPA (e.g., Huh & Huang, 2016; Krumrei-Mancuso et al., 2013). Similarly, in Israel, high school grades (HSG) and the Psychometric Entrance Test (PET) accounted for 25% of the variance of first-year college GPA (Kleper & Turvall, 2016).
In Study 3 we explored the association between scholastic aptitude predictors (i.e., HSG and PET) and the six PRCq scale scores. We expected low to negligible associations between the scholastic aptitude factors and the psychosocial factors (h12), reflecting the difference between cognitive and non-cognitive factors associated with persistence (King & Ndum, 2017; Komarraju et al., 2013; Robbins et al., 2004).
Method
Participants and Procedure
We disseminated an email invitation to a new cohort of first-year students at a research university in Israel a month before the start of the academic year (N = 3,456), yielding a response rate of 43%. Participants were asked about their gender, age, and consent to retrieve their admissions data from the university’s student administration office (81% consent). We retrieved these students' HSG and PET scores to examine their association with the PRCq scores. The final sample comprised 1,489 students aged 18–30 with 12–13 years of education (61.8% were women). Their mean age was 21.88 (SD = 1.81) for women and 23.30 (SD = 2.17) for men.
Instrument
Psychosocial Readiness for College Questionnaire
In this study, the median PRCq’s scale score’s Cα was .88, ranging from .81 to .92 for the six scales.
HSG and PET score
Entrance requirements for higher education in Israel include high school matriculation GPA (HSG) and the PET score. In most cases, students are admitted to college based on the combination of HGS (ranging from 0 to 100) and their PET score (ranging from 200 to 800); for certain majors, students can be admitted based on the HGS or the PET score alone. We obtained the HGS of 1,447 students and the PET scores of 1,350 students from the university’s student administration office; the correlation between the HSG and the PET was .47 (N = 1,326).
Results
Correlations between the PRCq Scale Scores, Scholastic Aptitudes (High School Grades and PET), and BFI Factors.
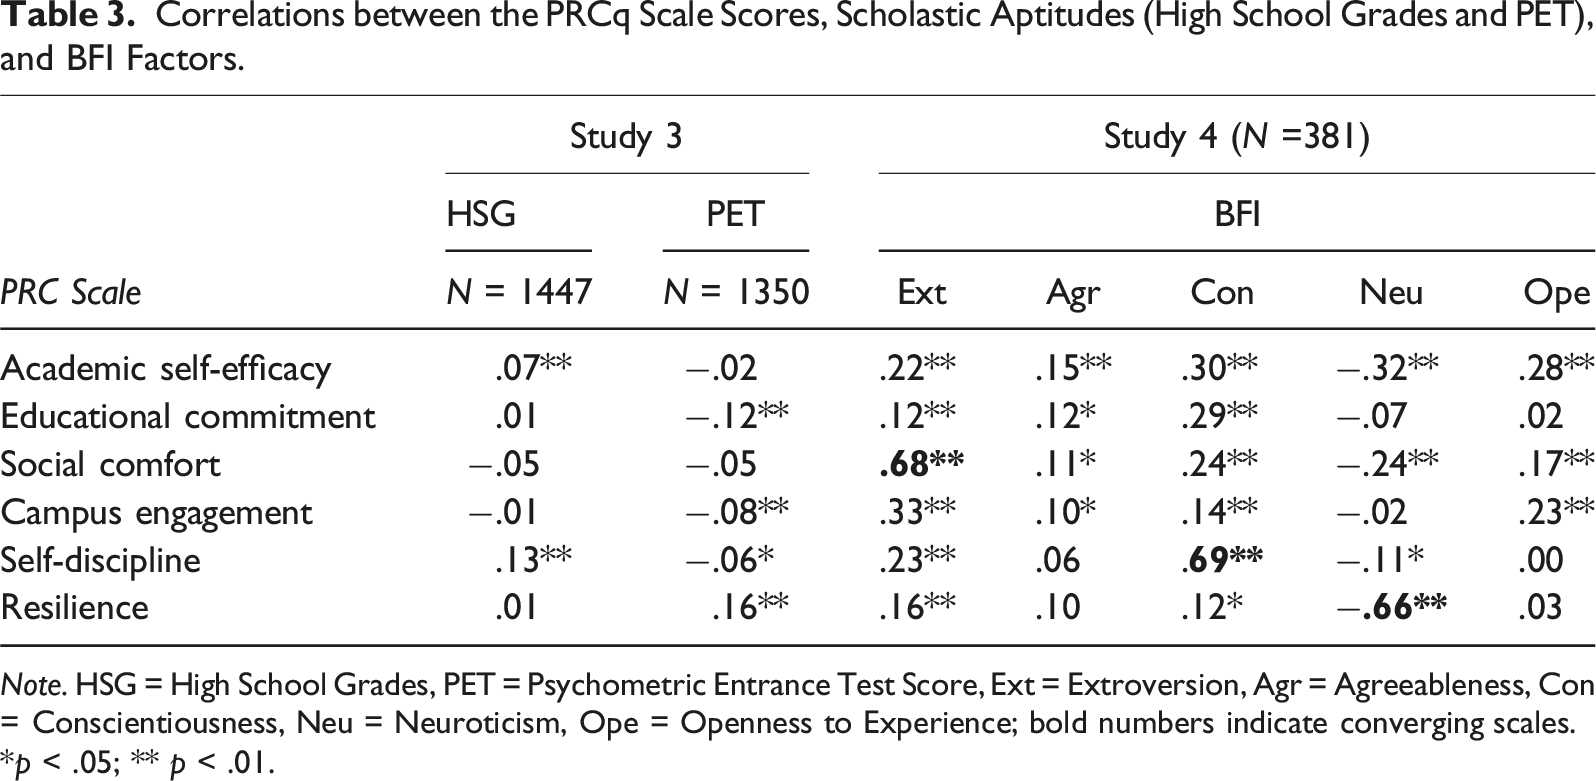
Note. HSG = High School Grades, PET = Psychometric Entrance Test Score, Ext = Extroversion, Agr = Agreeableness, Con = Conscientiousness, Neu = Neuroticism, Ope = Openness to Experience; bold numbers indicate converging scales.
*p < .05; ** p < .01.
Study 4 - Psychosocial Readiness for College and Big Five Personality Factors
Study 4 aimed to assess the convergent and discriminant validity of the six PRCq scales using the Big Five personality factors: Extraversion, Neuroticism, Agreeableness, Conscientiousness, and Openness to Experience (Costa & McCrae, 1992). We selected the Big Five personality traits for validation since personality traits have been linked to psychosocial factors (Peterson et al., 2006). Peterson et al. (2006) found convergent associations between psychosocial readiness assessed by the SRI and the Big Five personality traits; specifically, the SRI’s Emotional Control was associated with Neuroticism, Social Activity with Extraversion, and Academic Discipline with Conscientiousness. Whereas the Big Five traits comprise broad personality domains, SRI traits are narrower, tapping into academic-related characteristics and are better predictors of GPA than the Big Five (Peterson et al., 2006). Richardson et al. (2012) reported associations between the Big Five personality traits and academic performance. They found that low-Conscientiousness students were less likely to persist with challenging work than high-Conscientiousness students and that Neuroticism may impede academic performance due to test anxiety and lower motivation.
These studies suggest some commonality between Extraversion and the PRC’s social dimensions––namely, Social Comfort and Campus Engagement––and between Neuroticism and the PRCq’s Resilience scale (reversed). Hence, we expected moderate to high positive correlations between Extraversion, on the one hand, and Social Comfort and Campus Engagement (h13), on the other, and a moderate negative correlation between Neuroticism and Resilience (h14). Similarly, we expected Conscientiousness to be positively correlated with Self-Discipline and Academic Self-Efficacy (h15). Agreeableness and Openness to Experience would appear to correspond less with the PRC dimensions but may tap into the social domain of Social Comfort (h16); thus, we expected a moderate correlation between the PRCq’s Social Comfort and the Big Five scales of Agreeableness and Openness to Experience.
Method
Participants and Procedure
The PRCq was completed by an additional sample of 1,028 first-year university students at the start of their academic year. Then, approximately 6 months later, we emailed these students, requesting them to complete a questionnaire that included the Big Five Inventory (BFI; John et al., 1991); 631 students completed the BFI. After excluding students due to age (younger than 18 or older than 30), previous education (more than 13 years of schooling), and BFI response time (less than 120 seconds or more than 1,800 seconds), we analyzed the responses of the 381 students who completed both the PRCq and the BFI.
Instruments
The Psychosocial Readiness for College questionnaire
The median internal consistency reliability for the six scales was Cα = .88, with a range of .80 to .92.
Personality Factors - The Big Five Inventory
The BFI is a widely used 44-item instrument of the five-factor personality model (John et al., 1991), with 8–10 items tapping each of the five scales. The items are presented on a 5-point Likert-type response scale, ranging from 1 (disagree strongly) to 5 (agree strongly). The BFI has satisfactory convergent and discriminant relations with other Big-Five-based measures (John & Srivastava, 1999). The BFI’s Hebrew version yielded reliability estimates of Cα = .80, .81, .68, .73, and .76 for Extraversion, Neuroticism, Agreeableness, Conscientiousness, and Openness to Experience, respectively (Laski, 2002). The current study used the 41-item adapted Hebrew version of the BFI, based on Lipshits-Braziler et al. (2015). Lipshits-Braziler et al. (2015) omitted three items from the Hebrew version of the Openness to Experience factor (tapping artistic and aesthetic experiences) due to unsatisfactory psychometric properties. A subsequent EFA and internal consistency reliability estimates of the BFI’s Hebrew version (N = 631) led us to eliminate five items from the analyses (one item from Agreeableness, Openness to Experience, and Neuroticism, and two items from Conscientiousness), resulting in a 36-item questionnaire with adequate reliability. The internal consistency reliability estimates for the present sample were .84, .73, .80, .83, and .76 for Extraversion, Agreeableness, Conscientiousness, Neuroticism, and Openness to Experience, respectively.
Results
The right-hand side of Table 3 presents the correlations between the six PRCq scales and the five BFI dimensions. As expected, Extraversion was highly positively correlated with Social Comfort (r = .68) and moderately correlated with Campus Engagement (r = .33), supporting Hypothesis h13. Resilience was strongly negatively correlated with Neuroticism (r = −.66), supporting Hypothesis h14. Neuroticism was also moderately negatively correlated with Academic Self-Efficacy (r = −.32). Conscientiousness was highly correlated with Self-Discipline (r = .69) but yielded only weak to moderate correlations with Academic Self-Efficacy (r = .30) and Educational Commitment (r = .29), supporting Hypothesis h15. Openness to Experience had moderate to low positive associations with Academic Self-Efficacy (r = .28) and Campus Engagement (r = .23). Finally, Agreeableness was positively but weakly correlated with the six PRCq scales (r ≤ .15). Thus, the convergent and discriminant validity of the PRCq was supported by its pattern of correlations with the Big Five dimensions.
Study 5 –The Predictive Validity of the Psychosocial Readiness for College Questionnaire
The PRCq was designed as a tool for the early identification of students at risk of dropping out during their first year of college, assessing six psychosocial factors of college readiness. In Study 5, we tested the PRCq’s validity for predicting students’ academic status at the end of the first year: Did these first-year students persist or drop out?
Method
Participants and Procedure
The participants in this study were the students from the two cohorts of first-year university students who completed the PRCq in Study 2. After reporting general demographic information, the students were asked if they consented to link their responses on the PRCq with additional information from the Student Administration Office. The following analyses examine the data of the 1,695 university students who selected “Yes, I agree” (80% of the students). For these students, we obtained information from the Student Administration regarding whether they were registered as students for the following academic year (or dropped out).
Preliminary Analyses
For each student, we calculated the six PRCq scale scores. First, we standardized the six raw scores to Z-scores within each PRCq scale. Next, for each scale, we classified students as “at risk” for dropping out if their Z score was < −1.5. Thus, participants were assigned six dichotomous risk classifications (“ready” or “at risk”) according to their scores in each of the PRCq scales. Then, we assigned two dropout risk indicators to each participant. The first indicator comprised two classifications: at risk for dropping out based on one or more PRCq scales (“1”) or not at risk (in any scale; “0”). The second indicator comprised three classifications: at high risk for dropping out based on low scores in two or more PRCq scales (“2+”), at moderate risk, being at risk due to a low score in only a single PRCq scale (“1”), or not at risk (no low score in any scale; “0”).
Results
The Associations between the Predicted and the Observed Frequencies of Dropout among First-Year Students (N = 1695).
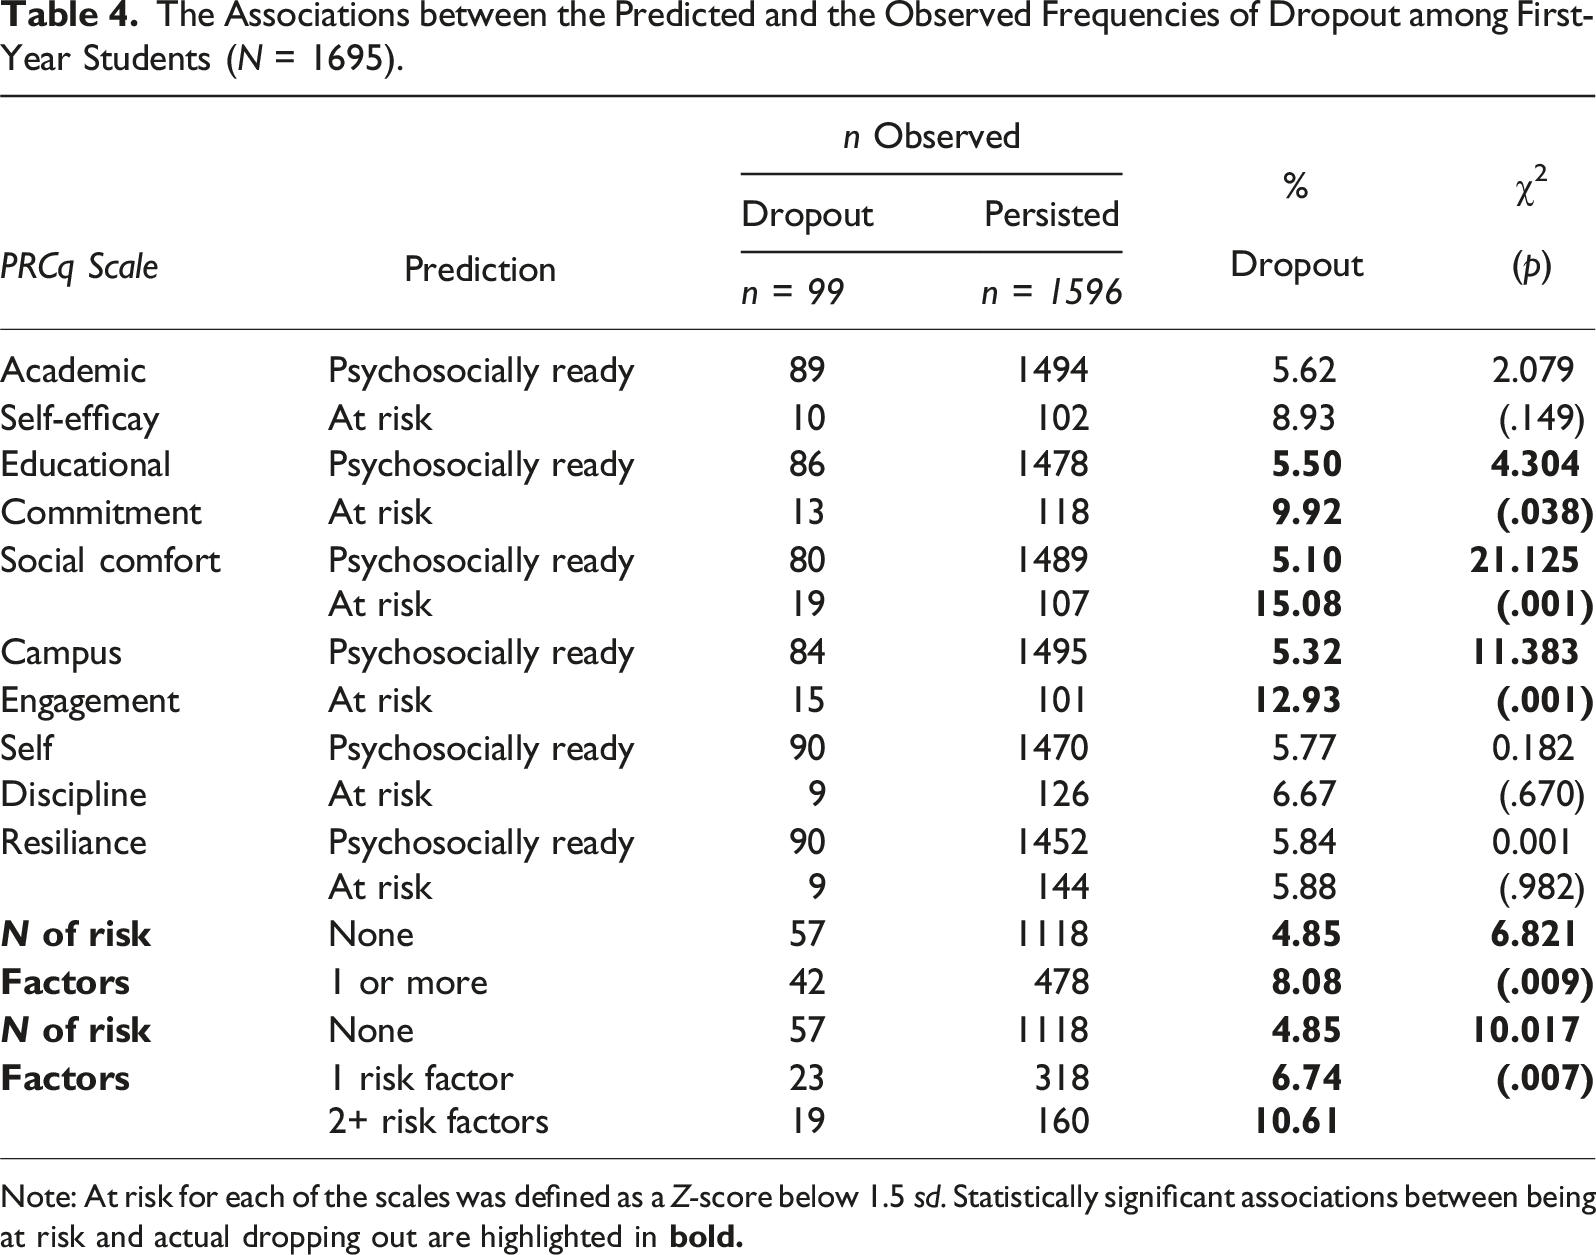
Note: At risk for each of the scales was defined as a Z-score below 1.5 sd. Statistically significant associations between being at risk and actual dropping out are highlighted in
Next, we compared the dropout rates of those “at risk in one or more scales” with participants that were “ready for college” in all six scales, presented at the bottom of Table 4. The results show, as expected, that the dropout rate (8.08%) was higher among “at risk” students based on one or more scales than the “ready for college” students (4.85%) in all scales. Finally, we conducted an additional comparison among the following three groups: (a) high risk of dropping out, (b) moderate risk of dropping, or (c) not at risk of dropping out. As seen in the lowest section of Table 4, the dropout rates differed among the three groups. Those with two or more risk factors were 2.19 times as likely to drop out of college (10.61%) than students with no risk factors (4.85%), χ2 (1, N = 1354) = 9.739, p < .01). Although the dropout rate among those with two or more risk factors was 1.57 times higher than those with only one risk factor (6.74%), this difference was not statistically significant, χ2(1, N = 520) = 2.367, p = .124.
To examine the sensitivity of the results to the chosen cut-off point, we repeated the analyses in Table 4 with a Z cut-off score of below −2.0. The results resembled those reported in Table 4. However, a noteworthy difference emerged regarding the effect of the number of risk factors on the dropout rate: With a cut-off point of −2.0 SD, the percentage of dropouts increased from 10.61% to 16.07%, highlighting those who are at high risk of dropping out due to very low readiness (i.e., Z below −2 SD) in two or more scales.
General Discussion
The present research aimed to develop and test the Psychosocial Readiness for College questionnaire to assess psychosocial factors related to college readiness, targeting students in their early twenties and older. We developed and then examined the PRCq on five large samples of first-year college students in Israel. Analysing data from five cohorts, we tested the PRC’s construct validity, measurement invariance, convergent and discriminant validity (using high school GPA, PET, and the Big Five personality traits), and predictive validity (using the criterion of students' retention rate after one year). Developing a measure of psychosocial readiness for older students who have deferred enrollment to higher education and who have already chosen their major(s) is crucial for facilitating their successful transition into higher education. Early identification of students at risk of dropping out due to inadequate psychosocial readiness can facilitate interventions addressing modifiable risk factors related to dropping out, beginning them as early as feasible, before students encounter the common college challenges (e.g., falling behind, failing exams, feeling stressed) that may lead to dropping out.
The findings supported the PRCq’s psychometric qualities: the scales' reliabilities and the questionnaire’s factor structure. The results of the CFA supported the PRC’s six-scale structure, yielding fit indices better than an alternative structure comprising a single higher-order construct of general psychosocial readiness for academic studies. This finding aligns with reports on the SSI (Gore et al., 2019) and the CLEI (Krumrei-Mancuso et al., 2013). The PRCq targets a wider range of relatively older prospective students, specifically those deferring their academic pursuits following high school graduation. The previously cited assessments were designed for prospective students still in high school or at the early stages of their college studies, often before deciding on their major. Consequently, these assessments relied upon students' recent high school or early college experiences (e.g., Krumrei-Mancuso et al., 2013; Le et al., 2005; Gore et al., 2019). The increasing frequency of students taking gap years between high school and college and the increased enrollment of non-traditionally-aged students (Brock, 2010) highlights the importance of a later-age-relevant assessment in Israel and other countries.
Further examination of the PRCq concerning various background variables supported its measurement invariance across age, gender, SES, non/FGCS, and institution type. This enabled us to examine group differences that yielded small to moderate effect sizes. Interestingly, “birth factors” (age and gender) manifested larger differences in the PRCq scores (median effect size 0.15) than “family factors” (SES and non/FGCS; median 0.07). As interventions cannot modify birth or family circumstances, these findings highlight the importance of focusing on individual differences in psychosocial dimensions within these groups to identify individuals at greater risk of dropping out. These findings align with Le et al. (2005), underscoring that the main source of variance in one’s psychosocial readiness is within-group and not between groups. Mapping every student’s college readiness profile would facilitate addressing each person’s specific needs in a tailored intervention. This approach highlights the importance of focusing on individuals' strengths and weaknesses (dispositional factors; Carroll et al., 2009; Bowles & Brindle, 2017) within the context of their group affiliation (situational factors) and college environment (institutional factors).
An examination of age-related differences showed that younger students scored higher on Academic Self-Efficacy, Educational Commitment, and Self-Discipline than older students but lower on Social Comfort and Resilience. Older students’ lower Academic Self-Efficacy may be due to the long gap since their most recent formal learning experience (Chung et al., 2017). Older students may also be mindful of the multiple roles and tasks they will have to cope with while in college and feel less confident about the prospects of success, contributing to their reported lower Self-Discipline. However, it may be that students who deferred college until after age 25 had been initially less confident about going to college due to self-doubts regarding their academic performance (Martin, 2010). In line with this explanation, whereas younger students report almost total commitment to college, older students’ responses tend to be more moderate (Gilardi & Guglielmetti, 2011).
Additionally, older-age students' higher resilience may reflect their emotional maturity stemming from cognitive development and life experience (Sorrel et al., 2016). Thus, older students’ previous coping experiences may have contributed to their resilience skills, such as emotion regulation and problem-solving (Chung et al., 2017). As hypothesized, older students scored higher on Social Comfort than younger participants, perhaps because of existing relationships with family and work colleagues outside of college. Thus, in light of their multiple life-role commitments off-campus, they have less time or interest in social engagement on campus (Rubin & Wright, 2017).
The findings showed that low-SES students and FGCS, representing less traditional college students, scored higher on Educational Commitment, reflecting their motivation to attain a college degree. They challenge the deficit conception positing that students from disadvantaged backgrounds lack critical traits or behaviors rather than highlighting their strengths (Garriott, 2020; Mckay & Devlin, 2016). These findings underscore that for students from disadvantaged backgrounds to get to the point of applying to college and persevere to graduation, they have to be driven by high levels of motivation (Mckay & Devlin, 2016; Sedlacek, 2011). It is beyond the scope of this paper to review the many antecedents, including structural and social barriers that motivate nontraditional young adults to struggle to attain a college education. Moreover, their challenges include facing inequality as they maneuver in higher education (Saar et al., 2014). These challenges notwithstanding, the present study points to a critical strength––their higher levels of educational commitment––as a resource that can help nontraditional students succeed in college.
The results of Study 3 supported the discriminant validity of the PRCq, reflected in the weak associations between scholastic aptitude measures and psychosocial factors, aligning with previous findings that differentiated between academic and psychosocial factors impacting college persistence (King & Ndum, 2017; Komarraju et al., 2013; Robbins et al., 2004). In Study 4, as expected, Big Five personality traits were associated with particular PRCq scales. These findings support the claim that the PRCq is associated with personality measures and is distinct from cognitive measures.
Finally, Study 5’s results support PRCq’s predictive validity. However, it is noteworthy that the observed support for the PRCq’s predictive validity is likely an underestimate of the detrimental effects of low psychosocial readiness on retention, and this is for two primary reasons. First, the dropout rate between the first and the second year among the participants who completed the PRCq at the specific research university was lower (5.8%) than the national dropout rate among first-year students (8.7%; CBS, 2018). Second, the participation rate for completing the PRCq was about 30% in the two studied cohorts. The dropout rate among those who did not comply with the request to complete the PRCq was higher (12.5%) than among the questionnaire completers (5.8%; Phillips-Berenstein & Gati, 2021). Thus, those agreeing to participate may have been more inclined to seek support and utilize relevant university resources when encountering difficulties.
Lower PRCq scores were associated with a higher risk of dropping out, and those revealing one or more risk factors were more likely to drop out than those with no risk factors. Moreover, the consequences of severe low readiness (i.e., scoring below the −2 SD cut-off) were dramatic: Whereas the dropout rate was 5% among those with no risk factors and 7% among those with a single risk factor, the dropout rate was 16% among those with very low readiness scores in two or more scales. Those with only a single risk factor may have more compensatory resources to cope with the various college challenges (You, 2018). Consequently, targeted interventions in urgency and intensity should prioritize students with two or more PRCq scale scores below the −2 SD cut-off. Future research should further explore each dimension’s differential effect and each scale’s optimal cut-off point. In addition, the PRCq’s contribution in predicting higher GPAs among the persisting students should also be examined as an additional criterion for academic success.
Limitations and Future Research
The research is the first of its kind and magnitude in Israel. However, the studies’ samples comprised less than 50% of the target population of first year students, as their participation in all institutions was voluntary and, thus, may not adequately represent all first-year students. Those agreeing to complete the readiness questionnaire are likely to be more motivated, committed, or socially and emotionally more confident than students who chose to ignore the invitation to complete a questionnaire aimed at “successful integration into college.” Given the desirability of higher participation rates, we suggest considering incentives to encourage completing the PRCq or having the academic institution make it mandatory after enrollment, before beginning college, or during orientation day.
Deferring college in Israel until age 25 is prevalent; however, an extended delay beyond age 25 can be attributed to the deliberation about whether to attend college or what to study. Future studies should consider exploring the reasons for this delay and its impact on persistence. Thus, the characteristics of the students in this research should be considered before drawing conclusions regarding age-equivalent students in other countries. Therefore, future research is necessary to determine the applicability of the PRCq for assessing psycho-social readiness to identify students at risk of dropping out in other countries.
Psychosocial college readiness facilitates college persistence and GPA (Allen et al., 2009; King & Ndum, 2017). Thus, future research should further test the predictive validity of the PRCq on first-year outcomes, over and above high school GPA and the PET. Predictive validity should be assessed for each dimension, and their respective contributions to each outcome should be examined. Finally, a critical challenge for further research and practice is identifying each scale’s optimal cut-off scores indicative of drop-out risk. As each scale yielded a different mean and standard deviation, future research should explore the utility of Z-scores or percentiles. Future studies should also test whether cut-off points differ for various groups (e.g., institutions, departments, gender, age, SES, or ethnic groups) and whether background and psychosocial factors have a cumulative effect on persistence.
Implications for Practice
The universality of the PRCq’s item content makes it suited to a wide range of young adults. These include students who begin their undergraduate studies after one or more gap years as well as students going straight into college. The PRCq is brief (30 items, 5–8 minutes), is administered online, and allows for immediate feedback.
Implication for Higher Education Institutions
The PRCq identifies students' unique patterns of readiness and hence, can facilitate designing tailored interventions for specific groups (e.g., part-time, evening, or international students), as well as for each student according to their unique needs and dispositional barriers. Elder (2021) recommended creating a comprehensive pre-college profile for each student (including background and non-cognitive variables) and being proactive in anticipating barriers. The PRCq can be a possible avenue in this direction. In addition to the direct beneficial effects of individual and group interventions on psychosocial factors (Fong et al., 2017), these interventions accord an important byproduct to academic institutions as a retention facilitator. Designing programs that nurture personal development increases feelings of belonging, especially among minority students (Atuahene, 2021). It remains for academic institutions to cultivate an advising culture that encourages students to use the available services (Mu & Fosnacht, 2019). While institutions cannot intervene when it comes to background variables such as age, gender, or FGCS, they can take measures to promote the social and academic integration of students from disadvantaged backgrounds (Atuahene, 2021), targeting areas emerging as potential hurdles to graduation by the PRCq.
The PRCq should not be used to screen for college admissions but rather as a means to augment student success following admission. Determining the optimal timing and setting for administering the PRCq is the key to successfully implementing early detection of potential college dropouts. Administering the questionnaire only after admission promotes candid replies and minimizes potential social desirability or self-concealing responses. Ideally, the PRCq should be routinely administered after the students commit to begin their studies (e.g., by paying the first tuition slip) but before the beginning of the school year to avail students of the support services that could facilitate their successful transition to college.
Implication for Counselors
Assessing factors of psychosocial readiness is crucial, as at-risk factors can be addressed through relatively brief and focused educational interventions (Fong et al., 2017; Gore et al., 2019), thus, offering the prospect of reducing risk factors and promoting college readiness at an early stage of college (Krumrei-Mancuso et al., 2013). The informative six-scale profile of the PRCq can be easily interpreted by professionals during the three stages of intervention: (a) identifying students at risk of dropping out, (b) tailoring the intervention to students’ specific needs, and (c) evaluating the effectiveness of the intervention. Flagging students with “low” readiness scores on one or more scales could be brought to the attention of college counselors to implement tailored interventions for individuals or for groups of students with similar needs.
Finally, PRCq’s interpretation should consider the relevant cohort and institutional baselines to determine the cut-off point for identifying at-risk students at each college. Therefore, when applying the PRCq to reduce dropout rates and design appropriate interventions, we suggest using standardized scale scores from the latest available cohort data. From a counseling perspective, there is a growing recognition that meeting students’ needs has become a critical feature of the counselor’s work, especially in the wake of growing student diversity (Chung et al., 2017), resulting in continued professionalization of college advising (Mu & Fosnacht, 2019).
Footnotes
Acknowledgments
We thank Ella Anghel, Benny A. Benjamin, Tair Buzaglo, Tony Gutentag, Nimrod Levin, Shada Kashkush, Yuliya Lipshits-Braziler, Michal Slama, and Adi Tene for their helpful comments on earlier versions of this paper.
Declaration of Conflicting Interests
The author(s) declared the following potential conflicts of interest with respect to the research, authorship, and/or publication of this article: The PRC questionnaire was and currently is free. It may be that in the future, the research and development authority of the Hebrew University will be interested in finding a partner to develop an elaborated feedback to each student and distribute it to all first year students in Israel.
Funding
This research was supported by the Israeli National Institute for Testing and Evaluation, The Rosalinde and Arthur Gilbert Foundation, and the Joseph S. and Caroline Gruss Life Monument Fund. Michal Phillips-Berenstein was partially supported by a Scholarship of The Seymour Fox School of Education, Tirza Willner was supported by the Azrieli Foundation. Itamar Gati was supported by the Samuel and Esther Melton Chair.
Appendix
Exploratory Factor Analysis of the PRCq (University N = 1239)
Note. ASE = Academic Self-Efficacy, EC = Educational Commitment, SC = Social Comfort, CE = Campus Engagement, RES = Resiliency, SD = Self-Discipline; r-reversed item.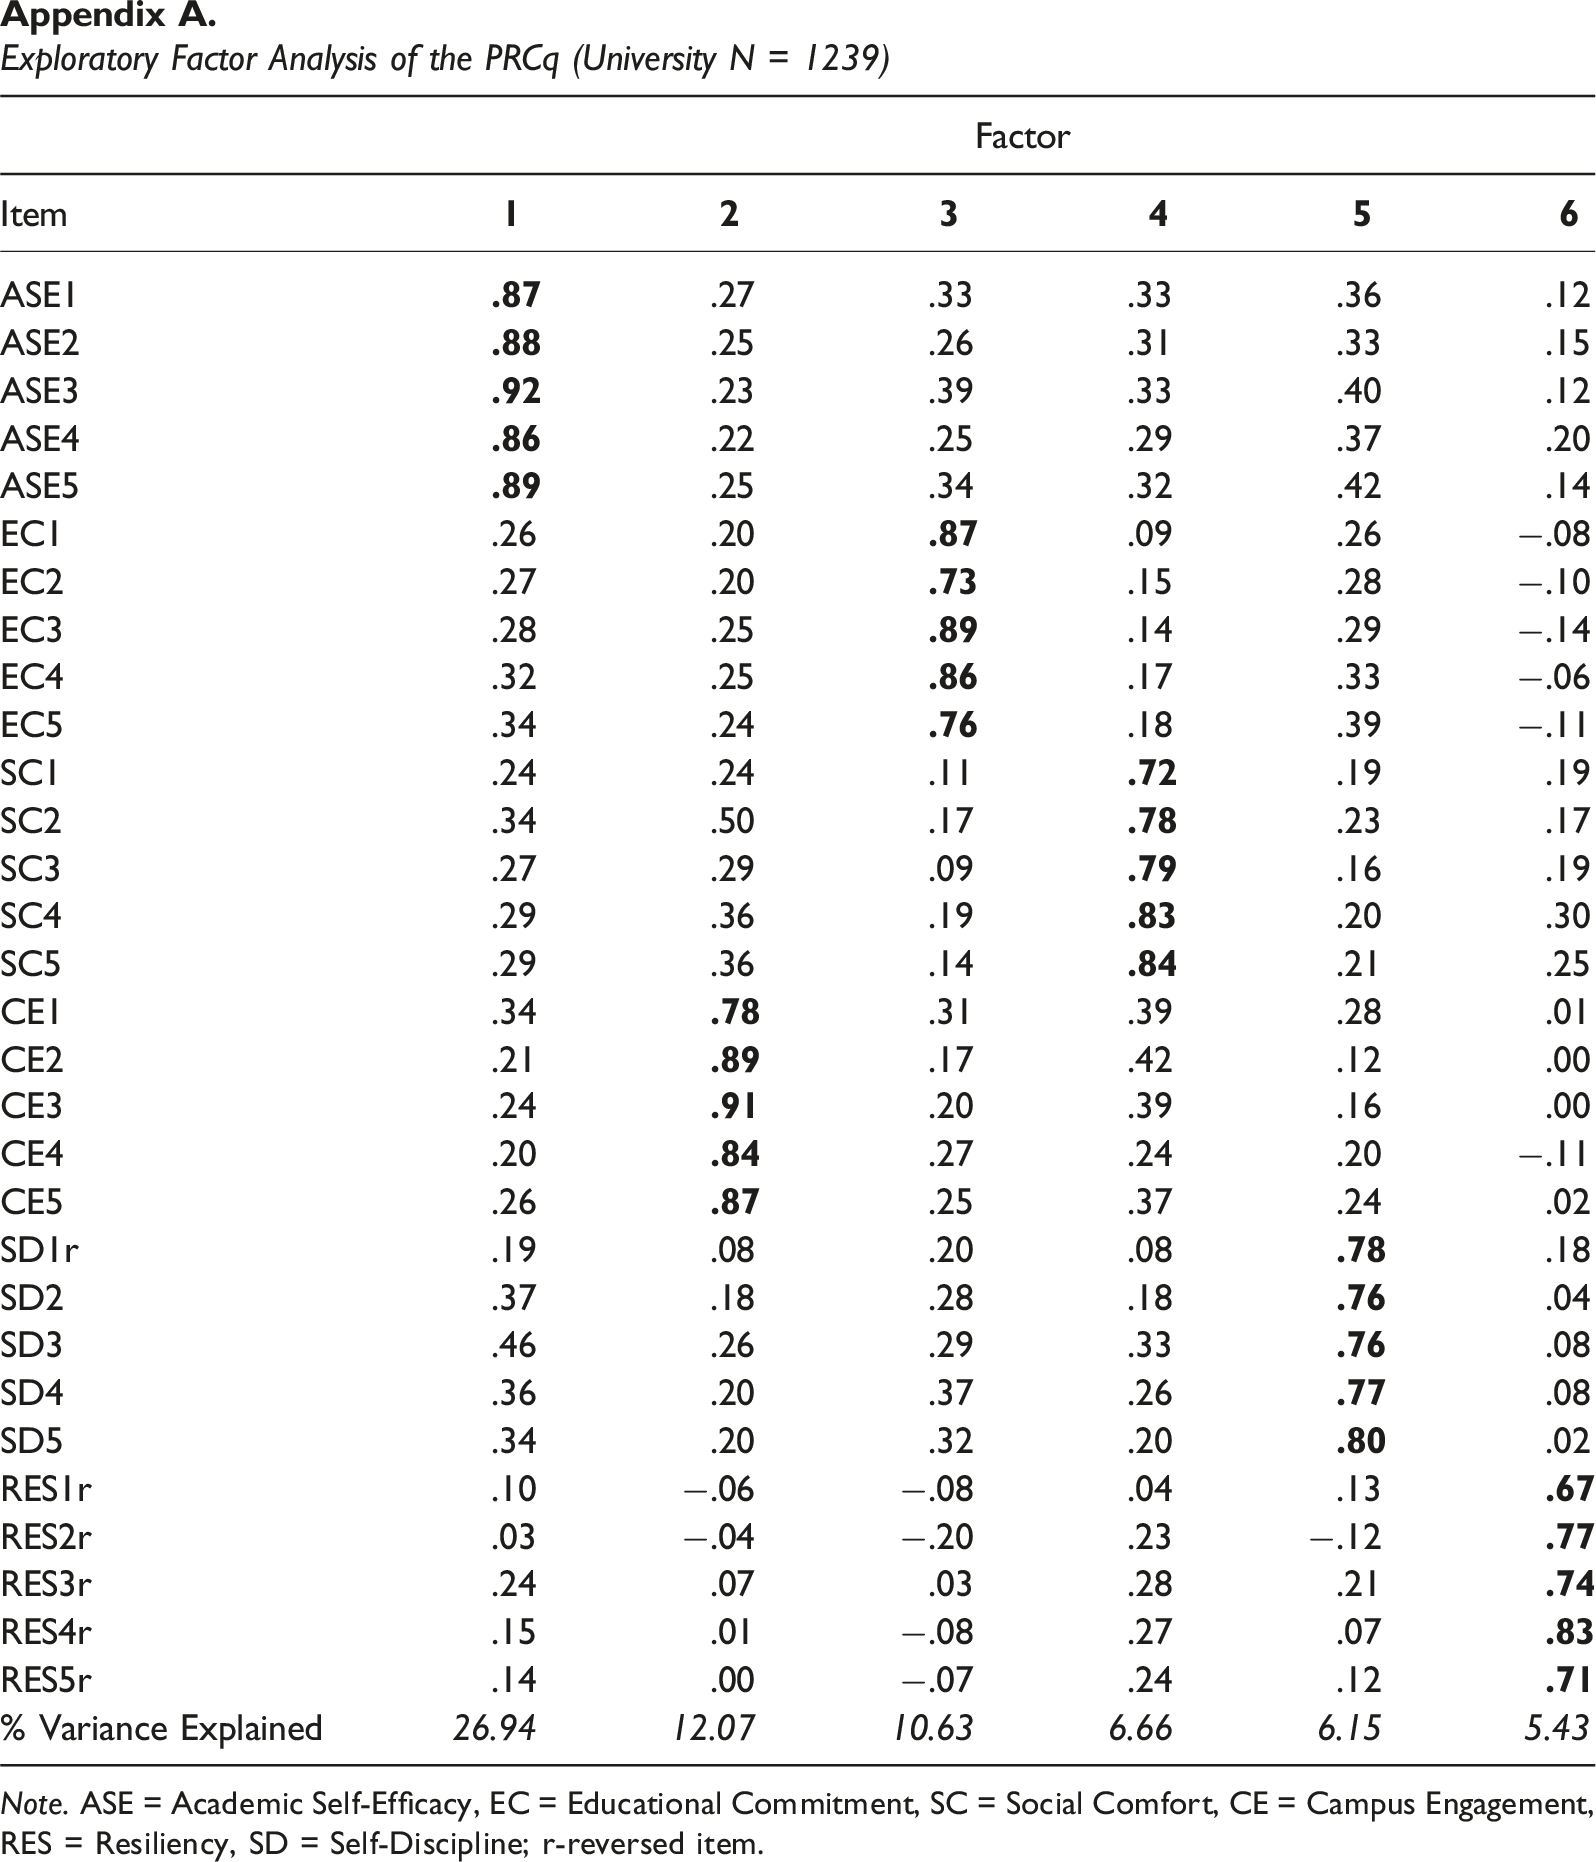
Factor
Item
ASE1
.27
.33
.33
.36
.12
ASE2
.25
.26
.31
.33
.15
ASE3
.23
.39
.33
.40
.12
ASE4
.22
.25
.29
.37
.20
ASE5
.25
.34
.32
.42
.14
EC1
.26
.20
.09
.26
−.08
EC2
.27
.20
.15
.28
−.10
EC3
.28
.25
.14
.29
−.14
EC4
.32
.25
.17
.33
−.06
EC5
.34
.24
.18
.39
−.11
SC1
.24
.24
.11
.19
.19
SC2
.34
.50
.17
.23
.17
SC3
.27
.29
.09
.16
.19
SC4
.29
.36
.19
.20
.30
SC5
.29
.36
.14
.21
.25
CE1
.34
.31
.39
.28
.01
CE2
.21
.17
.42
.12
.00
CE3
.24
.20
.39
.16
.00
CE4
.20
.27
.24
.20
−.11
CE5
.26
.25
.37
.24
.02
SD1r
.19
.08
.20
.08
.18
SD2
.37
.18
.28
.18
.04
SD3
.46
.26
.29
.33
.08
SD4
.36
.20
.37
.26
.08
SD5
.34
.20
.32
.20
.02
RES1r
.10
−.06
−.08
.04
.13
RES2r
.03
−.04
−.20
.23
−.12
RES3r
.24
.07
.03
.28
.21
RES4r
.15
.01
−.08
.27
.07
RES5r
.14
.00
−.07
.24
.12
% Variance Explained
26.94
12.07
10.63
6.66
6.15
5.43