
Abstract
Assessing the causes of career indecision is among the first steps in career counseling. Gati et al. (1996) proposed a multidimensional taxonomy of career indecision and developed the Career Decision-Making Difficulties Questionnaire (CDDQ), consisting of 10 scales that cohere into three higher-order clusters and a total score. However, studies investigating the CDDQ reported cross-cultural variations in its factor structure. To examine the cross-cultural generalizability of the CDDQ, we compared four alternative factor models using data from 39 diverse samples from 13 countries with nine language versions (N = 19,562). Using weighted least squares mean- and variance-adjusted estimation, a robust estimator for nonnormal data, comparison of fit indices supported the original CDDQ structure across countries and languages. These findings support the cross-cultural generalizability of the structure of the CDDQ and the use of 10 scale scores, three cluster scores, and a total score, consistent with the taxonomy underlying the CDDQ.
Keywords
Introduction
Overcoming career decision-making difficulties is considered a precondition for making satisfying career decisions (Peterson et al., 2002). For this reason, counseling individuals with career decision-making difficulties often begins with assessing the causes of their difficulties, enabling practitioners to tailor interventions to clients’ unique needs. The term career indecision was adopted to refer to the various difficulties encountered by individuals during the process of choosing a career, suggesting that individuals experiencing career indecision are less likely to identify a preferred alternative or develop sufficient commitment to an educational or vocational choice (Osipow, 1999).
Gati et al. (1996) proposed a taxonomy of career decision-making difficulties and developed a theory-driven, widely used assessment of career indecision: the Career Decision-Making Difficulties Questionnaire (CDDQ). The taxonomy underlying the CDDQ conceptualizes career indecision as multidimensional with the dimensions of career indecision hierarchically arranged at three levels: 32 items yield 10 scale scores; and they can be combined to represent three higher-order clusters as well as a total score. To date, the CDDQ has been translated into 48 languages and implemented in research and practice in more than 60 countries (Levin et al., 2020; Xu & Bhang, 2019). Nevertheless, factor analyses involving different language versions of the CDDQ in many countries did not result in a consistent and theoretically defensible structure. Thus, despite its widespread use, the factor structure of the CDDQ remains a topic for debate. In this research, we addressed this issue by examining and comparing four models of the factor structure of the CDDQ on 39 diverse samples collected in 13 countries using nine CDDQ language versions.
Assessing Career Indecision
The first standardized methods for assessing the degree of career indecision were developed in the 1970s. These measures represented unidimensional assessments of the degree of career indecision, such as the Career Decision Scale (Osipow et al., 1976) and the My Vocational Situation (Holland et al., 1980). Second-generation measures of career indecision adopted a multidimensional approach for assessing the nature of career indecision, namely, its causes; these included the Career Decision Profile (Jones, 1989) and the Career Factors Inventory (Chartrand et al., 1990). However, both first- and second-generation measures were developed independently of theoretical considerations, but rather mostly based on the clinical impressions of practitioners seeking to map systematically the various reasons for being career undecided (Osipow, 1999).
The first theory-grounded multidimensional assessment of career indecision was developed based on Gati et al.’s (1996) taxonomy of career decision-making difficulties. Informed by decision theory, this taxonomy focused on the causes of career indecision, differentiating between three clusters: Lack of Readiness (lack of motivation, general indecisiveness, and dysfunctional beliefs), Lack of Information (about the decision-making process, the self, occupations or careers, and ways of obtaining information or help), and Inconsistent Information (unreliable information, internal conflicts, and external conflicts). This taxonomy postulated that the various causes of career indecision could be combined to form a global indicator of the degree of the overall severity of career indecision. The Career Decision-Making Difficulties Questionnaire (CDDQ) was developed based on this taxonomy, with its structure conceptualized to comprise 10 first-order scales, three second-order clusters, and one third-order total score.
The Empirical Structure of the CDDQ
The first version of the CDDQ included 44 items corresponding to the 10 specific career decision-making difficulties as proposed in Gati et al.’s (1996) taxonomy. In line with this taxonomy, the hypothesized multidimensional, three-order hierarchical structure was supported for the Hebrew version of the CDDQ using cluster analysis (Gati et al., 1996, 2000). However, analyses of the English and Chinese versions indicated that one of the 10 first-order scales—external conflicts—was positioned within the Lack of Readiness second-order cluster rather than the Inconsistent Information cluster (Gati et al., 1996; Mau, 2001; Osipow & Gati, 1998). Consequently, Mau (2001) suggested adopting a modified structure, positioning external conflicts under the Lack of Readiness cluster, whereas Xu and Tracey (2014) proposed an alternative five-factor structure with lack of motivation, general indecisiveness, dysfunctional beliefs, Lack of Information, and Inconsistent Information (including external conflicts) as five first-order factors of career indecision.
Based on accumulated psychometric data and to shorten the questionnaire, a 34-item version of the CDDQ was developed by either removing items that did not contribute significantly to their scale or combining highly correlated items (Gati & Saka, 2001). Given that most researchers and practitioners in the last two decades have used the shortened 34-item CDDQ, we focused our research on examining the structure of this version. Thirteen validation studies that used confirmatory factor analysis (CFA) to examine the structure of the 34-item CDDQ have been published (see Supplemental Appendix Table 1 in the online supplementary materials for a summary). Of these 13 studies, only three established full structural validation of the original CDDQ taxonomy at the item level. Specifically, validation of the factor structure corresponding to the original taxonomy (32–10-3–1, for 32 items as indicators, 10 first-order scales, three second-order clusters, and a third-order total score, respectively) was reported for the English (Levin et al., 2020) and French (Rossier et al., 2021; Sovet et al., 2017) CDDQ versions. Additional studies—of the Turkish (Bacanli, 2016), French (Atitsogbe et al., 2018), and English and Hebrew (Kleiman et al., 2004; Kleiman & Gati, 2004) versions—supported the original structural model of the CDDQ but did so based on all-item parceling (i.e., validating a 10–3-1 model, for 10 scale scores as indicators, three first-order clusters, and one second-order total score, respectively).
In contrast, six validation studies examining the Chinese, Croatian, Farsi, Greek, and Korean versions of the CDDQ did not confirm the factor model corresponding to Gati et al.’s (1996) taxonomy and proposed alternative factor structures. An exploratory factor analysis of the 34-item Chinese version indicated poor factor loadings of items in the Lack of Readiness second-order cluster. For this reason, an alternative model that excluded the Lack of Readiness cluster and discarded the ten first-order scales (i.e., a 19–2 model) was examined, yielding a better fit than the original model did (Creed & Yin, 2006). Other studies focused on the poor factor loadings of the dysfunctional beliefs first-order scale—a scale included in the Lack of Readiness second-order cluster—providing incremental support for an alternative model that excluded this first-order scale (Croatian version: Babarović & Šverko, 2019; Korean version: Sovet et al., 2015). For the Farsi version of the CDDQ, Vahedi et al. (2012) provided support for a model that excluded the 10 first-order scales (i.e., a 32–3-1 model), and for the Greek version, Vaiopoulou et al. (2019) preferred a model that excluded three first-order scales.
In total, at least five CDDQ factor structures have been promoted to date. Reported differences in the factor structure of the CDDQ emerged across countries and not within countries, thus questioning the cross-cultural equivalence of career indecision as measured by the CDDQ. Nevertheless, previous research supported the measurement invariance of the CDDQ across countries when the same language version was used (Atitsogbe et al., 2018; Levin et al., 2020; Rossier et al., 2021). Thus, rather than being related to cross-cultural variability, the observed structures may reflect that variations are not only related to cross-cultural differences but potentially also to differences across language versions of the CDDQ. We tested this hypothesis in our research by evaluating the factor structure across 13 countries using nine language versions of the CDDQ. The available data allowed us to examine whether different factor structures would emerge across countries that used different language versions (e.g., Poland vs. Italy) as well as countries in which the same language version was used (e.g., Canada, France, and Switzerland with the French version).
Potential Pitfalls in Previous CFAs of the CDDQ Factor Structure
Upon examining the analytical approaches of previous investigations of the structure of the CDDQ, we identified two recurring methodological decisions that may have undermined the validity of the results and conclusions of previous studies. The first decision involves the issue of parceling, namely the aggregation of items and use of parcels as indicators of latent constructs (Marsh et al., 2013; Sellbom & Tellegen, 2019). Most of the previous structural investigations of the CDDQ that validated its structure employed all-item parceling (i.e., all items in each factor are aggregated into one respective parcel). However, Sellbom and Tellegen (2019) argued that “when we evaluate the internal psychometric properties of a scale, the items responded to constitute a key focus” (p. 1429). Indeed, parceling precludes evaluating the parameter properties of individual items and, consequently, impedes factor validation; poor item loadings, which undermine the construct validity of the examined measure, cannot be identified when using parceling. Marsh et al. (2013) found that parceling items with even small cross-loadings can significantly distort results regarding the number of factors. Thus, although remaining a topic of ongoing debate (e.g., Kline, 2016), parceling may be counterproductive when the primary goal is examining the factor structure of a measure. For this reason, in our research, we did not consider CDDQ factor models that involve item parceling.
The second methodological decision implemented in previous studies of the structure of the CDDQ concerns using maximum likelihood (ML) for model estimation without ensuring that indicators conform to a multivariate normal distribution, a core assumption of ML (Beauducel & Herzberg, 2006; Li, 2016). About half of the published studies on the structure of the CDDQ reported using ML, whereas the other half did not indicate which estimator was used. Nonetheless, because ML estimation is the default estimator in most latent variable modeling software, it is likely to have been implemented. Relatedly, Sellbom and Tellegen (2019) noted that ML assumptions are often violated in psychological assessment research, namely, when indicators are Likert-type scale items or response distributions are asymmetrical (see also Kline, 2016), but no study has examined the distribution of the CDDQ items or provided any justification for the choice of ML.
Testing and comparing models with data that violate the assumptions of the implemented estimator can lead to adopting spurious models and rejecting better ones. When the distribution of responses significantly diverges from a normal distribution, indicators should be treated as ordered-categorical (ordinal). In such cases, weighted least squares estimators constitute a better and more robust alternative to ML. Despite several weighted least squares estimators, weighted least squares mean- and variance-adjusted (WLSMV) estimation is considered preferable (Kline, 2016; Sellbom & Tellegen, 2019). Indeed, simulation studies have shown that WLSMV outperforms ML estimation in the precision of estimation of parameters across various conditions (Beauducel & Herzberg, 2006; Li, 2016). Thus, if the use of ML for the examination of the factor structure of the CDDQ is inadequate, then the conclusions of previous studies based on ML can be called into question.
The Present Study
The main goal of the study was to examine the factor structure of the CDDQ and the compatibility of the best-fitting solution with Gati et al.’s (1996) taxonomy of career decision-making difficulties. Inconsistencies regarding the factor structure of the CDDQ reported in previous studies may had been confounded by the use of various language versions. For this reason, our research examined the factor structure of the CDDQ both within and across countries, with data derived from 39 samples collected in 13 countries from five continents, using nine language versions. In addition, inconsistencies regarding the factor structure of the CDDQ could be the result of the estimators used in the previous analyses of the CDDQ data. For this reason, we first inspected whether the CDDQ items are normally distributed to inform our decision of which estimator to use in the structural analyses—ML or WLSMV, the latter constituting the robust estimator when dealing with nonnormal data.
After determining which estimator to implement, we compared four alternative models: (a) the original CDDQ model that corresponds to Gati et al.’s (1996) taxonomy and includes 10 first-order scales, three second-order clusters, and one third-order total score, (b) a 10-factor model that includes 10 first-order scales and one second-order total score but without the three cluster-level factors, (c) a 3-factor model that includes three first-order clusters and one second-order total score but without the 10 scale-level factors, and (d) a unidimensional model comprising only a single total score. We determined the labels of the three alternative models by the number of first-order factors included in each model. We did not test additional models that involve excluding some of the CDDQ items given substantial evidence supporting the criterion validity of the total score of the CDDQ, which is computed based on the aggregation of all CDDQ items. Finally, we also examined the measurement invariance of the CDDQ across countries in which the same language version was used to examine further the effect of the cultural context on the measurement of career indecision without confounding differences that might be related to translation. The data analyzed in this study represent the various populations to which the CDDQ is typically administered, including middle school, high school, preacademic, college student, mixed (e.g., students and workers), and counseling samples. In this regard, by analyzing diverse data in the study, we aimed to provide conclusions that are more definitive regarding the adequacy of the 10 CDDQ scale scores, three cluster scores, and one total score.
Method
Transparency and Openness
We report the way we determined the sample size and all data exclusions, manipulations, and measures in the study, and we follow journal article reporting standards. The data, analysis codes, and research materials are available by request from the first author. Data preparation and normality analyses were conducted in Python, and structural and reliability analyses were conducted in R. CFAs were conducted using the lavaan package in R (Rosseel, 2012). The design of the study and its analysis were not preregistered.
Procedure
To examine the factor structure of nine language versions of the 34-item CDDQ across 13 countries, we relied on secondary data previously collected for diverse research purposes by the authors (10 samples) and other researchers (29 samples). We did not include 22 additional data sets for the following reasons: 15 samples were excluded because their aggregated country samples were too small for CFA analyses considering the complexity of the compared models (N > 500; Kline, 2016; Wolf et al., 2013), and seven samples were excluded because they were used in a previous study testing the factor structure of the English version of the CDDQ and would have biased the results of the study given their overall large sample size (N = 32,556; Levin et al., 2020). We ensured that local institutional review board approvals had been obtained for all included data sets (see Supplemental Appendix 3 in the online supplementary materials for details on the sources and procedures of each sample).
Participants
Sample Characteristics.
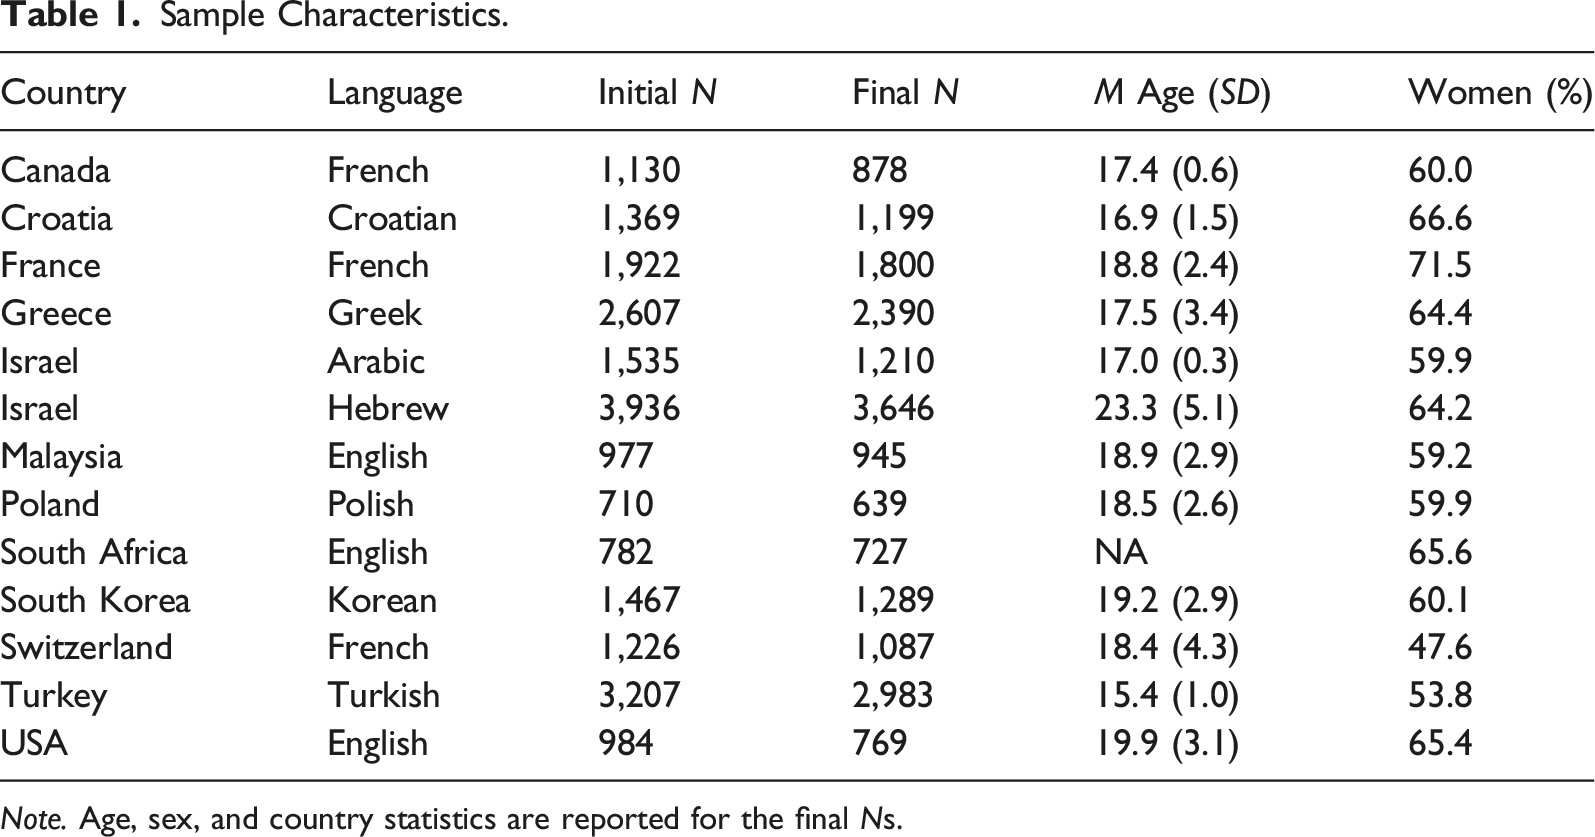
Note. Age, sex, and country statistics are reported for the final Ns.
Measures
The Career Decision-Making Difficulties Questionnaire.
The 34-item version of the CDDQ comprises 32 items representing career decision-making difficulties and two validity items (Gati et al., 1996; Gati & Saka, 2001). The CDDQ measures 10 specific causes of difficulties grouped in three major clusters of Lack of Readiness, Lack of Information, and Inconsistent Information. In addition, a total difficulty score can be computed. The Lack of Readiness cluster includes three scales: (a) lack of motivation (three items; e.g., “I know that I have to choose a career, but I don’t have the motivation to make the decision now”), (b) general indecisiveness (three items; e.g., “It is usually difficult for me to make decisions”), and (c) dysfunctional beliefs (four items; e.g., “I expect that entering the career I choose will also solve my personal problems”). The Lack of Information cluster includes Lack of Information about (a) the decision-making process (three items; e.g., “I find it difficult to make a career decision because I do not know what steps I have to take”), (b) the self (four items; e.g., “I find it difficult to make a career decision because I am not yet sure about my career preferences”), (c) occupations or careers (three items; e.g., “I find it difficult to make a career decision because I do not have enough information about the variety of occupations or training programs that exist”), and (d) ways of obtaining information or help (two items; e.g., “I find it difficult to make a career decision because I do not know how to obtain accurate and updated information about the existing occupations and training programs, or about their characteristics”). The Inconsistent Information cluster includes three scales: (a) unreliable information (four items; e.g., “I find it difficult to make a career decision because I have contradictory data about the existence or the characteristics of a particular occupation or training program”), (b) internal conflicts (five items; e.g., “I find it difficult to make a career decision because I’m equally attracted to a number of careers and it is difficult for me to choose among them”), and (c) external conflicts (two items; e.g., “I find it difficult to make a career decision because people who are important to me, such as parents or friends, do not agree with the career options I am considering and/or the career characteristics I desire”). Whereas responses are typically reported on a 9-point Likert-type scale ranging from 1 (does not describe me) to 9 (describes me well), in three of the samples (Malaysia 03, Turkey 01, and Turkey 03), responses were elicited using a 5-point Likert-type scale. Scale, cluster, and total scores are calculated as the means of the responses; higher scores indicate more severe career decision-making difficulties. For the 34-item English version of the CDDQ, Levin et al. (2020) reported Cronbach alpha internal consistency reliability estimates of .94 for the total score and .66, .94, and .88 for the three clusters, as well as a median internal reliability estimate of .79 for the 10 scale scores. In addition to the original English and Hebrew 34-item versions, seven additional language versions were examined in our study: Arabic, Croatian, French, Greek, Korean, Polish, and Turkish (see Supplemental Appendix 4 in the online supplementary materials for a summary of their psychometric properties).
Data Analysis
We surmised that the inconsistencies of previous results could be related to the issue of item properties and the use of ML estimation. Therefore, in this study, we first examined the degree of item normality, so if severe divergence from normality was detected, the fit of the structural models would be estimated with WLSMV. We relied on three criteria to evaluate the normality of the 32 CDDQ items (excluding the two validity items): (a) kurtosis and skewness values, referring to absolute values greater than 1 as indicative of nonnormality, (b) the Shapiro–Wilk test statistics for univariate normality, and (c) Mardia’s (1970) test statistics for multivariate normality. Choice of an estimator would depend on the results of these analyses: ML, which was applied in previous CDDQ validation studies (see Supplemental Appendix Table 1 in the online supplementary materials), is discouraged for use in analyzing nonnormal data; instead, the WLSMV estimator is preferable in such cases (Li, 2016; Sellbom & Tellegen, 2019).
Structural analyses were conducted using the lavaan package in R (Rosseel, 2012). Four CFA models were tested and subsequently compared to investigate the structure underpinning the CDDQ: (a) the original CDDQ model with 10 first-order scales, three second-order clusters, and one third-order total score (32–10-3–1); (b) a 10-factor model with 10 first-order scales and one second-order total score (32–10-1); (c) a three-factor model with three first-order clusters and one second-order total score (32-3–1); and (d) a unidimensional model with only a single first-order total score (32–1). In all models, items were only allowed to load on their target factors with cross-loadings constrained to zero. These four models were tested both within and across the 13 country samples.
To assess model fit, we relied on various standard goodness-of-fit indices with their respective thresholds (Hu & Bentler, 1999; Marsh et al., 2005). These indices included the comparative fit index (CFI; ≥ .95 for good, ≥ .90 for acceptable), the Tucker-Lewis index (TLI; ≥ .95 for good, ≥ .90 for acceptable), the root mean square error of approximation (RMSEA; ≤ .06 for good, ≤.08 for acceptable), and the standardized root mean square residual (SRMR; ≤ .06 for good, ≤ .10 for acceptable). Because the χ2 statistic is sensitive to sample size (Marsh et al., 2005), we did not evaluate model fit using this index. Furthermore, we did not compare models using Akaike’s information criterion or Bayesian information criterion because these fit indices are less reliable for weighted least squares estimators. Nevertheless, whereas the purpose of Akaike’s information criterion and the Bayesian information criterion is to estimate which models are more likely to replicate in subsequent samples, the design of our study allowed testing of the cross-validation of models directly.
In addition to evaluating models based on fit indices, we also inspected parameter estimates (e.g., factor loadings and correlations) and the theoretical conformity of the models (Marsh et al., 2004; Sellbom & Tellegen, 2019). First, a combination of positive and negative factor loadings denotes that indicators should be reversed. Second, weak factor loadings (λ < .40; Sellbom & Tellegen, 2019) reflect that indicators do not explain a significant proportion of the variance of their target factors. Third, large factor correlations (r > .80; Brown, 2015) indicate that factors may in fact measure the same construct (i.e., poor discriminant validity). Fourth, regarding theoretical conformity, when model fit indices and parameter estimates do not provide enough information to identify the best model, a model with greater theoretical conformity should be preferred.
We also assessed the reliability of the CDDQ items in the retained model. We calculated composite reliability (CR; Raykov, 1998) rather than Cronbach’s α because the latter is considered a biased estimator for determining the reliability of factors (Yanyun Yang & Green, 2011). In contrast, CR values are model-based, and their calculation aggregates factor loadings and measurement errors. CR values above .60 are considered acceptable, and CR values above .70 are good (Bagozzi & Yi, 1988).
Finally, we estimated the measurement invariance of the CDDQ across countries in which the same language version was used. A series of multiple group confirmatory factor analyses were performed, sequentially constraining parameters in three models. The initial configural model tests the equivalence of the factor structure across compared groups (i.e., the number of factors and patterns of factor loadings). Then, in the metric model, factor loadings are constrained to be equal across groups. Finally, in the scalar model, indicator intercepts are constrained to be equal across groups. By sequentially comparing and testing the decrease in fit across models, measurement invariance can be evaluated. When a less restrictive model yields better fit, the assumption of measurement invariance for the more restrictive model should be rejected. In our research, we evaluated fit differences using three criteria: changes in CFI, RMSEA, and SRMR values. A change of .010 in CFI supplemented by a change of .015 in RMSEA or .030 in SRMR indicates a lack of metric invariance; a change of .010 in CFI supplemented by a change of .015 in RMSEA or a change of .010 in SRMR indicates a lack of scalar invariance (Chen, 2007).
Results
Normality Analyses
Statistics and Tests of Univariate and Multivariate Normality Across and Within Country Samples.
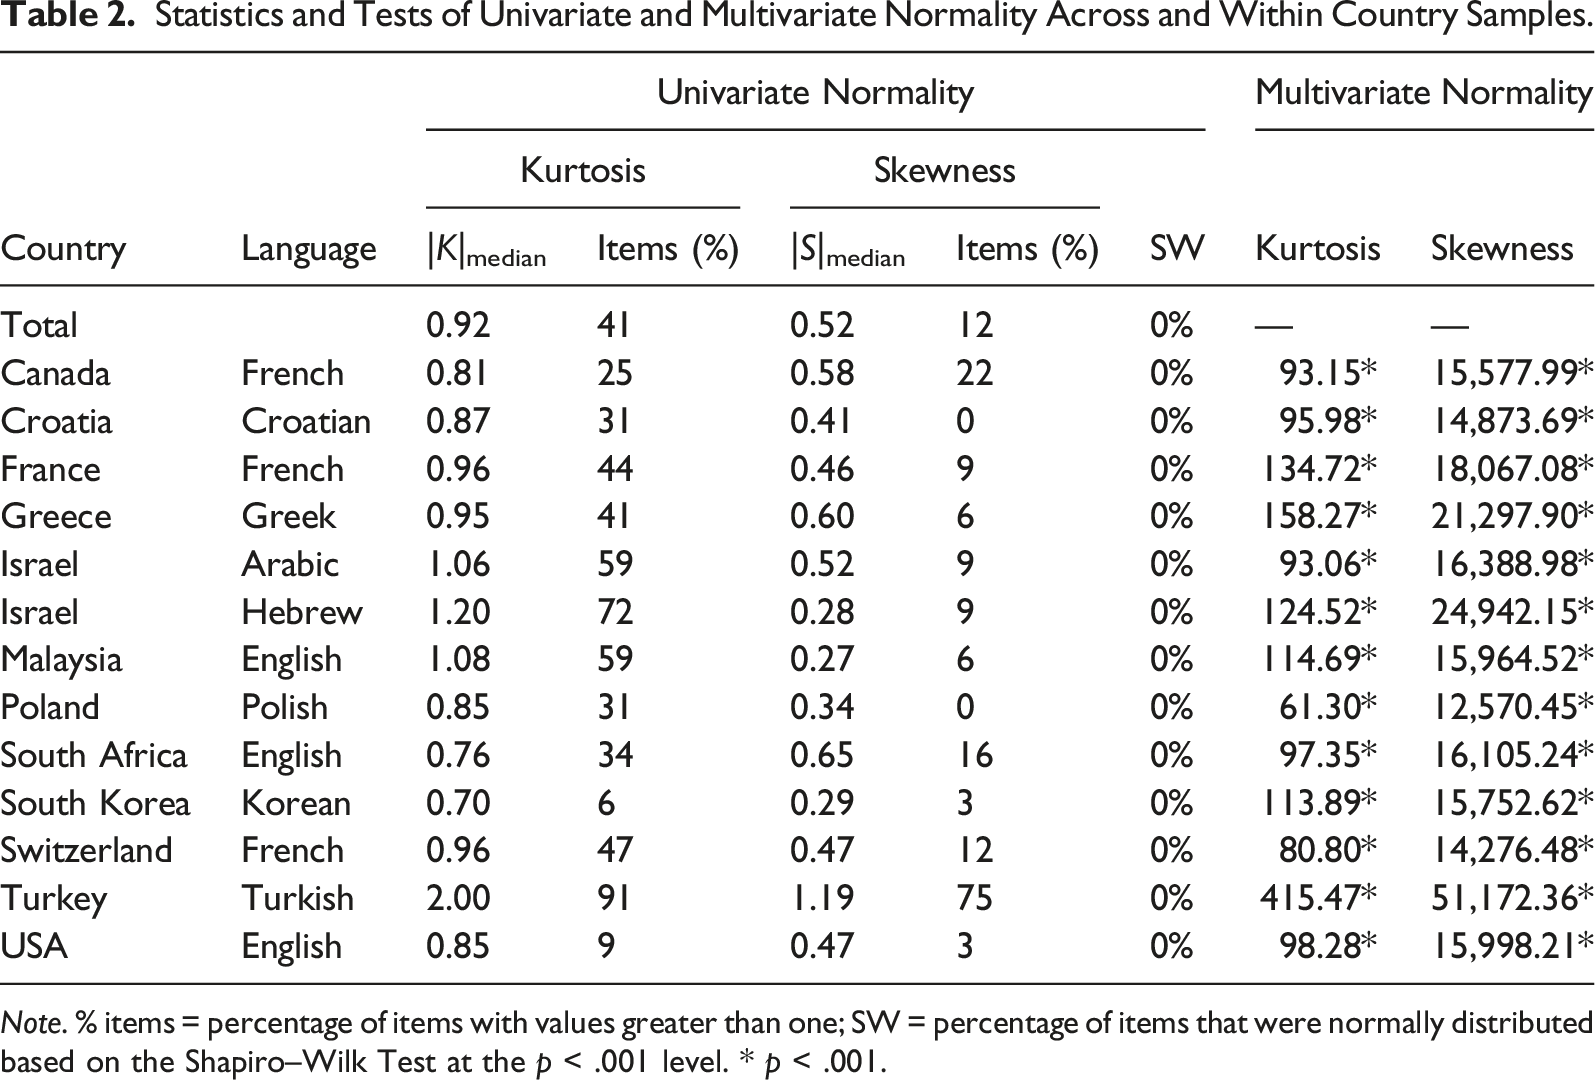
Note. % items = percentage of items with values greater than one; SW = percentage of items that were normally distributed based on the Shapiro–Wilk Test at the p < .001 level. * p < .001.
Structural Analyses
Fit Indices for the Total and Country Samples: CFA with WLSMV Estimation.
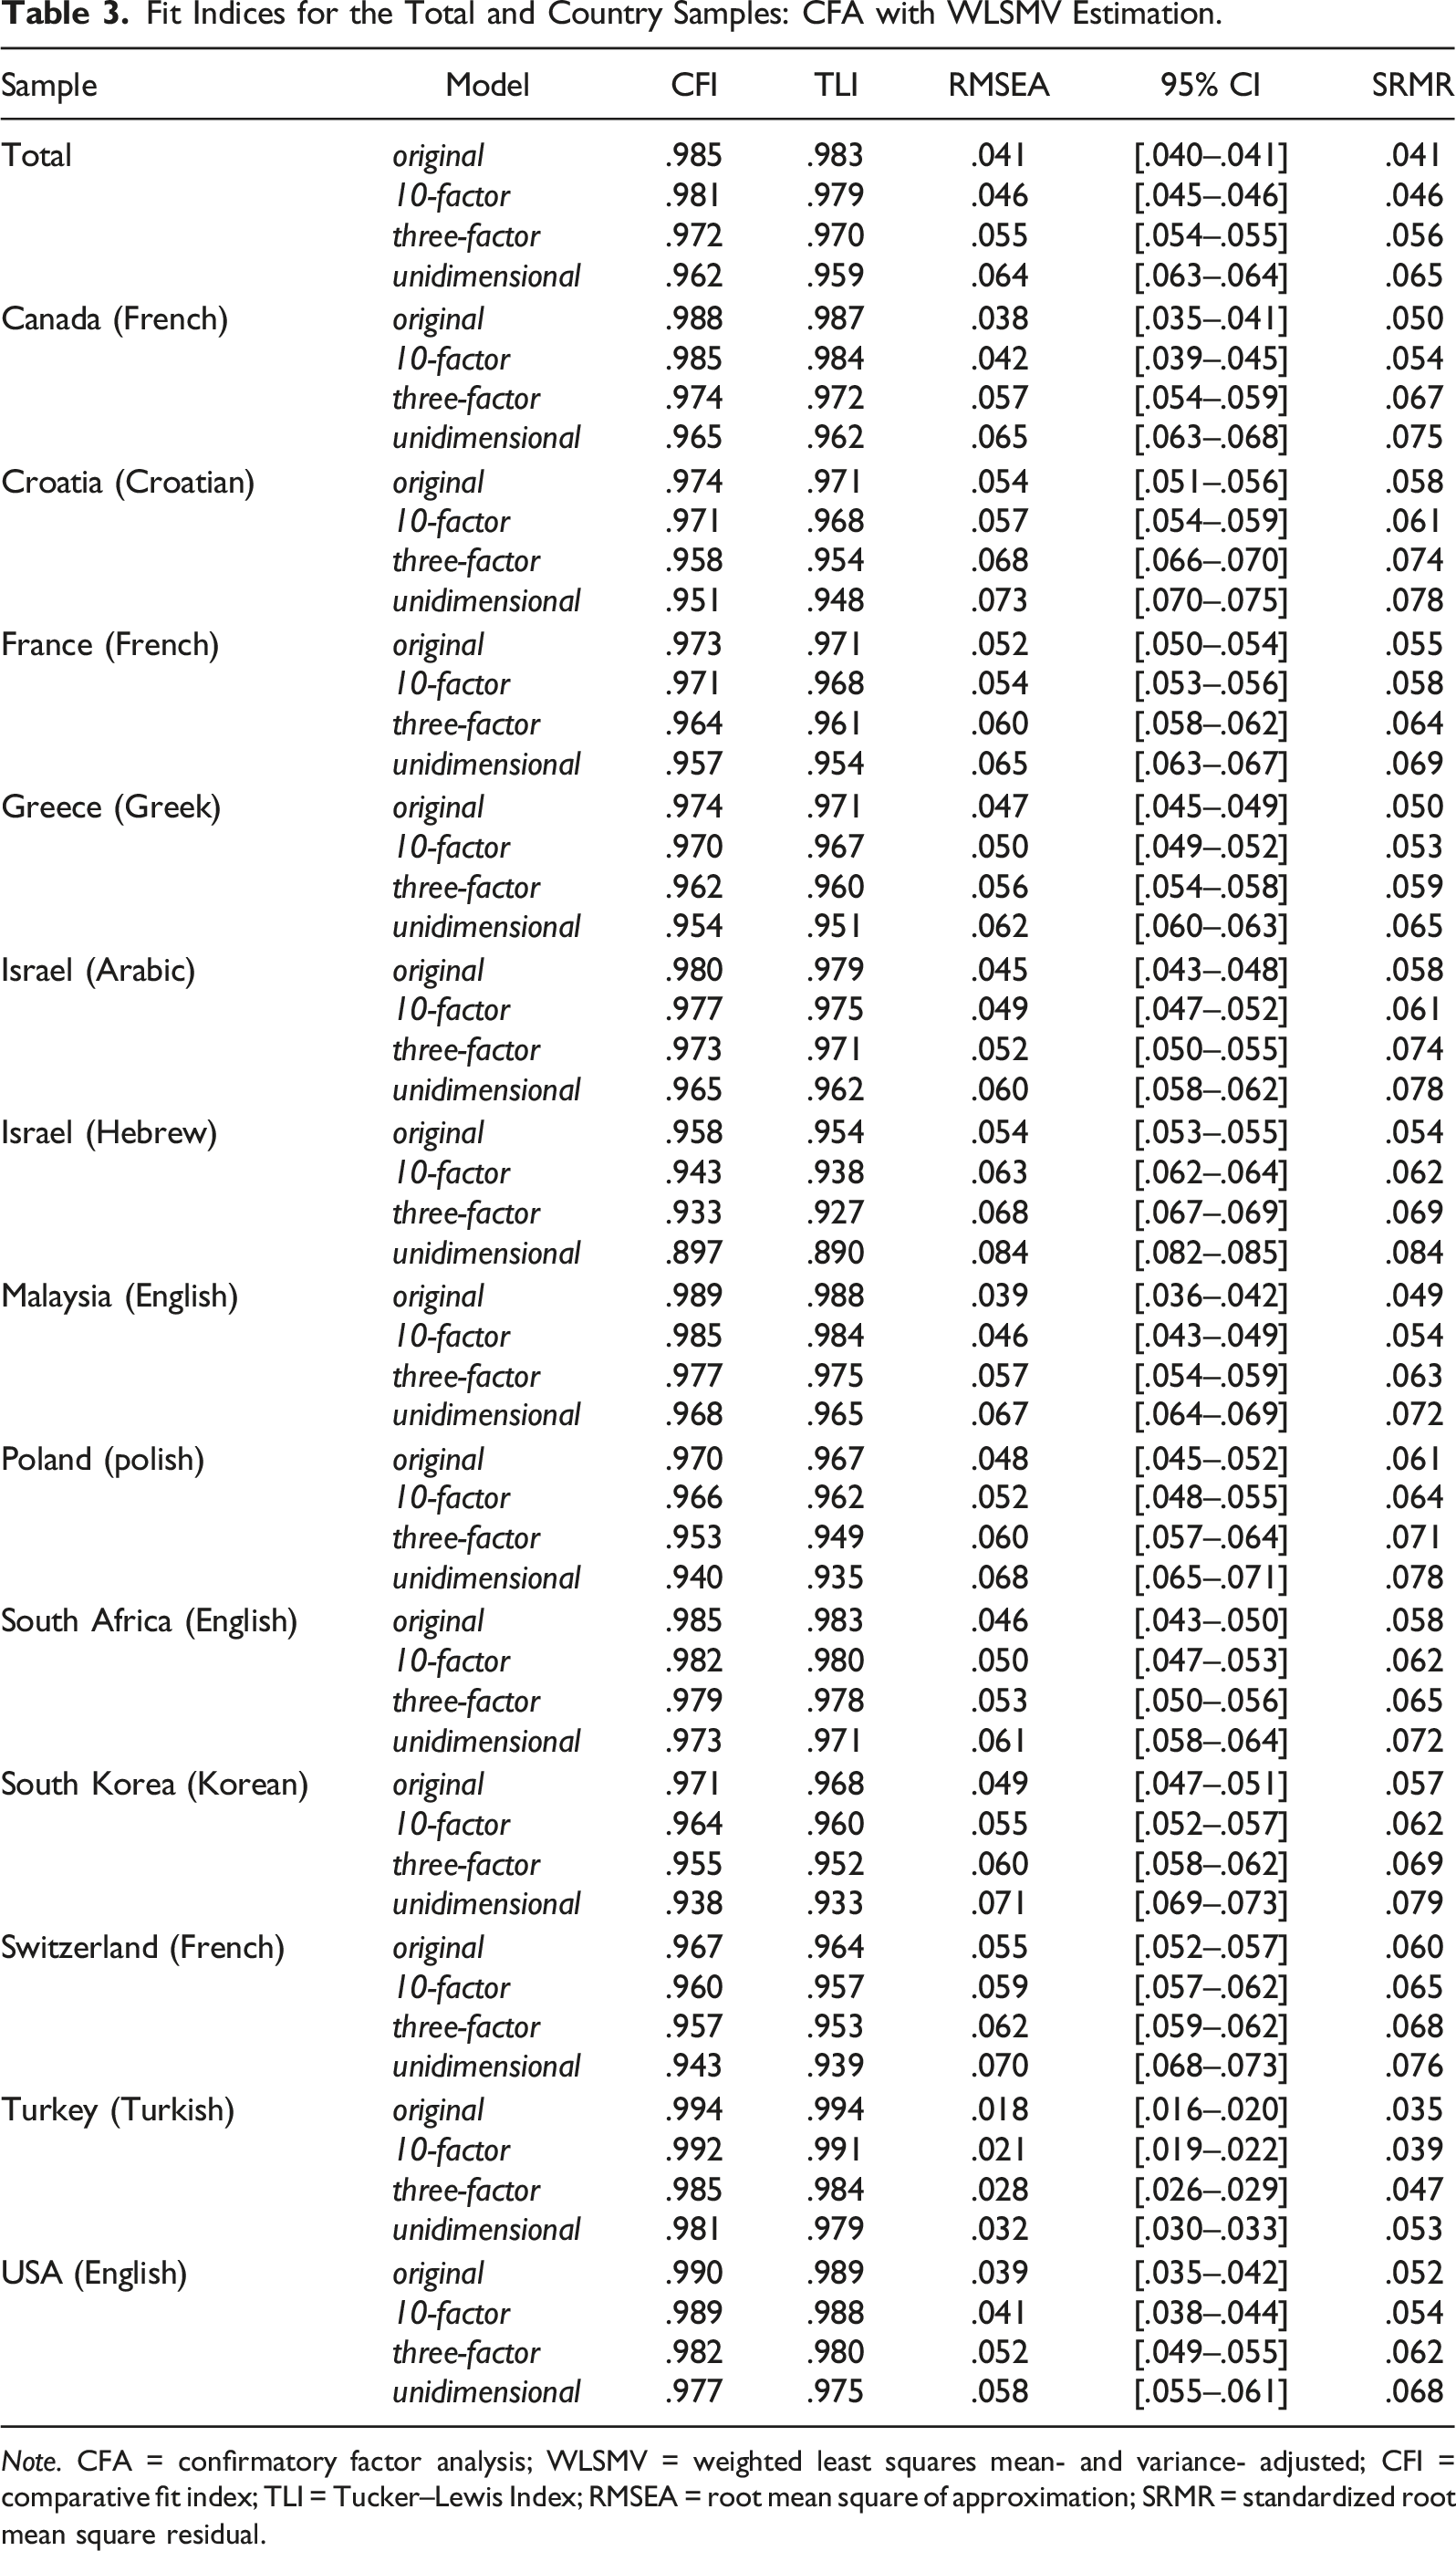
Note. CFA = confirmatory factor analysis; WLSMV = weighted least squares mean- and variance- adjusted; CFI = comparative fit index; TLI = Tucker–Lewis Index; RMSEA = root mean square of approximation; SRMR = standardized root mean square residual.
Standardized Factor Loadings for the Four Tested Models (Total Sample).
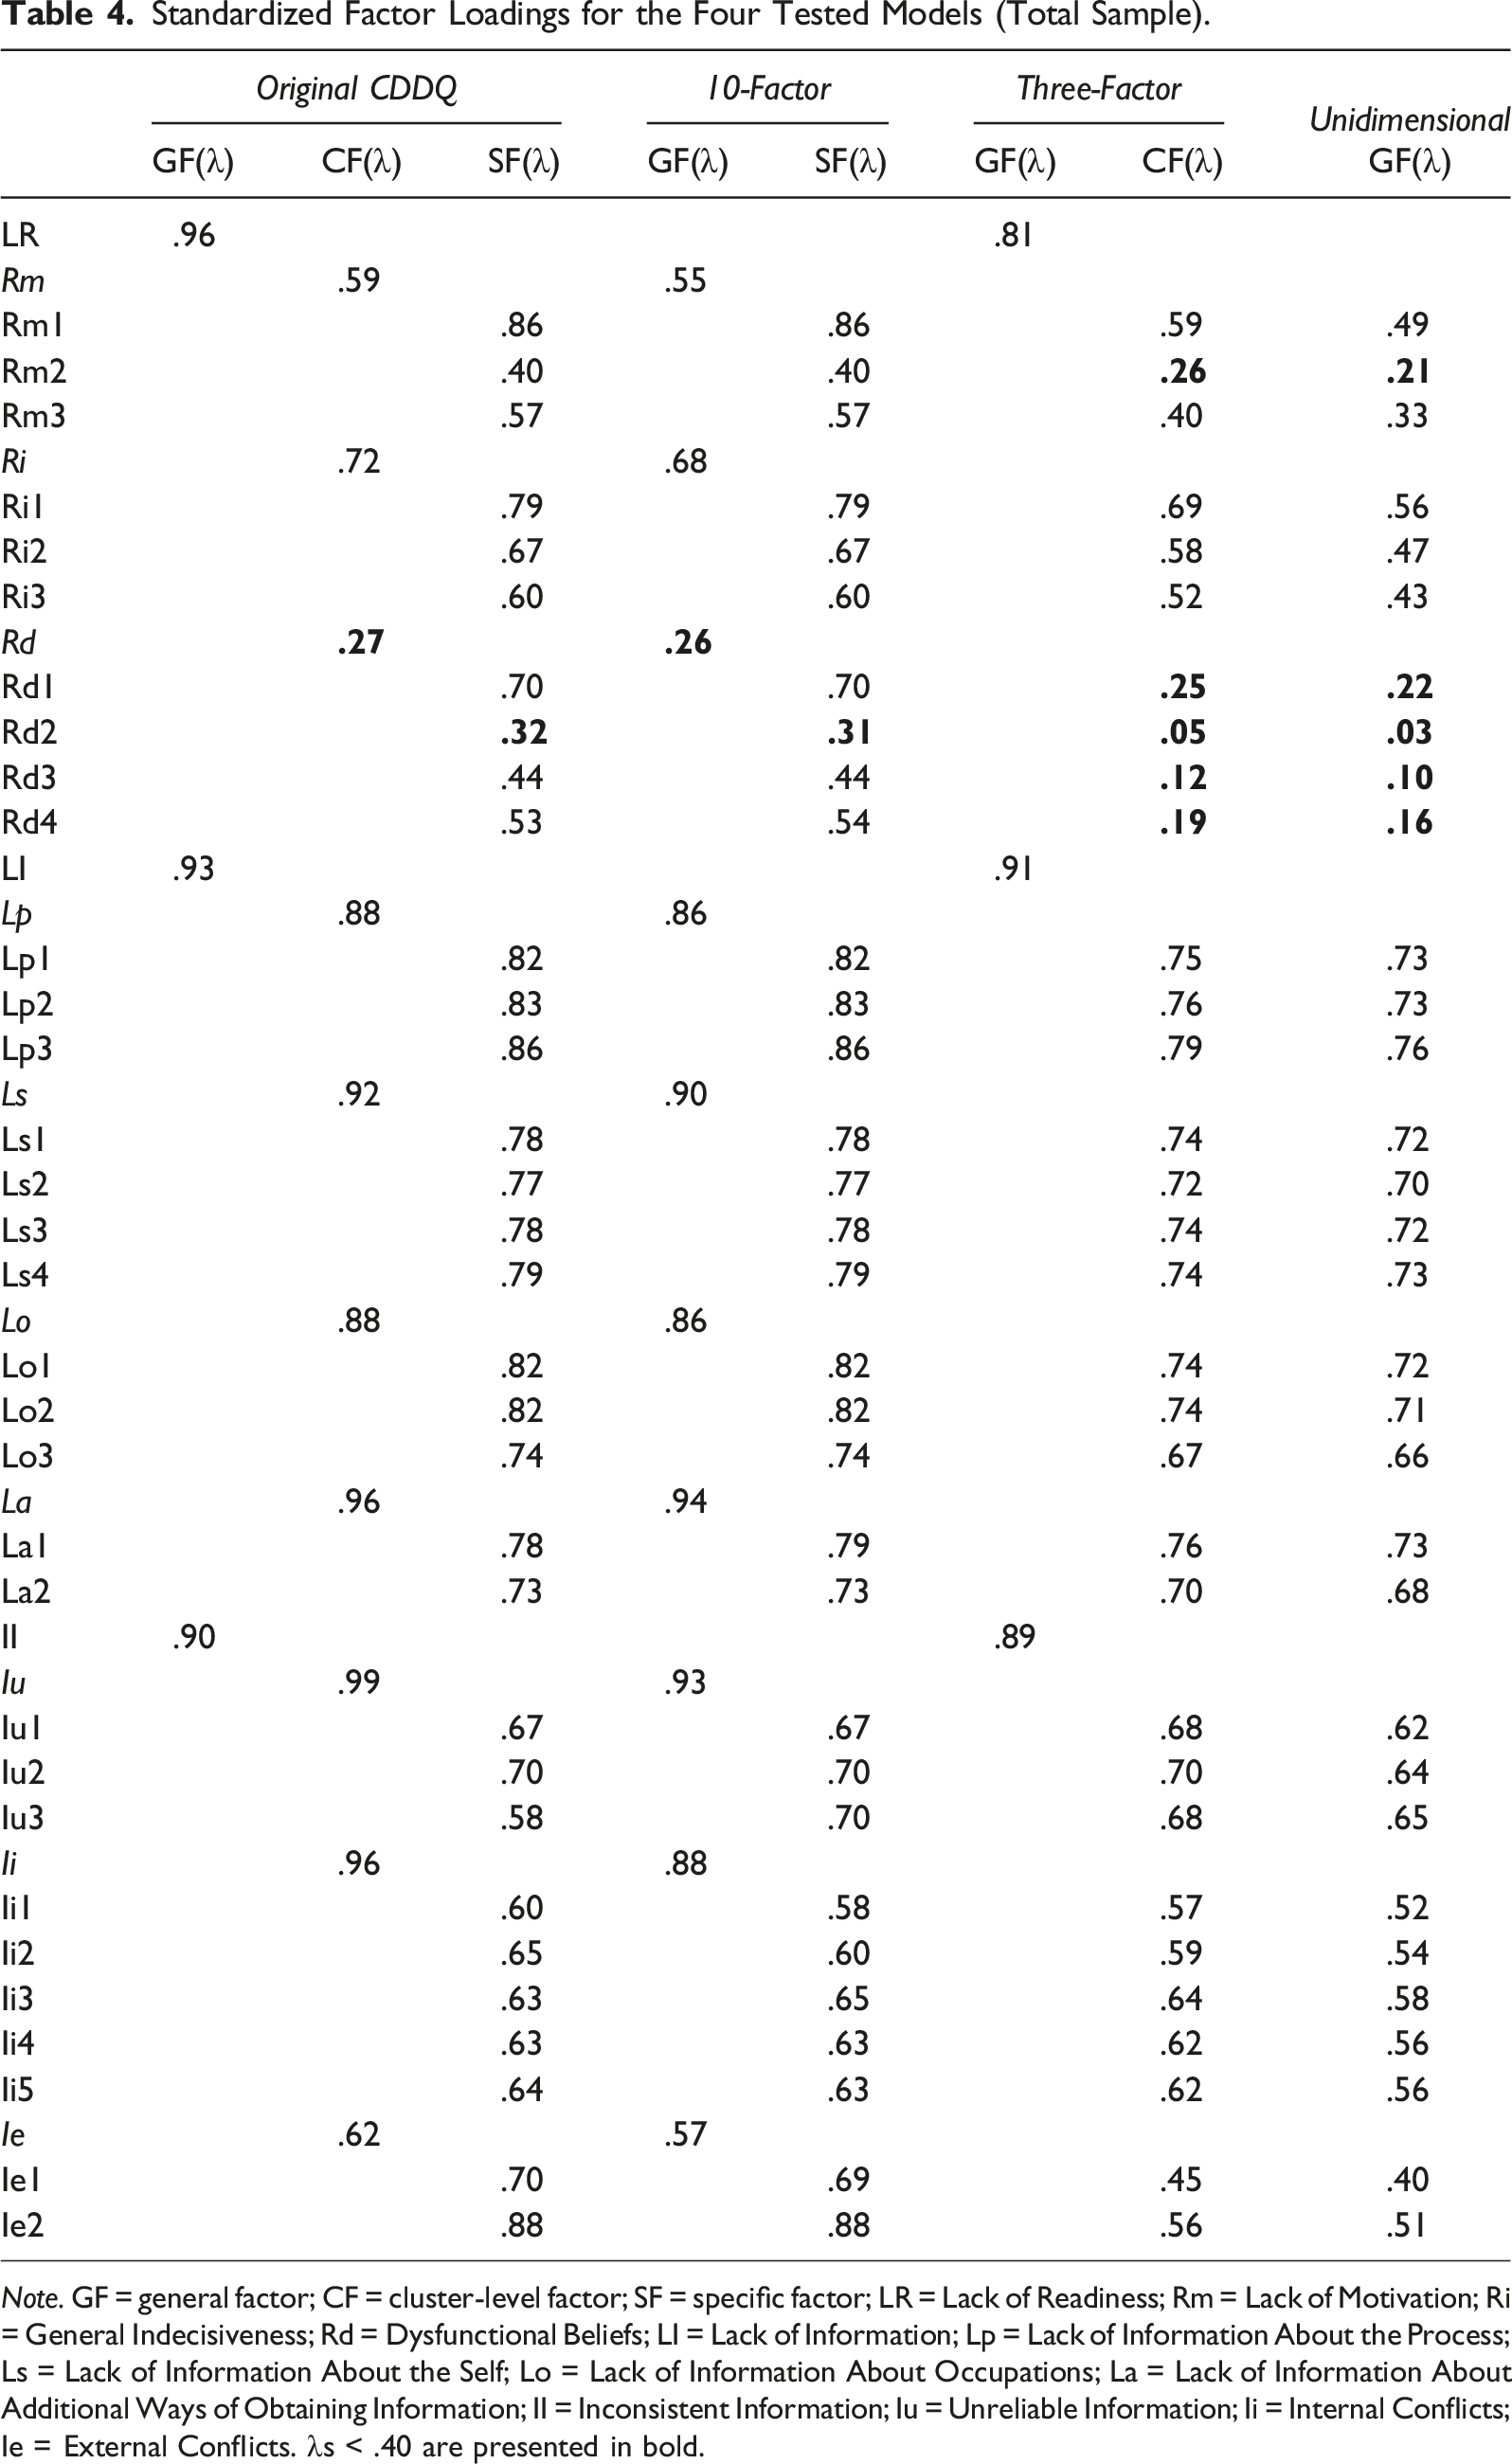
Note. GF = general factor; CF = cluster-level factor; SF = specific factor; LR = Lack of Readiness; Rm = Lack of Motivation; Ri = General Indecisiveness; Rd = Dysfunctional Beliefs; LI = Lack of Information; Lp = Lack of Information About the Process; Ls = Lack of Information About the Self; Lo = Lack of Information About Occupations; La = Lack of Information About Additional Ways of Obtaining Information; II = Inconsistent Information; Iu = Unreliable Information; Ii = Internal Conflicts; Ie = External Conflicts. λs < .40 are presented in bold.
In contrast, the three-factor model and the unidimensional model—from which the 10 scale-level factors were excluded—resulted in lower factor loadings of indicators on their target first-order factors (λ = .05–.79, M = .58 and λ = .03–.76, M = .53, for the three-factor model and unidimensional model, respectively). As shown in Table 4, these models demonstrated low factor loadings for all four indicators measuring dysfunctional beliefs and for some of the indicators measuring Lack of Readiness. Furthermore, although the three-factor model demonstrated high factor loadings at the common total score level (λs = .81, .91, .89), it also resulted in higher factor correlations (r = .72, .74, .81) compared with the original CDDQ model and 10-factor model in which the 10 scale-level factors were included. Because the fourth model included only one common total score, factor correlations could not be calculated. These findings undermine the discriminant validity of interpretations of items in the three-factor model and unidimensional model, which excluded the 10 scale-level factors.
Taken together, the two models that included the 10 scale-level factors of career indecision (i.e., the original CDDQ model and the 10-factor model) demonstrated a better fit to the data than the three-factor model and unidimensional model that did not include these factors. The original CDDQ model demonstrated a slightly better fit than the 10-factor model in this analysis. A subsequent inspection of the parameter estimates precluded determining which of the two models provided a better fit to the data. Nevertheless, the original CDDQ model should be preferred due to its slightly better fit, greater theoretical congruence with the original taxonomy underpinning the CDDQ, and previous findings demonstrating the validity of the three cluster-level factors included in this model.
Reliability Analyses
In the next phase of analyses, we estimated the composite reliability (CR) indices for the original CDDQ model, which included 10 first-order scales, three second-order clusters, and one third-order total score. For the total sample, the CR estimates of nine first-order scales reached acceptable levels (CR = .73–.88, CR median = .76); however, the lack of motivation factor was marginally below the acceptable threshold (CR = .58). CRs of the three second-order clusters were good (CRs = .84, .95, and .89 for Lack of Readiness, Lack of Information, and Inconsistent Information, respectively). Finally, an estimation of the CR of the third-order total score resulted in an excellent CR estimate of .97. The CR estimates for the country samples were similar to those calculated for the total sample and are available upon request from the first author.
Measurement Invariance
Our results so far had indicated the equivalence of the CDDQ factor structure across 13 countries and nine language versions. To examine whether participants from different countries who completed the same CDDQ language version (i.e., English or French) responded to items in similar ways, we conducted a series of measurement invariance analyses. First, we tested the measurement invariance of the English version of the CDDQ across three available countries (Malaysia, South Africa, and USA). The configural model demonstrated good fit (CFI = .988, TLI = .987, RMSEA = .041, 95% CI [.039, .043], SRMR = .051), but the metric model resulted in reduced fit (CFI = .972, TLI = .971, RMSEA = .062, 95% CI [.060, .063], SRMR = .067, ΔCFI >.010 and ΔRMSEA >.010), indicating significant differences in the factor loadings among the three subsamples. Subsequent measurement invariance analyses between all country pairs further confirmed that the English version of the CDDQ was measurement variant across these three country samples.
Next, we tested the measurement invariance of the French version of the CDDQ across the three available countries (Canada, France, and Switzerland). The configural model demonstrated good fit (CFI = .976, TLI = .974, RMSEA = .050, 95% CI [.049, .051], SRMR = .054), and was similar in fit to the metric model (CFI = .968, TLI = .967, RMSEA = .056, 95% CI [.055, .057], SRMR = .061, ΔCFI <.010 and ΔRMSEA <.010). The fit of the scalar model was similar (CFI = .966, TLI = .965, RMSEA = .057, 95% CI [.056, .058], SRMR = .062; ΔCFI <.010 and ΔRMSEA <.010). These findings provided further support for the original CDDQ model and demonstrated the measurement equivalence at the level of scalar invariance of the French version of the CDDQ across the samples from the three French countries.
Discussion
The overarching goal of this research was to determine the factor structure of the CDDQ across 13 countries and nine language versions compiled from 39 diverse data sets. Structural analyses and an evaluation of factor loadings and correlations provided support for the model corresponding to the original CDDQ taxonomy. This model, the original CDDQ model, includes 10 first-order scales, three second-order clusters, and one third-order total score, corresponding to 10 specific causes of career indecision grouped in three major difficulty clusters and aggregated into a global estimate of indecision. The estimation of composite reliability (CR) indices of the 14 CDDQ scores derived from the original CDDQ model confirmed the adequate internal reliability of 13 of its scores; however, the lack of motivation scale yielded a reliability estimate marginally below the acceptable level. The highly similar results across the 13 country samples support the cross-cultural generalizability of the CDDQ as a measure of career indecision.
This research is the most comprehensive examination of the factor structure of the CDDQ performed to date. The good fit of the original CDDQ model was demonstrated for the total sample and for 11 of the 13 country samples (acceptable fit was observed for the Polish and Swiss–French samples). In contrast, a 10-factor model—which included a single total score but excluded the three second-order clusters—demonstrated good but lower fit (relative to the original CDDQ model) in the total sample and in six country samples (acceptable fit was observed for the remaining seven language samples). In addition, in five samples—Croatia, Israel (Arabic and Hebrew), South Africa, and South Korea—the fit of the original CDDQ model was better than that of the 10-factor model. In light of these findings and given its lower theoretical compatibility with Gati et al.’s (1996) taxonomy of career decision-making difficulties, the 10-factor model can be regarded as inferior. Then a three-factor model—which did not include 10 first-order scales but rather only three first-order clusters and a second-order total score—yielded good but lower fit in the total sample but in only one of the 13 country samples; an acceptable fit was demonstrated for the remaining 12 country samples. Finally, the unidimensional model—including only a single first-order total score—yielded only acceptable fit in the total sample and 11 country samples; it showed below acceptable fit indices in the Hebrew sample and good fit in the Turkish sample. Moreover, compared with the original CDDQ model and the 10-factor model, both the three-factor model and the unidimensional model resulted in weaker factor loadings and higher factor correlations, thus further supporting their relative inferiority.
The finding that the original CDDQ model provides the best fit to data aligns with the conclusions of previous validation studies of its English (Kleiman et al., 2004; Kleiman & Gati, 2004; Levin et al., 2020), French (Atitsogbe et al., 2018; Rossier et al., 2021; Sovet et al., 2017), Hebrew (Kleiman & Gati, 2004), and Turkish (Bacanli, 2016) versions. At the same time, this study is the first to demonstrate the advantage of the original CDDQ model over alternative models and to test its internal structure in five additional language versions. Specifically, we also examined and validated the factor structure of the 34-item Arabic and Polish versions, the psychometric properties of which were not previously published. For the Croatian, Greek, and Korean versions, however, our findings are inconsistent with previous work. Babarović and Šverko’s (2019) study of the Croatian version yielded a preferred model that excluded the dysfunctional beliefs scale. Similarly, Sovet et al.’s (2015) study of the Korean version resulted in selecting a nonhierarchical model that included only nine first-order scales (excluding the dysfunctional beliefs scale). For the Greek CDDQ version, a seven-factor model that excluded lack of information about ways of obtaining additional information, unreliable information, and internal conflicts was preferred (Vaiopoulou et al., 2019). Thus, of the nine language versions examined in this study, the original CDDQ model was confirmed in previous research for only four language versions.
Four possible explanations for discrepancies in the best-fitting model of a measure tested across countries using different language versions should be considered. The first explanation for structural divergence involves potential cross-cultural differences that contribute to variations in the psychological constructs under study. Cross-cultural discrepancies have been the typical explanation adopted in previous studies reporting differences in the structure of career indecision (see Xu & Bhang, 2019). However, our findings indicate high structural similarity in career indecision across 13 countries based on data collected using nine language versions of the CDDQ. These findings suggest that at least some of the previously reported structural differences in the CDDQ may be related to methodological issues and not to cross-cultural differences.
Second, structural divergence could also result from imprecise translation processes, producing semantically different items across language versions. In such cases, structural differences would result from one or more translated items measuring something different from what was intended. The observed replicability of the factor structure of the CDDQ across nine language versions in this study precludes a translation bias leading to structural differences. Nevertheless, our findings indicate that the CDDQ is metric variant among the three countries in which the English CDDQ version was used—the USA, South Africa, and Malaysia. These results show that although the same structure of career indecision is applicable in these countries, individuals from these countries respond differently to the CDDQ items. In contrast, the French CDDQ emerged as scalar invariant across Canada, France, and Switzerland. Further investigation of the measurement equivalence of the CDDQ may reveal additional response differences across groups of interest (e.g., gender, age).
Third, validating a factor structure involves analyzing samples with sufficient variance in the measured factors. Thus, potential unaccounted-for differences in sample characteristics constitute another methodology-related explanation for structural variations. Kline (2016) noted that to ensure sufficient variance, larger samples are needed in cases of more complex structural models, nonnormal indicators, and factors characterized by lower reliabilities (see also Wolf et al., 2013). Relatedly, though a one-size-fits-all heuristic is generally discouraged, Kline (2016) recommended a sample-size-to-parameters ratio of 20:1 or, less ideally, 10:1, with lower ratios diminishing the trustworthiness of the results. Thus, in the case of the original CDDQ model with 77 parameters, a sample size of 770 could still be considered small. Furthermore, even with sufficiently large samples, higher homogeneity in terms of factor-relevant variance could undermine attempts at structural validation. Tien (2005), for example, reported structural differences after examining the factor structure of the CDDQ separately among decided and undecided individuals. Similarly, Levin et al. (2020) tested structural differences among six groups of individuals differing in their degree of decidedness. In both studies, the variance in the target factor (e.g., degree of decidedness, career decision status) was reduced, explaining why the original CDDQ model was not supported in these studies. Such findings attest to the importance of considering an adequate sample size and the expected heterogeneity of target factors in designing validation studies.
Although an inadequate sample size and reduced variance in target factors may explain some of the previously reported variations in the factor structure of the CDDQ, a fourth explanation relates to the adequacy of the psychometric analyses performed. In this study, the implementation of normality analyses and the subsequent application of WLSMV yielded good fit indices for the tested models. Indeed, whereas the good fit of the original CDDQ model was demonstrated with WLSMV—the accepted method when the assumptions of univariate and multivariate normality are not met (see Table 3)—with ML, this model barely resulted in an acceptable fit and in only one country sample (see Supplemental Appendix Table 2 in the online supplementary materials). Applying ML is justified when indicators are continuous and conform to a multivariate normal distribution, but when this assumption is violated, ML is likely to yield biased parameters (Beauducel & Herzberg, 2006; Li, 2016). The observed violations of the univariate and multivariate nonnormality assumptions in the 13 country samples analyzed in this study suggest that previous failures to validate the original CDDQ model may be attributed, at least partially, to improper implementation of a CFA—using ML rather than WLSMV to test the structure of the CDDQ.
Limitations and Recommendations for Future Research
Before discussing the implications of this study for assessing career indecision, its limitations should be acknowledged. An initial limitation is that not all language versions of the CDDQ were examined in this research. Specifically, we failed to obtain sufficiently large samples for other versions, such as Chinese, Dutch, German, Hindi, Italian, Portuguese, Russian, and Spanish. In addition, this research did not examine the factor structure of the 44-item version of the CDDQ, which remains in use in some countries (e.g., Fouad et al., 2009; Willner et al., 2015).
Second, previous research compared CDDQ scores across groups, such as age groups, genders, or countries, but mostly did so without ensuring the invariance of CDDQ scores across the groups under study (for a review, see Levin et al., 2020). Some investigations demonstrated the measurement invariance of the CDDQ across groups from the same country (Levin et al., 2020; Sovet et al., 2015, 2017) or across countries using the same CDDQ language version (Atitsogbe et al., 2018; Levin et al., 2020; Rossier et al., 2021); in this respect, our findings provide further support for the measurement invariance at the scalar level of the French CDDQ across three countries. In contrast, the English CDDQ emerged in our study as measurement variant across Malaysia, South Africa, and the USA, whereas Levin et al. (2020) found that the CDDQ is measurement invariant at the scalar level across seven countries with data collected using its English version (including South Africa and the USA). These discrepancies should discourage researchers from relying on the results of previous demonstrations of measurement invariance; when the focus of a study is comparing groups, conducting measurement invariance analyses is advisable.
A third limitation of this study concerns the scope of the models we considered and evaluated. Given strong previous support for the criterion validity of the CDDQ total score––calculated as the mean of all items––we considered only models that did not exclude any item. For this reason, we did not evaluate the fit of previously proposed models for the factor structure of the CDDQ, such as models excluding the dysfunctional beliefs scale (Babarović & Šverko, 2019; Sovet et al., 2015) or all three Lack of Readiness scales (Creed & Yin, 2006). A previous study on the English version of the CDDQ compared these additional models but provided support for preferring the original CDDQ model (Levin et al., 2020). At the same time, our findings indeed reflect the relatively lower psychometric quality of the three Lack of Readiness scales, with weak factor loadings associated with the dysfunctional beliefs scale and a marginally below the acceptable threshold reliability estimate for the lack of motivation scale. Future research could address these issues by designing a revised version with higher quality items to measure lack of motivation and dysfunctional beliefs. In this context, Hechtlinger et al. (2019) developed a measure of dysfunctional beliefs in career decision-making and found that the heterogeneity of dysfunctional beliefs undermines the utility of a total score.
Implications for the Assessment of Career Indecision
The results of this study support using the CDDQ at three levels: a total score, three cluster scores, and 10 scale scores. Each of these three levels has its own advantages and disadvantages for research and practice. The CDDQ total score measures individuals’ overall severity or degree of career indecision and is especially informative for a global evaluation of the effectiveness of interventions or for the initial prescreening of clients (Fouad et al., 2009; Gati & Saka, 2001). However, deriving information about the nature of career indecision, namely, individuals’ causes of career indecision, requires using either the three cluster scores or the 10 scale scores. Identifying individuals’ specific causes of career indecision facilitates tailoring the intervention to each individual’s unique needs.
Specifically, the CDDQ three cluster scores indicate the degree to which individuals’ career indecision is caused by difficulties related to Lack of Readiness, Lack of Information, or Inconsistent Information. Cluster scores are especially informative for research seeking to examine the underlying mechanisms of career indecision that are affected by interventions (e.g., Fouad et al., 2009), discern the differential interplay between specific domains of career decision-making difficulties and other constructs (e.g., Udayar et al., 2020), or identify which intervention is most suitable for each client’s needs. In addition, whereas the internal reliabilities of two of the three CDDQ cluster scores are high, Lack of Readiness is relatively more heterogeneous. For this reason, a clearer understanding of the specific difficulties related to Lack of Readiness should involve inspecting the three scale scores in this cluster.
The 10 CDDQ scale scores provide information on the specific causes of individuals’ career indecision. Although offering the most detailed information, the complexity involved in dealing with 10 scores may explain why research at this level is relatively rare. However, because the 10 CDDQ scale scores provide the best differential assessment of individuals’ causes of career indecision, using this level of assessment is encouraged. The 10 scale scores are particularly recommended for evaluating the relative salience of each difficulty to identify individuals’ most pressing needs (Gati et al., 2000) or for the classification of individuals into career indecision types (Levin et al., 2022).
Conclusion
The analyses of 13 country samples using nine language versions, supported the alignment of the empirical structure of the CDDQ with Gati et al.’s (1996) taxonomy of career indecision. Based on analyses performed using the adequate WLSMV estimator, our results support the conclusion that career indecision as measured by the CDDQ can be viewed as a general construct comprising three clusters that can be further differentiated into 10 distinguishable components. Previous research investigating the criterion validity of the CDDQ scores supported their utility for research and practice. Our findings complement previous work and provide the needed structural validation for the use of all 14 originally proposed CDDQ scores: a total score, three cluster scores, and 10 scale scores.
Supplemental Material
Supplemental Material - The Structure of the Career Decision-Making Difficulties Questionnaire Across 13 Countries
Supplemental Material for The Structure of the Career Decision-Making Difficulties Questionnaire Across 13 Countries by Nimrod Levin, Shagini Udayar, Yuliya Lipshits-Braziler, Itamar Gati and Jérôme Rossier in Journal of Career Assessment
Footnotes
Acknowledgment
We are grateful for the generosity of our colleagues who were willing to share their data, thereby making the study possible. The study included the analyses of previously collected secondary data by the authors (10 samples) and other research teams (29 samples). Information on the source of each sample can be found in ![]() in the online supplementary materials. This research has been supported in part by the Samuel and Esther Melton Chair of Itamar Gati.
in the online supplementary materials. This research has been supported in part by the Samuel and Esther Melton Chair of Itamar Gati.
Declaration of Conflicting Interests
The author(s) declared no potential conflicts of interest with respect to the research, authorship, and/or publication of this article.
Funding
The author(s) received no financial support for the research, authorship, and/or publication of this article.
Supplemental Material
Supplemental material for this article is available online.
References
Supplementary Material
Please find the following supplemental material available below.
For Open Access articles published under a Creative Commons License, all supplemental material carries the same license as the article it is associated with.
For non-Open Access articles published, all supplemental material carries a non-exclusive license, and permission requests for re-use of supplemental material or any part of supplemental material shall be sent directly to the copyright owner as specified in the copyright notice associated with the article.