
Abstract
Integration of sophisticated technologies such as Internet of Things, cyber physical systems and big data analytics have revolutionized the advanced manufacturing systems (AMS). However, implementation of data-driven decision making in AMS still remains challenging due to data heterogeneity, real-time processing demands, and integration complexities. This paper overcomes this challenge by presenting a novel framework for adoption of DDDM in AMS to enhance its decision-making capabilities. This framework consists of six stages: manufacturing stage, sensing stage, data stage, knowledge stage, decision stage, and application stage. The proposed framework leverages big data analytics to extract actionable insights from diverse datasets, integrates CPS to create a seamless interaction between physical and digital systems, and employs IoT technologies for real-time data acquisition and monitoring. The framework is validated through a comprehensive case study involving a CNC milling machine dataset, demonstrating significant improvements in operational efficiency, decision accuracy, and response time. The case study involves detailed data collection steps, preprocessing, and analysis, showcasing the framework’s practical implementation and effectiveness. The results show that the proposed framework addresses existing challenges and provides a scalable solution for DDDM implementation in AMS.
Keywords
Introduction
The Advanced Manufacturing System (AMS), which combines cutting-edge technology like machine learning, vision systems, and high-speed communication, is on the verge of a revolution in automation (Kumar et al., 2024a; Mahmoodi et al., 2024). These technological advancements allow industries to overcome obstacles in establishing highly automated facilities. Due to the constraints of conventional decision making methods, there is a significant discrepancy between the current automation levels and those that can be effectively achieved from a technological and commercial perspective (Babu et al., 2024; Bhatia et al., 2024). A recent BCG study has shown that the “automation gap” can be decreased, resulting in labour and quality enhancements that can reduce conversion costs by up to 25% (Küpper et al., 2022). According to a Deloitte survey, the manufacturing sector’s artificial intelligence (AI) market is anticipated to exceed USD 2 billion by 2025, with an average annual growth rate of over 40% from 2019 (Deloitte Consulting, 2020). The manufacturing sector generates nearly 1,812 petabytes (PB) of data annually, surpassing sectors like finance, communications, and retail (KPMG, 2022). The profusion of digital information in AMS has made decision-making processes more intricate, and manufacturers are employing smart technology to analyse data trends and address unforeseen challenges (Dohale et al., 2023). The expanding data and AI landscape emphasises the urgent need to switch from conventional decision-making methods to data-driven decision-making (DDDM) (Friederich et al., 2022). In order to achieve a high level of automation, contemporary industrial systems require sophisticated, data-centric decision-making methods.
Due to advancements in sensing and storage infrastructure, AMS has the potential to transition from conventional decision-making processes to DDDM (Gautham et al., 2023). BDA has arose as a critical driver for intelligent decision-making in AMS, with applications spanning fields such as robotics, control, forging, welding, biomedicine, and agriculture (Brynjolfsson and McElheran, 2016). By leveraging technologies like AI, machine learning (ML), and computer vision, DDDM enables manufacturers to optimize operations and develop smart products with improved quality and reliability (Klingenberg et al., 2021). Big Data Analytics represents a fundamental improvement over traditional data analysis methods (Sundarakani et al., 2021). The five Vs can summarize the characteristics of big data: velocity (rapid data creation and updating), variety (data from multiple sources in varied formats), value (valuable insights), veracity (high variability), and volume (large-scale data) (Mollá et al., 2022).
DDDM is a game-changer in the manufacturing industry, offering a powerful tool for optimizing efficiency and productivity (Lidong and Guanghui, 2016). It involves the application of data analytics and advanced algorithms to make decisions, enhance processes, and improve overall performance (Diyaley et al., 2024; Gökalp et al., 2021). By leveraging data, DDDM enables manufacturers to recognize patterns, detect anomalies, and forecast trends, leading to better resource allocation and strategic planning (Lai et al., 2021). The ultimate goal of DDDM in manufacturing is to analyze data collected throughout the product lifecycle to make effective decisions, resulting in smart design, planning, production, and delivery (Vogelsang et al., 2019).
Despite the potential benefits, many manufacturers face challenges in fully harnessing the power of DDDM (Moktadir et al., 2019). The complexities and expertise required for DDDM adoption often lead to reluctance among companies (Friederich et al., 2022; Li et al., 2019). This paper addresses these challenges by proposing a novel framework for implementing DDDM in AMS. The framework offers a roadmap for implementing DDDM in AMS by providing a comprehensive theoretical basis and presenting a real-world case study using CNC machine dataset. Its primary goal is to simplify the integration of big data analytics in manufacturing to develop predictive, proactive, and adaptable advanced manufacturing system.
This study proposes a novel comprehensive framework by integrating the various cutting-edge technologies such as Big Data Analytics (BDA), Cyber-Physical Systems (CPS), Internet of Things (IoT), and Machine Learning (ML) in implementation of DDDM in AMS. The novelty of this framework features in its comprehensive approach, which smoothly combines these several technologies in a single framework to tackle the complexities in the digitalization of manufacturing industries. Rather than only focusing on isolated aspects, this framework provides the step-by-step discussion of all components of DDDM which differs it from existing models. It offers a complete solution that improves real-time decision-making, boosts data integration, and gives more accurate and actionable insights. This framework enhances operational efficiency and offers a scalable and flexible platform for future developments in AMS by linking theoretical advancements with actual implementation. The case study validation provides added evidence of the framework’s efficacy, showcasing its ability to establish a novel benchmark in the industry by seamlessly merging sophisticated data-driven methodologies with manufacturing systems.
The rest of the paper is structured as follows: Section 2 examines relevant literature and identifies research gaps. Section 3 presents the proposed framework and its components. Section 4 details a case study demonstrating the framework’s application. Section 5 presents the results and discussions. Finally, Section 6 concludes with limitations and future research directions.
Literature review & research gaps
Advanced manufacturing systems (AMS) have revolutionized production processes by integrating innovative technologies into products and operations. These systems, including CAD, CAM, CAE, SCM, MES, and ERP, have led to significant productivity improvements and cost savings across various industries (Agarwal et al., 2024; Kandavalli et al., 2023; Basu et al., 2024). Big data analysis has become a pivotal element in the manufacturing sector, facilitating enhanced decision-making processes (Li et al., 2022). The advent of Industry 4.0 and the integration of CPS has increased the use of information and interaction systems within manufacturing, generating extensive production data for optimization. Modern data analytics enable manufacturers to identify patterns for better forecasting and real-time insights into operations (Andronie et al., 2021; Kumar et al., 2024b, 2024c, 2024d; Rani et al., 2023). This shift towards data-driven analysis drives intelligent industrial value creation and attracts significant academic and scientific interest (Awan et al., 2021). The various literatures present the application of data-driven approaches in manufacturing, such as data driven energy management (Zhang et al., 2018), demand forecasting (Kumar et al., 2020), additive manufacturing (Anand et al., 2024a; Majeed et al., 2021), factory simulation (Yu and Nielsen, 2020), supplier evaluation (Lo, 2023), readiness assessment (Elragal and Elgendy, 2024), digital twin (Zhang et al., 2023) and production forecasting (Du et al., 2023).
Innovative new technologies in AMS
AMS progressively incorporate smart technologies and tools into products and processes (Weiss et al., 2018). This integration has made modern manufacturing a crucial component of global economic growth and job creation (Henry et al., 2020). Adopting advanced manufacturing technologies has resulted in increased productivity and cost savings across various industries (Anand et al., 2024b). AMS includes the manufacturing execution layer, product lifecycle layer, and enterprise information system supported by CAD, CAM, CAE, SCM, MES, and ERP (Cui et al., 2020; Wang et al., 2022a).
The complexity of manufacturing systems and rising demands have made traditional decision-making and optimization techniques inadequate. Data-driven methods have emerged to enhance production parameters and simplify manufacturing processes (Li et al., 2017; Tao et al., 2018). Industry 4.0 and CPS integration have increased the use of information systems in manufacturing, producing more data that improves scheduling and operations (Kozjek et al., 2020; Wang et al., 2022b). Big data analysis has become essential for senior executives, facilitating timely and informed decision-making (Grandhi et al., 2021; Sarker, 2021; Wu et al., 2021). This data-driven approach drives intelligent industrial value creation and attracts significant academic interest (Wilkin et al., 2020).
Zhu and Li (2023) proposed a framework based on industrial big data for scheduling operation in semiconductor manufacturing. Kuo and Kusiak (2019) highlighted the shift from analytical models to data-driven approaches in manufacturing research, discussing the transformative impact of new technologies. Cheng et al. (2018) proposed digital twin-driven methods for product design, manufacturing, and maintenance, utilizing big data to support smart manufacturing. Majeed et al. (2021) described a big data-driven framework for reducing energy consumption and emissions in energy-intensive industries.
Majeed et al. (2019) developed a big data-based analytics architecture for additive manufacturing, enhancing production phases through data-driven analytics. Jafari-Marandi et al. (2019) introduced a decision-making framework for cost optimization using in-situ melt pool images for defect cost analysis. Yu and Nielsen (2020) offered a data-driven solution for industrial simulation, providing tools for effective decision-making. Cui et al. (2020) presented a literature analysis on big data applications in manufacturing, outlining key factors for data-driven decision-making.
Zhu and Li (2023) proposed a data-driven online control decision-making strategy for vertical rolling mills, enhancing operation optimization. Kozjek et al. (2020) detailed the challenges of developing data analytics tools for manufacturing, including data access, system integration, and performance optimization. Gao et al. (2021) created models for intelligent health maintenance in machinery manufacturing, supporting accurate diagnosis and maintenance planning. Antomarioni et al. (2021) suggested using data-driven algorithms to manage automated storage and retrieval systems and integrate various data sources for analysis. Mi et al. (2021) described a collective awareness framework for predictive maintenance decision-making, incorporating digital twin technology for accurate problem diagnosis and prediction.
Data driven technologies in AMS
Saez et al. (2022) considered the interactions between output, quality, reliability, and energy use, developing data-driven models from plant floor data. Psarommatis and Kiritsis (2022) developed a DSS for defect identification in manufacturing, automating decision-making processes using historical and real-time data. Wang et al. (2020) provided an overview of big data analytics in manufacturing, discussing architecture, technologies, and applications for AMS.
Zambetti et al. (2023) recognized a hierarchical framework for data-driven product service systems, providing a structured approach to leveraging data in manufacturing contexts. Chatterjee et al. (2024) explored the impact of a data-driven culture on innovation, highlighting the importance of advanced analytics tools and leadership support in fostering an innovative environment. Du et al. (2023) developed an autonomous data governance system for production forecasting, emphasizing the role of advanced analytics in improving forecasting accuracy and robustness.
Bi et al. (2023) advocated for integrating IoT and big data analytics within enterprise architecture to enhance system capabilities and flexibility. Friederich et al. (2022) proposed a framework for automating the generation of simulation models in smart factories, leveraging ML and data mining techniques to reduce reliance on expert knowledge and enhance productivity. Babu et al. (2024) presented a seven-step data-driven invention process tailored for the UK manufacturing sector, guiding the conceptualization and commercialization of innovative data products.
Pires et al. (2023) suggested a trust-based recommendation approach for digital twin simulation decision support, improving prediction accuracy in scenarios with limited data. Mahmoodi et al. (2024) explored the use of data-driven simulation for resource allocation in smart manufacturing systems, developing a DDS-DSS framework that enhances resource allocation efficiency through multi-objective optimization and simulation-based bottleneck analysis. Tamang et al. (2024) compared various multi-criteria decision making methods for machining processes. Shimpi et al. (2024) used response surface methodology for optimizing the experimental results in extrusion blow moulding process. Joshi et al. (2024) explored multimodal transportation for smart cities using Lingo software. Kumar (2024) presented a state-of-the-art review for surface quality of products using advanced sheet forming process which is based on CAD/ CAM approach. Naveena et al. (2024) used machine learning and multi-objective optimization for elevating sustainability of the systems. Lo (2023) created a complete framework for evaluating suppliers for Industry 5.0, focusing on the use of a DDDM to speed up checks of suppliers and improve decision-making. This framework identifies key factors such as digital transformation and simultaneous information sharing as crucial for effective supplier management in advanced manufacturing systems.
The literature review indicates substantial advancements in examining big data within manufacturing, additive manufacturing, and sustainable manufacturing. However, a comprehensive implementation guide for data-driven decision-making (DDDM) in AMS, supported by practical examples, is lacking. This survey identifies the following research gaps that need to be addressed for the adoption of DDDM in AMS: a. Lack of a Conceptual Framework for DDDM Implementation in AMS: There is no straightforward framework integrating data analytics into a cohesive strategy for DDDM in advanced manufacturing systems. b. Incomplete Procedure for Transition from Traditional Decision Making to DDDM: The literature needs a comprehensive guide for transitioning from traditional decision-making processes to DDDM in AMS. c. Absence of a Holistic Data Acquisition and Integration Framework: A systematic approach is needed to effectively utilize structured, unstructured, and semi-structured data in manufacturing. d. Need for Practical Case Studies Using Real-World Data: The need for real-world case studies demonstrating the implementation and benefits of DDDM in manufacturing is still being determined.
This research aims to fill the above gaps by proposing a comprehensive framework for DDDM in AMS and validating it with a case study.
Framework for DDDM in AMS
Advanced manufacturing systems are broadly classified into five phases: product conception, design and development, manufacturing, quality control inspection, and post-manufacturing operations (Kumar et al., 2024f; Lu et al., 2020). Every stage necessitates specific instruments and techniques to ensure the seamless flow of the manufacturing process. Advanced manufacturing systems can substantially increase productivity, decrease costs, and improve product quality. Figure 1 depicts the architecture of the decision support system with the AMS components. These production phases generate an enormous quantity of structured and unstructured data that can be analysed for DDDM in AMS (Wang et al., 2021). During product conception, market analysis, product functions, performance requirements, environmental factors, and energy factors play a significant role. Analysing these factors’ data and incorporating that information in product conceptualization will lead to better product optimization (Kaniappan Chinnathai et al., 2021). Architecture of decision support system in AMS.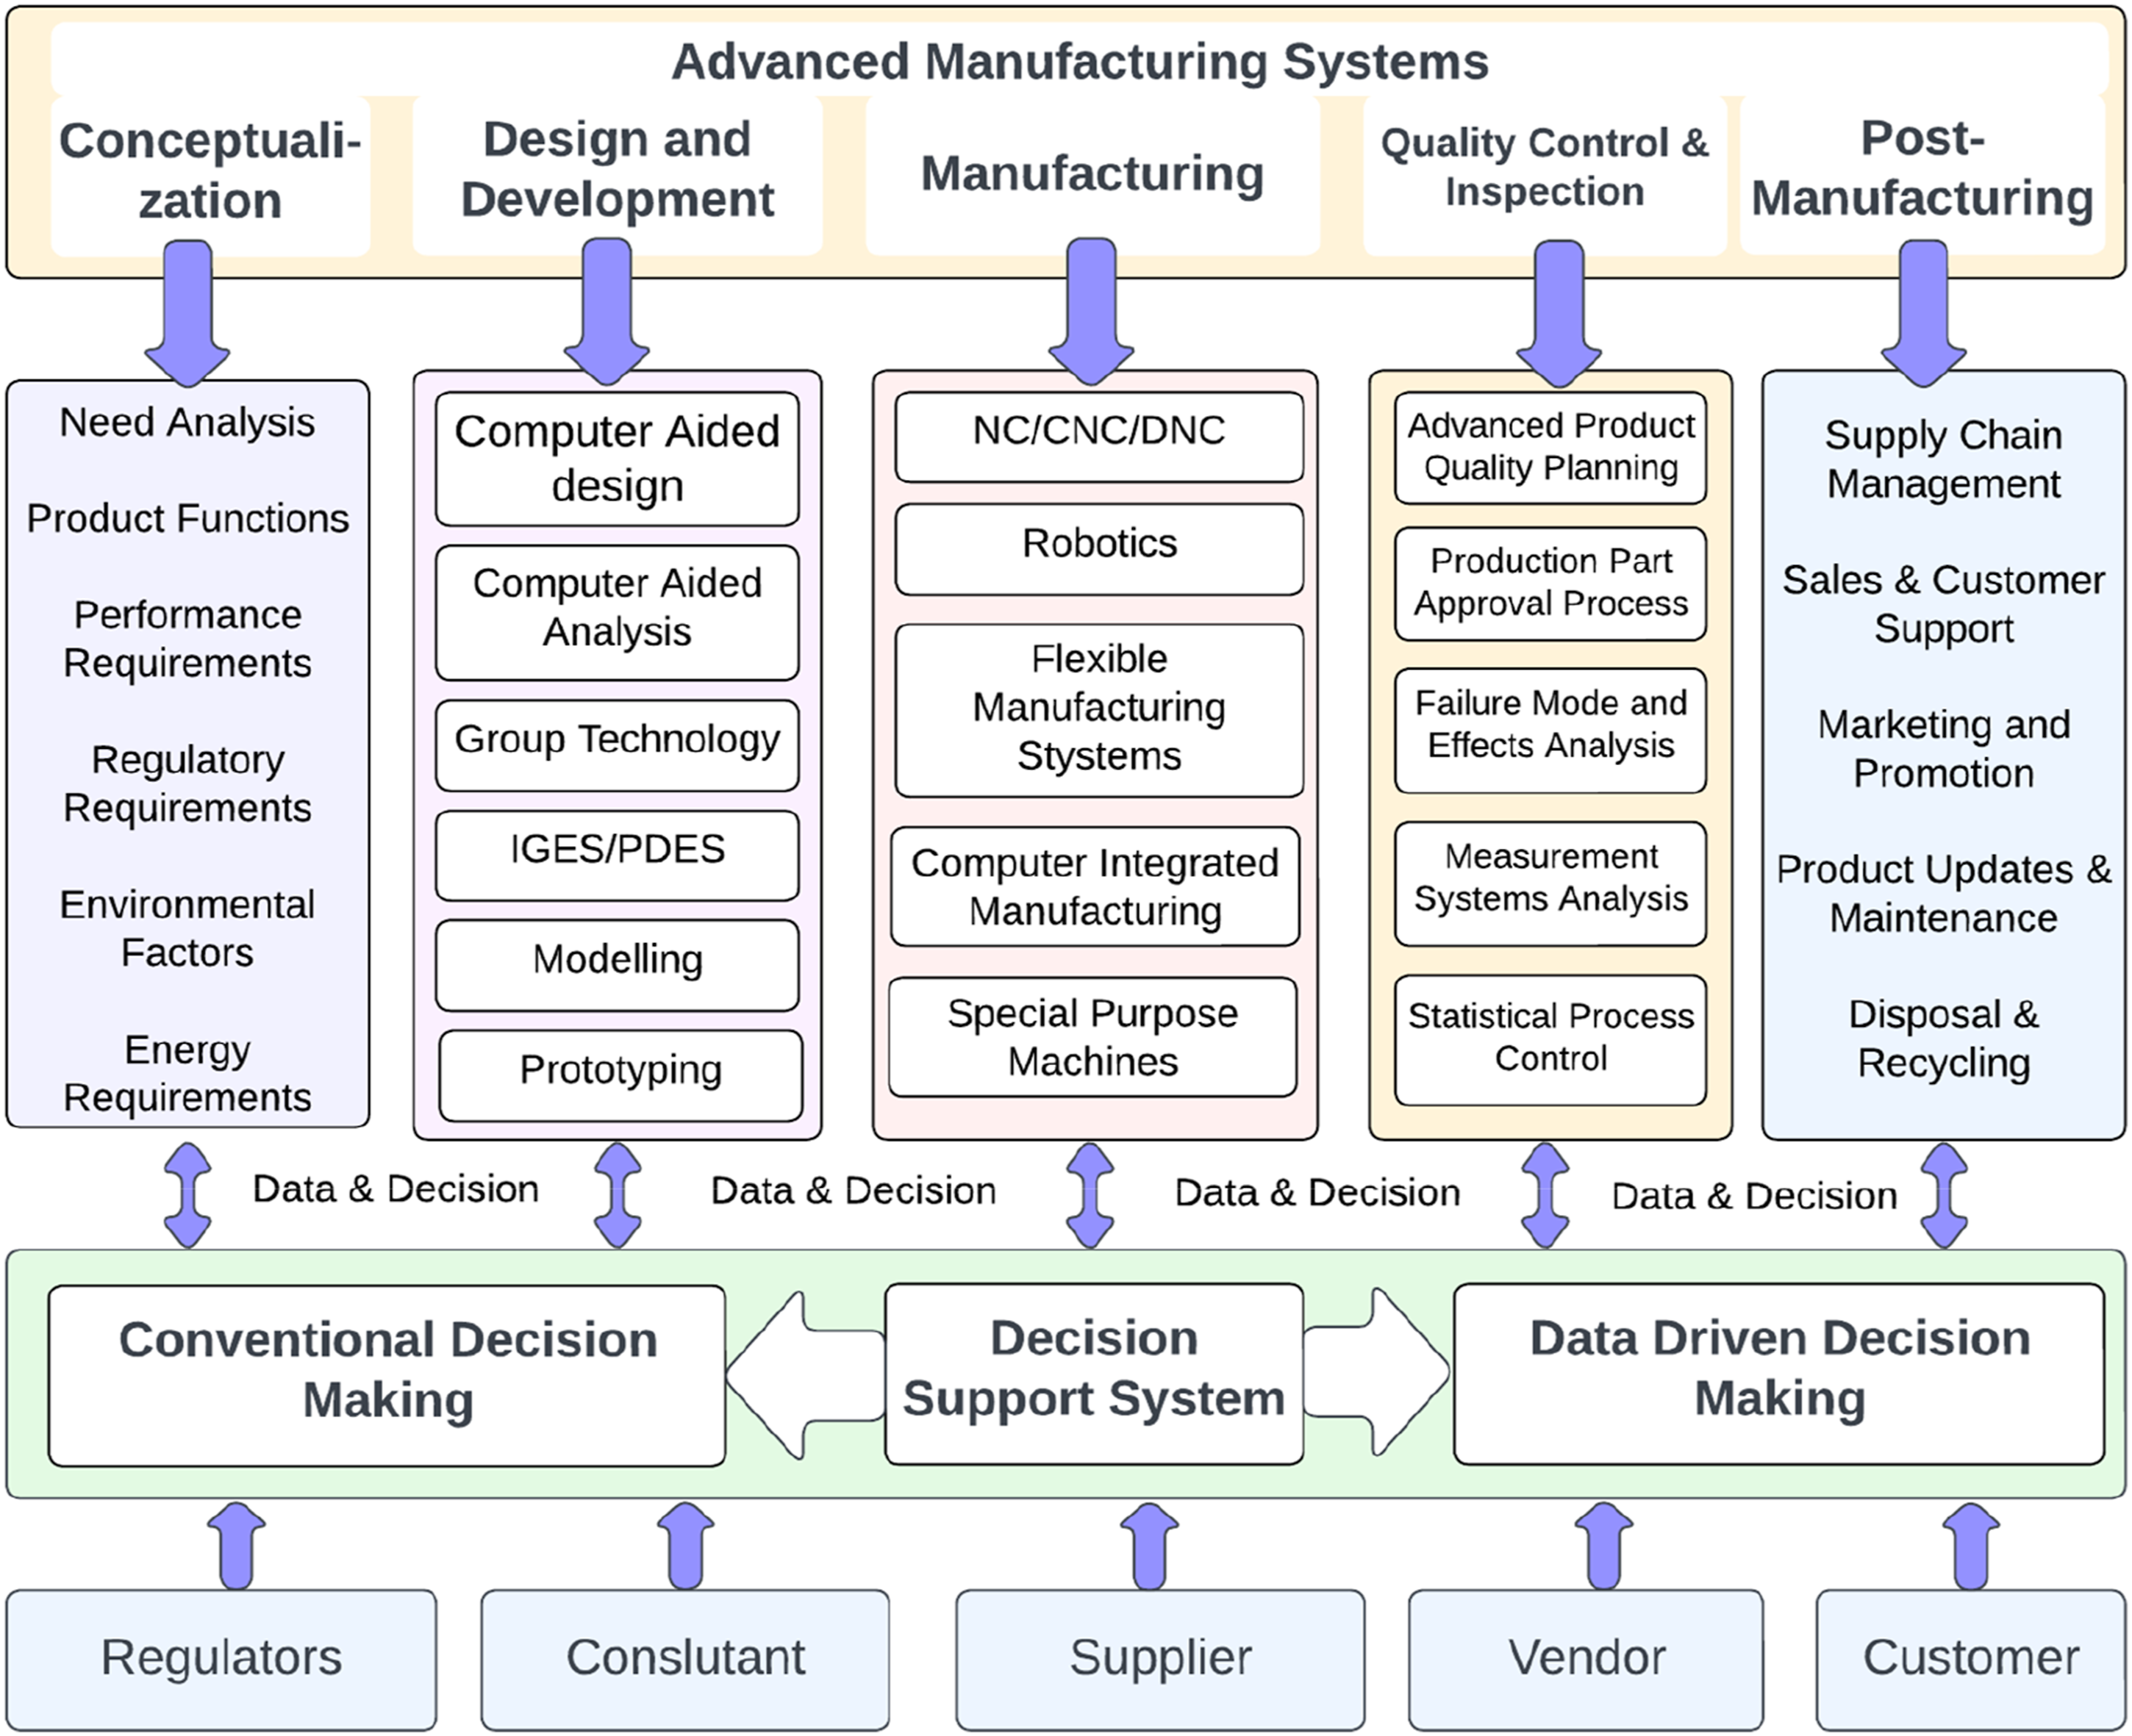
The technologies of CAD, CAE, group technology, computer-based and physical modelling, and prototyping are utilized in product design and development. After the design and development phases are complete, the product is manufactured using NC, CNC, DNC, robotics technology, a flexible manufacturing system, CIM, and special-purpose machinery (Wang and Bi, 2019). All of these procedures generate data of exceptional quality. After production, numerous quality checks are conducted to maintain the product’s standard and ensure compliance with regulatory requirements. Post-manufacturing operations include supply chain management, sales and customer support, marketing and promotion, product updates and maintenance, disposal, and recycling (Denger and Zamazal, 2020).
These manufacturing processes necessitate continuous decision support, and conventional decision support in older businesses, whereas modern firms use data-driven decision making. With the advancement of data capture and analysis technologies, decisions can now be data-driven during these phases (Gökalp et al., 2021). Simulation and prototyping data analysis are essential during the design phase to enhance the product’s design. Sensor data and quality control measures can be utilized to monitor and enhance the manufacturing process. With the incorporation of AMS and DDDM, manufacturers can make more informed decisions throughout the lifecycle of their products (Wu et al., 2021).
In Figure 2, it is evident that the traditional decision-making process, which relies on observation and experience, is evolving into a more intelligent, data-driven approach. In the past, expertise was primarily acquired through physical observations such as visual inspection and noise detection in industrial systems. However, now, various theoretical, experimental, and computational methodologies are being employed to develop data-driven models that analyse and process data, integrating machine and human intelligence. This approach, known as data-driven decision making (DDDM), allows for more precise, swift, and reliable decision-making. DDDM, which harnesses the power of technology and statistical analysis, has gained popularity in diverse fields including business, healthcare, government, and manufacturing. In the context of Advanced Manufacturing Systems (AMS), DDDM involves the analysis of vast and continually expanding datasets. Effectively utilizing these complex datasets for decision-making offers significant benefits to manufacturing businesses, including those involved in additive manufacturing (such as 3D printing, rapid prototyping, and rapid manufacturing), subtractive manufacturing (operations like turning, drilling, boring, and ramming), process industries, society, and everyday life. Concepts of conventional decision making and data-driven decision making.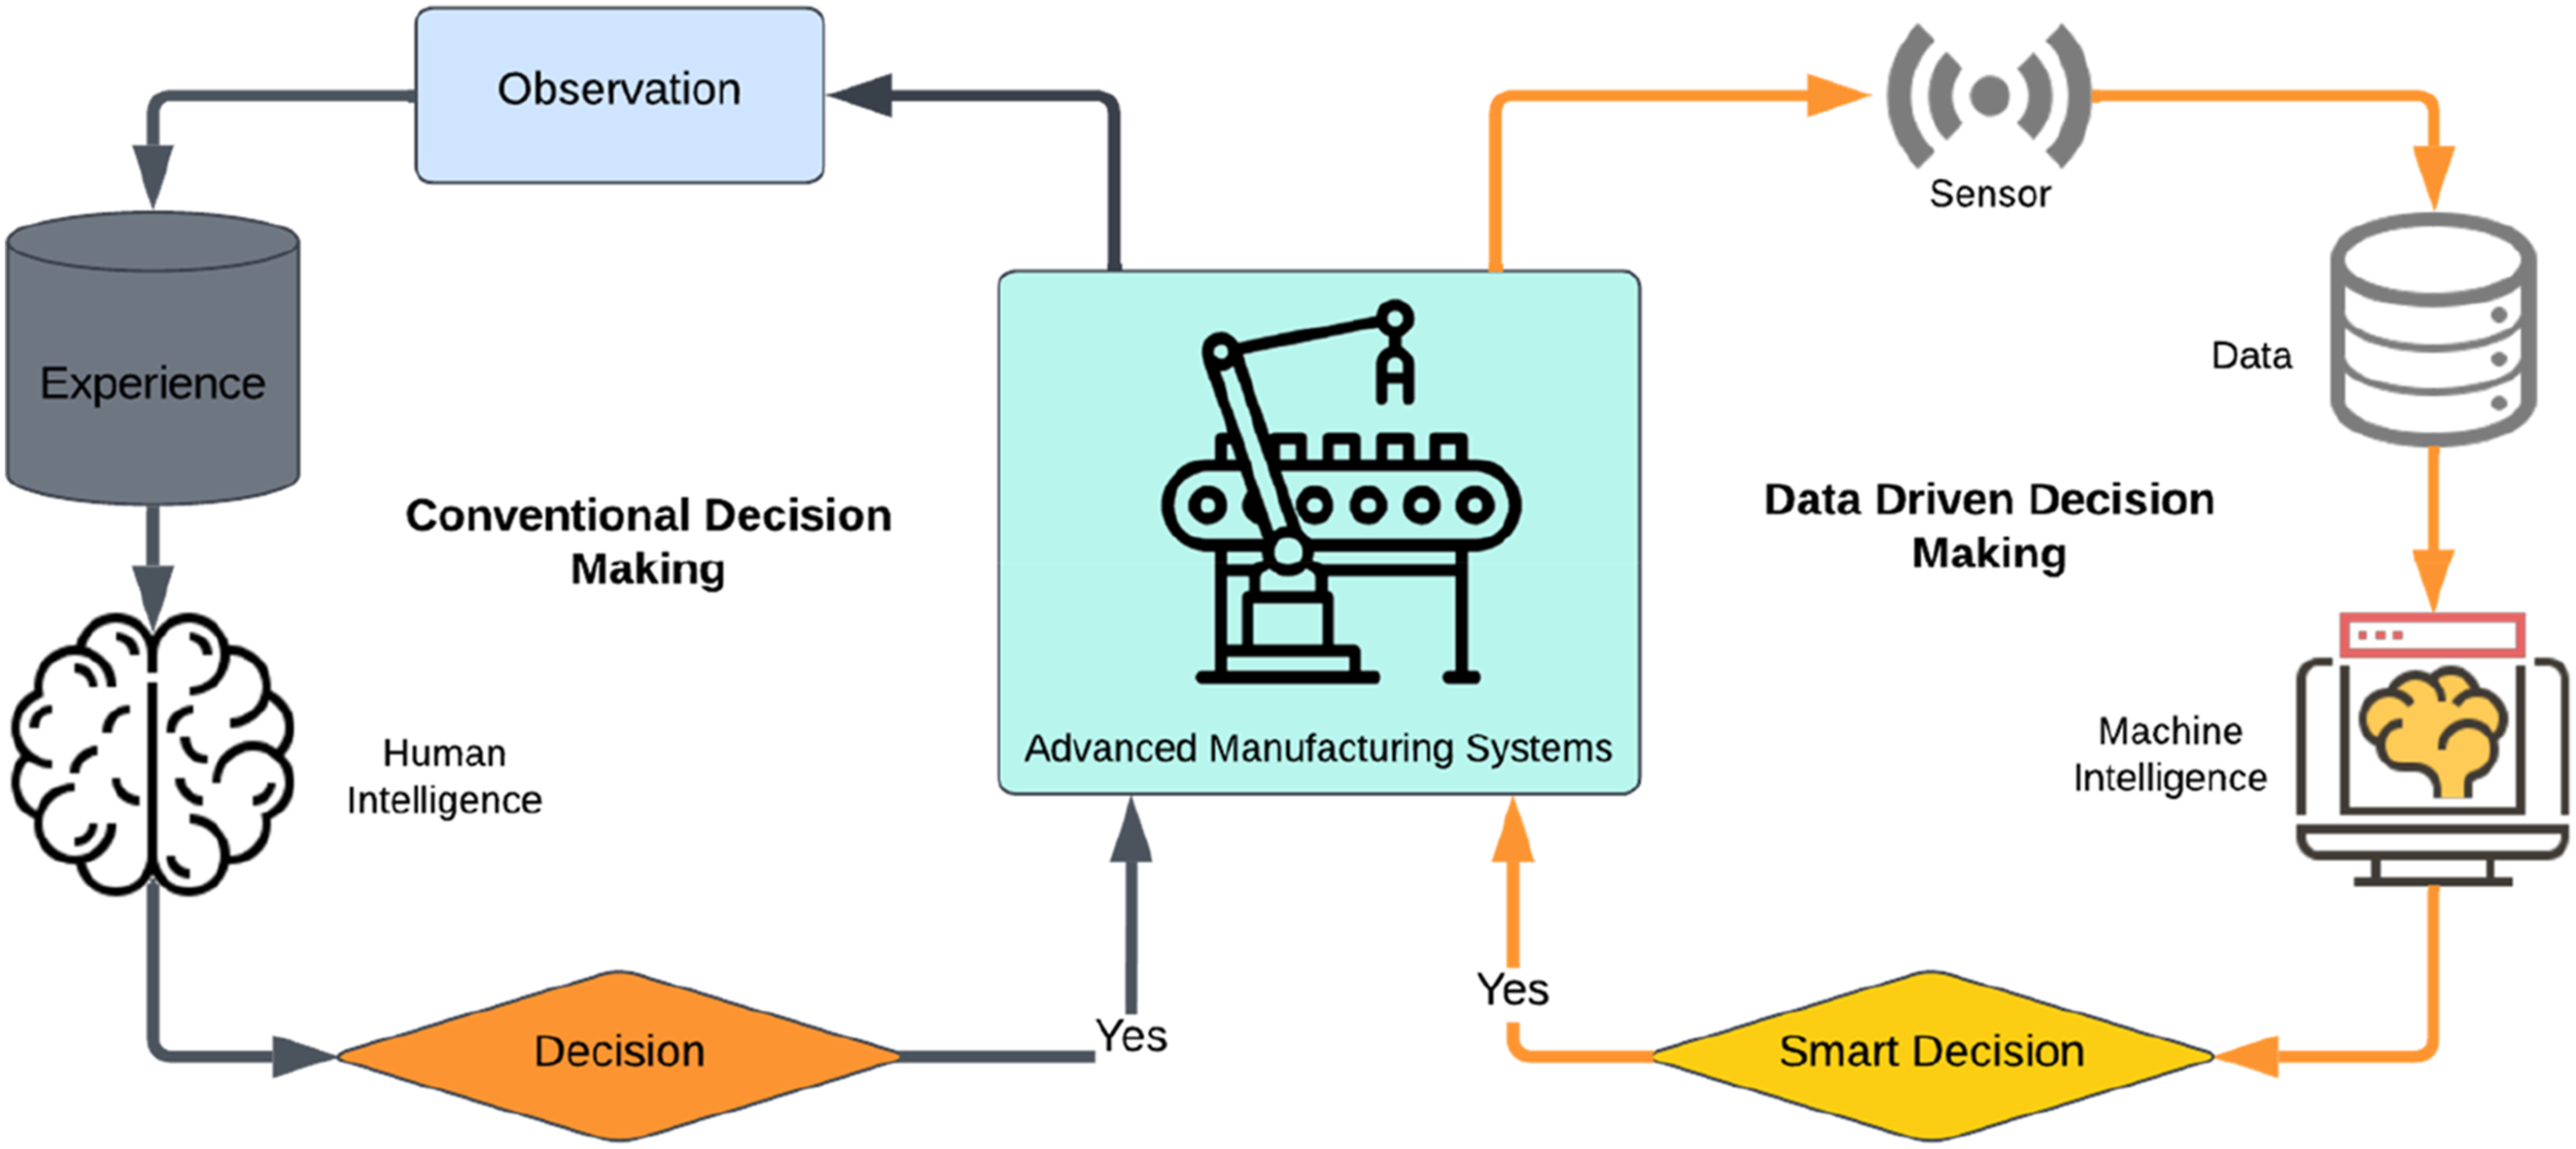
Manufacturing industries’ existing architecture cannot use these enormous amounts of produced data for effective decision-making. The need for the adoption of DDDM in AMS is expanding over time, and there is a need for a specific architecture that will aid the engineers and management of manufacturing organizations in implementing DDDM (Wang et al., 2022a). So, based on the literature reviewed and the expert’s opinion, a general framework for the DDDM-AMS is developed, shown in Figure 3. Data on the product life cycle of advanced manufacturing systems can be systematically monitored, regulated, collected, and analyzed using this proposed framework. The collected data will be transported and stored in databases using communication and network technologies. In addition, pre-processed data that is trustworthy and accessible is offered to enable data mining and decision-making. This presented framework consists of six stages: Manufacturing stage, sensing stage, data stage, knowledge stage, decision stage, and application stage, further described in the following subsections. A DDDM framework for AMS.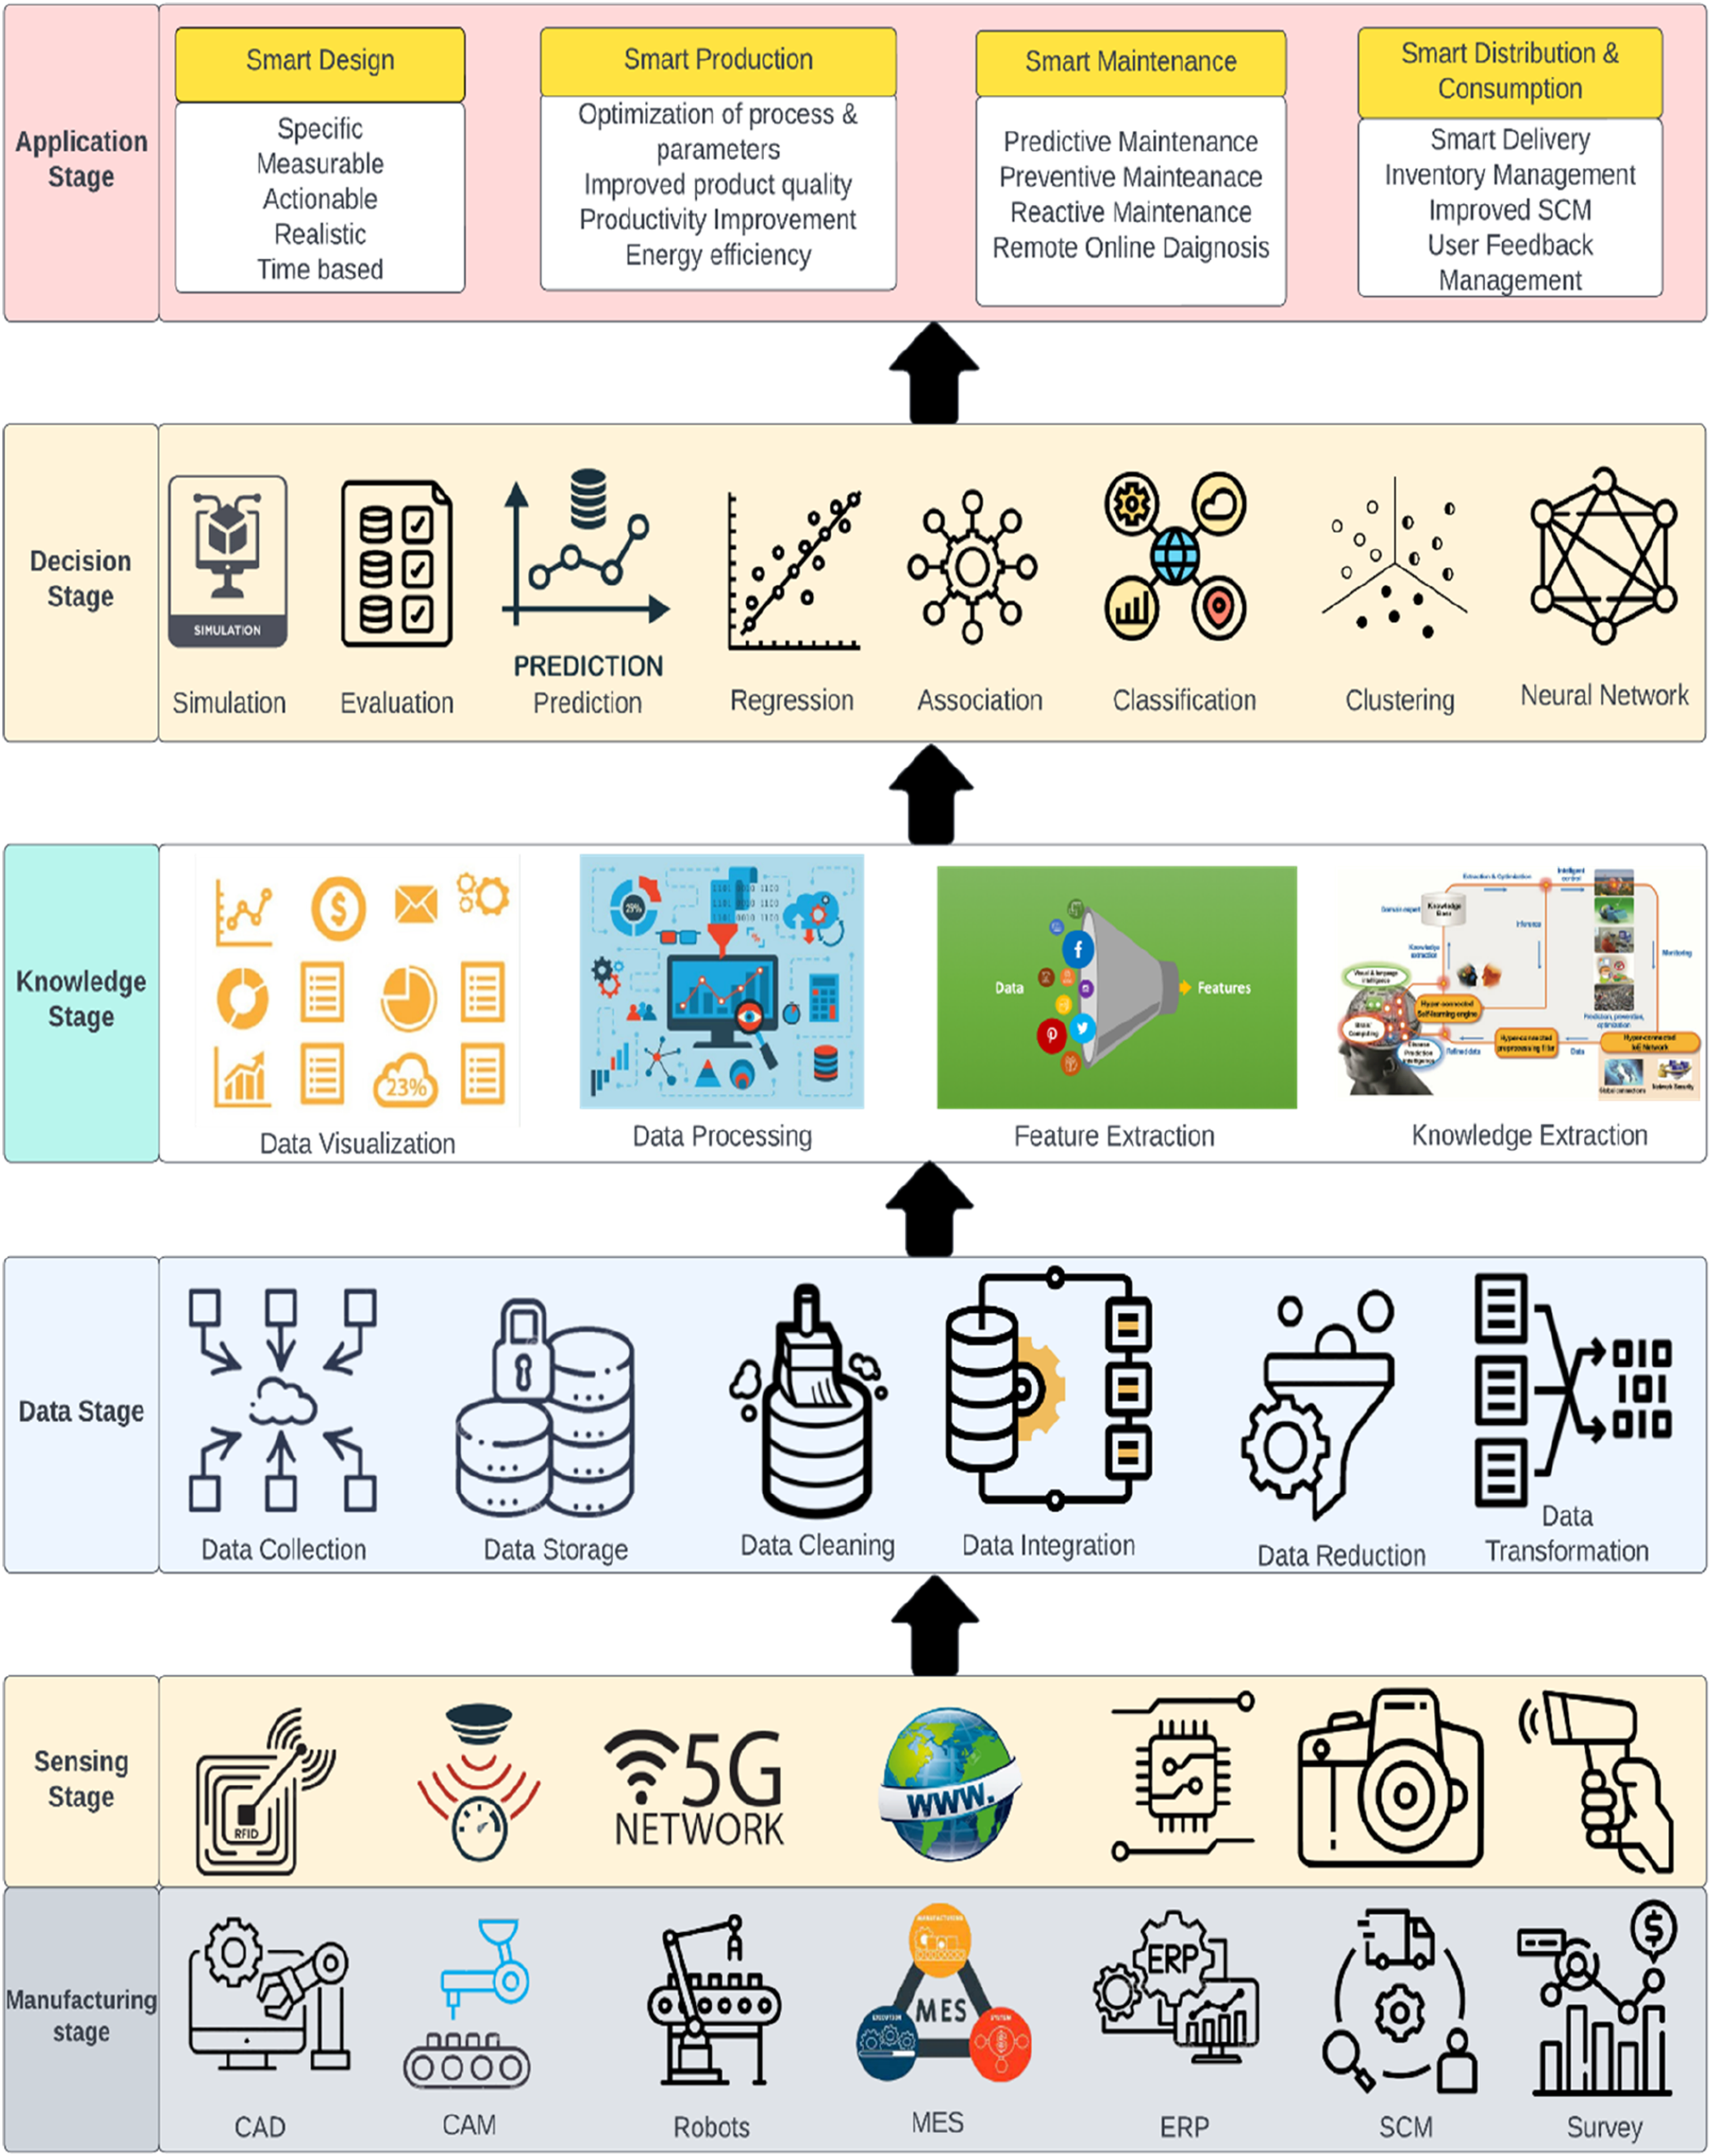
Manufacturing stage - Sources of manufacturing big data
The manufacturing stage is the first stage of the proposed framework, where manufacturing big data is collected from various sources such as product design, manufacturing, robots, MES, ERP, SCM, marketing surveys, and customer feedback. This data is divided into two main categories: system data and data based on IoT. System data includes data from numerous enterprises, while IoT data includes data captured from sensors like RFID and barcode readers. These data can be classified as structured, semi-structured, or unstructured. Structured data includes information from smart devices, sensors, process parameters, and other sources. Unstructured data includes product drawings, text, video, and audio information. Smart devices provide real-time access to data sources, enabling informed decisions and innovative business operation models.
Sensing stage – Manufacturing data sensing, acquisition and transmission
The second step of the framework senses and captures data by integrating IoT devices such as smart sensors, RFID readers, RFID tags, cameras, scanners, and the internet across the whole product production cycle of advanced manufacturing systems. The vast heterogeneous and multi-source manufacturing data are sensed and recorded for further analysis (Ojha et al., 2022). The system operation and production of high-quality goods under client specifications are controlled and monitored by smart sensors and calibrating devices (Eifert et al., 2020). The product quality data is also tracked and gathered at every step of manufacturing up to the assembly process. The massively recorded data is then sent to the next working layer of the framework for pre-processing using common communication protocols (such as Modbus, intranet, internet, and 5G). Text files, databases, excel files, unorganized data from GPRS, and audio and video clips are just a few sources used to collect the information (Yorkston, 2021).
Data stage: Pre-processing of manufacturing big data
The raw, real-world data gathered throughout the manufacturing process in text, images, and videos needs to be better structured to be analyzed. It generally doesn’t have crucial information, lacks a regular, consistent arrangement, and has the potential to be erroneous and irregular. The first step in creating a DDDM model is pre-processing the data. In this step, raw data is transformed into a suitable format that computers and other data mining and analysis algorithms can execute.
Pre-processing processes for big data analysis, such as data collection, storage, cleaning, integration, reduction, and transformation, are carried out in the third stage of the architecture, referred to as the data stage. The collection of the data and its preparation are the two major goals of the data stage. “Data Collection” refers to the organized process of collecting observations or measurements (Lobe et al., 2020). “Data Storage” is retaining information on a recording medium for subsequent retrieval by computers or other devices. The three most prevalent types of data storage are file storage, block storage, and object storage; each has a specific function (Srivastava et al., 2019). “Data Cleaning” is a process for cleaning data by eliminating outliers, replacing missing values, lowering noise in noisy data, and reconciling conflicting data. Each of these tasks may be completed in several ways, each according to the preferences or problem areas of the user (Tae et al., 2019). “Data Integration” refers to combining information from several sources into a coherent viewpoint. Two objectives may be achieved by “Data Reduction”: lowering the number of material records by deleting unnecessary data and creating summary data and statistics at various degrees of aggregation for diverse uses (Wang et al., 2020). “Data Transformation” is converting data from one format to another, often from one required by a destination system into that of a source system. After this transformation process, data is now ideal for analysis and information extraction (Cui et al., 2020).
Knowledge stage – Processing of big data
The framework’s fourth stage, the knowledge stage, discusses the processing of manufacturing big data. This stage involves the visualisation, processing, feature extraction, and knowledge extraction of the data. Data visualisation employs infographics, charts, and animations to present information graphically to comprehend complex data relationships and insights. Data Visualization is the process of discovering trends and correlations in our data through graphical representation. Various Python data visualisation modules, including Matplotlib, Seaborn, and Plotly, can be utilised for data visualisation in Python (Rogel-Salazar, 2023). “Data Processing” is the set of calculations or operations a computer performs on a set of data to produce the desired result. The tools that are most frequently used for data processing are Storm, Hadoop, HPCC, Statwing, Qubole, and CouchDB (ur Rehman et al., 2019). With these data processing technologies, data are analysed and processed in ways that could be more practical using manual techniques. As a result, useful information is obtained in various file formats, depending on the program or application needed, including a chart, an audio file, a table, a graph, a picture, or a vector file. These data processing tools enable users to quickly process enormous amounts of unprocessed data and obtain the desired outcomes, an essential step in data management.
“Feature Extraction” is advantageous because it reduces the need for redundant data collection. Data reduction enables the model to be generated with less machine effort by accelerating the machine learning and generalization phases. Autoencoders, wavelet scattering, and deep neural networks are popular tools for dimensionality reduction and feature extraction (Alqahtani, 2023). Improving the training of a machine learning model involves changing a data set. To ensure that the final machine learning model will fulfill its business use case, data scientists expertly adjust the training data inside the data set by adding, deleting, combining, or modifying it. The machine learning model can operate more effectively due to this process. The process of extracting information from unstructured (text, documents, images) and structured (relational databases, XML) sources is called “Knowledge Extraction” (Dominguez et al., 2023). The knowledge generated must be expressed in a fashion that allows for inference and in a machine-readable and machine-interpretable format. Knowledge extraction is collecting data and facts from several sources to produce a centralised knowledge bank. The end user may use the formal knowledge for whatever purpose since the knowledge extraction approach generates accurate data that is easy for software to read and analyse (Côrte-Real et al., 2017).
Decision stage: Analysing and gaining insights from data
Data simulation, evaluation, prediction, regression, association, classification, clustering, and neural networks are included in the fifth stage of this framework, which is called the decision stage. “Data Simulation” is the practice of simulating actual circumstances or occurrences using a large amount of data. A useful tool for decision-making, bettering our comprehension of complex systems, and generating predictions is data simulation (Greasley and Edwards, 2021). Computer-based simulations often employ a software-generated model to aid managers’ and engineers’ decisions and for training purposes. Simulator-based learning methods facilitate understanding and exploration since the models are visible and interactive. Simulator systems come in several forms, including dynamic, process, and discrete event simulations (Iqbal et al., 2020).
“Data Evaluation” involves acquiring information pertinent to those goals and analysing it to determine if your program is accomplishing its objectives. For a thorough understanding of the program's impacts, it is essential to collect quantitative and qualitative data during evaluation (Dominguez et al., 2023). Making predictions based on data using analytical methods is known as “Predictive Analytics.” A predictive model uses data, analysis, statistics, and machine learning methods to anticipate future occurrences. Predictive analytics may identify trends and behaviours in a certain market using patterns in vast amounts of data. With the aid of these projections, decision-makers in business and finance may make informed decisions (Dubey et al., 2019).
Application stage: Benefits of implementing DDDM in AMS
When effectively applied, DDDM gives firms a competitive edge over rival businesses in their sector. Since decisions are based on reliable information, market trends, production quality, and customer service are examined more deeply. DDDM contributes to developing advanced manufacturing systems by enhancing each sector and making them smart, like smart design, production, maintenance, distribution, and consumption, commonly referred to as smart manufacturing (Sleep et al., 2019). All sizes of companies are realizing the value of data-driven initiatives and using data to get deeper insights into their markets, customers, and operations. As shown in Figure 4, Market analysis, demand forecasting, production optimization, predictive analytics, fault detection, preventive maintenance, and quality improvement are the applications of DDDM in AMS (Bousdekis et al., 2021). Applications of DDDM in AMS.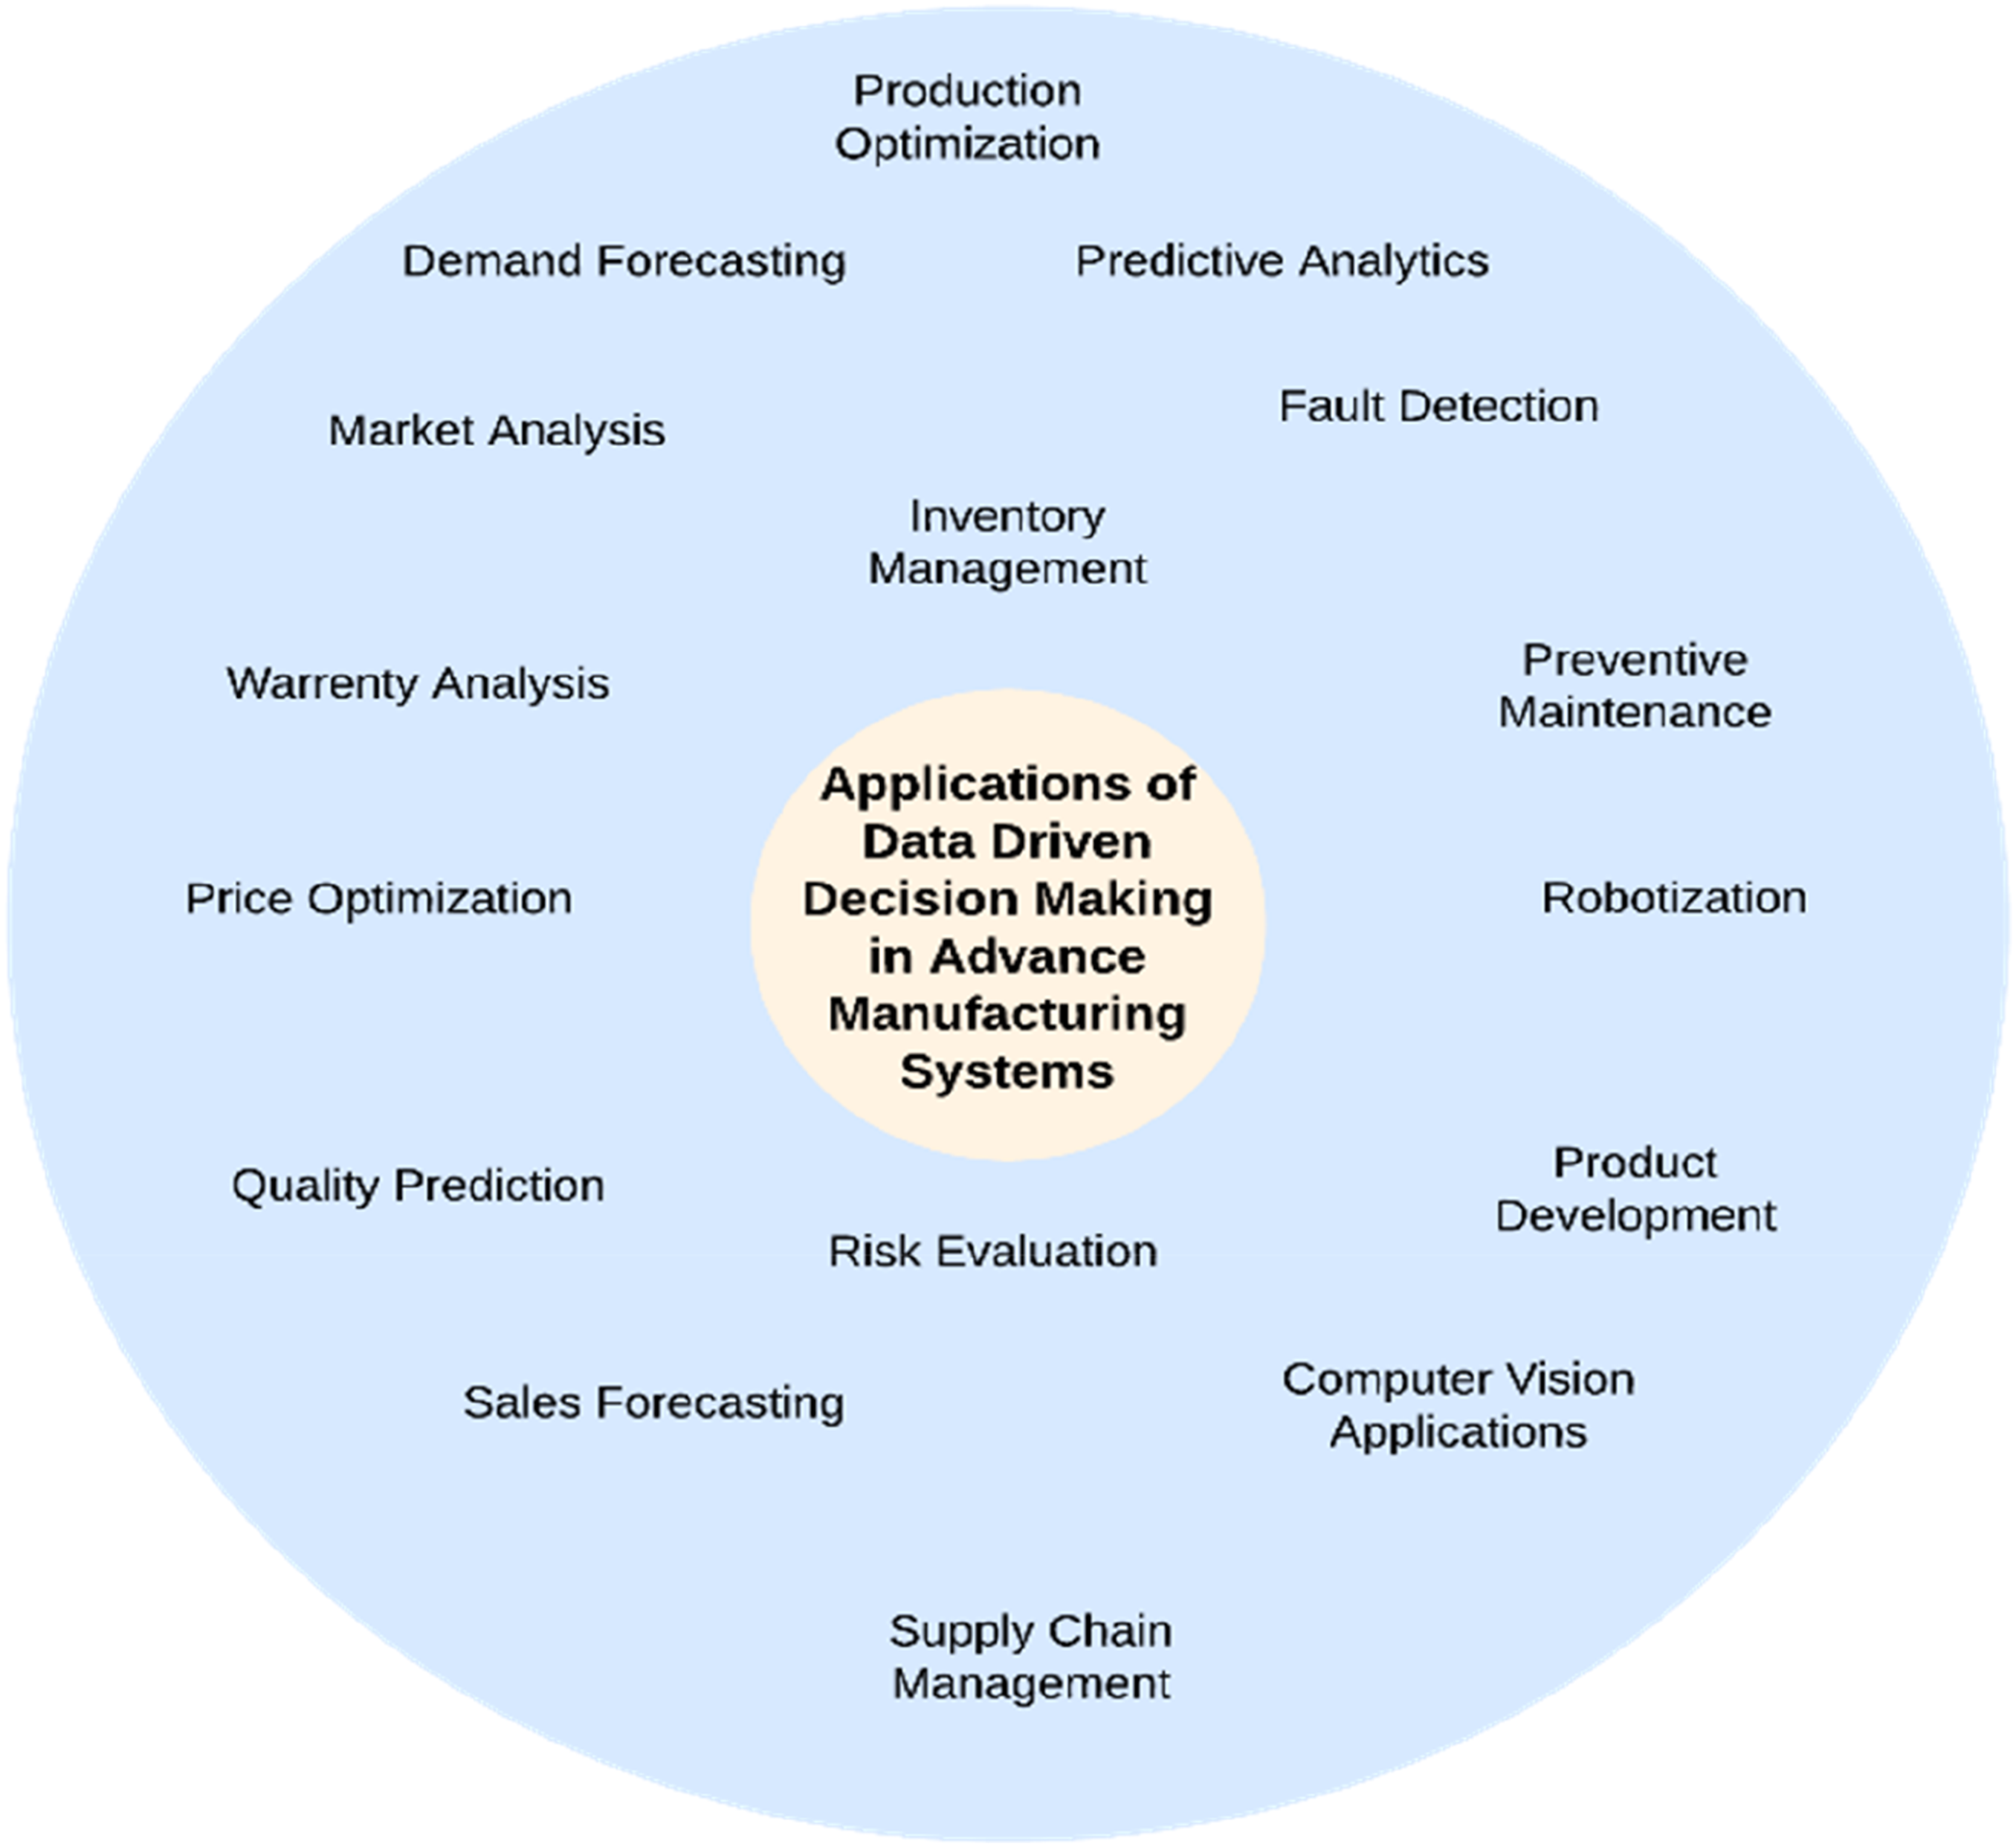
DDDM not only makes it possible to analyse historical data, but it can also power predictive analytics, which manufacturers may use to plan proactive maintenance. DDDM enables producers to avert unplanned downtime and expensive equipment failures. According to the Honeywell-KRC study, big data analytics can minimize failures by up to 26% and unplanned downtime by over 25% (Rob Consoli, 2018). Furthermore, big data analytics may help manufacturers cut maintenance costs dramatically while improving product performance and customer happiness (Andronie et al., 2021). Manufacturing procedures and supply chains are extensive and complicated in today’s more linked and globalized world. The capacity to thoroughly analyse each process element and supply chain link is a prerequisite for efforts to simplify processes and improve supply networks. Manufacturers have this capability thanks to big data analytics. From design through client delivery, they may keep tabs on the development of goods and components at every stage of the process.
Implementation of the proposed framework
An advanced manufacturing operation analysis case study is demonstrated as a proof of concept for implementing the proposed framework for adopting DDDM in AMS. The primary goal of this case study is to illustrate the application of decision-making through big data analytics using the provided framework and showcase how valuable insights can be leveraged to benefit the company. In the following sections, the application study is explained in detail. The dataset utilized for this analysis was retrieved from (Mauthe et al., 2021). This data was generated in the Smart Lab at the University of Michigan.
Manufacturing stage and sensing stage
A succession of machining experiments was conducted on 2″ × 2″ × 1.5″ wax blocks in a CNC milling machine. Variations of tool condition, feed rate, and clamping pressure were measured using a CNC machine to capture machining data. Each experiment yielded a completed wax component with a “S” shape - S for smart manufacturing - incised into the upper face. The Rockwell Cloud Collector Agent Elastic software extracted this data from a CNC milling machine in the System-level Manufacturing and Automation Research Testbed (SMART) at the University of Michigan.
Data stage
Time series data from these 18 experiments were collected with a sampling rate of 100 milliseconds and are reported separately in.csv files. These 18 experiments captured a total of 25,285 records. The dataset consists of 48 columns, each representing an experiment-specific characteristic, such as experiment number, material (wax), feed rate, or clamp pressure. Per experiment, outputs include tool condition (unworn and worn tools) and whether or not the tool passed visual inspection. The data is then loaded into the Jupyter Notebook for further analysis. The data cleansing procedure is carried out, removing cells with missing values and outliers. The data are then pre-processed in preparation for analysis. Each experiment’s parameters and results were added to the experiment’s time series data to create a single data frame. Due to the small number of ‘Starting’ and ‘end’ labels in machining processes, they are normalized in alternative labels by considering ‘Prepare’ and ‘End,’ respectively.
Knowledge stage
This stage visualizes this cleansed dataset in depth using various data visualization tools like Tableu, Wrapper, Plotly, etc. In this stage, the two most significant outputs generated by the data are visualized, namely the finalized machining and tool condition. The indicator for “if machining was completed without the work-piece moving out of the pneumatic vice is “Yes/No” for machining completed. Condition of the tool is described as “worn/unworn.” Then, exploratory data analysis (EDA) is utilized to uncover the subsequent information.
Five different feed rates (relative velocity of the cutting tool along the work-piece in mm/s) and clamp pressures (pressure used to hold the work-piece in the vise in the bar) were used in these experiments. The feed rates were 3 mm/s, 6 mm/s, 12 mm/s, 15 mm/s, and 20 mm/s, and the clamp pressures were 2 bar, 5 bar, 3 bar, and 4 bar. Figures 5 and 6, respectively, depict the effect of feed rate and clamp pressure. All the machining performed at feed rates of 3 mm/s, 12 mm/s, and 15 mm/s have been completed. However, using feed rates of 6 mm/s and 20 mm/s, it is discovered that not all machining operations are completed. Using EDA, it is determined that 91% of machining operations are completed, and 9% are not completed at the feed rate of 6 mm/s. On a feed rate of 20 mm/s, only 51% of operations are completed, and 49% of machining operations generate defects, resulting in “machining not finished” and the inability to manufacture the component. Since there are failures in machining operations at feed rates of 6 mm/s and 20 mm/s, it is necessary to understand these failures and determine their relationships with clamp pressure. Impact of feed rate on machining finalized. Impact of clamp pressure on machining finalized.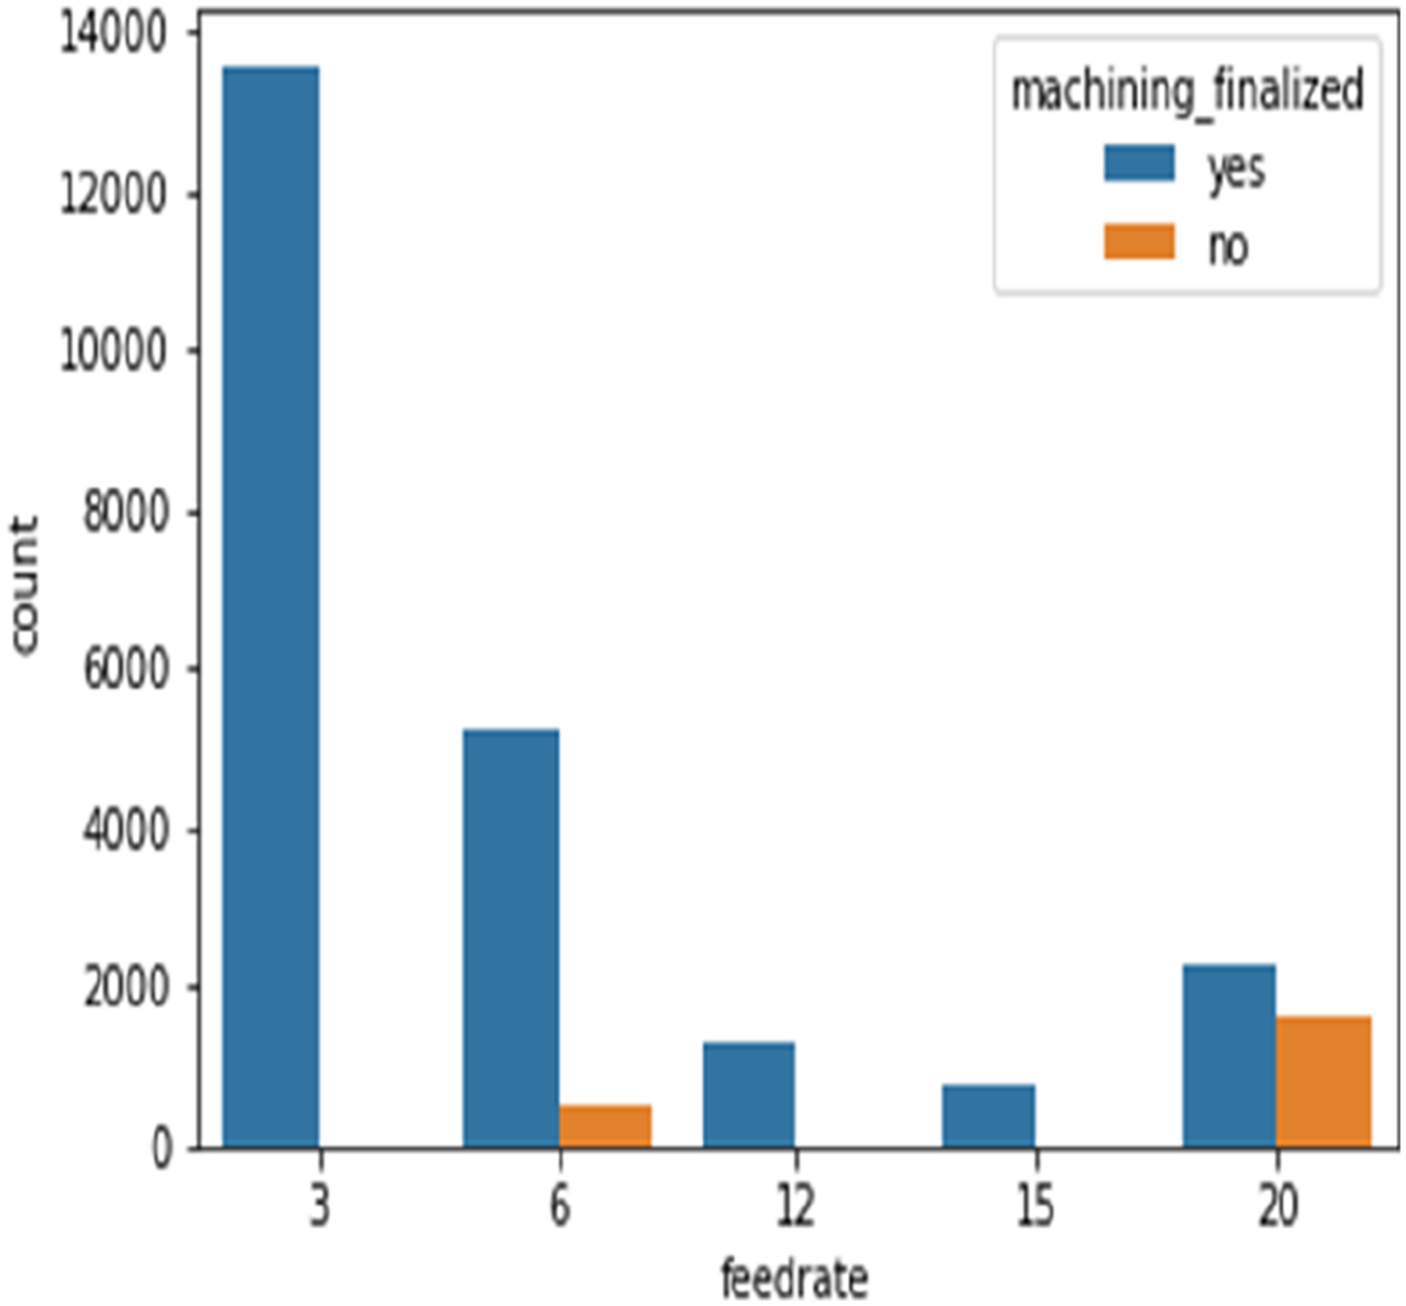
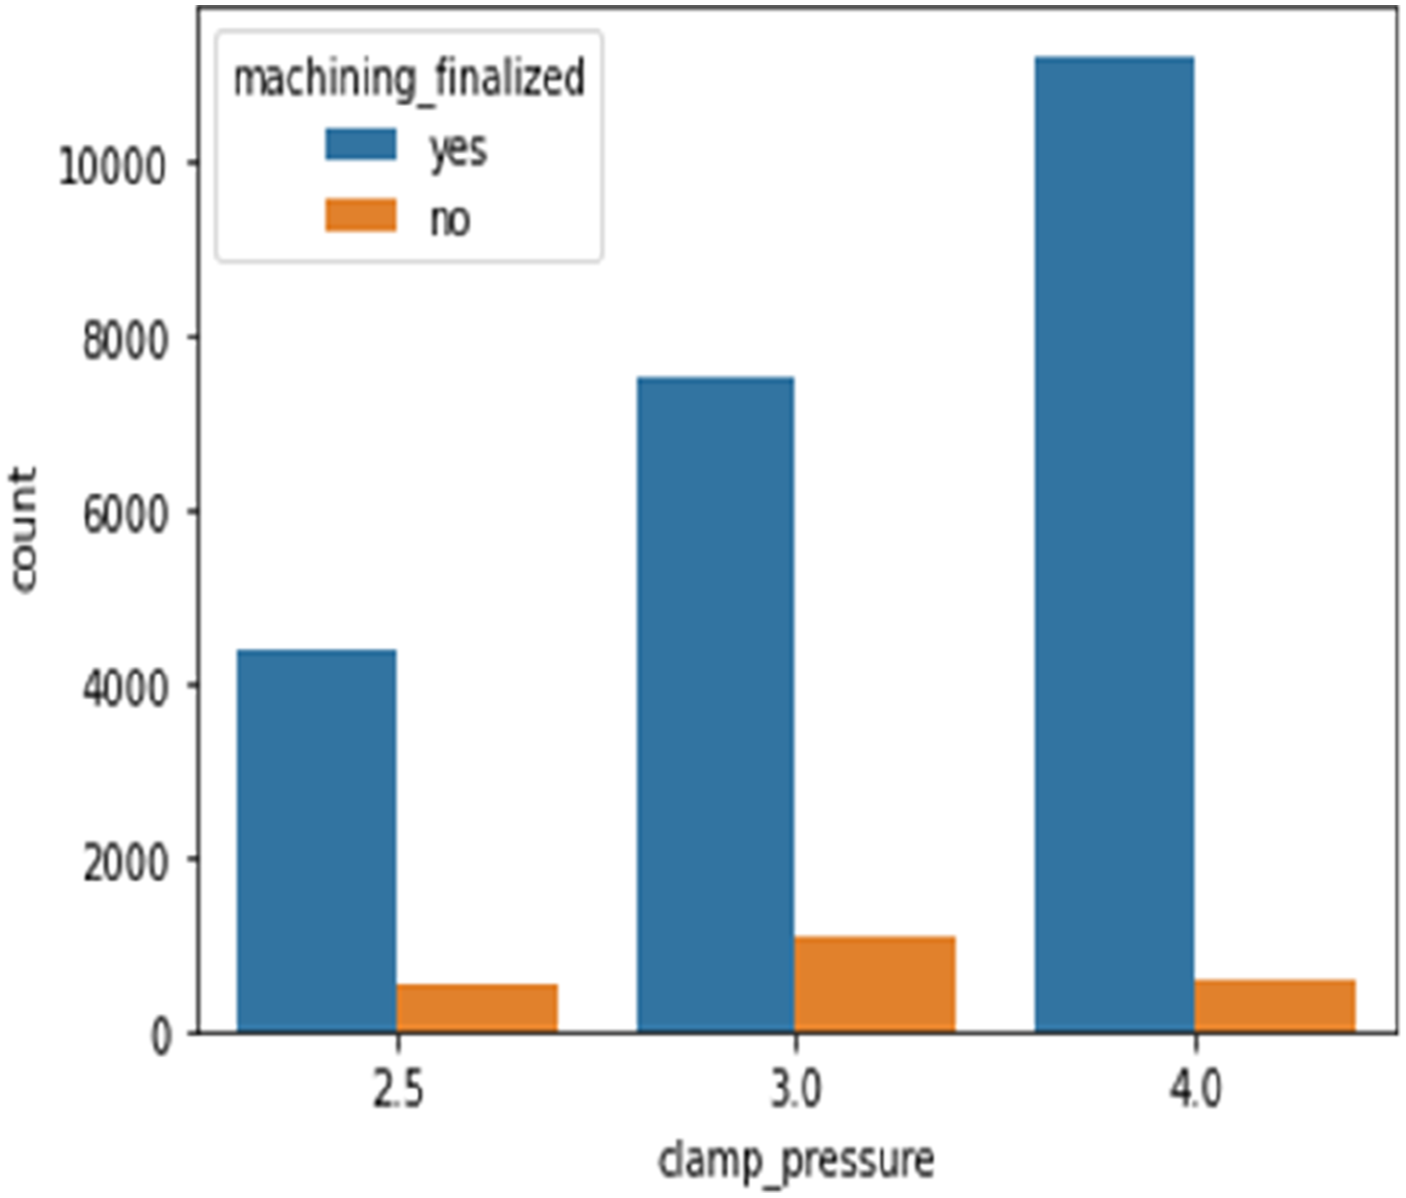
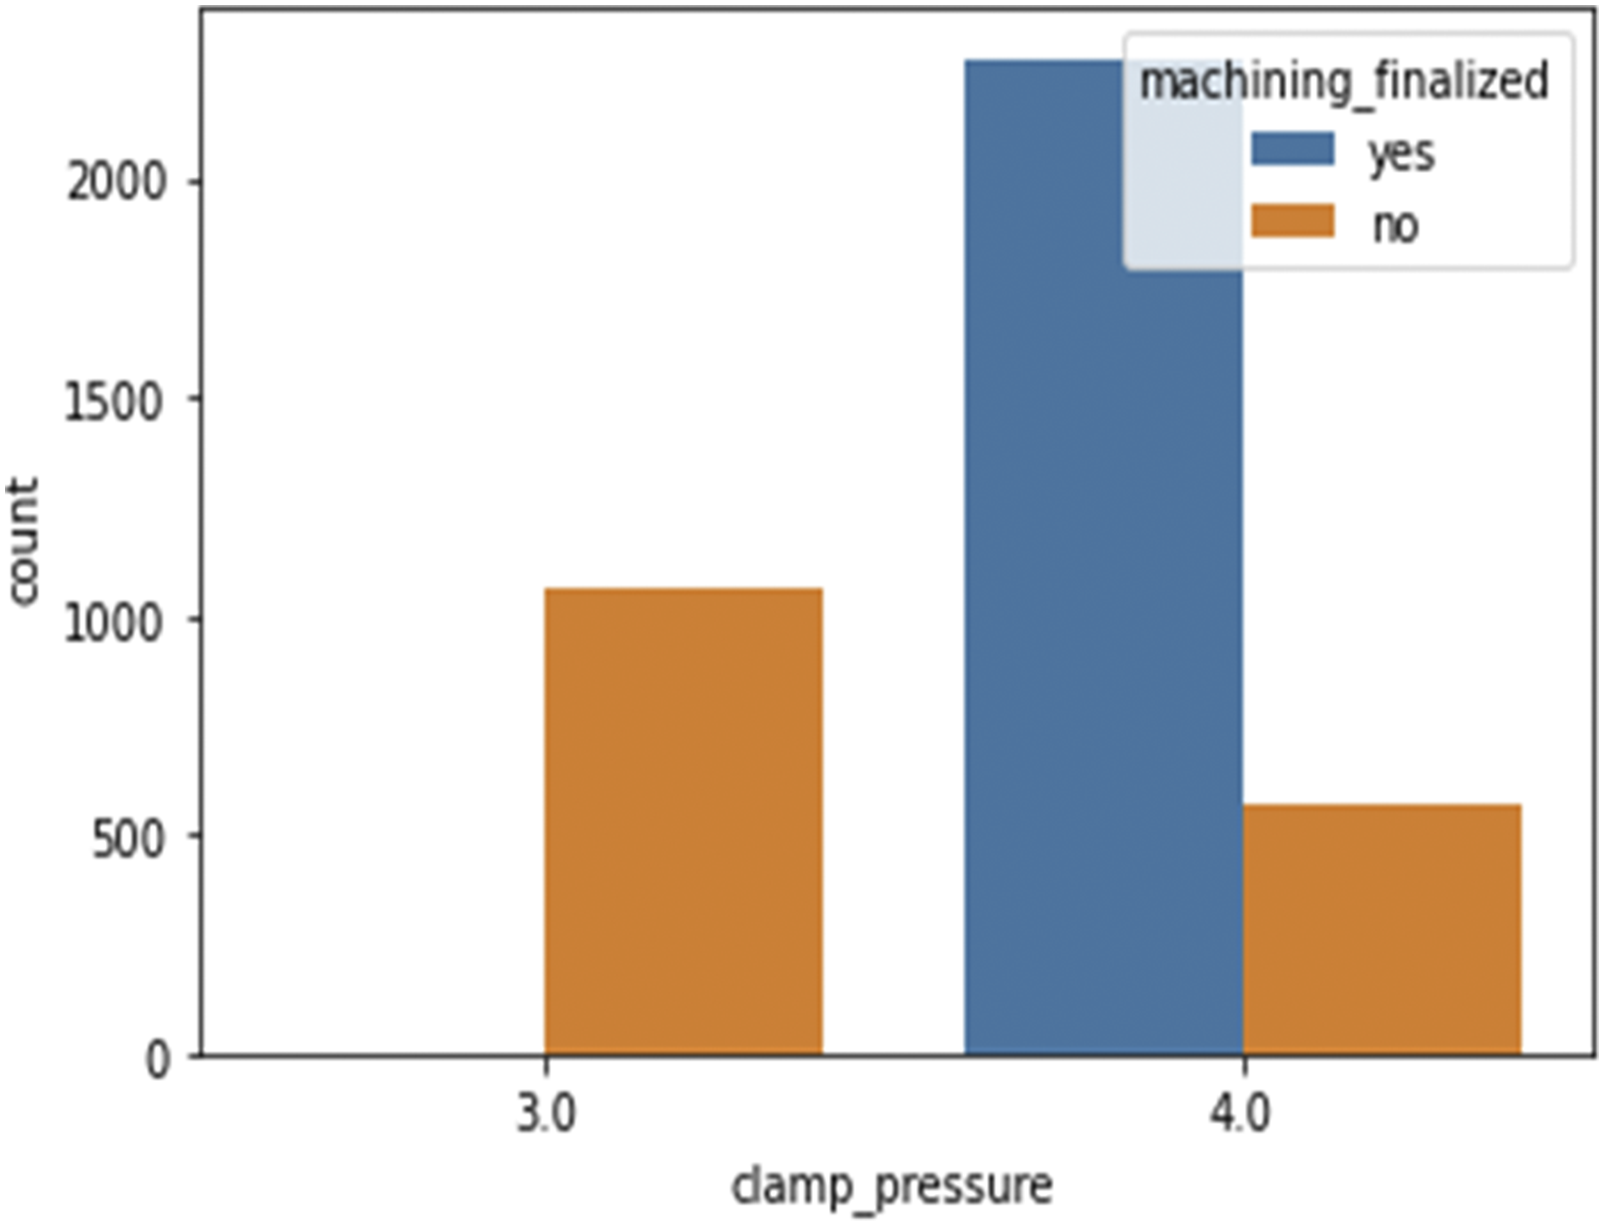
Figure 7 indicates that, when using a feed rate of 6 mm/s, all machining performed at a clamp pressure of 2.5 bar is not finalized, whereas all other machining operations have finalised. It indicates that a minimum clamping pressure of 3 bar must be obtained while using a feed rate of 6 mm/s. At a feed rate of 20 mm/s, 100% of machining failed at a clamp pressure of 3 bar, whereas at a clamp pressure of 4 bar, 80% of operations are finished, while 20% are not since feed rate affects production directly. The greater the feed rate, the greater the production rate. Therefore, if a company requires a higher output and must use a feed rate of 20 mm/s (Figure 8), the operator must ensure that the clamp pressure of the CNC machine is greater than 4 bar. Similarly, Figure 8 depicts the impact of clamp pressure on machining completion. The percentage of finished machining is 89, 87, and 95 for clamp pressures of 2.5 bar, 3 bar, and 4 bar, respectively. From this, we can conclude that the higher the clamp pressure, the greater the likelihood of machining completion. Machining finalized status with clamp pressures at feed rate of 6 mm/s. Machining finalized status with clamp pressures at feed rate of 20 mm/s.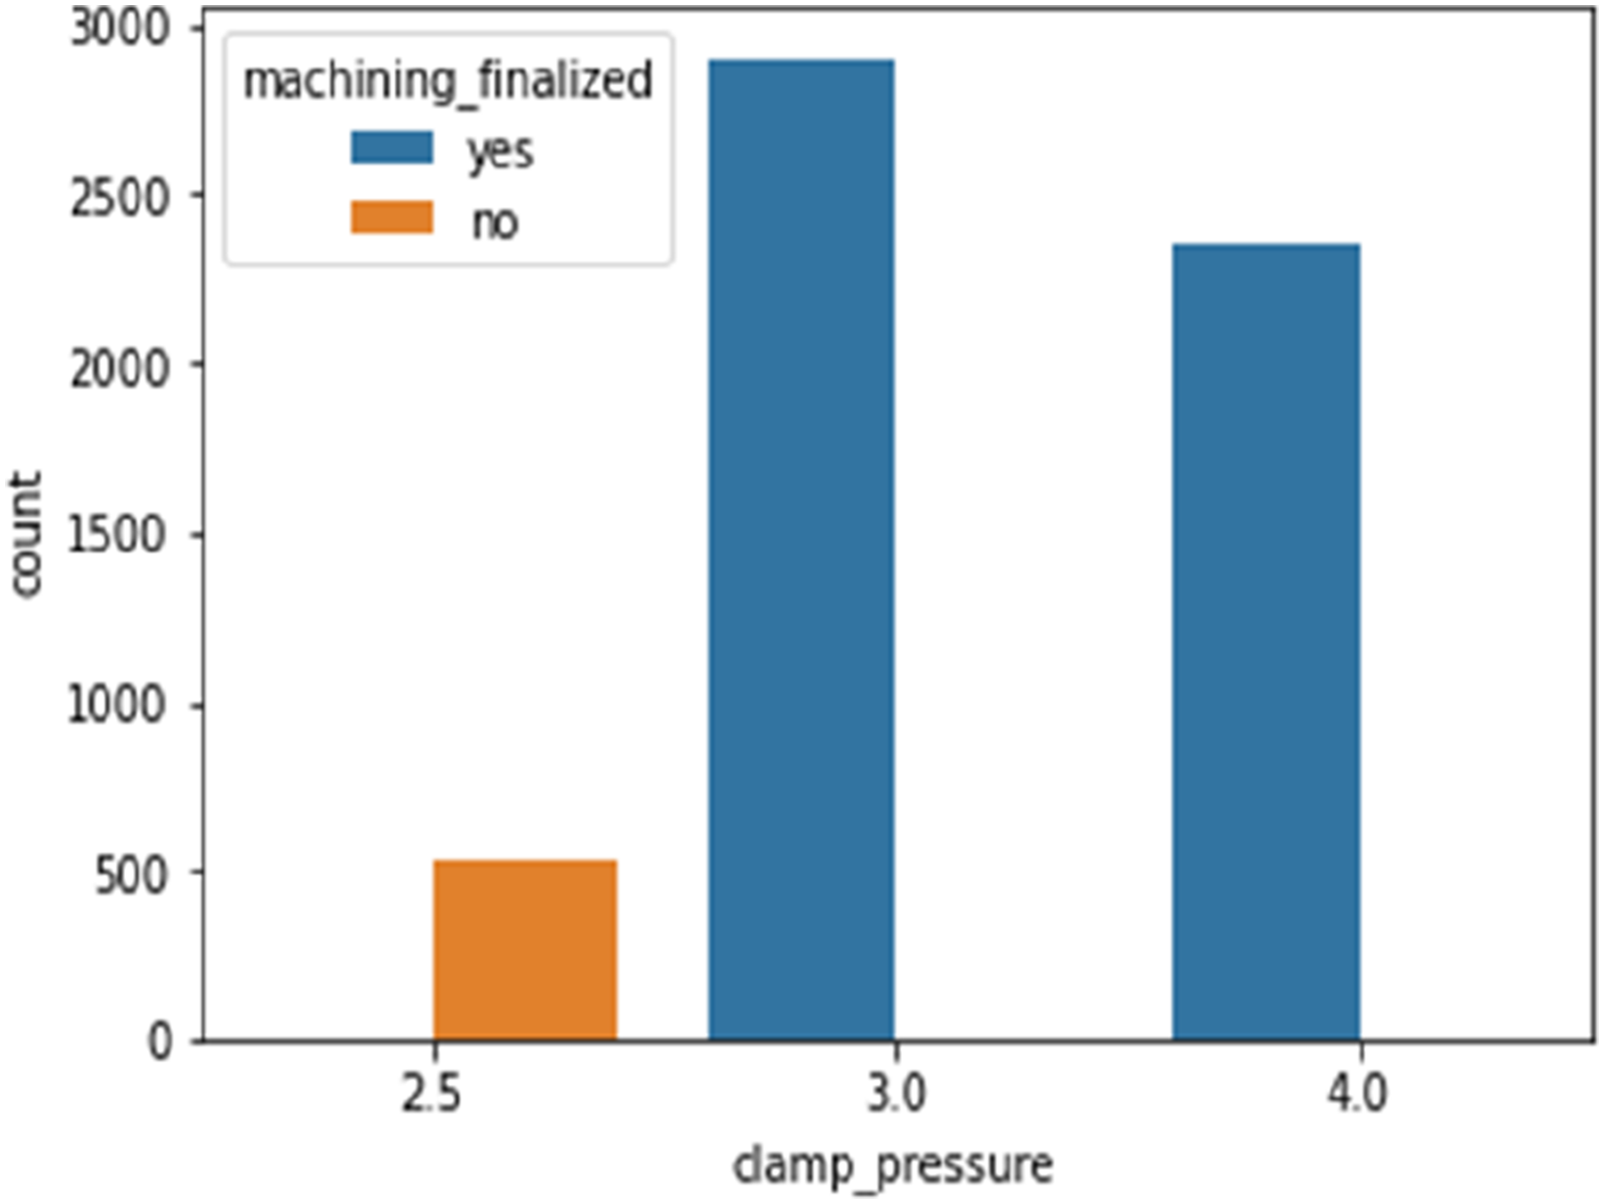
The dataset contains 55 columns representing the various machining parameters recorded by the software during the machining process. However, not all columns are relevant to the analysis. Correlation analysis was conducted to determine the similarity between the machining parameters. The cells with greater than 95% similarity between each other are discovered. Eleven parameters, such as X1 command position and Y1 command velocity, are found to be greater than 95% similar to X1 Actual Position and Y1 Actual Position. Therefore, it is pointless to contemplate these identical parameters in the subsequent analysis. Therefore, 11 columns denoting identical machining parameters are eliminated, leaving 39 columns for analysis.
Decision stage
In this phase, prediction modelling is used to identify the most influential factors affecting the machining completed (Yes/No) and tool condition (worn or unworn). In this analysis, random forest and decision tree algorithms were utilized. The random forest algorithm is renowned for its capacity to manage large datasets and produce precise predictions. It generates a final prediction by integrating the results of multiple decision trees. In contrast, decision tree algorithms are simplified and easier to interpret, making them useful for comprehending the factors contributing to machining completion and tool condition. By employing both algorithms in this analysis, a comprehensive comprehension of the most influential factors on these results can be attained.
Prediction of machining finalized
Here, a finalized (Yes/No) machining analysis is performed. Initially, feature extractions are carried out utilizing decision tree classifiers. In this model, characteristics such as ‘material’ are omitted from analysis because the material is wax, which is identical across all operations. Other irrelevant parameters such as ‘passed visual inspection,’ ‘tool condition,’ ‘exp num,’ and ‘Machining Process’ are eliminated from this analysis. In this analysis, the significance of all parameters (features) influencing the finalization of machining is determined. The feature’s weighting ranges from 38.67% to 0%. The weighting of the tenth-placed parameters was 0.05%. As a result, it is determined that the top ten features have significant weighting, while the remaining parameters have negligible weighting and are therefore excluded from this analysis. Figure 9 depicts the top ten characteristics that affect the finalized machining. Figure 9 illustrates that the input rate has the greatest influence on machining completion (38.67%), followed by clamp pressure (36.15%), S1 actual position (13.12%), and so on. Monitoring feed rate, clamp pressure, S1 actual position, and Z1 actual position will increase the rate of machining finalized. Greater focus by the CNC machine operator on these factors will result in a higher rate of machine completion, thereby reducing operation incompletion and errors. Top features impacting the machining finalized.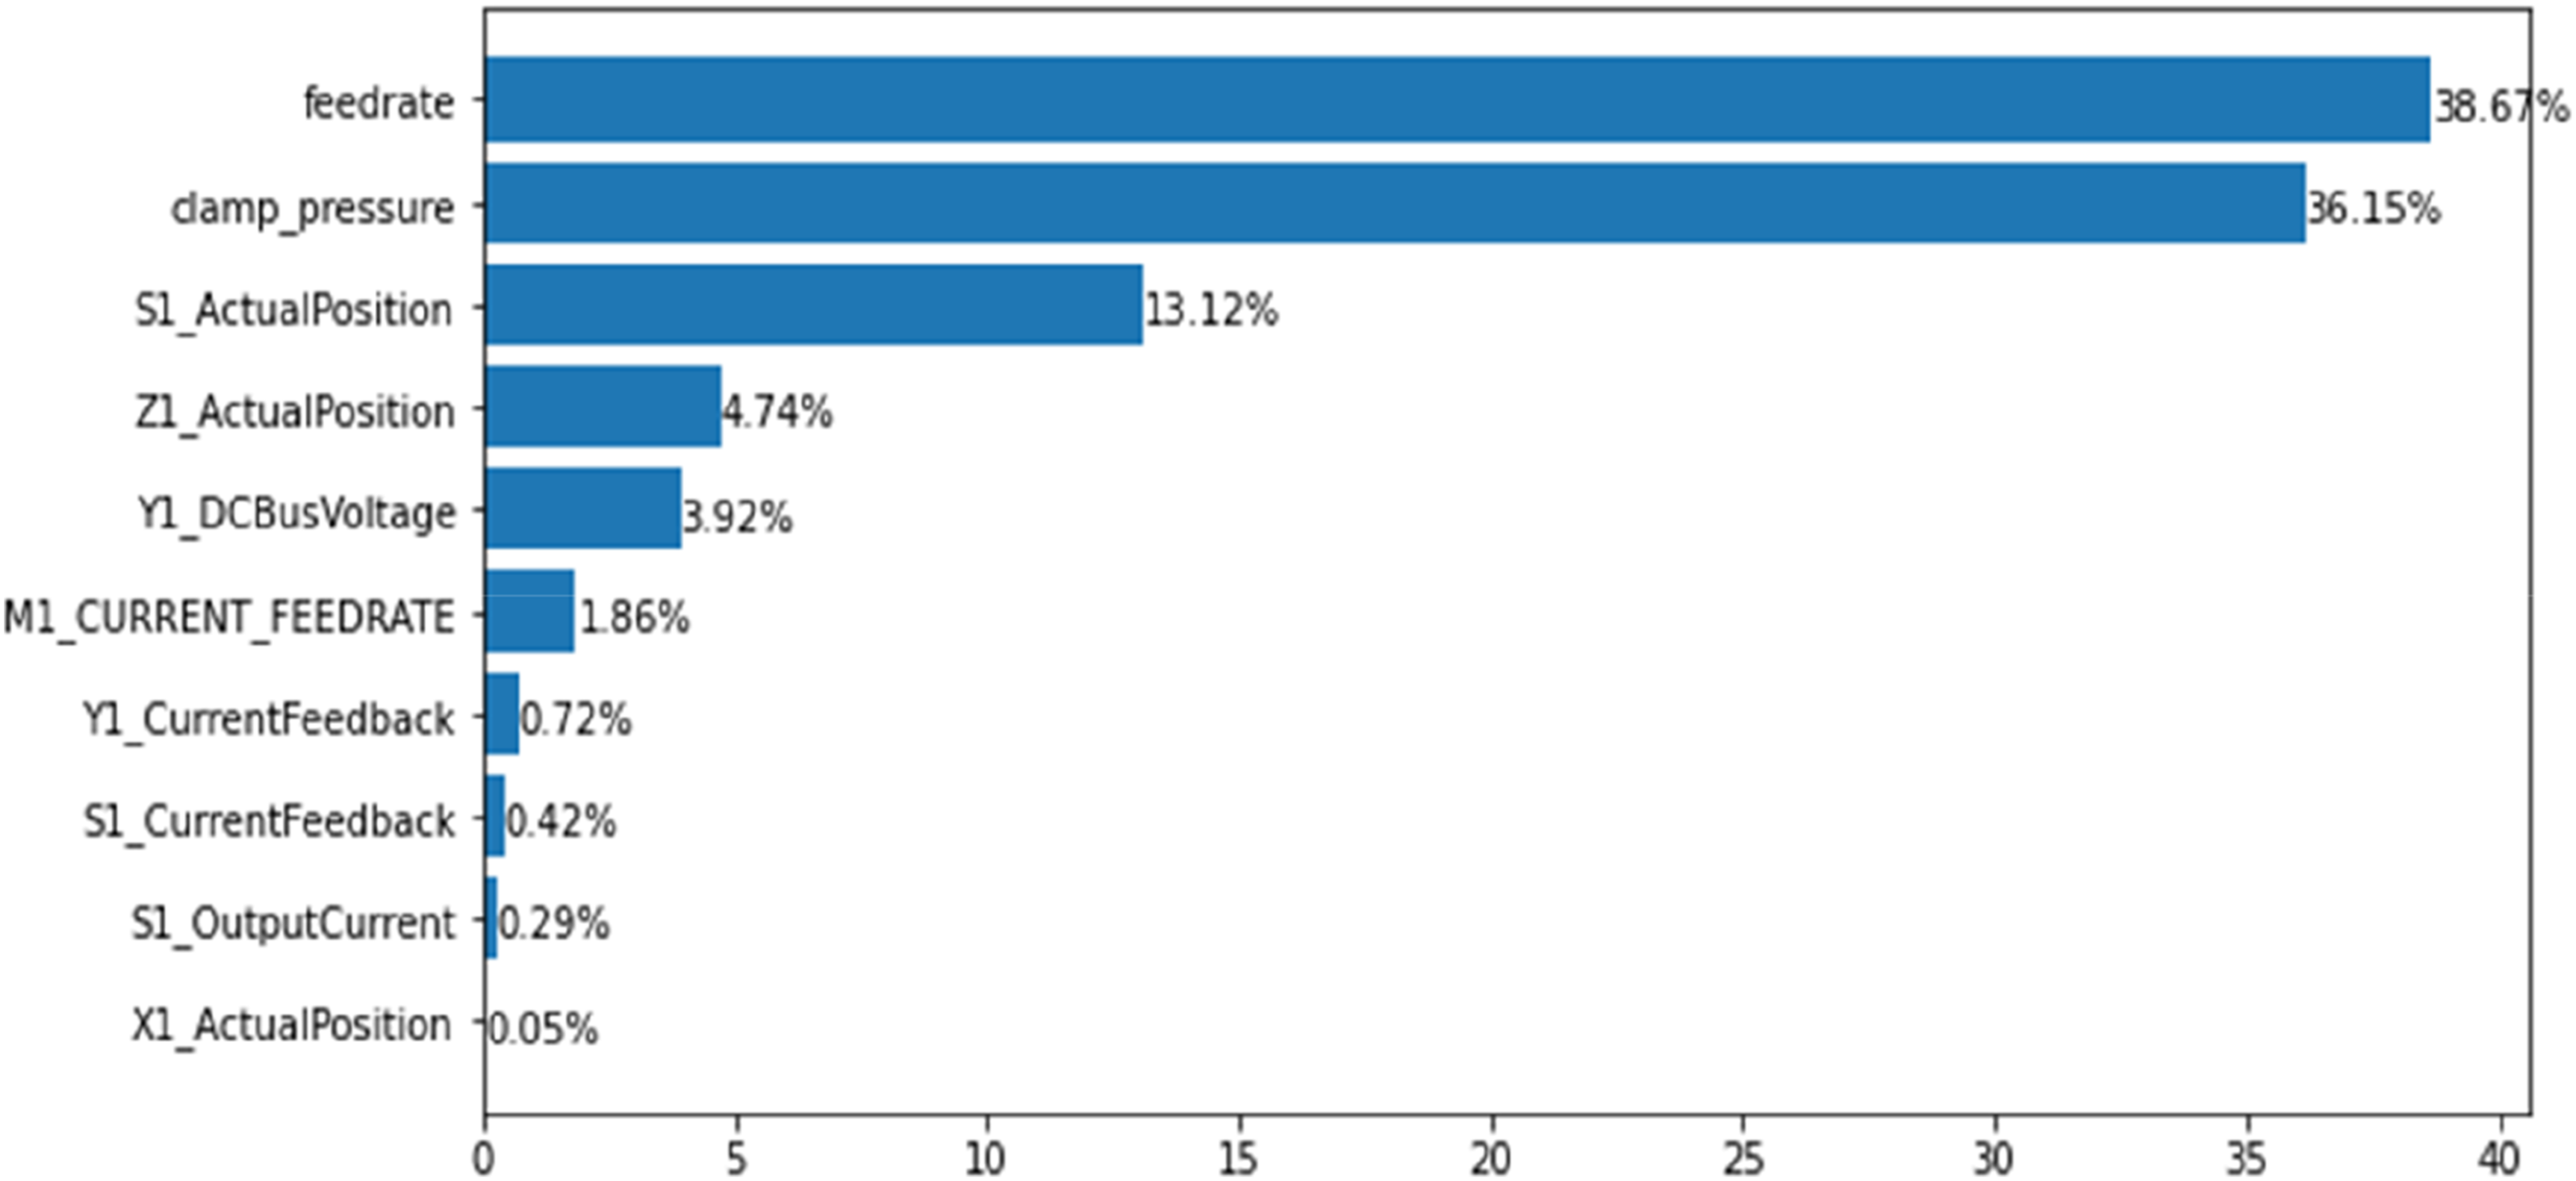
Then, using the random forest algorithm, prediction models are created for the selected features, and the model is applied to a variety of data. The modelling outcomes are depicted in Figure 10. Decision tree models provide a transparent and interpretable method for making predictions, allowing us to comprehend the logic underlying the model’s decisions and classifications. Modelling the prediction of a decision tree requires the development of a hierarchical structure comprised of branches and decision classifications. The root node at the tree’s summit represents the beginning of the decision-making process. From the root node, branches emanate, leading to subsequent nodes that represent various characteristics or characteristics of the dataset. To maximize the model’s predictive accuracy, these branches separate based on certain conditions or thresholds. As we descend the tree, the branches divide until they ultimately terminate in leaf nodes. Each leaf node corresponds to a prediction or decision class, determining the outcome or classification. The decision classifications are based on the majority class within each leaf node, so instances falling within the same leaf node will be designated the same predicted class. Gini impurity is a measure of impurity or disorder in a data set. It is used as a criterion for splitting decision trees to identify the most informative features and generate partitions that result in more accurate predictions. The Gini impurity ranges from 0 to 0.5, where 0 represents a node where all instances belong to the same class, and 0.5 represents a node where all instances belong to a different class (an equal number of instances from both classes). Decision tree prediction modelling for machining finalized.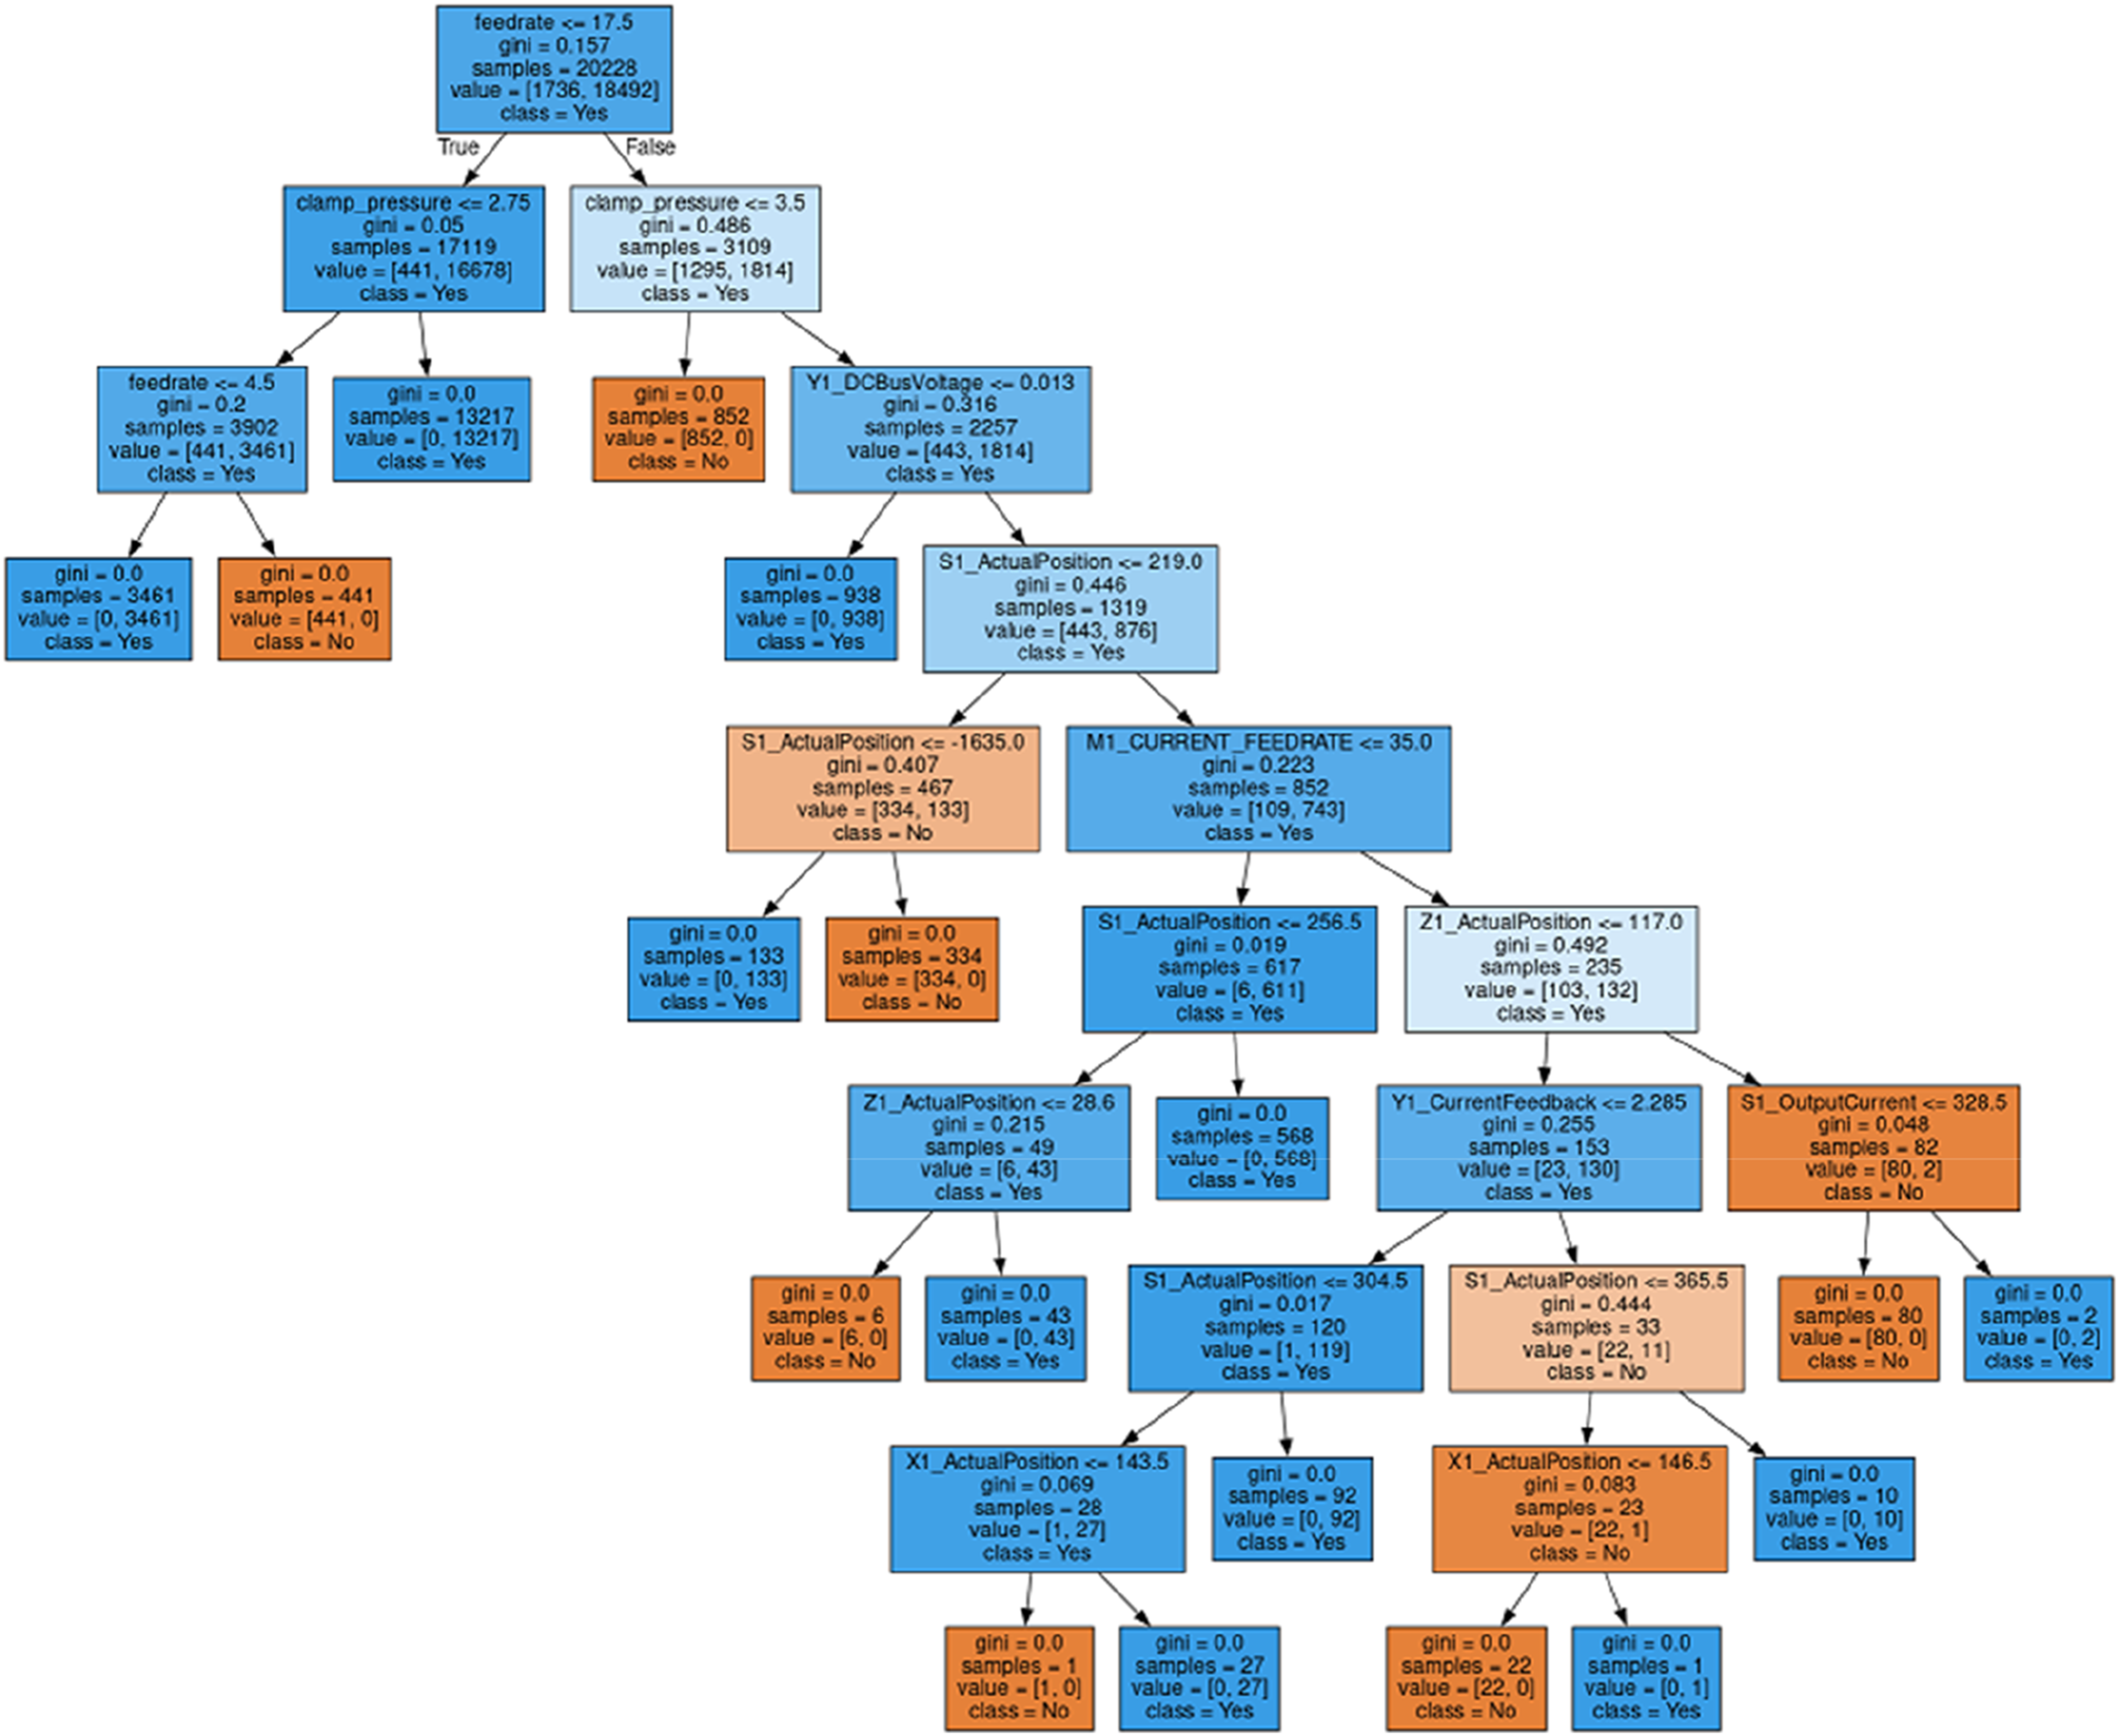
In the decision tree depicted in Figure 10, the feed rate arises as the root node with 20,228 samples satisfying the condition “feed rate =17.5 mm/s.” Each node’s value for Machining Finalized (No) and Machining Finalized (Yes) will be utilized to classify the samples. The value [1736, 18,492] indicates that 1736 samples belong to the target class No, while 18,492 samples belong to the target class Yes. Clamp pressure is the next significant factor in the analysis of machining completion. Consequently, these samples were separated into two groups based on ‘clamp pressure = 2.75 bar’ and ‘clamp pressure = 3.75 bar’. 17,119 samples were placed in the first classification (clamp pressure = 2.75 bar), while 3109 samples were placed in the second classification (clamp pressure = 3.75 bar). This feature’s value [441, 16,678] indicates that 441 samples are of the No class and 16,678 samples are of the affirmative class. Two distinct branches are now generated for the initial classifications (clamp pressure 2.75 bar). The left-hand node has a gini value of 0.0, indicating it is a leaf node. There are unique class values for leaf nodes. When we reach this leaf node from the root node, we apply the conditions ‘feed rate = 17.5 mm/s’ and ‘clamp pressure = 2.75 bar’. In this leaf node, all 13,217 samples satisfy the conditions, so this is the yes class, and machining is complete for all of these samples. For samples meeting the abovementioned criteria, the data class can be determined using a decision tree classifier with only two branches. Visualizing the correct node that applies the condition ‘feed rate = 4.5 mm/s’ to the 441 samples that did not belong to the preceding class. This class contained 3902 samples, of which 441 were machining finalized (No), and 3461 were machining finalized (Yes) and were displayed in the respective leaf nodes with a Gini value of zero. In this manner, the sample dataset is classified and divided into various branches, beginning with the root node and concluding with the leaf node, which represents the particular data class. Figure 10 depicts how other branches of this modelling were obtained similarly.
Figure 11 depicts the confusion matrix indicating the test results for this model. This model has a 99.98% accuracy rate. This matrix demonstrates that 425 machining not finalized datasets were used to test the model, and the model accurately predicted all 425 datasets to be machining not finalized. In the 4632-machining finalized (Yes) dataset testing, 4632 datasets are predicted to be positive, while only one dataset is predicted to be negative. The results of this prediction modelling are very impressive. The result can be used effectively to assess the dataset and predict whether machining will be completed or if an error will occur, preventing machining from being completed. Confusion matrix for machining finalized modelling.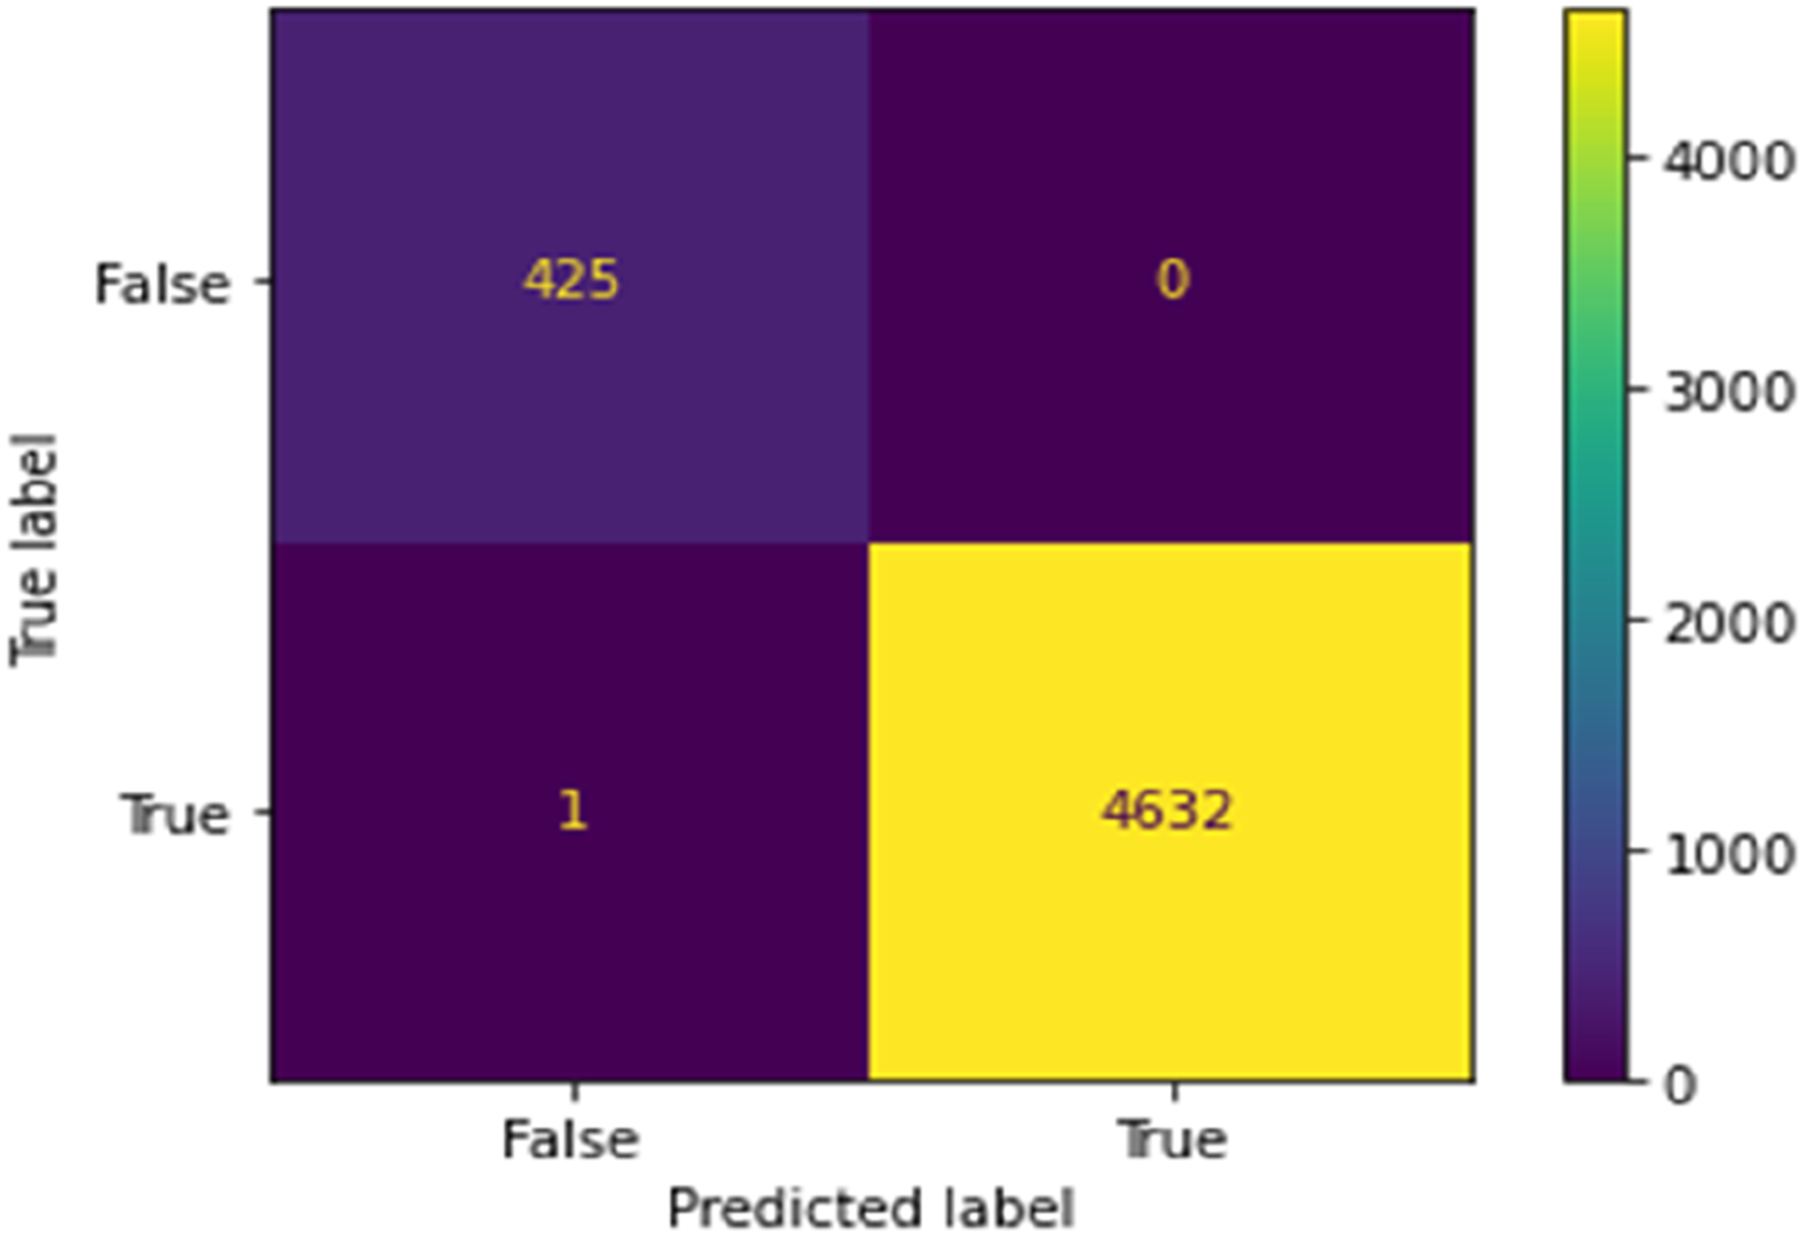
Prediction of the tool condition
Now, this CNC operation dataset was analyzed to model and predict the condition of the tool (worn/unworn). Initially, feature extraction was performed using decision tree modelling. The parameter weights were calculated. These weightings range between 72% and 0%. The 15 most influential features (parameters) on the tool condition are then chosen for modelling. The actual position of Z1, with a weighting of 72.78%, is the most crucial factor affecting the condition of the tool. This is followed by the M1 current feed rate (4,76%), the S1 actual position (4.54%), the S1 output current (4.21%), the Y1 output current (4.04%), the feed rate (1,82%), and so on as shown in Figure 12. This analysis demonstrates that monitoring the actual position of Z1 is crucial for preventing tool wear because this variable significantly impacts tool condition. Then, prediction modelling is performed for these parameters using the random forest method, considering their impact on tool condition. Parameters impacting the tool condition.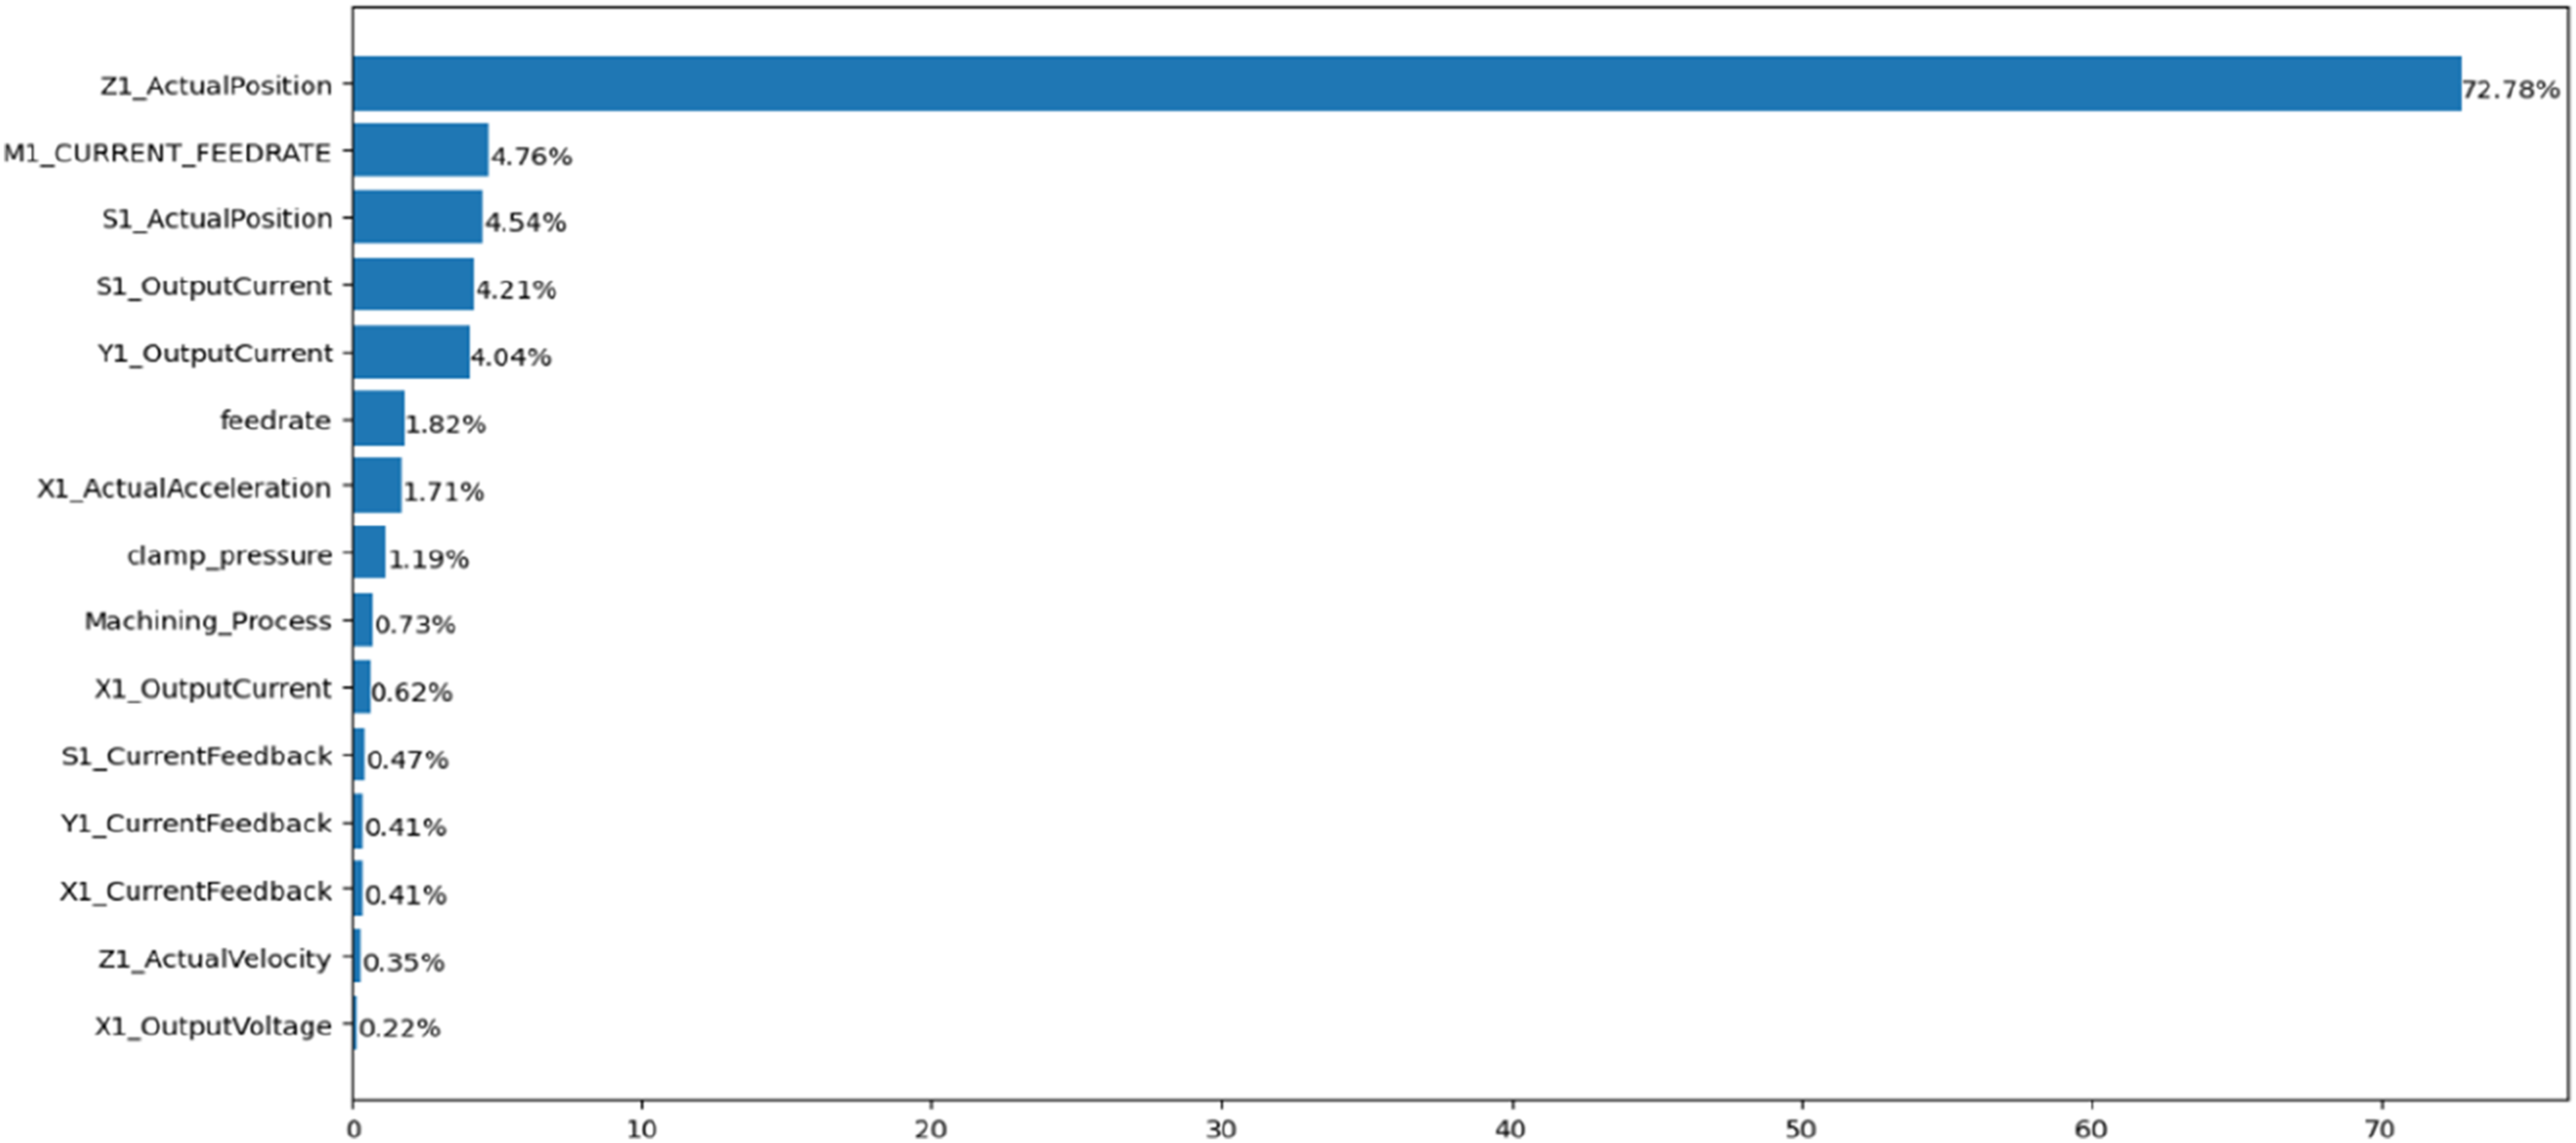
This model categorizes the samples into distinct branches and extends to the leaf nodes, indicating the instrument’s condition (worn or unworn). The methodology of the decision tree classification is the same as that discussed for the finalized machining, so reiterating it here is unnecessary, so the test result is presented now. This model’s confusion matrix is depicted in Figure 13. This model’s accuracy of 99.46% indicates that it can predict tool failure (worn or unworn) with 99.46% precision. This matrix demonstrates that the model is evaluated using the 2558 unworn tool condition datasets, of which 2446 datasets are accurately predicted as unworn. 12 unworn datasets are incorrectly predicted as soiled by this model. During testing with 3000 worn datasets, this model predicted 2585 worn tool conditions and 15 unworn tool conditions. This delay is recorded because our modelling uses the top 15 parameters influencing tool conditions. More than 15 parameters can be considered to increase accuracy, but doing so will complicate modelling without adding much significance. Confusion matrix of the prediction modelling of tool condition.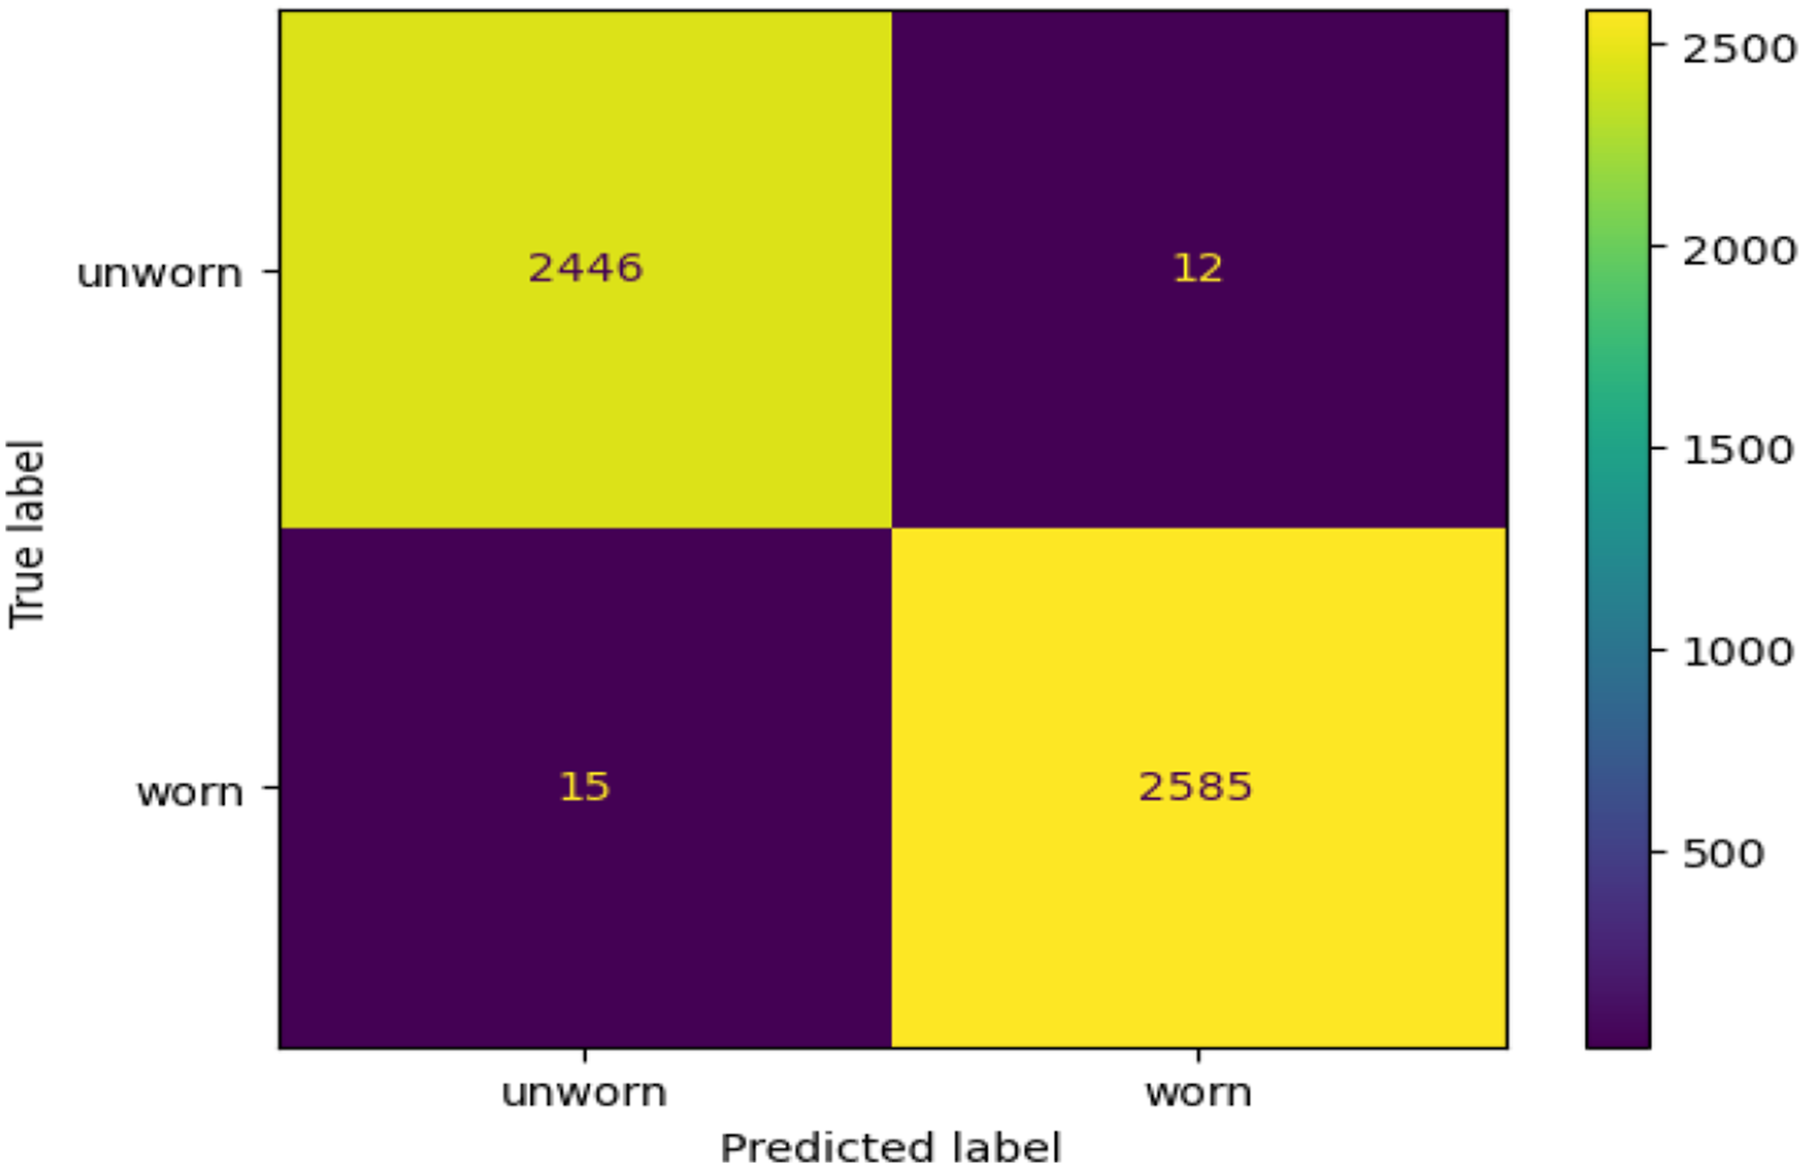
Application stage
Various insights from the data analysis stage can be utilized for intelligent decision making. Machining finalization and tool conditions can be predicted before actual machining, resulting in decreased failures, optimization of process parameters, quality enhancement, waste reduction, and cost savings. In addition, the analysis can be used to identify the critical parameters that influence tool conditions and machining completion. The broad applicability of these analyses demonstrates the critical significance of adopting data-driven decision making in advanced manufacturing systems, which can be effectively implemented using the framework presented in this study. This case study demonstrates that data-driven decision making in advanced manufacturing systems can lead to significant benefits such as failure reduction, optimization of process parameters, quality enhancement, waste reduction, and cost savings.
Results and discussions
Big data analytics is essential for enhancing production efficiency and discovering novel insights to stimulate innovation. Using data-driven decision making, manufacturers can optimize operations, improve supply chain efficiency, and identify factors that affect output by discovering new information and identifying trends. They may also monitor performance to increase productivity. In addition, they can use predictive analytics to anticipate market trends and machine failure. The Internet of Things (IoT) advances manufacturing systems with its network of connected devices and sensors that can monitor, record, and communicate performance in real-time. Although many manufacturers are overwhelmed by the huge volume of incoming data, this information can benefit them since DDDM adoption requires expertise, experience, and knowledge. This study presents a comprehensive framework for implementing DDDM in AMS, which can guide manufacturers and managers.
In this proposed framework, the adoption of DDDM in AMS comprises five stages: manufacturing, data, knowledge, decision, and application. This framework’s bottom layer, manufacturing processes, represents the aspects of manufacturing from design to consumption via production, quality control, inspection, material selection, and supply chain management. As a result of the increased level of automation, all of these processes generate various data sets. The data stage is positioned atop the manufacturing stage through various sensor interfaces. This phase comprises various data-sensing instruments to monitor and inspect the manufacturing process. This phase involves data collection, storage, and visualization in preparation for data processing. In the knowledge stage, processes such as data processing, feature extraction, and knowledge extraction, among others, were implemented to improve manufacturing decision-making. The data processing technique further transformed the data into insightful features and knowledge. Consider the next phase, the decision phase, which is significant in and of itself. This stage depends entirely on the information from the preceding stage, which is then used for data simulation, evaluation, and prediction. As a result of data simulation, evaluation, and prediction, manufacturers can make intelligent decisions regarding product development and enhancement. The final stage, application, represents the intelligent outcomes of DDDM in AMS. A real-world case study analysing CNC machine datasets is presented to validate the proposed framework. The study provides numerous perceptive analyses, such as the most influential parameters on tool condition and machining completion. In addition, modelling is demonstrated to predict the finalized machining and tool condition. The current model can predict the machining completed (Yes/No) with 99.48% accuracy and the tool condition with 99.44% accuracy. This research makes the following significant contributions to the theoretical and applied literature: • The development of a data-driven decision-making adoption framework for manufacturing systems with the potential to improve decision-making by facilitating the user-friendly integration of big data analytics that will increase automation and lead to the implementation of a predictive, proactive, and adaptable manufacturing system. • In addition to providing a theoretical foundation for data-driven decision making in advanced manufacturing systems, this article offers a practical methodology for implementing data-driven decision making. • This study introduces a new manufacturing paradigm that emphasizes precise decision-making and real-time dynamic perception based on data-driven analysis in the manufacturing process. • Use a genuine manufacturing data set to demonstrate the applicability of DDDM in AMS, as demonstrated by a use case based on actual manufacturing data (CNC machine).
Conclusion, limitation and future scope
This study provides a comprehensive framework for utilizing data’s potential and implementing data driven decision making in advanced manufacturing systems. In today’s dynamic manufacturing environment, the research acknowledges the significance of utilizing data to make informed and strategic decisions. By embracing data-driven decision making, firms can obtain a competitive advantage, increase productivity, and adapt to changing customer requirements. In addition to the standard theoretical framework, this research provides a case study in manufacturing data. The case study demonstrates how the proposed framework can be successfully implemented. It illustrates the application of data-driven decision making to predict tool conditions, machining finalization, optimize operations, eradicate inefficiencies, and standardize procedures in manufacturing operations. This study demonstrates that data-driven decision making can completely transform the manufacturing sector’s decision making. Due to space constraints, it was not feasible to comprehensively explain the mathematical techniques underlying the numerous data analytics methodologies in this study. The suggested framework is applied exclusively to production data in the discussed use case. Future research will utilize this framework to enhance the advanced manufacturing industry’s productivity, quality, and capacity utilization.
Supplemental Material
Supplemental Material - A framework for data-driven decision making in advanced manufacturing systems: Development and implementation
Supplemental Material for A framework for data-driven decision making in advanced manufacturing systems: Development and implementation by Vimlesh Kumar Ojha, Sanjeev Goyal, Mahesh Chand and Ajay Kumar in Concurrent Engineering
Footnotes
Declaration of conflicting interests
The author(s) declared no potential conflicts of interest with respect to the research, authorship, and/or publication of this article.
Funding
The author(s) received no financial support for the research, authorship, and/or publication of this article.
Data availability statement
The data that support the findings of this study are available from the corresponding author, upon reasonable request.
Supplemental Material
Supplemental material for this article is available online.
Author biographies
References
Supplementary Material
Please find the following supplemental material available below.
For Open Access articles published under a Creative Commons License, all supplemental material carries the same license as the article it is associated with.
For non-Open Access articles published, all supplemental material carries a non-exclusive license, and permission requests for re-use of supplemental material or any part of supplemental material shall be sent directly to the copyright owner as specified in the copyright notice associated with the article.