
Abstract
Healthcare services provided to patients with similar medical conditions are known to vary. Standardization of healthcare delivery is a relatively new, yet hotly debated approach to address clinical variations. Previous research on process standardization in health service delivery has focused on measuring adherence to established protocols available only for a limited set of medical conditions. We create an alternate construct that quantifies process standardization measured in terms of consistency in services rendered, and apply it in a healthcare context using detailed nonpublic inpatient discharge data from about 35 million inpatient stays at acute care hospitals in California between 2008 and 2016. We examine the impact of such process standardization on the cost, quality, and variation in quality of care delivered at the hospital, operating unit, and medical condition level. We find that process standardization is associated with reductions in cost per discharge, readmission rate and variation in readmission rates at the hospital level. We also find that the impact of process standardization varies across different operating units and medical conditions, providing cost and quality benefit in majority of cases. We further conduct post hoc analysis on the degree of process standardization, finding that higher rates of capacity utilization and complexity of patient disease mix is associated with a lower process standardization, while increasing focus and process adherence is associated with an increase in process standardization.
Keywords
Introduction
Accounting for 19.7% of the United States (US) GDP in 2020 with spending expected to rise at an annual rate of 5.4% through 2028, healthcare is one of the largest industry sectors in the US. Hospital, physician, and clinical service expenditures account for 51% of these healthcare costs (Keehan et al., 2020). Rising expenditures and demand for high quality of care has brought significant focus on healthcare cost and quality from patients, payors, policy makers, and researchers. Operations management principles can further help better understand factors that influence the healthcare industry's cost and quality performance.
In the healthcare domain, providers face a crucial choice of which services to render to patients. In recent years, two seemingly opposing trends have been predominant in healthcare service delivery. On one hand, there is a growing desire for personalized medicine, which tailors treatment to each patient individually; on the other hand, there is a growing consensus on the enhanced safety and effectiveness brought by standardizing healthcare services (Mannion and Exworthy, 2017). Providers must decide between tailoring treatment for each patient or offering a standardized set of procedures for patients with similar healthcare needs. Such standardization strategies are increasingly being explored in healthcare settings. For example, Utah based Intermountain Healthcare has invested in identifying variations in care in order to improve guidelines designed to enhance patient outcomes and cost-effectiveness (James and Savitz, 2011).
Amid this growing interest in standardization, a fundamental question emerges: what constitutes an appropriate metric for quantifying standardization? While traditional approaches emphasize adherence to established clinical guidelines, we propose an alternative perspective—one that focuses on the consistency of services delivered to clinically similar patients. For example, suppose a protocol recommends that patients with a specific disease, D1, receive intervention I1. If hospital A consistently treats all D1 patients with an alternative intervention, I2, its adherence metric would be 0%, as I1 was never administered. Yet, from a process standpoint, hospital A demonstrates complete standardization, as all D1 patients receive the same intervention. Our work embraces this latter perspective, measuring standardization based on the uniformity of care delivered across clinically similar patients. This alternative construct not only captures process standardization from a different perspective, but also enables its assessment even in the absence of universally accepted clinical protocols. There are other recent studies in healthcare operations that attempt to quantify standardization in other settings. For example, Kong et al. (2022) propose a measure of the degree of standardization (DoS) in nursing homes based on deviations from chain-level average nurse staffing ratios. Our work develops a method to calculate consistency in care delivery directly from within-hospital procedural patterns and studies the impact of such process standardization on hospital performance.
Process standardization is not a new concept in operations management, and has been studied in manufacturing systems as a strategy that improves cost and quality performance by adhering to standardized workflows. The primary goal of such strategies is to reduce the variability and increase consistency in production processes (Lee, 1996; Swaminathan and Tayur, 1998). While implementing standard protocols in service systems may be achievable in some settings, other knowledge-intensive settings, such as healthcare, are unique in that there are not always established workflow standards for providers to follow. Theoretically, similar healthcare ailments should lead to similar care delivery, yet researchers have documented variation across hospitals and regions (e.g., Skinner and Fisher, 2010), even for patients with comparable conditions. Atul Gawande's seminal work (Gawande, 2009) further highlights disparities in treatment approaches, underscoring the persistent gap in process standardization.
Practitioners are thus tasked with the decision of how best to render services. Examining standardization via protocol adherence metrics is useful when standards exist, however operations literature currently has no method to measure consistency in service delivery in the absence of standard protocols. Variations in clinical decisions have been shown to impact hospital performance metrics (Dai et al., 2022). In this work, we present a construct to quantify standardization from the perspective of process consistency, and apply it to analyze the effect of process standardization in healthcare service delivery on hospital performance.
One form of standard workflows in healthcare service delivery relates to clinical guidelines developed based on evidence-based medicine (EBM) (Timmermans and Mauck, 2005). Clinical guidelines, as defined by the National Academy of Medicine, are systematically developed statements intended to guide practitioners in making appropriate healthcare decisions for specific clinical scenarios. These guidelines establish standardized workflow for managing specific medical conditions, drawing upon findings from clinical research. One way to measure process standardization in healthcare service delivery is through adherence to the prescribed workflow. Earlier researchers in healthcare have found that such adherence helps improve quality of care (Senot et al., 2016).
However, clinical guidelines are available only for a limited set of medical conditions. Additionally, interventions proven in a study setting may have limited transferability to the entire target subpopulation, and service delivery initiatives presented by administration may face issues with clinician buy-in during implementation (Dai and Tayur, 2022; Timmermans and Mauck, 2005). Thus, examining the impact of workflow standardization in the absence of such guidelines is critical and a current gap in service operations literature. Further, even in settings with standardized protocols, while adherence metrics measure the percentage of occurrences when workflow guidelines were followed exactly, they may not completely capture the degree to which delivery of care was standardized. As illustrated in the example above, process adherence measures may not completely capture the degree of process standardization (or process consistency) in healthcare delivery. A method to measure process standardization through the lens of consistency (variability reduction) in services rendered would enable researchers to study the impact of standardization agnostic of the existence of a standard process.
In this article, we develop a novel construct to measure process standardization in healthcare service delivery based on actual services rendered, leveraging granular data of 35 million inpatient stays in the state of California from 2008 to 2016 across 25 healthcare units and 764 medical conditions. Our research approach enables the investigation of variation in service delivery across any demand population subset, significantly expanding the existing literature in healthcare operations that has primarily focused on adherence metrics limited to a few specific medical conditions with established standard processes. Using this construct, we study the impact of process standardization on the cost and quality performance of hospitals across three levels: firm level, operating unit level, and demand type level.
At the hospital (firm) level, we find that process standardization is associated with decreasing cost per discharge and increasing quality, as measured by decreasing in readmission rates. We also find that process standardization is associated with a decrease in the variation in quality. Next, we explore the degree of standardization found across major diagnostic categories (MDCs), or operating unit level, within a hospital. We find that while the impact of process standardization varies in magnitude and significance across MDCs, we do not observe any negative effects for any MDC in our study. For example, process standardization is highly influential in diseases of the digestive system while its impact on some others, such as diseases and disorders of the male reproductive system, are milder.
We further examine the impact of process standardization at the medical condition level, specifically examining the common diseases acute myocardial infarction (AMI) and pneumonia (PN). Again, results at the granular level are in line with those found at aggregate levels but display variation in the effect standardization has across these disease conditions. We next conduct post hoc analysis to study the influence of operational factors on the degree of process standardization pursued by hospitals. Our study reveals that a higher degree of standardization within hospitals is positively correlated with an increased emphasis on focus, while patient mix complexity and capacity utilization exhibit a negative association with standardization. Furthermore, our findings demonstrate that hospitals with higher rates of adherence to national protocols tend to exhibit higher levels of standardization of care.
Our study makes several important contributions. We are the first to present a novel construct to quantify process standardization through the lens of consistency in services rendered. As a result, our paper adds a new dimension of study to examine the impact of process standardization on performance, which operations literature has traditionally studied as adherence to an accepted protocol limited to environments when one is available. The construct developed in our study is general enough that it can be used in other settings to measure the degree of standardization in service delivery. Utilizing this construct, we examine hospital services rendered and show that standardization benefits hospital performance both in terms of cost and quality. Our results add additional evidence about the benefits of process standardization in terms of cost and quality at various levels within healthcare systems, which have been ambiguous based on previous research that focused on adherence to standardized protocols for specific disease conditions. We also provide insights on the relationship between process standardization and operational factors such as focus, complexity, utilization, and process adherence. While our primary analysis shows performance benefits due to process standardization, we examine potential limitations to the effect such standardization may have. We are the first to empirically show diminishing returns to process standardization in terms of quality.
Our work presents novel managerial insights to healthcare practitioners as well as administrators. When implementing initiatives spearheaded by administration, such as standardization initiatives, obtaining clinician buy in can be a challenge (Jauhar, 2021). Using clinicians’ own actions—services rendered—to create standardization frameworks may assist with buy in from those clinicians. When we shared our results with practitioners, one of them commented, “As a director responsible for strategic operations initiatives and implementations across 316 centers, identifying strategies to improve cost efficiency while benefiting patient outcomes is my top priority. Given its benefits, we have significant investment in identifying avenues where standards of care can be implemented. One avenue we have been considering is examining our vast EHR data, consolidating the number of EHR systems, to leverage care delivered to improve cost and patient outcomes. The research results highlighting the benefits of extending standardization initiatives to the process of care delivery by utilizing our patient data are very interesting, and an area we plan to investigate in our organization” (Lee, 2022).
The rest of the article is organized as follows. We next discuss the literature on process standardization and present our hypotheses. Following that we describe our data and research design. We then present our results. We conclude with a discussion of our findings and limitations.
Relevant Literature and Hypotheses Development
Process standardization is a strategy that utilizes common processes to fulfill similar types of demand. Process standardization has been a topic of interest in manufacturing operations since Frederick Taylor's Scientific Management in 1911, where the author argues for operational and cost efficiency benefits of enforced standardization. More recently, Swaminathan (2001) presents a managerial framework of alternative standardization strategies (including process standardization) for manufacturing firms to meet increased product customization. Many analytical papers have examined the cost and operational efficiency advantages of process standardization methods in manufacturing operations (Lee, 1996; Swaminathan and Tayur, 1998).
In service settings, the involvement of customers in the delivery processes poses additional challenges due to the variations that customers bring. Frei (2006) proposes a framework aimed at diagnosing and managing the variability introduced by customers in service settings, while simultaneously balancing service quality and cost efficiency. The approaches outlined in their framework span a spectrum, ranging from maximizing service offerings that accommodate all variations in customer demand to standardizing service offerings to a subset of predefined services in order to improve cost efficiency.
In the healthcare domain, CMS began annual publications of standard process of care protocols for hospitals to follow in 2002 for a few select medical conditions, starting with AMI, PN, and heart failure (HF). CMS process adherence metrics data have been studied under different contexts including clinical quality (Chandrasekaran et al., 2012), process quality (Andritsos and Tang, 2014), and conformance quality (Senot et al., 2016). These studies have shown process adherence is increased through investments in process management, is associated with a reduction in resource usage, and results in increased cost and quality, respectively. While providing valuable insights on process adherence in healthcare service delivery for a select set of medical conditions where standards exist, the above studies are unable to provide insights on the degree of standardization from a consistency perspective, or the effects of standardization on performance in vast majority of medical conditions which do not have such established protocols. Our research fills that gap. We also add to the literature that empirically examines the impact of process variability on performance in service settings. Frei et al. (1999) conduct a study in a bank setting and find variation in delivery processes to be a more accurate predictor of financial performance than mean process performance. Tsikriktsis and Heineke (2004) discover that the effect of consistent processes on customer satisfaction is more pronounced in firms with higher average performance.
To the best of our knowledge there is no study that focuses on the effects of delivery process standardization in services from an internal process consistency perspective. In this work, we fill that gap by presenting a novel construct to measure consistency of services rendered within an entity using granular service delivery data. Our measure captures clinical variations in healthcare delivery. We investigate process standardization within hospitals, departments, and disease types, and examine its impact on the cost and quality of healthcare delivery for hospitals. By using localized service delivery data in the construct of the metric for process standardization, our work provides a different and more granular view of the degree of standardization in the healthcare service delivery process. One clinician with whom we discussed our work shared, “As a physician, it is my responsibility that my patients receive the best care to remedy their ailments and I often feel as the one closest to the patient I have the insight as to what treatments are most appropriate. These do not always coincide with national guidelines. I applaud the approach of using localized service delivery in the construct of a metric for understanding process standardization and its effect on healthcare delivery” (Moon, 2022).
Process standardization increases the volume associated with certain standardized interventions for a hospital. As a result, there are more opportunities to learn by doing (Tucker et al., 2007). Healthcare literature has shown that hospital costs can reduce with increased volume and economies of scale (Freeman et al., 2021). Additionally, it has been shown that operational efficiencies improve with volume (Ramdas et al., 2018). However, empirical healthcare operations literature examining process adherence has ambiguous findings regarding cost benefits of standard protocols. Andritsos and Tang (2014) find an increase in adherence leads to reduction in resource usage, suggesting reduction in labor cost per patient. On the other hand, Senot et al. (2016) find that conformance to CMS protocols increases the cost of care. Ensuring staff-wide training and compliance to administer common interventions could come at increased cost to hospitals.
Hypothesis 1a: Higher standardization of procedural care is associated with a lower cost of care.
Hypothesis 1b: Higher standardization of procedural care is associated with a higher cost of care.
Previous healthcare research has shown that increased volume of certain procedures improves the quality of outcomes (Birkmeyer et al., 2003). In addition, healthcare operations literature has shown the impact of increasing scale on improved outcome quality through accumulation of experience under different settings, including firm-specific (Huckman and Pisano, 2006), task-specific (KC and Staats, 2012), and disease-specific volume (Kuntz et al., 2019). Since an increase in process standardization typically leads to higher volumes of a smaller subset of interventions, we should expect that the quality of outcome should improve. However, this effect has not been uniformly observed in previous research. Some studies have found that adherence to standardized protocols is beneficial in terms of quality of care (Andritsos and Tang, 2014; Chandrasekaran et al., 2012; Senot et al., 2016), while others find quality and cost may negatively impact subsets of patients (Catena et al., 2020). Panella et al. (2003) study the implementation of another form of standardized protocols—clinical care pathways (CCPs)—and find that implementing CCPs can improve quality in certain areas, this is not necessarily true for all medical conditions. Increasing the level of process standardization implies that similar patients are getting very similar healthcare interventions. While this could potentially lead to better outcomes due to experience and volume effects, standardization of the intervention could potentially prevent a patient from receiving personalized care, which could in turn reduce the quality of outcome.
Hypothesis 2a: Higher standardization of procedural care is associated with lower readmission rate.
Hypothesis 2b: Higher standardization of procedural care is associated with higher readmission rate.
Variation in outcomes could be an additional measure of quality of care. Healthcare operations have highlighted that analyzing population averages may mask disparities in the quality of care received by different patient subgroups (Wang et al., 2019). Indeed, many organizations strive to achieve lower variability in their outcome as part of their lean initiatives. Process standardization is considered an important enabler in such initiatives. In manufacturing firms, which strive to achieve six sigma quality levels (that measures outcome variability), firms often focus their efforts on getting the process of manufacturing clearly defined and try to implement standardization where appropriate. Existing literature in healthcare has not explored this effect. Establishing such benefits can greatly support process standardization initiatives in healthcare delivery.
Hypothesis 3: Higher standardization of procedural care is associated with lower variation in readmission rate.
Data Sources and Variable Definition
Data Sources
We use three data sources to create our final data set—two from the Office of Statewide Health Planning and Development of California (OSHPD) and one from the CMS. Our most granular dataset for this study is the OSHPD nonpublic patient discharge data (PDD), which provides detailed information on inpatient visits to acute care hospitals in California. We elect to use data starting from 2008, the year the CMS introduced the Medicare Severity Diagnosis Related Groups (MS-DRG) patient classification system. The MS-DRG system groups patients with similar diagnoses, gender, age, severity level, and treatment options into over 740 categories, and each inpatient record is assigned to only one MS-DRG. Medicare reimbursement rates are set at the MS-DRG level because patients within the same MS-DRG have similar diagnoses and utilize similar hospital resources. We select data from 2008 to 2016, as this period provides us with the most comprehensive data available from various sources after the implementation of the MS-DRG system. The PDD dataset contains several variables of interest, including clinical procedures performed, principal and other diagnoses, unique facility identifier, admission type, admission and discharge dates, payor information, major diagnostic category, MS-DRG, length of stay, charge, discharge disposition, and patient record locator number (RLN).
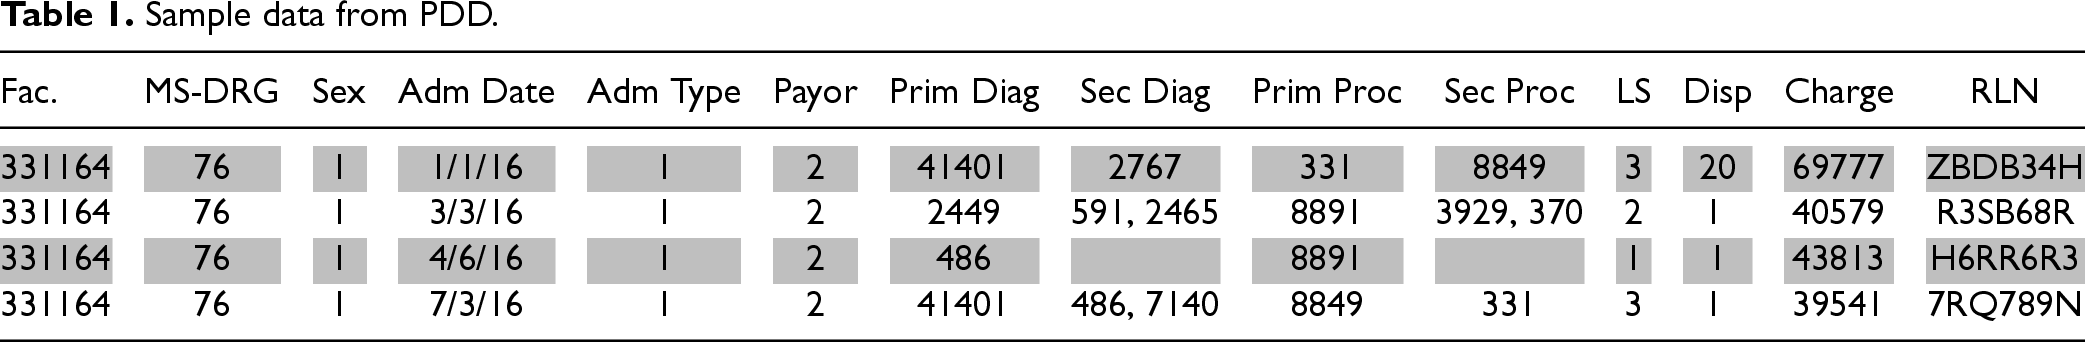
From each inpatient record we observe the patient flow from admission through discharge, including diagnoses and treatments received. To provide a glimpse of the dataset, we present a few sample entries in Table 1. However, it is essential to note that the actual dataset is nonpublic, and the sample data presented in the table is solely for demonstrative purposes.
Sample data from PDD.
Sample data from PDD.
The next dataset utilized in our study comprises the annual financial disclosure reports submitted by each licensed acute care hospital in California to the OSHPD. By merging this dataset with the PDD using a unique facility identifier, we can incorporate valuable hospital-specific control variables including licensed beds, staff, and number of departments. These factors, which may vary on an annual basis, may influence the relationship between standardization and hospital outcomes.
The third data source utilized in our research is the CMS Final Rule Files. These files are published annually by the CMS and contain multiple datasets that provide hospital-specific metrics affecting both cost and quality, which are used in the calculation of reimbursement rates. We use the Inpatient Prospective Payment System (IPPS), Hospital Cost Report Information System (HRICS), and case mix index (CMI) datasets. These datasets include process of care metrics, CMI weighting factors, wage index, operational adjustment factor for disproportionate share of low-income patients (DSHOPG), resident-to-bed ratios, operational cost-to-charge ratios, and process adherence metrics.
Hospitals exhibit variations in treatment among similar patients, often referred to as clinical variation. By utilizing patient-level data, we can identify similar inpatient stays and analyze the procedural care delivered, allowing us to quantify the variations in treatment among groups of comparable patients. Our process standardization metric is explicitly created to measure consistency in procedures adopted among similar patients.
Here is an overview of a healthcare delivery process in our dataset. The initiation of an inpatient stay occurs upon admission to a hospital, which can transpire through four distinct admission types: scheduled, unscheduled emergency, unscheduled direct, and transfers. Scheduled admissions are prearranged and typically involve elective surgeries. Unscheduled emergencies and unscheduled direct admissions differ based on whether the patient is admitted through the emergency department or directly to the hospital, respectively. Transfers denote patients who are moved from one facility to another. Once admitted, diagnostic tests are conducted to ascertain the patient's underlying medical condition. The primary diagnosis, which represents the primary reason for hospitalization, is identified, while secondary diagnoses encompass all other conditions (up to 24) that exist at the time of admission or develop during the hospital stay. Patient diagnoses, in conjunction with patient characteristics and treatment options, determine the classification of the inpatient stay under the MS-DRG system.
The MS-DRG classification system is designed to account for two key factors: (a) the need for an operating room, and (b) the intensity of the required procedure, categorized as major, minor, other, or unrelated surgeries. Additionally, for some diseases the classification system differentiates MS-DRG codes based on patient severity, assigning distinct codes for cases with multiple comorbidities or complications (MCCs), a single comorbidity or complication (CC), or no comorbidities or complications (No CC). For patients who do not require surgery, the classification is based solely on the principal diagnosis (CMS, 2019). Rather than specifying exact procedures, the MS-DRG system groups cases with similar clinical characteristics and expected resource utilization. This approach is designed to ensure that patients within the same MS-DRG share comparable treatment complexity and severity, even when the specific procedures clinicians render may differ. By stratifying patients based on resource intensity and complications/comorbidities, the MS-DRG system helps control for case severity facilitating more accurate comparisons of care patterns across hospitals.
Next, the hospital staff delivers healthcare services to the patient, and these services are documented as procedures. The primary procedure is the one most closely associated with the primary diagnosis. While a hospital may not have control over admission type or diagnoses, they may have discretion in determining which procedures to administer. As previously mentioned, it is often the case that a medical condition may not have a universally established protocol. Therefore, examining the procedural care provided to patients offers valuable insights into the variability in the service delivery processes employed by hospitals. Finally, the inpatient process concludes with discharge, resulting in the patient being released following treatment or, in unfortunate cases, the patient's passing while still in the hospital.
Process standardization refers to the consistent application of steps required to deliver a service or product to a customer. In the healthcare context, the final deliverable is a hospital discharge, which results from a process that includes admission, patient condition assessment, service delivery, and discharge. Importantly, healthcare providers are primarily involved during the service delivery component of this process. As such, our measure focuses on assessing consistency in healthcare intervention, which we define as process standardization.
The first step in quantifying consistency in healthcare delivery is identifying groups of patients whose medical needs could be addressed with a similar intervention. We create similar patient groups by leveraging data available to us in the PDD to group together patients admitted for the same MS-DRG, to the same hospital, in the same year that have the same payor, gender, admission type, and are diagnosed with the same comorbidity conditions. Further, to identify each patient's comorbidities, we employ the method outlined by Deyo et al. (1992) which adapts the Charlson Comorbidity Index (CCI) for use with administrative codes within patient records. The CCI, originally developed by Charlson et al. (1987), is a widely recognized tool in healthcare research used to control for patient comorbidities. Deyo et al. (1992) maps ICD-9-CM (International Classification of Diseases, Ninth Revision, Clinical Modification) diagnostic codes to 17 prevalent comorbidity conditions found in the CCI. Using this approach, we identify the specific comorbidities present for each patient as documented under other diagnoses in our patient dataset. Subsequently, we group patients based on the subset of comorbidities they share, ensuring that only patients with the same set of documented conditions are grouped together.
We limit our analysis to scheduled admissions, unscheduled emergencies, and unscheduled direct admissions. We exclude transfer patients and readmissions because the literature shows their treatment and subsequent performance metrics are influenced by unique factors not present in other patients (Lu and Lu, 2018). Any patient groups that include just one observation are removed, as there is no measurable variation in care provided. Since some of the above factors such as payor, gender or admission type may not be relevant for similarity in every case, in section 5.4 we vary how patient groups are classified. First, we alter patient groupings by relaxing similarity factors such as payor, gender or admission type, one at a time to check the robustness of our findings. Further, we also classify patients only according to their primary diagnosis (instead of MS-DRG) and all our results continue to hold.
Once we have grouped similar patients that could potentially receive the same procedural care, we next need to quantify the degree of standardization of services rendered to these patient groups. While the PDD identifies the primary procedure administered to a patient, it is important to consider that the recording of procedures may be influenced by environmental factors, potentially leading to variations in the identification of the primary procedure by administrators. To address this potential issue, we create a subset of procedures that includes the primary procedure and the first secondary procedure, without specifying which one is identified as the primary. We make use of the first secondary procedure due to the limited availability of inpatient data files that contain multiple secondary procedures. By focusing on this subset of procedures, we aim to mitigate any bias or inconsistencies in the identification of the primary procedure, allowing us to assess the degree of standardization more accurately in the services rendered to the patient groups. To check the robustness of our results, in section 5.4, we present the results with primary procedure and with primary, secondary, and tertiary procedures taken into consideration.
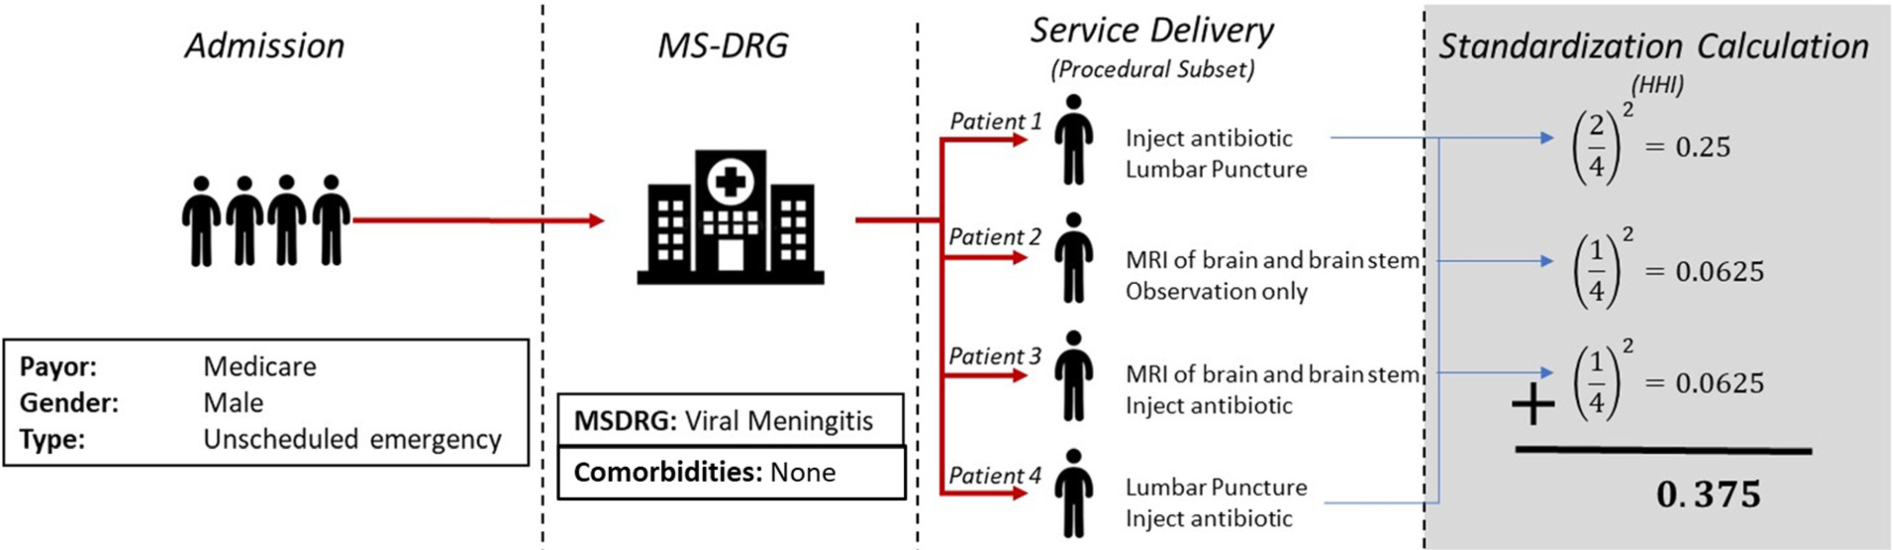
Figure 1 provides a visual representation of our methodology for calculating the standardization metric. Let us consider a scenario where four similar patients are admitted to the same hospital in the same year and are classified under MS-DRG 76, which corresponds to viral meningitis. Among these patients, Patient 1 and Patient 4 receive the same subset of procedures—inject antibiotic and lumbar puncture—although recorded in a different order. Our approach of creating a subset of procedures—rather than how they are ordered in the PDD—would classify these patients as receiving the same set of services. Once we have established groups of similar patients and their treatments, we create an Herfindahl–Hirschman Index (HHI) to measure consistency of procedures administered within each patient grouping. HHI is a commonly used metric in economics to represent the degree of market concentration and in operations management research to quantify task experience (Narayanan et al. 2009). The resulting HHI is a metric that quantifies the degree of standardization of procedural care received for each patient grouping.
Standardization calculation.
The data presented in Table 1 corresponds to the patient observations illustrated in Figure 1. These patients share common characteristics, including Medicare coverage, male gender, and admission via unscheduled emergency to the same facility for the same MS-DRG category and have no documented comorbidities. Hospital staff then elects how to treat each patient. In this example, there is no universally accepted treatment for patients with viral meningitis. While antibiotics cannot fight viral infections such as meningitis, they can treat bacterial infections and may be administered under clinician discretion. Thus, the decision on how to treat such patients is left to hospital staff. In the example, two of these patients received the same subset of procedural care, while the others were provided a different set of procedures. Our HHI calculation for this patient group would subsequently be
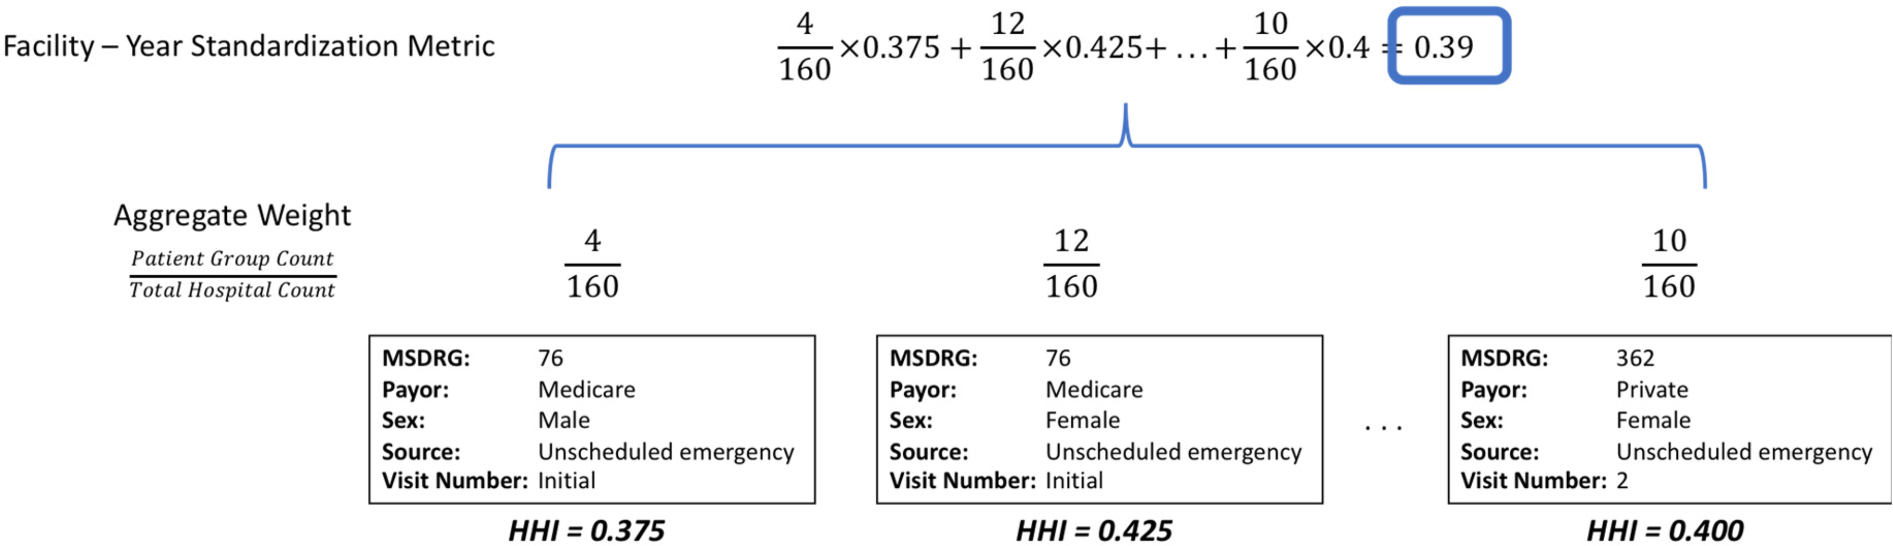
Once we have calculated the HHI for each patient group, we create a weighted aggregate metric for standardization at the hospital-year level. This aggregation is shown in Figure 2. Our aggregate weighting factor is the number of patients within a patient group over all patients admitted to the hospital included in our process standardization metric construct. This weighting factor is the relative frequency of a patient group.
Standardization aggregation.
Formally, we calculate the process standardization metric as:
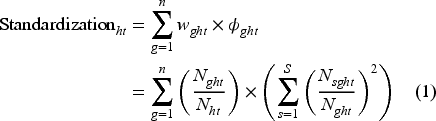
Figure 3 depicts process standardization distribution across all observations and Figure 4 depicts hospital year-over-year percentage change in their process standardization metric. Together, these figures show standardization varies both across and within hospitals.
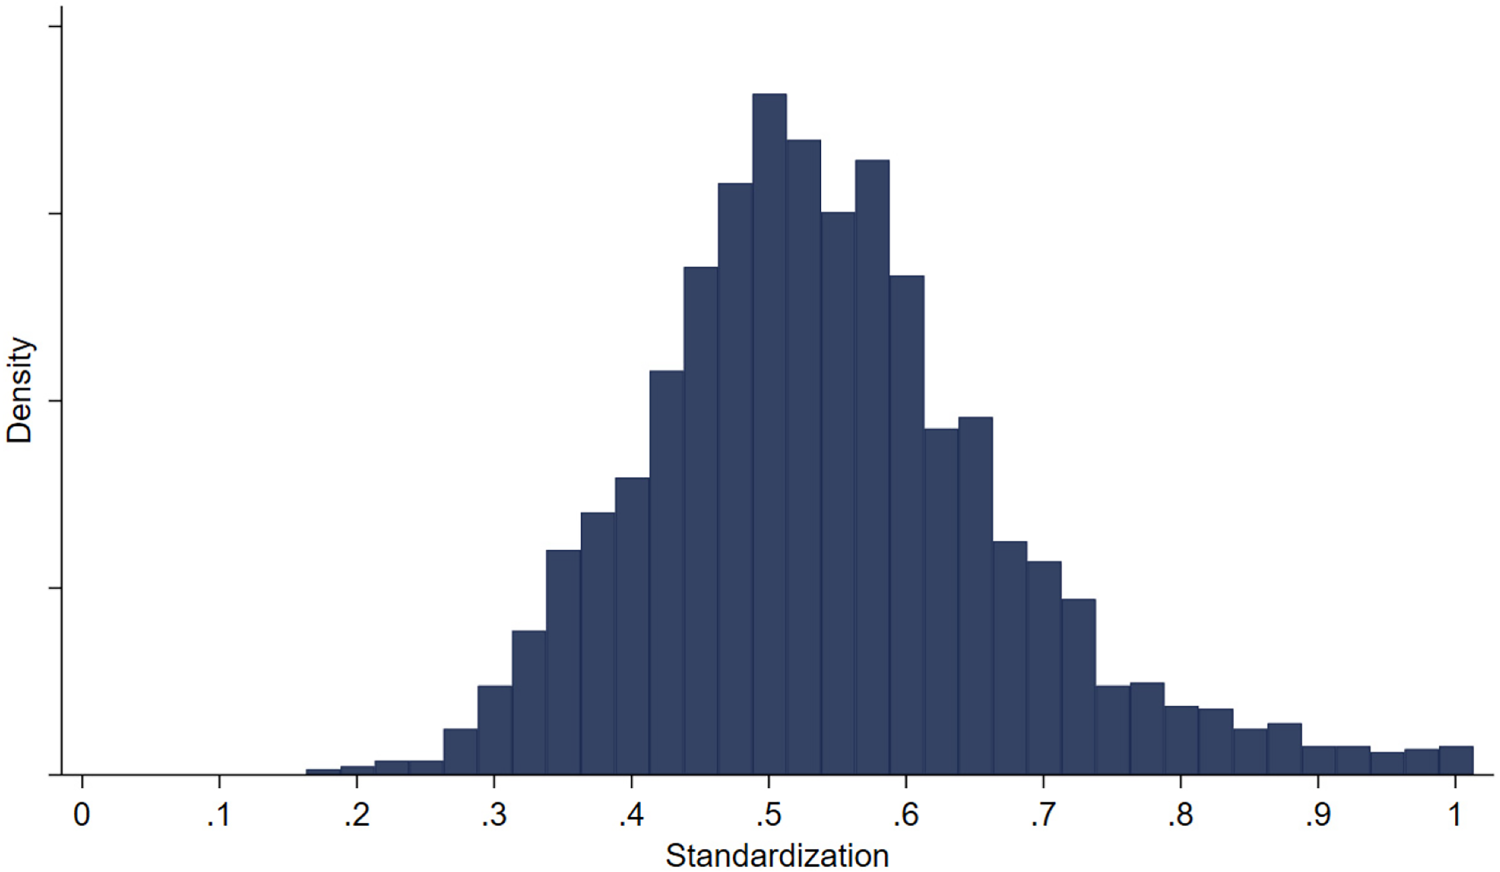
Distribution of standardization metric.
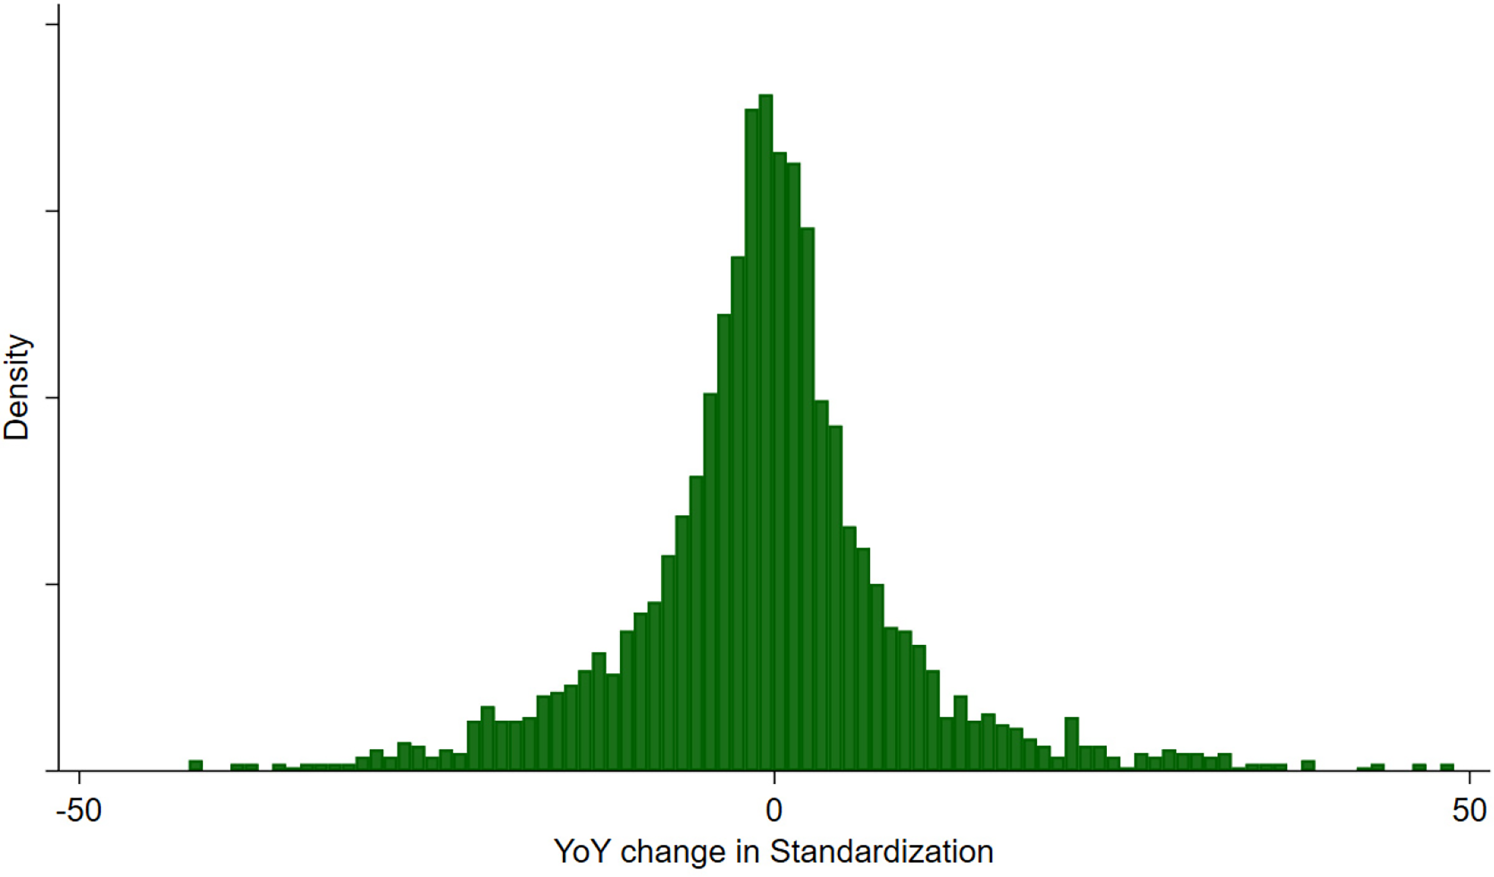
Distribution of YoY change in standardization metric.
Furthermore, Figure 5 plots the distribution of the process standardization metric for the patient subgroup identified in Figure 1, focusing on a specific year, 2012. This graph highlights the substantial heterogeneity in process standardization across hospitals, even within the same patient group. This addition further illustrates the variability in standardization at a more granular level.
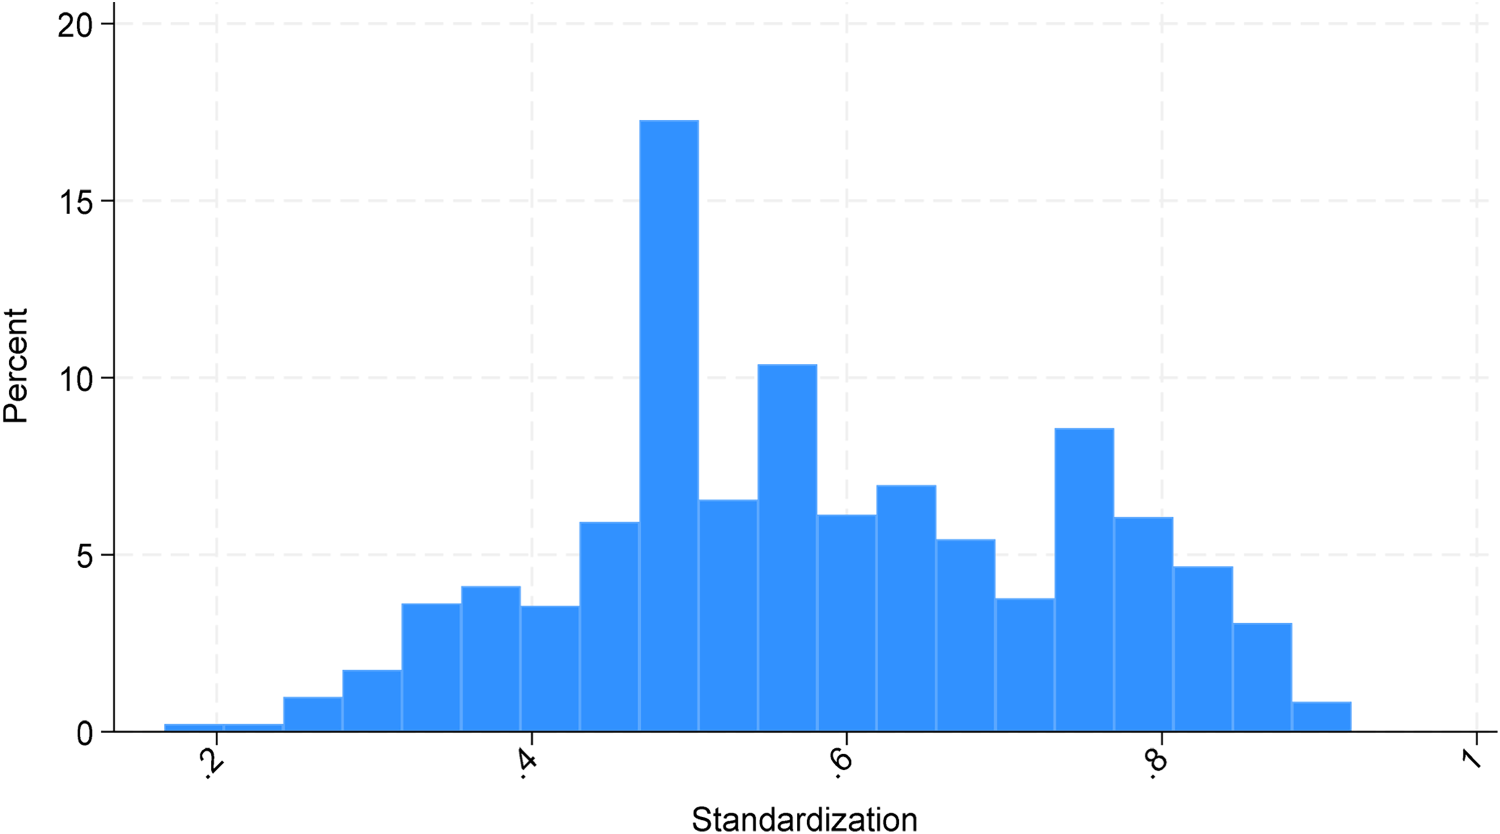
Distribution of standardization metric for patient group identified in Figure 1 for 2012.
A key advantage of our approach is that it explicitly quantifies consistency in healthcare delivery while accounting for patient similarity through multiple layers of stratification. While treatment variation may arise due to differences in case severity, our methodology ensures that observed variation is not simply a reflection of underlying differences in patient complexity. By leveraging MS-DRG classifications, we control for broad severity differences at the diagnosis level, and our inclusion of additional patient-level factors—such as payor type, gender, admission type, and shared comorbidities—further refines the identification of clinically similar patient groups. The resulting HHI-based standardization metric captures the degree to which hospitals apply consistent procedural treatments to comparable patients, rather than reflecting arbitrary differences in treatment patterns driven by unobserved severity. While unobserved severity cannot be entirely ruled out, the metric leverages a rich set of patient characteristics that, along with other covariates, likely capture much of the relevant clinical variation. By weighting the HHI at the hospital-year level, we further ensure that the metric reflects systematic hospital-wide trends in process standardization rather than isolated anomalies within small patient subgroups. Through these methodological refinements, we provide a rigorous measure of process standardization that moves beyond adherence-based definitions and captures meaningful variation in service consistency.
Readmission Rate
According to the CMS, a readmission refers to an unscheduled inpatient admission to any hospital within 30 days after discharge from a prior inpatient stay. The readmission rate represents the percentage of inpatient stays that lead to readmissions. In the PDD dataset, patient-specific record locator numbers (RLN) are available, facilitating the tracking of patients across multiple hospitals over time. For each inpatient stay, we create a binary quality outcome metric: 1 indicates a readmission within 30 days of discharge, while 0 indicates no readmission. The readmission rate is calculated as the proportion of inpatient visits resulting in readmissions for each hospital in each year. To measure the variability in readmission rates, we calculate the mean squared difference between the daily readmission rates and the annual mean readmission rate, which is analogous to the concept of mean squared error commonly used in statistical process control. We winsorize at the 1% level when calculating our variation in readmission to remove any bias caused by extreme daily outliers.
Cost Per Discharge
The data includes the total charge per inpatient stay according to each hospital's charge master. We utilize the inpatient operating cost-to-charge ratio (CCR) found in CMS IPPS to convert the charges recorded for each inpatient discharge record in the patient discharge database (PDD) to the allowable Medicare cost incurred by the hospital for that inpatient stay. This conversion is a common practice employed in healthcare research to utilize charge data (Senot et al., 2016). The charge amount captured in the PDD dataset is derived from the hospital's chargemaster, which represents a comprehensive list of charges for all products and services available to patients during a hospital visit. It is important to note that these charges can be considered as “list prices” since they are determined before any negotiations with insurance providers and do not necessarily reflect the actual amounts paid by payors (insurers). We then control for inflation rates published by the Federal Reserve Bank (2023). Explicitly, we calculate cost per discharge by

Studies in operations literature investigating the effects of process standardization initiatives (measured in terms of adherence) on hospital outcomes have identified several confounding factors, including beds (capacity), teaching intensity (resident-to-bed ratio), CMI, wage index, and disproportionate share of uninsured and Medicaid patients (Andritsos and Tang, 2014; Chandrasekaran et al., 2012; Senot et al., 2016). Accordingly, we include these control variables in our analysis. The CMI serves as a measure reflecting the clinical complexity and resource needs of inpatient stays provided by a hospital (OSHPD, 2021). The CMS assigns a specific weighting factor to each MS-DRG that adjusts reimbursement rates according to medical condition, accounting for variations in complexity and resource requirements. By leveraging the weighting factors alongside the inpatient dataset, we are able to calculate the mean weighting factor (CMI) across all inpatient visits included within our analysis.
Studies from service operations literature suggest that demand arrival uncertainty and staffing decisions could impact firm outcomes (Frei, 2006; Lu and Lu, 2017). To capture demand arrival uncertainty, we use the percentage of patients arriving without an appointment as a proxy, as scheduled appointments represent expected arrivals, and a higher rate of unscheduled patients signifies increased variation from the expected. Staffing is quantified as the ratio of hospital staff to patients treated. Further, we also include measures that count the number of different departments that have dedicated clinicians as a metric to control for hospital scope in addition to controlling for total patient volume. Additionally, our empirical models incorporate year and hospital fixed effects to account for time and hospital-specific factors.
Furthermore, literature shows hospital focus (Clark and Huckman, 2012; KC and Terwiesch, 2011) and capacity utilization (Kim et al., 2020) may impact healthcare service delivery performance. We include focus and utilization as additional control variables, computing hospital focus by creating an HHI using MS-DRGs from inpatient records annually. The resulting index measures the concentration of MS-DRGs a hospital serviced; higher concentration results in higher focus on select medical conditions. We calculate capacity utilization as the mean daily percentage of licensed beds in use.
Collectively, these control variables address a comprehensive range of factors identified in the literature as influencing healthcare delivery, ensuring we account for all observable patient-level variation available in our dataset. While unmeasured factors can never be entirely ruled out, the inclusion of these controls significantly reduces the risk of omitted variable bias, reinforcing the validity of our findings on process standardization.
Final Sample
While we cannot share our data due to the nonpublic nature of it, we detail steps taken from the original data sets to our final data set. The intention of this is to enable recreation of this study either with the same or similar data sources. The PPD data file begins with all 35,075,141 inpatient records from 2008 to 2016 across 25 major diagnostic categories (MDCs). We first count the total number of inpatient stays which will be used to calculate staff-to-patient ratios. Next, we remove all transfer admissions and inpatient stays CMS classifies as extraordinary (greater than 90 days), which is less than 1% of our data. We then compute readmission rates and variation in readmission rates for each hospital-year, and subsequently exclude all readmitted inpatient stays from the remainder of our variable construction.
Next, we calculate the patient volume, percentage of unscheduled patients, hospital focus, and cost per discharge. Using the MS-DRG weighting factors found in the IPPS, we calculate the CMI across all patients seen by a hospital.
We calculate our process standardization metric using the process defined in section 3.2, removing all patient groupings with only a single patient. We merge the variables discussed thus far with the OSPHD Hospital Financial Reports, which include licensed bed counts, staffing data, and departmental data. We finally merge the data with data sets included CMS Final Rule Files that provide teaching intensity, wage index, and an adjustment factor that accounts for operational costs associated with a hospital having a disproportionate share of uninsured and Medicaid patients (DSHOPG). The final sample only includes hospitals that can be mapped across all data sets. Our final sample consists of 287 hospitals across 9 years resulting in 2468 observations in total. Table 2 displays summary statistics of our final data set.
Summary statistics.
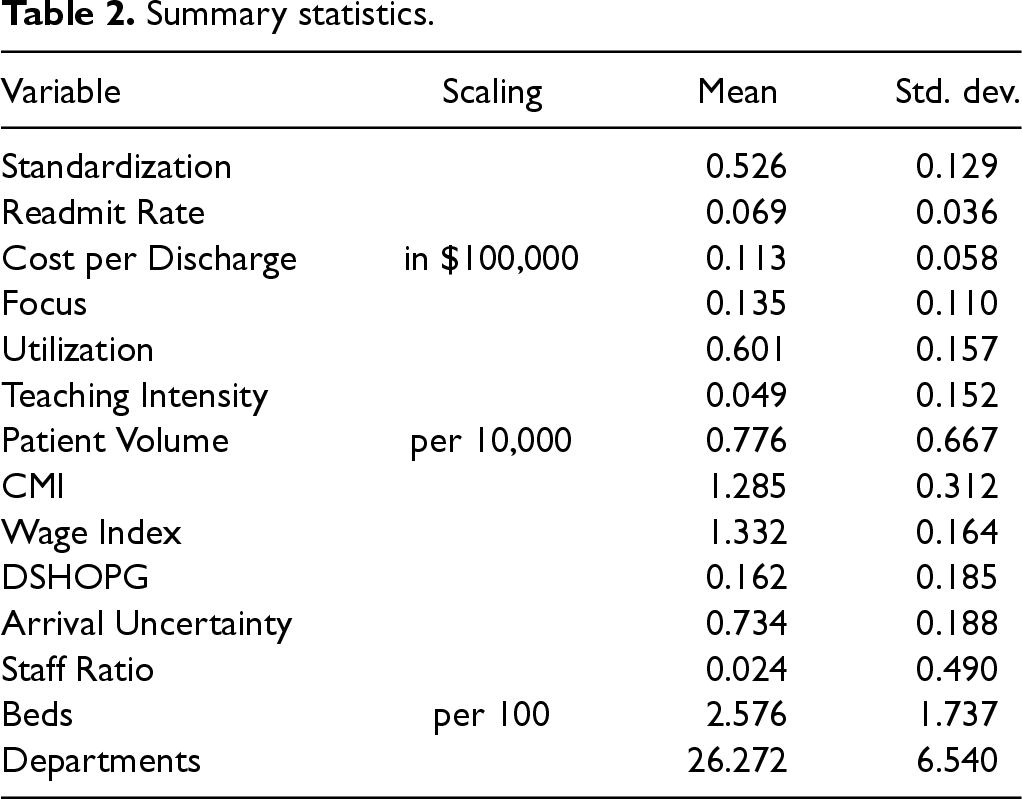
Summary statistics.
Healthcare providers are tasked with delivering high quality care in a cost-efficient manner. As a result, decisions made regarding healthcare service delivery may be influenced by past cost and quality performance metrics. Additionally, both cost and quality may exhibit serial correlation, motivating the inclusion of lagged dependent variables as confounding factors in our analysis. From a cost perspective, some components of cost, such as labor and equipment, are unlikely to be refreshed each year, thus lagged cost may have explanatory value of current cost. Similarly, quality of care delivered could be dependent on the quality of labor and equipment, thus previous quality levels may have explanatory value of current quality levels. Further, degree of standardization could be dependent on previous performance levels at a hospital potentially leading to endogeneity. For example, high performing hospitals (in cost and quality) may have additional resources to increase the degree of standardization. We use a dynamic panel data (DPD) model that includes lagged dependent variables to address these conditions.
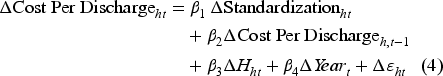
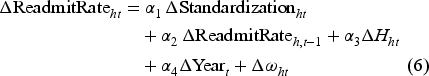
In the existing literature, hospital fixed effects are commonly employed to account for unobserved heterogeneity among hospitals. DPDs modeled using one-way fixed individual effects can produce biased and inconsistent estimates (Nickell, 1981). A common approach used to address potential endogeneity presented by using one-way fixed individual effects in DPDs is the Arellano–Bond generalized method of moments (GMM) system of equations estimation approach (Arellano and Bond, 1991). The approach specifies a GMM system of equations model estimated simultaneously where one equation is a level regression equation and the other is the first difference of the regression equation. By construct, the individual fixed effect is removed in the differencing equation. The Arellano–Bond estimation uses past level variables as instruments for their respective first differences equations and uses past differences as instruments for their respective level equations. Existing literature in operations has used the Arellano–Bond estimation in a similar manner (Senot et al., 2016). In our case, both equations include the variable of interest (process standardization) as well as control variables (as described in section 3.4) and year fixed effects. Along with the lagged dependent variable, which is endogenous by construct in DPDs, we treat standardization as endogenous. In our analysis, standardization measures the consistency of healthcare services rendered. Services provided are not done exogenously of patient outcome; rather we assume hospitals render services to address patient medical condition needs and thus improving quality (reducing readmission rates) is a potential factor when determining standardization levels. Additionally, inpatient stay costs (costs per discharge) may influence which services are offered as some services are more costly than others. We model our control variables (teaching intensity, CMI, wage index, DSHOPG, patients, and beds) like existing literature in healthcare operations (Andritsos and Tang, 2014; Chandrasekaran et al., 2012; Senot et al., 2016) and in addition, we add variables around arrival uncertainty, staff ratio, departments, total patient volume, hospital focus, and capacity utilization along with hospital and year fixed effects.
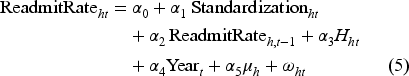
Specifically, the system of equations of our main model is specified as
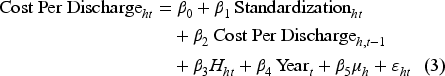
Effect of process standardization on cost and readmission rate.
Robust Standard Errors in parentheses.
Panel data over 9 years with time fixed effects.
*p < 0.10, **p < 0.05, ***p < 0.01.
When modeling variation in quality (i.e., variability in terms of readmission rate across the year), we suspect that the lagged variable of variability may not have any significant effect. We tested this and statistically fail to reject the null hypotheses of no serial correlation (p > 0.10). These results are presented in Table 15 in the E-companion. Therefore, we specify our model for variation in quality using a fixed effects model with similar explanatory variables. Specifically, our model is

Hospital Level Analysis
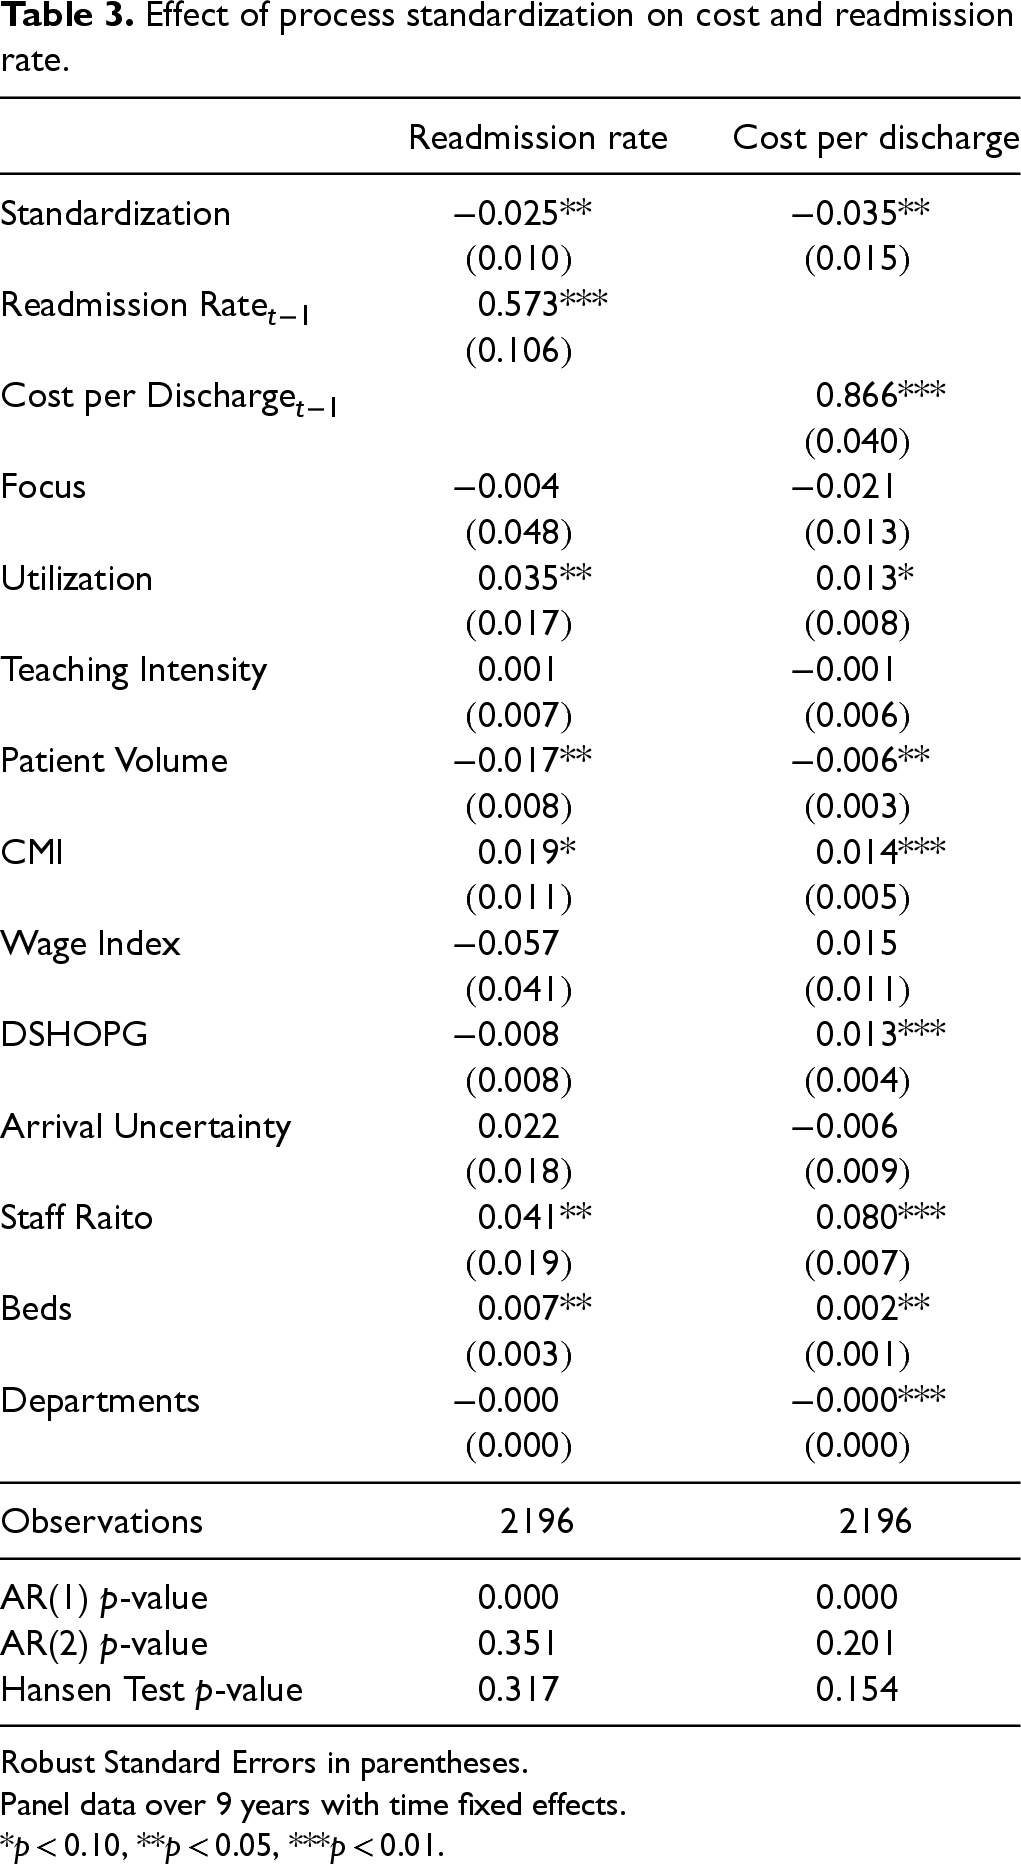
From Table 3, we can see that process standardization is negatively associated with cost per discharge at the hospital level, providing support for Hypothesis 1a. We also show that process standardization is associated with decreasing readmission rates (i.e., improving quality), providing support for Hypotheses 2a. Summarizing the direct effect of process standardization, our results suggest that process standardization improves both cost and quality of care at the aggregate level. The mean readmission rate and cost per discharge in our data were 0.069 and 0.113, respectively. Our results suggest that for a hospital that improves its standardization metric by 0.1 units, the readmission rate and cost per discharge will drop by 0.0025 and 0.0035, respectively. Our results add to the existing healthcare operations research on adherence-based process standardization and its effect on cost and quality. While earlier research had mixed evidence with respect to cost, measuring process standardization in terms of variation in actual service delivery indicates that reductions in clinical variations can strongly improve hospital outcomes in terms of both cost and quality.
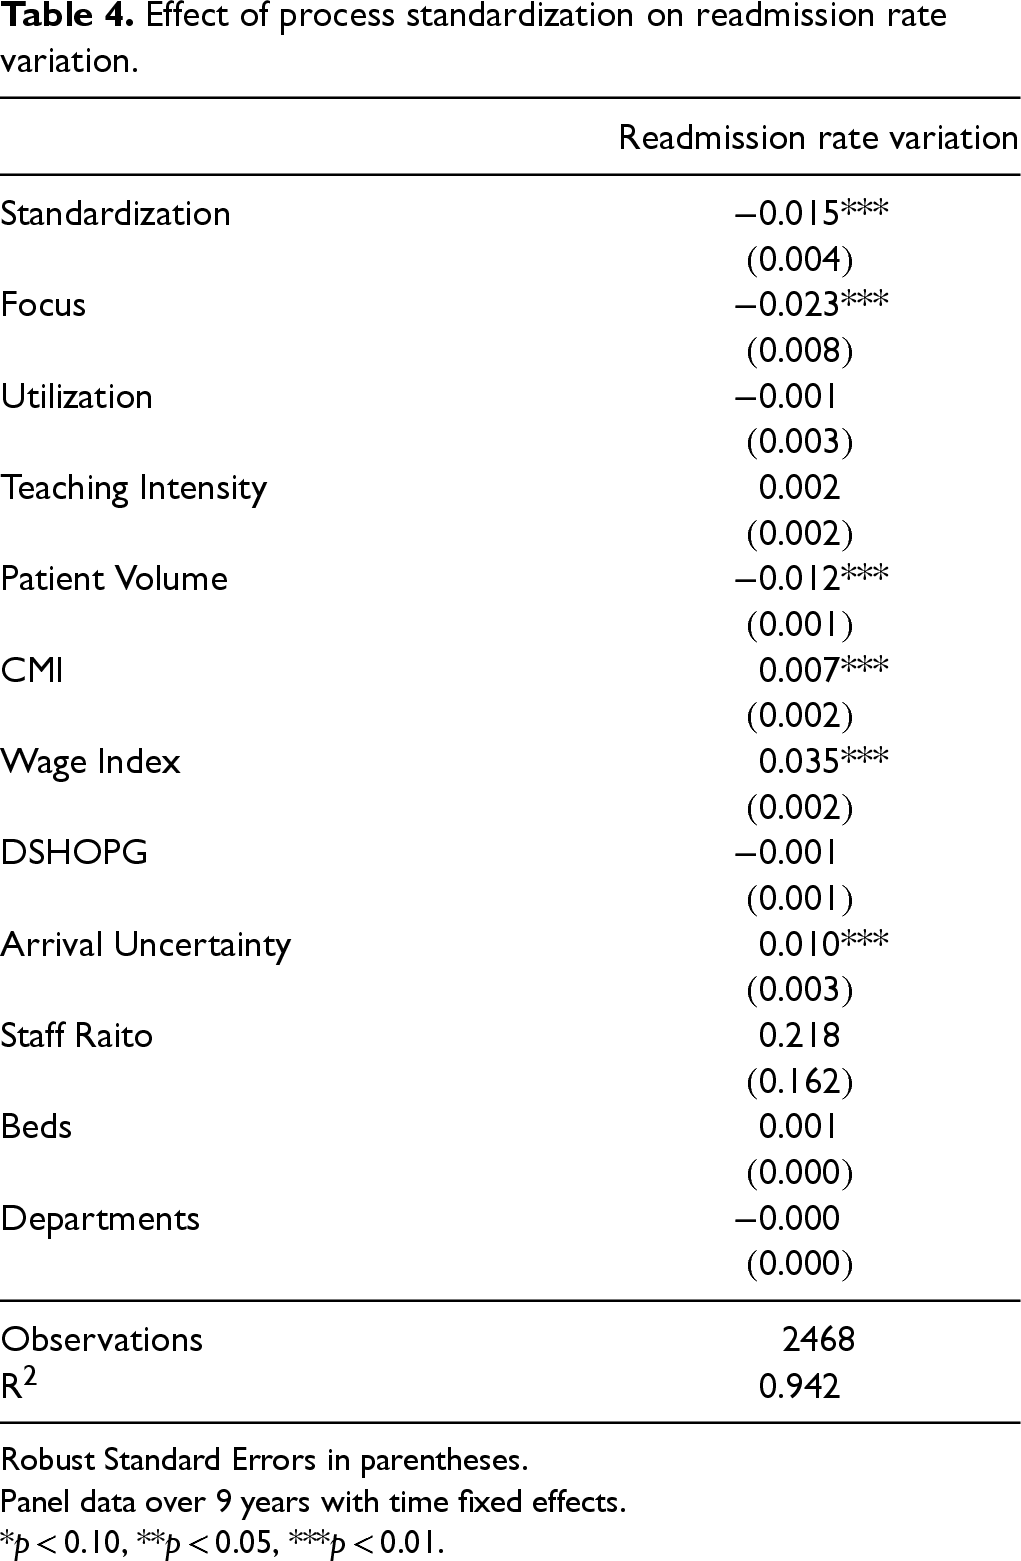
We next examine the influence of process standardization on variation in quality, as seen in Table 4. We find that process standardization is associated with a reduction in variation in outcome quality, providing support for Hypothesis 3. While this result is well known in the manufacturing sector based on extensive work on lean system, our results indicate that even in highly patient-focused healthcare environments, a higher level of process consistency leads to more consistent quality of outcome.
Effect of process standardization on readmission rate variation.
Effect of process standardization on readmission rate variation.
Robust Standard Errors in parentheses.
Panel data over 9 years with time fixed effects.
*p < 0.10, **p < 0.05, ***p < 0.01.
Our main models examined the hospital-year level data. This level of analysis is consistent with existing healthcare literature focused on standardization measured through adherence (Andritsos and Tang, 2014; Chandrasekaran et al., 2012; Senot et al., 2016). However, our bottom-up construct of process standardization provides us additional flexibility compared to top-down process adherence metrics, which are constrained to medical conditions that have processes to adhere to. We are able to study the impact of process standardization at more granular analysis that can provide a deeper understanding of areas where process standardization may have more significant impact.
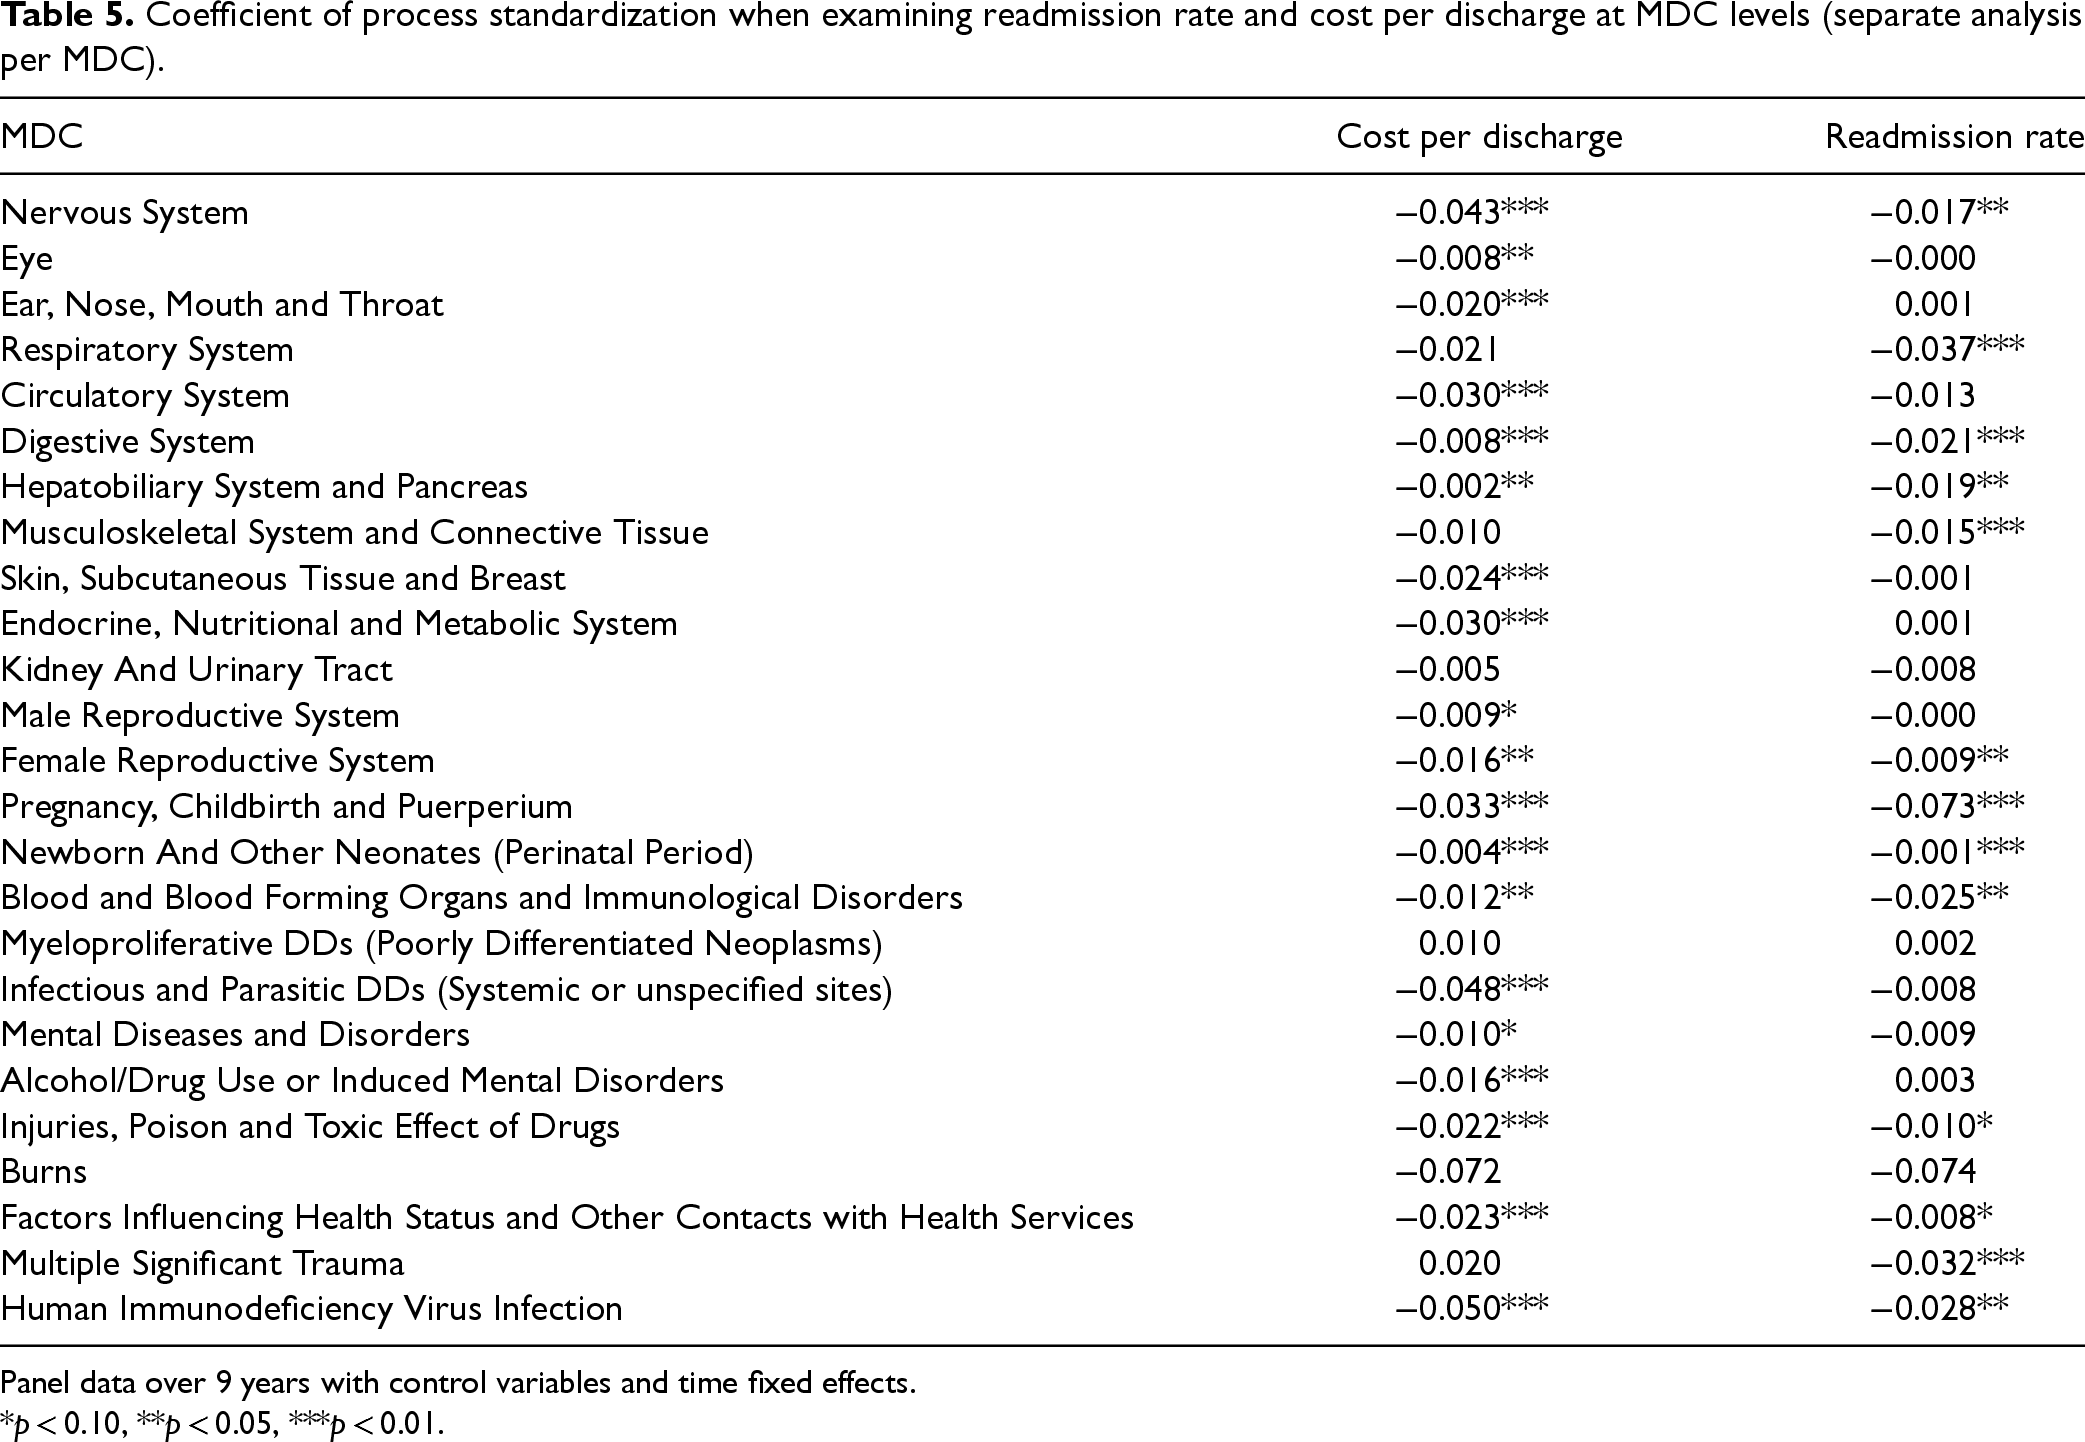
We first extend our investigation by running our analysis at the operating unit, or MDC-hospital-year, level. We can observe both the independent variable (process standardization) and the dependent variables (cost per discharge and readmission rate) at the MDC level. We measure focus based on the relative MDC patient volume as done in existing literature (Clark and Huckman, 2012) and compute MDC level measures for complexity and arrival uncertainty in our analysis. We employ the same model construct outlined in Section 4 and present the results for each MDC in Table 5. For the sake of conciseness, we only show the coefficient for process standardization in the table. While we expect that the effect of standardization to vary across the 25 MDCs, interestingly we find that in most MDCs (19 for cost and 13 for quality), process standardization significantly improves outcomes. Further, in those cases where these variables are not standardization is highly significant for both cost and quality; some other MDCs such as musculoskeletal or circulatory systems one of them is not significant, while in MDCs such as kidney and urinary tract or burns neither has statistical significance. Identifying potential drivers that account for this impact variation across MDC's could provide valuable insights and is an interesting avenue for future research.
Coefficient of process standardization when examining readmission rate and cost per discharge at MDC levels (separate analysis per MDC).
Coefficient of process standardization when examining readmission rate and cost per discharge at MDC levels (separate analysis per MDC).
Panel data over 9 years with control variables and time fixed effects.
*p < 0.10, **p < 0.05, ***p < 0.01.
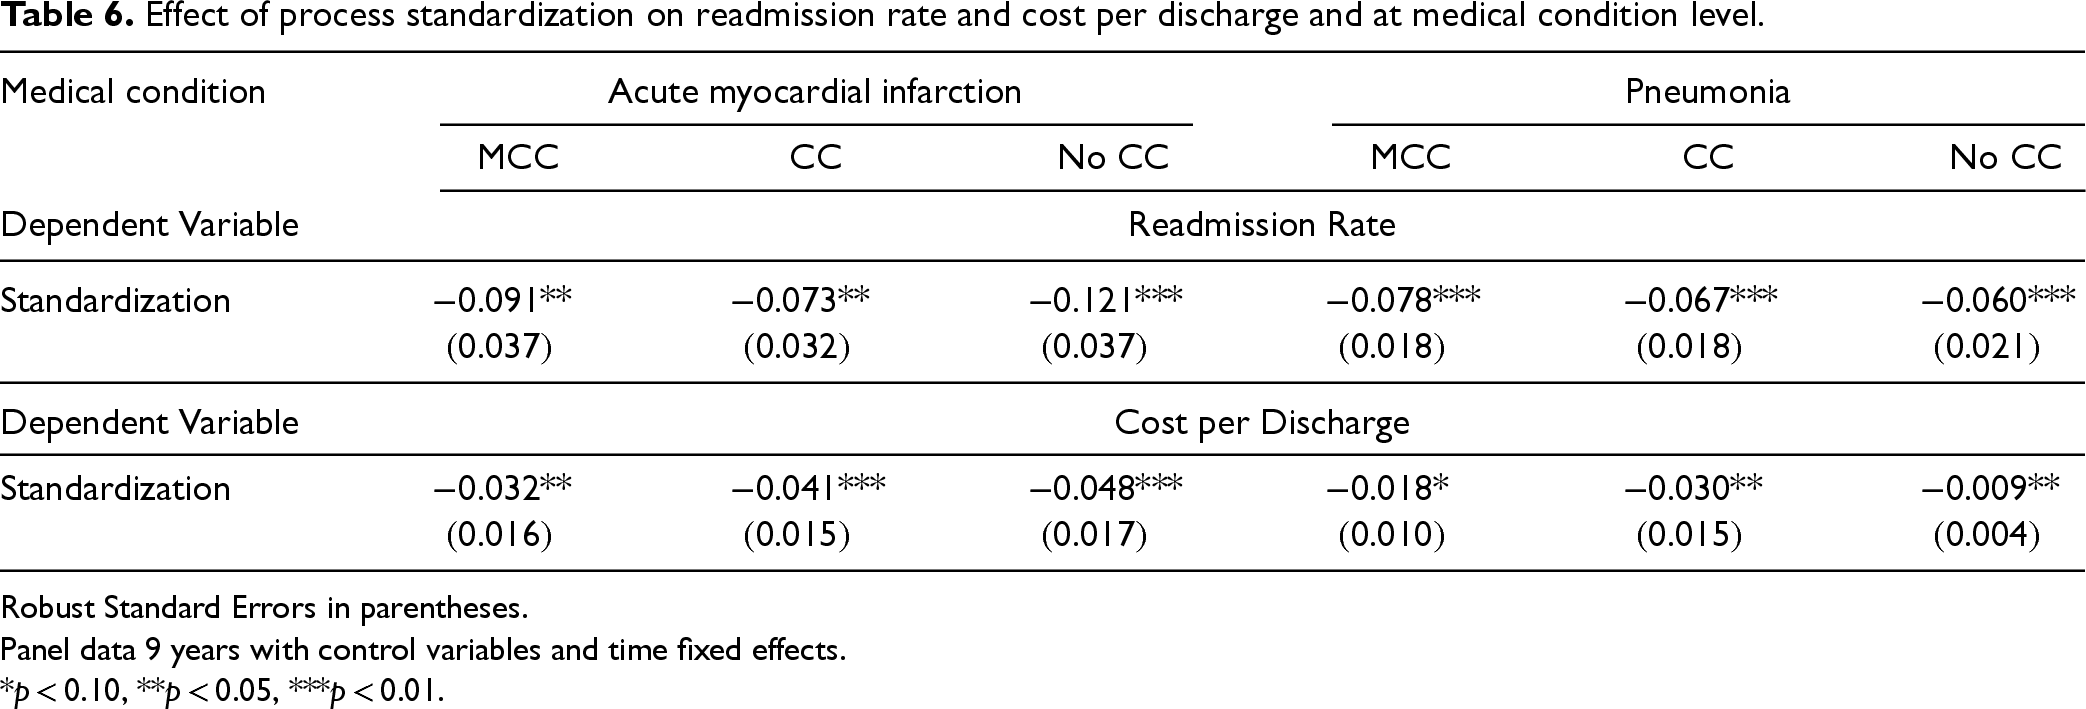
We also expect that the effect of process standardization will vary across different medical conditions and case severities, identified by MS-DRGs and complications/comorbidities respectively. We compare these effects for commonly researched conditions of AMI and pneumonia (PN). We elect these two as they are from different MDCs. Using the same methodology as presented earlier, we analyze the impact of standardization at the medical condition level. When creating patient groupings, we use disease-specific comorbidities identified by CMS (2013) to group patients rather than those found in the Charlson comorbidities index since accurate comorbidities are readily available for these two conditions. Readmission rates calculations also adopt a disease-specific risk adjustment approach using comorbidities identified by CMS (2013) and the risk adjustment framework outlined by Clark and Huckman (2012). Following this framework and using the patient characteristics and diagnoses identified by CMS to increase the likelihood of each medical condition (CMS, 2013), we create predicted readmission rates for each hospital. To obtain risk adjusted readmission rates, we divide observed readmission rates by predicted readmission rates and normalize using mean readmission rates across all hospitals. Further, covariates that we are able to compute at the medical condition level, we do, including focus, patient volume, and arrival uncertainty at the medical condition level. Finally, we conduct separate analysis for each MS-DRG related to the disease conditions that identify patients based on major complications or comorbidities (MCC), complications or comorbidities (CC), and no complications or comorbidities (No CC). Leveraging these MS-DRG stratifications allow us to differentiate patients with the same disease condition yet varying degrees of case severity. Our results are shown in Table 6. For space considerations, we report only the coefficients for the variables of interest; full results are provided in the E-companion. We find that the quality benefits of process standardization are significant for both medical conditions, although at different significant levels. We find, as expected, variations in the association between process standardization and outcomes at the medical condition level, much like at the MDC level.
Effect of process standardization on readmission rate and cost per discharge and at medical condition level.
Robust Standard Errors in parentheses.
Panel data 9 years with control variables and time fixed effects.
*p < 0.10, **p < 0.05, ***p < 0.01.
Our analysis thus far has focused on the impacts of process standardization on hospital performance. However, examining how hospital operational factors may impact the degree of process standardization found within a hospital can assist in identifying environments more prone to process standardization implementations. Specifically, we further examine how hospital focus, demand complexity, resource utilization, and process adherence metrics influence process standardization. Healthcare research has shown that hospital focus provides both cost (Freeman et al., 2021; McDermott and Stock, 2011) and quality benefits (Clark and Huckman, 2012; KC and Terwiesch, 2011; Kuntz et al., 2019). Focusing hospital operations on a subset of patients can greatly enable standardization. For example, Shouldice Hernia hospital in Canada focuses on specific patients with abdominal wall hernia and as a result can treat 98% of them with the natural tissue technique (Lorenz et al., 2021). Indeed, Skinner (1974) highlights that standardizing equipment and processes is critical for the success of a focused factory. Thus, we anticipate that hospitals with a higher degree of focus will display higher levels of process standardization.
Standardizing production processes can assist in alleviating costs associated with demand complexity while still maintaining high customer service (Lee, 1996; Swaminathan, 2001; Swaminathan and Tayur, 1998). In healthcare, medical conditions vary by complexity even within the same diagnostic category. Healthcare literature finds that as medical condition complexity increases, healthcare delivery becomes more complex (Safford et al., 2007). As a result, it may be more difficult to standardize interventions. Therefore, we expect that increasing complexity will negatively impact process standardization at hospitals.
Higher utilization of resources can also impact operational decisions. Existing literature in healthcare finds that increasing utilization rates can cause clinicians to deviate from normal operating procedures (Kuntz et al., 2015). Deviating from normal operating procedures may lead to lower process standardization. Thus, we expect capacity utilization to have a negative effect on process standardization.
We extend our investigation to analyze factors that may impact the degree of process standardization at a hospital using a fixed effects model that controls for unobserved hospital effects. The findings of our study analyzing the impact of hospital focus, utilization, and patient complexity on process standardization are presented in Table 7. The results show that an increase in hospital focus, and reductions in patient complexity and capacity utilization, is associated with higher process standardization. These results align with our theoretical expectations and contribute to the existing literature by providing the first empirical evidence on the relationships between these factors and process standardization in healthcare delivery.
Effect of focus, utilization, and CMI on process standardization.
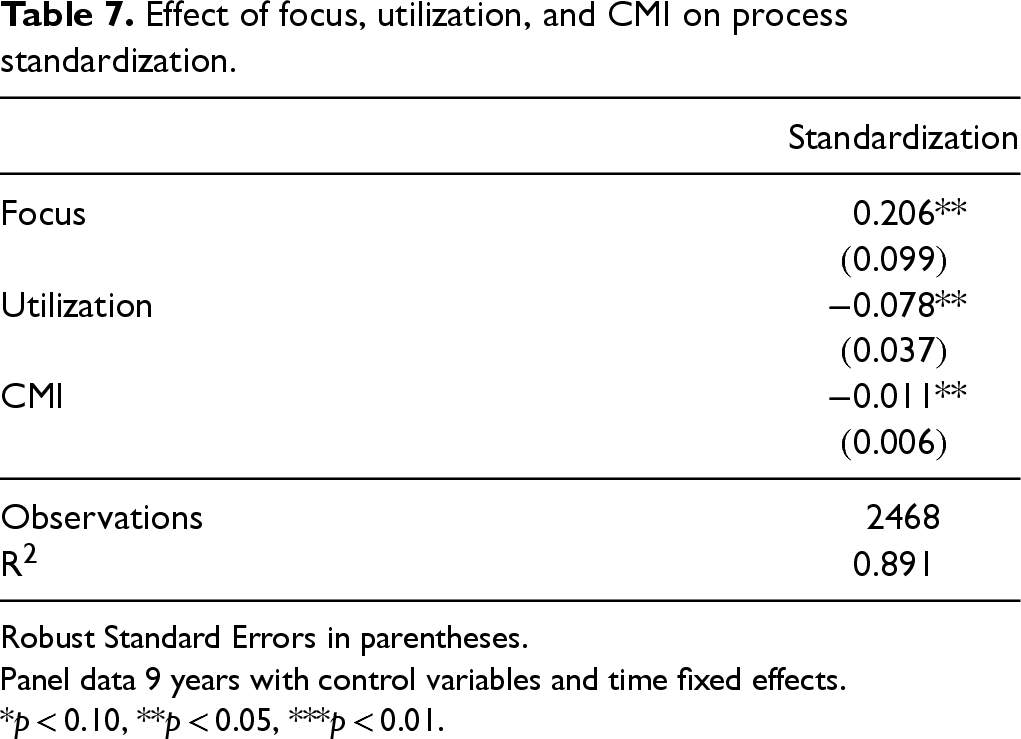
Effect of focus, utilization, and CMI on process standardization.
Robust Standard Errors in parentheses.
Panel data 9 years with control variables and time fixed effects.
*p < 0.10, **p < 0.05, ***p < 0.01.
CMS process of care adherence metrics associated with three major medical conditions—AMI, HF, and PN—have been commonly examined in healthcare operations to understand the benefits of standardizing with respect to an established protocol (Senot et al., 2016). Adherence to a prescribed process could enable a reduction in clinical variation (Gawande, 2009). We investigate the relationship between process standardization and process adherence at a hospital. We follow the approach used by Senot et al. (2016) to compute hospital level adherence measure by aggregating such data from the three medical conditions. Our results are presented in Table 8; as expected we find that adherence to national protocols across these three medical conditions is associated with an increase in the degree of process standardization at that hospital.
Effect of process adherence on process standardization.
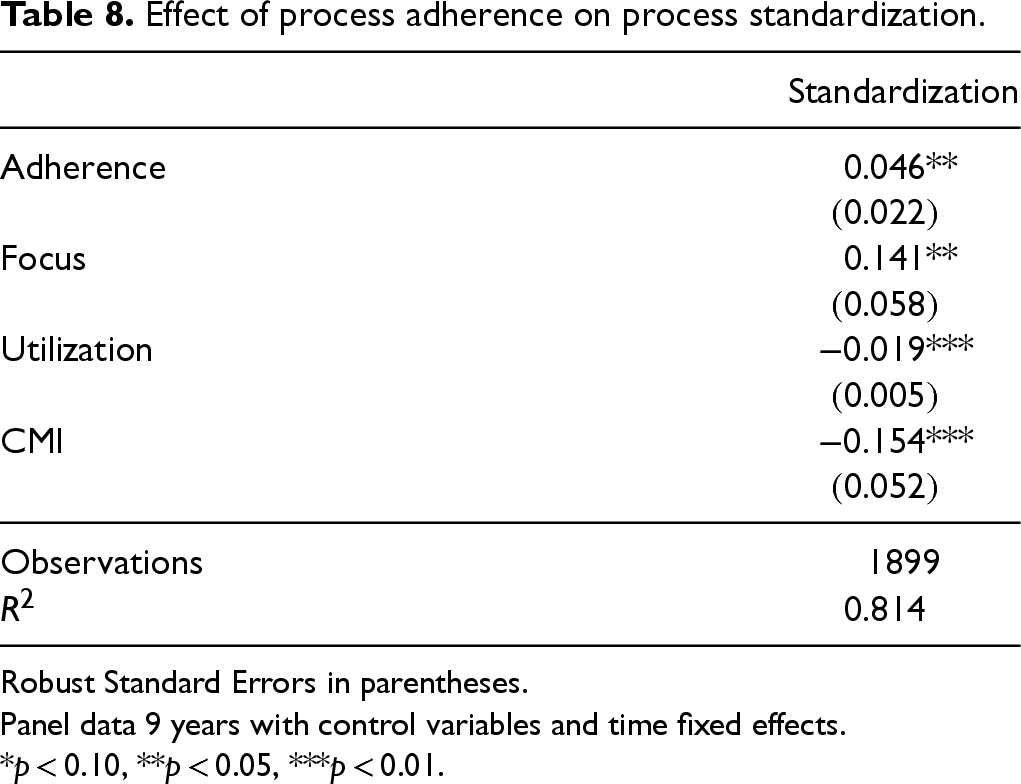
Robust Standard Errors in parentheses.
Panel data 9 years with control variables and time fixed effects.
*p < 0.10, **p < 0.05, ***p < 0.01.
To assess the robustness of our findings, we conduct several robustness checks. We examine our work from two perspectives: (1) examination of our model specification and (2) variation in constructing our process standardization metric.
Alternate model specifications
Two Stage Least Squares (2SLS)
First, we examine model specifications that may address the endogeneity concern presented by lagged dependent variables. Arellano–Bond estimation is asymptotically efficient and preferred model when working with DPD sets with large N and small T, in the absence of strong external instruments, and the main source of endogeneity derives from the lagged dependent variable. However, an alternative approach to address endogeneity presented by confounding factors, including lagged dependent variables, is 2SLS, which requires an instrumental variable (IV). A valid IV must satisfy two conditions: (a) relevance in that the IV is correlated with our variable of interest, the endogenous variable, and (b) exclusion restriction in that the IV is not correlated with the error term, and thus only impacts the dependent variable via the endogenous variable. In our robustness check, we utilize the mean process standardization for other hospitals within a given hospital's medical service area as the IV. Healthcare professionals are tasked with keeping current on medical research and clinical knowledge base. Several avenues exist for doing such, including interacting with other healthcare professionals within the same field. Further, professionals within the same geographical area may understand local nuances that impact the level of standardization, such information may be available to other hospitals in proximity in distance and specialty because of small community of doctors and healthcare administrators. Additionally, newer standard interventions may come into an area prompting hospitals to embrace them. Thus, the mean value of neighboring hospitals may impact the level of standardization. However, the mean value of standardization in healthcare delivery of neighboring hospitals does not impact the performance of the hospital under consideration. Leveraging variables from competitors in a focal firm's market as an instrument is a common approach in academic literature (Berry et al., 1995).
We find that results from 2SLS are aligned with those found in our main model (Table 9). We verify the relevance condition analyzing the first stage regression, and report the Wald F-statistic (51.79) and p-value (<0.001) associated with first stage regression, presented in Table 14 in the E-companion. Further, the coefficient of our IV is positive and statistically significant (p < 0.001) indicating explanatory power of our IV. With regard to the exclusion criteria, we statistically test exclusion by including our IV as a control variable in both readmission rate and cost per discharge regressions. In both cases, the coefficient of our IV is not statistically significant (p = 0.331 and p = 0.458, respectively).
Effect of process standardization on readmission rate and cost per discharge using alternate model specifications.
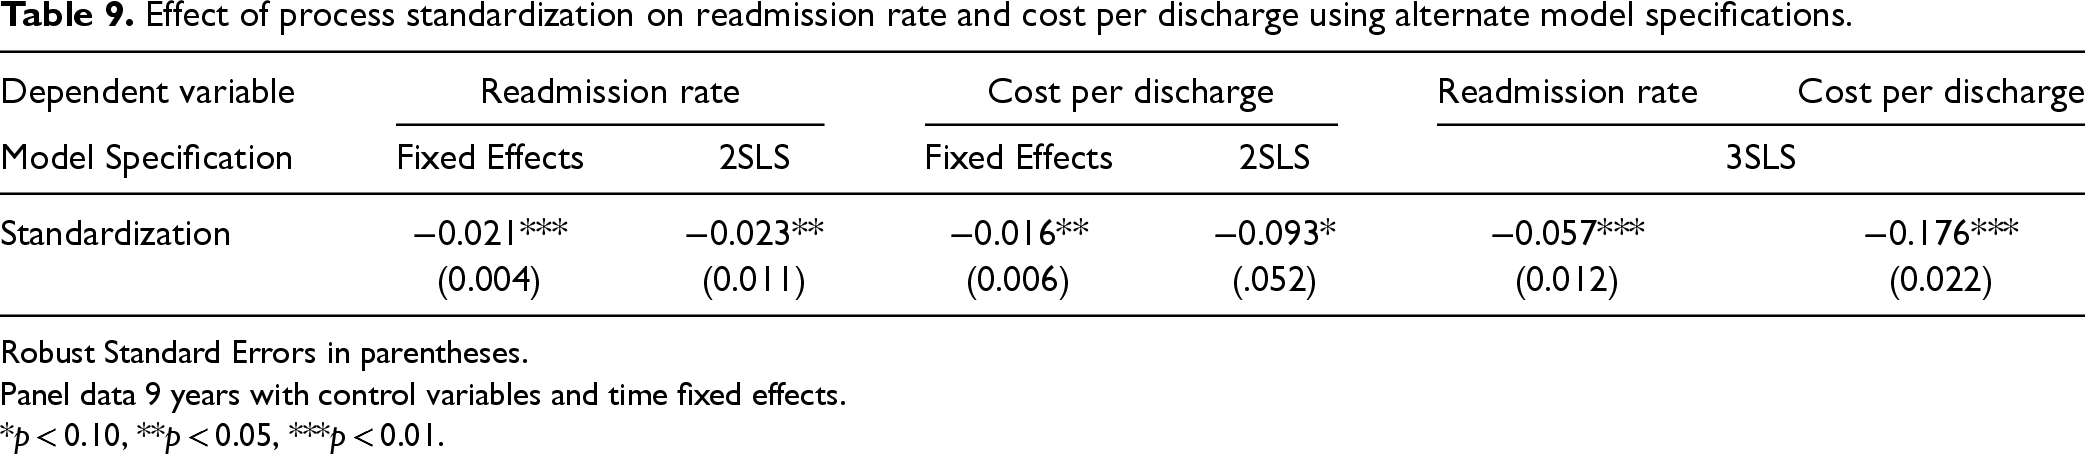
Effect of process standardization on readmission rate and cost per discharge using alternate model specifications.
Robust Standard Errors in parentheses.
Panel data 9 years with control variables and time fixed effects.
*p < 0.10, **p < 0.05, ***p < 0.01.
Next, we challenge our assumption that errors for cost and quality measures are uncorrelated. Extending beyond 2SLS, three stage least squares (3SLS), allows us to investigate the impact of process standardization on both cost and quality as a system of seemingly unrelated regressions (SUR). This model specification has the same first stage regression as the 2SLS approach, and additionally assumes cost and quality equations are potentially correlated and permits correlation of the error terms across their respective equations. We find that the results of 3SLS model specification., presented in Table 9, are in agreement with our main results.
Fixed Effects Model
Finally, we relax the constraint of the lagged dependent variable being correlated with our standardization metric. This permits the use of a fixed effects model to estimate the effect of standardization on hospital performance. As seen in Table 9, the results of this estimation are in line with those of our primary model with standardization being associated with a reduction in both cost per discharge and readmission rates.
Variation in Construction of Standardization Metric
We methodically relax assumptions of our standardization metric to test the robustness of our findings.
Number of Secondary Procedures
First, we vary number of procedures used to create our standardization metric. Our main analysis of similar procedures only considers subsets of two procedures while computing the process standardization metric. We conduct robustness checks by calculating standardization based on the primary procedure as well as the primary and up to two secondary procedures. We limit our analysis to two secondary procedures because most of our patient dataset does not involve more secondary procedures than that. Table 10 displays these results. We find that process standardization continues to improve both cost and readmission rates.
Coefficient of process standardization when varying procedural subset.
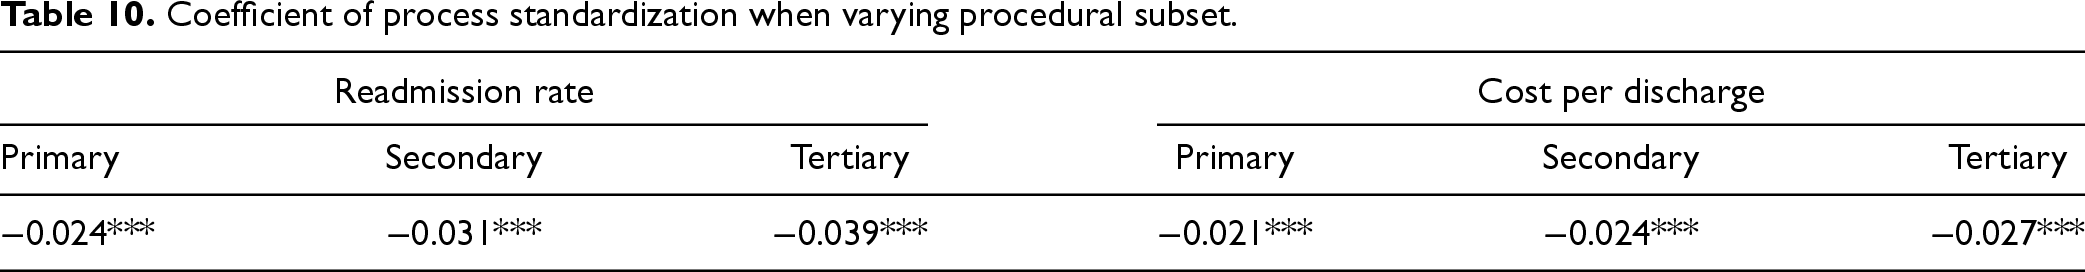
Coefficient of process standardization when varying procedural subset.
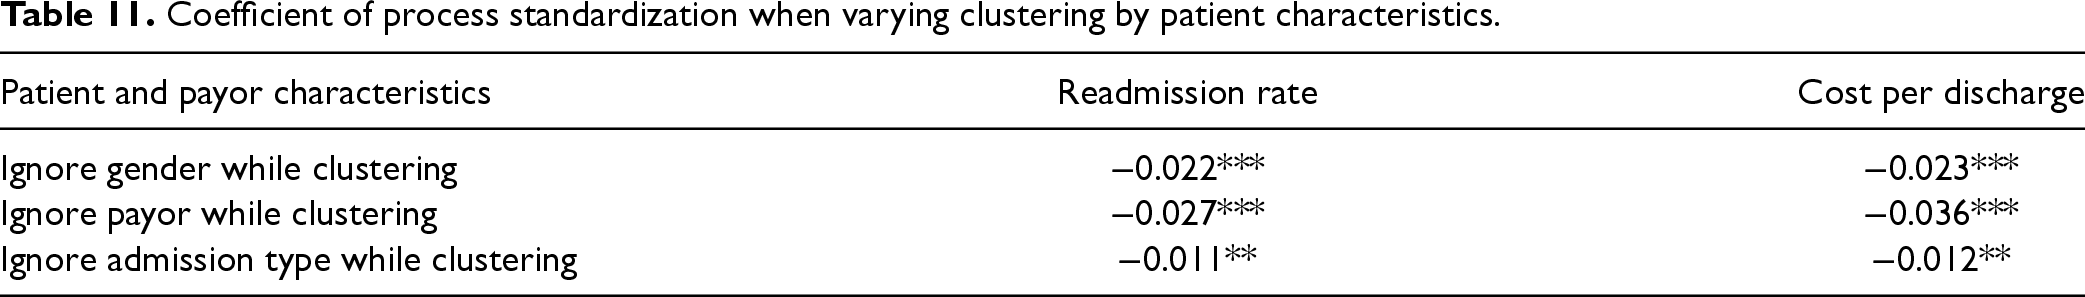
Next, we imposed several restrictions in our clustering approach, including similarity in hospital, year, medical condition, gender, payor, and admission type. While some factors such as gender, payor, and admission type may be important for some medical conditions, they may not be relevant for others. To verify the robustness of our results, we relax each of these constraints when grouping similar patients and calculate updated standardization metrics. Table 11 shows our results hold under alternative patient clustering.
Coefficient of process standardization when varying clustering by patient characteristics.
Coefficient of process standardization when varying clustering by patient characteristics.
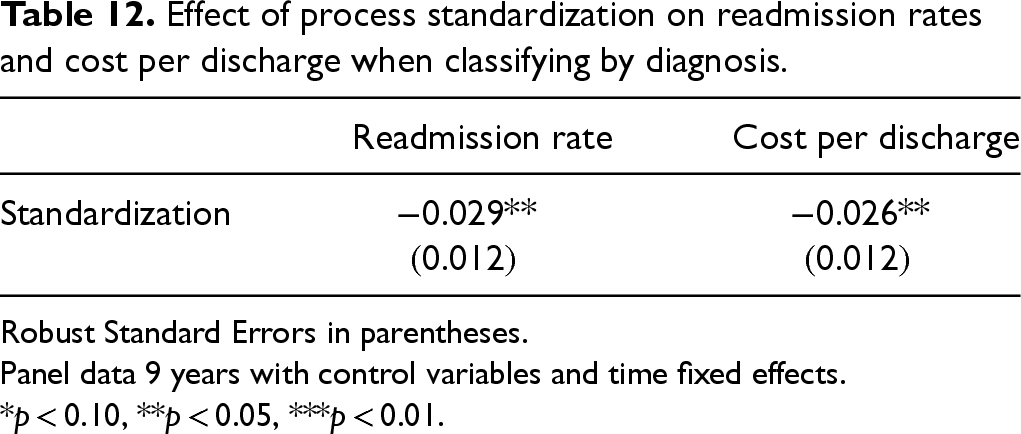
Finally, while MS-DRG is a reasonable approach for classifying similar patients based on medical condition, another approach to classifying patients could be the primary diagnosis on arrival at the hospital. Our construct enables us to classify similar patients using primary diagnosis (over 70,000 possible diagnoses) rather than MS-DRG. Table 12 shows the results of using primary diagnosis rather than MS-DRG in our patient clustering. We find that process standardization continues to be significant in terms of both cost and readmission rates although at a weaker significance level.
Effect of process standardization on readmission rates and cost per discharge when classifying by diagnosis.
Effect of process standardization on readmission rates and cost per discharge when classifying by diagnosis.
Robust Standard Errors in parentheses.
Panel data 9 years with control variables and time fixed effects.
*p < 0.10, **p < 0.05, ***p < 0.01.
Overall, we find that our main standardization variable and model specifications are robust to alternative formulations and specifications.
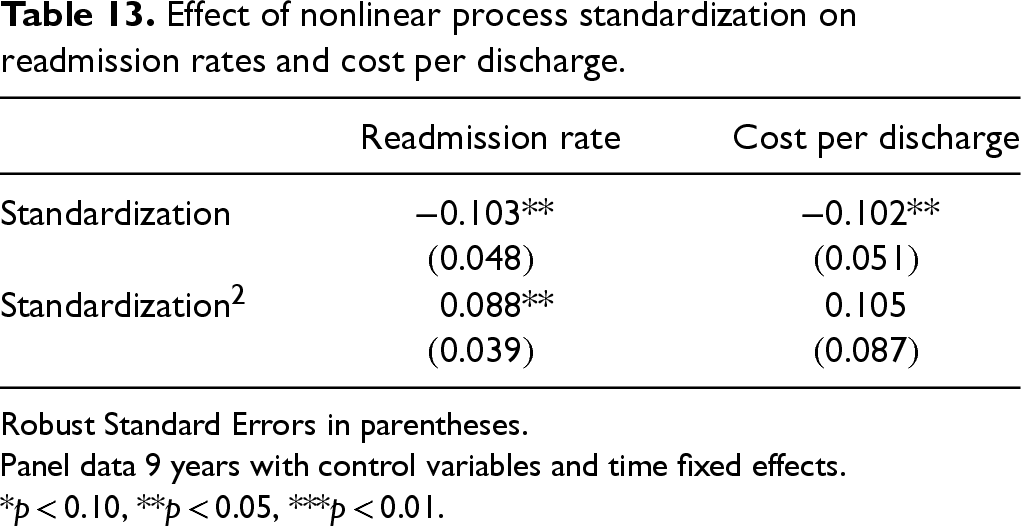
Given the attention personalized care has received, it is reasonable to think process standardization may have limitations in effectiveness because it could prevent individualized care. We explore potential limits to standardization from two perspectives. First, we investigate if there are diminishing marginal returns to the benefits of process standardization. We empirically examine this by including a nonlinear process standardization variable in our model. As seen in Table 13, process standardization has a diminishing return with regards to readmission rates, suggesting that it has its limits to quality benefits. We do not see a similar relationship with cost per discharge. This could be due to economies of scale benefits related to process standardization that tend to be positive with respect to cost reductions.
Effect of nonlinear process standardization on readmission rates and cost per discharge.
Effect of nonlinear process standardization on readmission rates and cost per discharge.
Robust Standard Errors in parentheses.
Panel data 9 years with control variables and time fixed effects.
*p < 0.10, **p < 0.05, ***p < 0.01.
Next, we analyze the effect of process standardization on performance metrics for each MS-DRG separately (Figures 6 and 7 in the E-companion). Not only is there significant variation in the degree of standardization across MS-DRGs, but also the effect process standardization has. Some medical conditions showed significant performance benefits associated with process standardization, while others conditions suggested process standardization does not affect cost and quality metrics.
Cost benefits associated with process standardization could be attributed to streamlining upkeep costs for hospitals to maintain multiple service offerings for the same disease condition. For example, intracranial hemorrhage or cerebral infarction was associated with significant cost benefits due to process standardization. The various procedures that can be rendered to address intracranial hemorrhage or cerebral infarction—specifically craniotomy, decompressive craniotomy, and decompressive craniectomy—rank among the most expensive procedures in the United States (Learish, 2020). Thus, hospitals with higher standardization on one approach could have higher cost efficiencies than hospitals that equally support all procedures.
Quality benefits gleaned from process standardization can potentially be attributed to improvement in outcomes due to experience. For example, viral meningitis had amongst the highest quality benefits associated with process standardization. While there is no universally accepted protocol to address every patient with viral meningitis, clinicians must elect to provide the care that leads to improved quality outcomes. In the case of viral meningitis, as clinicians gain experience by reducing the variation in services provided to patients (spinal tap, draining spinal fluids, etc.), this may result in improved outcomes.
There were also some conditions that showed no benefit associated with process standardization. For example, vaginal delivery inpatient stays displayed neither cost nor quality improvements due to process standardization. This could potentially result due to reduced cost differences between potential procedures or equal quality across procedures. Or this could be the result of less standardization as patients giving birth tend to be more knowledgeable about their choices and have more influence services than other medical conditions, which is reflected by relatively lower levels of process standardization. This analysis is presented in the E-companion. However, we have limited control variables available at the MS-DRG level, thus we present this as initial exploratory analysis to build upon our main findings. To truly uncover further nuances of the variation in impact standardization can have at the MS-DRG level, more granularity of data is required. This is an exciting path forward that we hope is motivates further research.
This study investigates the impact of process standardization in service delivery on cost and quality in the healthcare environment. Our results have several important research implications. We introduce a construct that quantifies the degree of standardization by examining services delivered at the local level. Next, using this metric, we evaluate the impact of process standardization on cost and quality in hospitals, finding that standardization is associated with improvements in cost per discharge, readmission rates, and variation in readmission rates. Further, we examine potential drivers of process standardization and find that process standardization is associated with increased focus and process adherence, as well as reduced complexity and capacity utilization. We then explore the degree of standardization found across different medical conditions within a hospital. We find that process standardization varies significantly across medical conditions and its impact on cost and quality outcomes vary. For example, process standardization is highly influential in diseases of the respiratory system while its impact on some others such as diseases to the kidney and urinary tract are milder. Finally, we show that benefits of process standardization in terms of readmission rates have diminishing marginal returns.
The implementation of process standardization in healthcare is an ongoing topic. Some practitioners may view it as a top-down operational push that inhibits their creative ability to treat patients while others believe that such standardization is the result of bottom-up efforts. No matter how such standardization may happen, our study (developed based on data from actual healthcare delivery) demonstrates that process standardization (or variability reduction in healthcare interventions) improves the overall performance of the hospital. Further, we find that the level of process standardization as well as its benefits varies across medical conditions as well as departments indicating that adoption may vary across a hospital. Our result provides managerial insights into where such standardization could be extremely useful. Our study is the first one to establish the relationship between internal process standardization in healthcare interventions (going beyond adherence) and its implications for operational performance. By shedding light on the positive impact of process standardization on healthcare outcomes, we hope to encourage healthcare organizations to adopt and improve such standardization initiatives.
From a managerial implementation perspective, the primary value of our work is to provide administrators with another tool to evaluate consistency in the healthcare delivery process, especially in areas without standard protocols. Quantifying standardization from a ground-up perspective can provide many soft benefits, such as identifying avenues ripe for standardization implementation and clinician buy-in. Utilizing clinicians’ actions to identify areas ripe for standardization not only liberates the hospital from waiting on external organizations to publish universally accepted protocols, but also may improve clinician buy-in as the processes are driven by their actions.
To ensure that process standardization enhances hospital performance without compromising patient care, administrators can adopt a targeted, data-driven approach informed by the insights from our study. Our process standardization metric provides a valuable tool for measuring variation in procedural care and identifying departments, conditions, or patient groups where standardization efforts could yield the greatest benefits. Administrators can use this metric to pinpoint areas where variation is unwarranted, distinguishing between necessary clinical flexibility and inefficiencies that contribute to inconsistent care. Rather than relying solely on externally imposed protocols, hospitals can leverage naturally occurring patterns of care among clinicians to codify best practices already in use, ensuring that standardization reflects actual clinical workflows rather than a top-down mandate. Additionally, our findings suggest that standardization's impact varies by condition and department, highlighting the need for a tiered approach. By treating standardization as a continuous improvement process, administrators can track year-over-year changes in care consistency, linking standardization scores to operational performance indicators such as readmissions and cost per discharge. This enables hospitals to fine-tune their approach over time, ensuring that standardization enhances efficiency and patient outcomes rather than introducing rigidity. Our study provides a framework not just for measuring standardization but for strategically guiding hospital administrators to identify patient subgroups ripe to glean the benefits of standardization protocols developed by in-house clinicians.
Currently, there is a significant push in healthcare toward personalization, emphasizing care tailored to individual patient characteristics, such as medical history, comorbidities, and preferences. While this approach may seem at odds with standardization, the two often function as complementary strategies. Personalization identifies the specific needs of each patient, while standardization ensures that, once those needs are defined, patients with similar profiles receive evidence-based, consistent care. In this sense, standardization operates conditional on personalization, reducing unwarranted variation while accommodating individual needs. Pfaff et al. (2010) further elaborate on this, presenting the concept of “individualized standardization”: implementation of a standard framework that is then further tailored to specific patient need. Our study aligns with this framework and introduces a construct to quantify the degree of standardization in care delivery. This construct can assist healthcare administrators in identifying patient subgroups receiving higher levels of standardization care, where standardization protocols can be created and implemented without necessitating full adherence to rigid standards. Ultimately, our contribution lies in providing a measurable approach to assess the extent of standardization in patient care, facilitating more tailored and effective healthcare delivery. Deeper examination of underlying mechanisms through which process consistency may influence hospital is an important area for future work.
One limitation of our work is that our dataset is only from the state of California. Extending robustness checks with other state data could supplement our findings. Second, we cluster similar patients based on data available. More detailed information about patient history and comorbidities could enable a finer refinement of the clusters. Despite these shortcomings we believe our work presents managerially relevant insights to healthcare practitioners. As one practitioner commented to us “This is a very important topic as it intersects managing healthcare delivery with providing healthcare delivery. Examining process standardization from both a top-down as well as a bottom-up perspective, as they have, will be critical to implementation of successful initiatives” (Moon, 2022).
Supplemental Material
sj-pdf-1-pao-10.1177_10591478251361985 - Supplemental material for Measuring Consistency in Service Delivery: Examining the Effect of Process Standardization on Hospital Performance
Supplemental material, sj-pdf-1-pao-10.1177_10591478251361985 for Measuring Consistency in Service Delivery: Examining the Effect of Process Standardization on Hospital Performance by Anand Bhatia and Jayashankar M Swaminathan in Production and Operations Management
Footnotes
Acknowledgments
The authors wish to thank the anonymous review team, Sriram Narayanan and Yuqian Xu for their comments on an earlier version of the paper. They also thank seminar participants at John Hopkins University, Carnegie Mellon University, Boston University, University of Utah, IE University, UNC Charlotte, and UNC Chapel Hill for their helpful suggestions.
Declaration of Conflicting Interests
The authors declared no potential conflicts of interest with respect to the research, authorship, and/or publication of this article.
Funding
The authors received no financial support for the research, authorship, and/or publication of this article.
How to cite this article
Bhatia A Swaminathan JM (2026) Measuring Consistency in Service Delivery: Examining the Effect of Process Standardization on Hospital Performance. Production and Operations Management 35(2): 395–414.
References
Supplementary Material
Please find the following supplemental material available below.
For Open Access articles published under a Creative Commons License, all supplemental material carries the same license as the article it is associated with.
For non-Open Access articles published, all supplemental material carries a non-exclusive license, and permission requests for re-use of supplemental material or any part of supplemental material shall be sent directly to the copyright owner as specified in the copyright notice associated with the article.