
Abstract
Compacted graphite iron (CGI) is widely used in automotive engines thanks to its excellent castability and thermal conductivity. Despite extensive research, the influence of its microstructure on the fracture behaviour has not been fully elucidated. In this work, four different damage models with realistic and simplified morphologies are compared. The developed models consider the effect of graphite-particle morphology and the domain’s boundary conditions. The crack path and morphology were characterised with in situ tensile tests inside a scanning electron microscope. Then, finite-element models capturing the actual microstructure morphology were generated, assuming isotropic and ductile properties for the matrix and graphite. Crack initiation was simulated employing the Johnson-Cook damage scheme and cohesive-zone elements. It was found that cracks tended to initiate at the ends of vermicular graphite particles. Besides, small matrix bridges between the neighbouring graphite inclusions facilitated the concentration of high stress, with its level increasing as the spacing decreased. Validation of simulations was based on in situ experimental data. The developed model could assist in the understanding of the mechanical and fracture behaviours of CGI.
Keywords
Introduction
Compacted graphite iron (CGI) is known for its distinct castability, good thermal conductivity properties, and competitive price since its first observation (Dawson and Schroeder, 2000). CGI is increasingly being utilised as the primary manufacturing material for crucial heat-resistant components in advanced engines, surpassing aluminium alloys and traditional grey-cast irons (Yue et al., 2023). The microstructure of CGI comprises irregularly shaped graphite particles randomly embedded in a metallic matrix. Three main shapes of these particles were identified: nodular, vermicular and flake (Sjogren et al., 2004). Due to its complex microstructure, constructing numerical 3D models is challenging (Xu et al., 2021); hence, mostly 2D models have been used to explore the mechanical properties and fracture behaviour of CGI (Chiyatan and Uthaisangsuk, 2020; Gad et al., 2021). Fracture mechanisms in CGI involve the nucleation of voids and micro-cracks that propagate and coalesce at a micro-structural level to eventually form a macroscopic crack or a diffused damage zone (Razanica et al., 2021). As fracture evolution is frequently complex in all metal-matrix composites, accurately predicting the crack-initiation strain, the crack path and the propagation rate is important in order to anticipate and avoid the material fracture. However, models for predicting the crack path under realistic morphology are extremely inefficient and do not have good accuracy (Ural et al., 2005). Consequently, there is a critical need for an effective and accurate FEM approach to simulate and predict the damage behaviour of CGI or similar particle-reinforced composite materials. This work is driven by the following motivations: (i) comparison of three frequently used approaches for the analysis of the fracture behaviour of composite materials; (ii) understanding of the crack-propagation mechanism which could be helpful to the further development of CGI.
There is a growing trend towards the utilisation of microstructure-based mechanistic models to predict material deformation, fracture and fatigue responses in heterogeneous microstructures, e.g., Becker and Richmond (1994), Spear et al. (2016), Cheng et al. (2020), Tu et al. (2020). Representative-volume-element (RVE) models evolved underpinned by both continuum and statistical mechanics and were first proposed by Hill (1963). Sharma and Daggumati (2020) performed finite-element analysis using an RVE with a random fibre distribution, replicating the microscopic structure observed in an actual composite ply, to investigate the stress-strain response and damage behaviour at the constituent level. Luo et al. (2024a) investigated a real microstructure-based RVE alongside crack evolution under in situ tensile test. However, this approach is computationally demanding, making it challenging to apply in generating artificial random microstructures. Besides, image-based micromechanical simulations combined with experimental microstructure characterisation attracted more attention from researchers (Di Cocco et al., 2010; Shi et al., 2020; Yue et al., 2023). Generally, the experimental sampling resolution for a microstructural feature should be approximately 10 times finer than the size of a feature to achieve accurate reconstructions (Ghosh et al., 2023). Peng et al. (2010) proposed a microstructure-based description for the size effect of elastoplastic behaviour and damage of pearlitic steel. They obtained a unified evolution law for damage corresponding to different patterns of microdefects in different phases employing continuum damage mechanics. Another microstructure-based RVE model was generated with the help of X-ray micro-CT to predict the porosity of concrete under freeze-thaw action (Luo et al., 2020).
In recent years, three main methods have been used to simulate the fracture behaviour of materials (Camanho and Davila, 2002; Gad et al., 2021; Naghdinasab et al., 2018): (i) ductile damage models; (ii) Johnson-Cook (JC) damage model; (iii) cohesive-based damage model. Generally, fracture gradually evolves from micro-cracks to macro-cracks; the initiation, propagation, and final connection of micro-cracks could lead to the formation of the main crack (Mao et al., 2023). Bonora and Ruggiero (2005) employed a ductile-damage concept for the matrix material to explain catastrophic failure at the macroscale of ductile cast iron. Mohammed et al. (2011) investigated the initiation and propagation of cracks in CGI under dynamic loading conditions and developed a JC damage model to describe this phenomenon. The study revealed that cracks primarily initiated at the graphite particles and the graphite/matrix interfaces, propagating into the metal matrix in the form of a network of microcracks, ultimately leading to complete material failure. Yang et al. (2024) generated four models with JC damage and random particle sizes and distributions to investigate the influence of graphite morphology on the machinability of nodular cast iron. They considered this material as a three-phase composite and found that the presence of graphite particles along the cutting path significantly affected the resulting surface morphology post-machining. Through metallurgical investigations and finite-element modelling, this research provided significant insights into understanding the behaviour of CGI under various loading conditions. A cohesive-zone model (CZM) was used in the finite-element method (FEM) to analyse the fibre-matrix interface (Gad et al., 2021; Hosseini-Toudeshky and Jamalian, 2015). Zhang et al. (2018) reconstructed a cohesive finite-element model with micro-scale damage based on tensile properties and damage characteristics of CGI. They investigated the size, volume fraction and morphology of the tensile behaviour but did not analyse the fracture behaviour of CGI. Liu (2021) built a cohesive model to analyse the delamination of composite laminates with different fracture modes. Cao et al. (2023) created a 3D model to understand the effect of morphology on the thermomechanical performance of CGI under high temperatures but only focused on a single graphite inclusion. It was suggested that an effective RVE model should incorporate the realistic morphology and varying orientations of graphite inclusions, encompassing a multitude of such particles (Zhan et al., 2022). Nilsson and Lidström (2012) studied the influence of cohesive elements on the deformation behaviour by comparing the evolution of normalised strain rates.
In this study, the damage mechanism of CGI is investigated with in situ experiments at room temperature and finite-element simulations based on ductile fracture, cohesive-zone modelling, and Johnson-Cook damage modelling. The main objective of this work is to compare different prediction approaches for cracks and better understand the mechanical and fracture behaviours of CGI under tensile loading. The manuscript is organised as follows: in the methodology section, the geometry and boundary conditions of the realistic and simplified models are presented. Then, material properties and the generalised function relevant to crack extension are given, followed by descriptions of the materials and experimental procedures. The results section comprises a discussion on the effect of boundary conditions, the comparison of three different models, and an analysis of crack evolution in JC- and CZM-based simulations.
Methodology
Model geometry
Since CGI can be regarded as a natural composite material, with graphite particles embedded in a ferrous matrix (ferritic or pearlitic) (Di Cocco et al., 2010), the multi-phase CGI is reasonably simplified as a two-phase system in this study. Prior studies mainly focused on random simplified representations of graphite shapes or idealised graphite particles owing to their complex microstructure (Andriollo et al., 2016; Chen et al., 2022; Luo et al., 2024b). Nevertheless, simplified models of graphite shapes cannot fully reflect the mechanical properties of the material nor can they effectively simulate the occurrence and propagation of cracks. A comprehensive model should contain diverse inclusions with varying shapes and orientations.
In this study, microstructure images of CGI were obtained with a Zeiss Merlin Field Emission Scanning Electron Microscope (FESEM) (Figure 1(a)). ImageJ software was used to measure and identify the microstructural features and their dimensions in these images by applying a greyscale threshold between the graphite particles and the matrix (Schroeder et al., 2021). Besides, the complex shapes of graphite inclusions were simplified into ellipses. After that, Solidworks software was employed to sketch the CGI microstructure using the auto-trace function (Dogra, 2024). The sketch of the microstructure of CGI-generated complex particle boundaries is shown in Figure 1(b) and (c). To reduce the computational cost, small particles (less than 10 µm in diameter) were removed from the model.
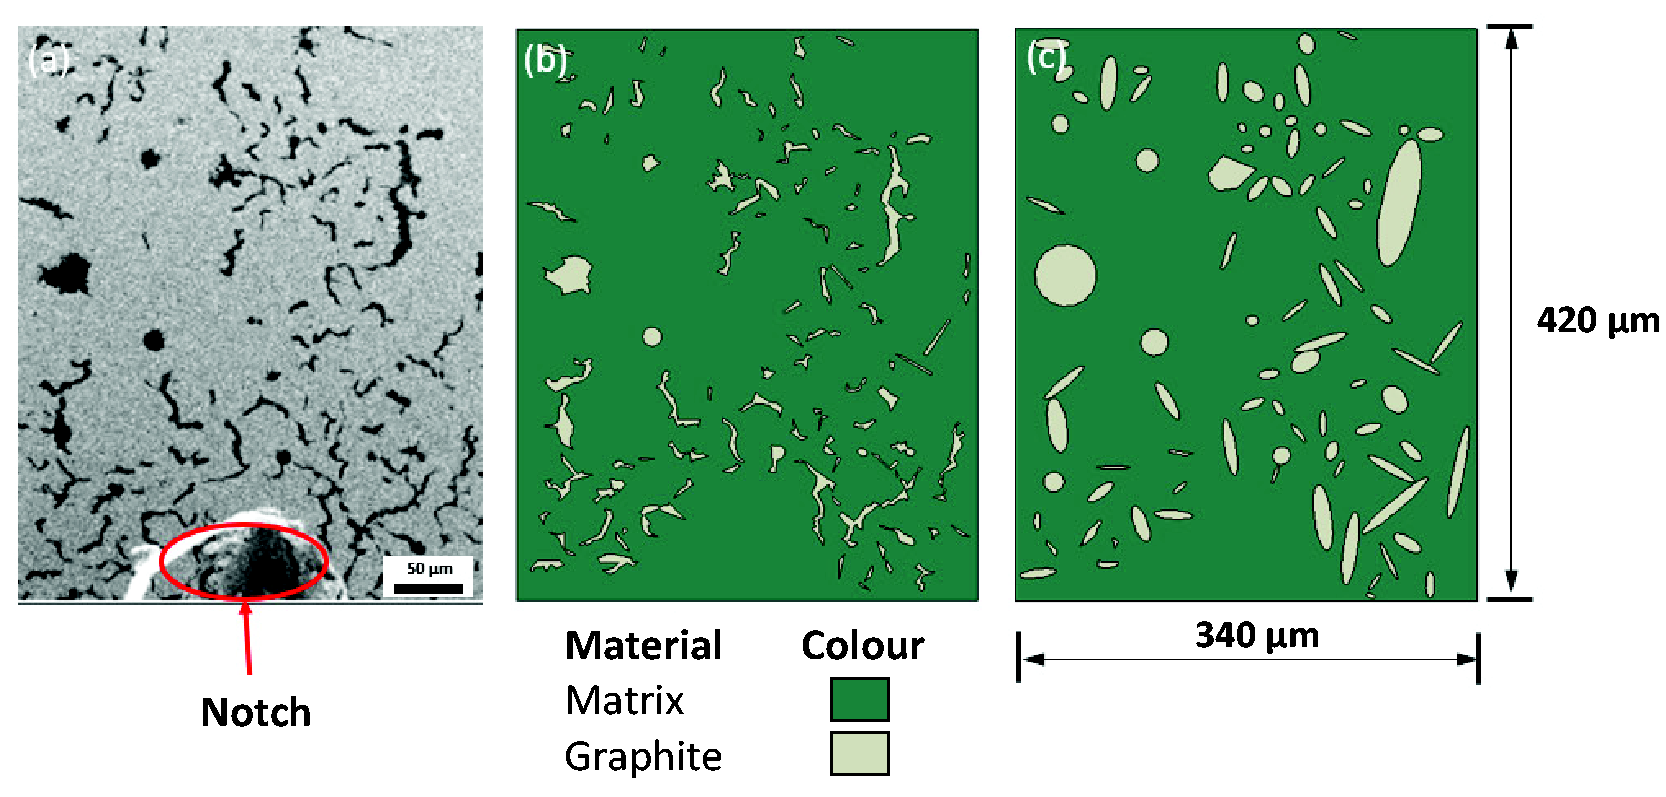
SEM micrograph of CGI (a), and reproduced microstructure in FEA model. Real (b), simplified (c) geometry of CGI microstructure.
The constructed finite element analysis (FEA) model, which was generated through this process, is shown in Figures 1(b) and (c). The width and height of the modelled domain were 340 µm and 420 µm, respectively. The volume fraction of graphite was calculated as 8%. To maintain a constant graphite volume fraction throughout, the size of the simplified graphite microstructure was based on the true image. The green colour indicates the matrix and the grey parts represent the graphite particles in CGI. Following a mesh-sensitivity study, a fine mesh (average element size of 10 µm) was applied to the entire microstructure. Triangular elements were used to mesh the RVE models as quadrilateral elements could produce sawtooth particle boundaries, resulting in stress concentration (Zhang et al., 2018). In this model, an explicit dynamic approach was employed, incorporating rate-independent material properties to address complex dynamic issues related to general contacts. The model utilised frictionless behaviour and hard contact. The model was assumed to be in plane-strain conditions in the present work. Detailed model specifications are provided in Table 1.
Model parameters.
Boundary conditions
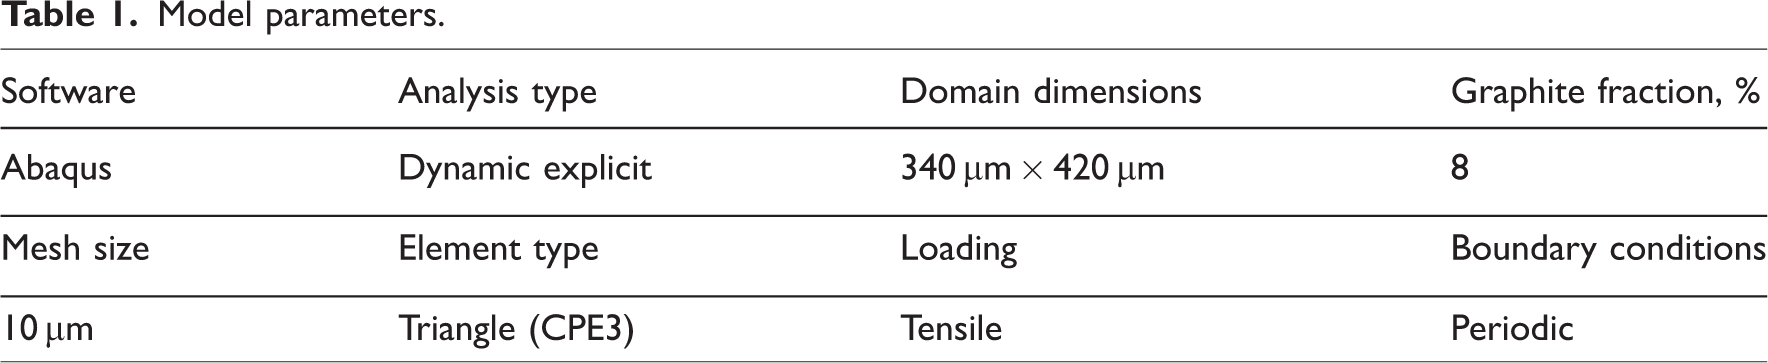
The left boundary of the model was fixed in the X-direction, while a displacement loading of 3.4 µm (equivalent to 1% strain) was applied to the right boundary of the model (Figure 2). Besides, periodic boundary conditions (PBCs) were applied to the top and bottom boundaries of the model. The PBCs employed in this study stipulate that opposite pairs of surfaces or edges should deform in the same way, which could minimise the edge effects on the border of an RVE (Okereke and Keates, 2018).
Schematics of PBCs (a) and boundary conditions (b).
By employing PBCs in simulations, the computational requirements are significantly reduced since a smaller number of particles or entities can effectively model an infinite system compared to explicitly representing it. This reduction in particle count improves the computational feasibility of the simulation. The PBCs were formulated as follows:

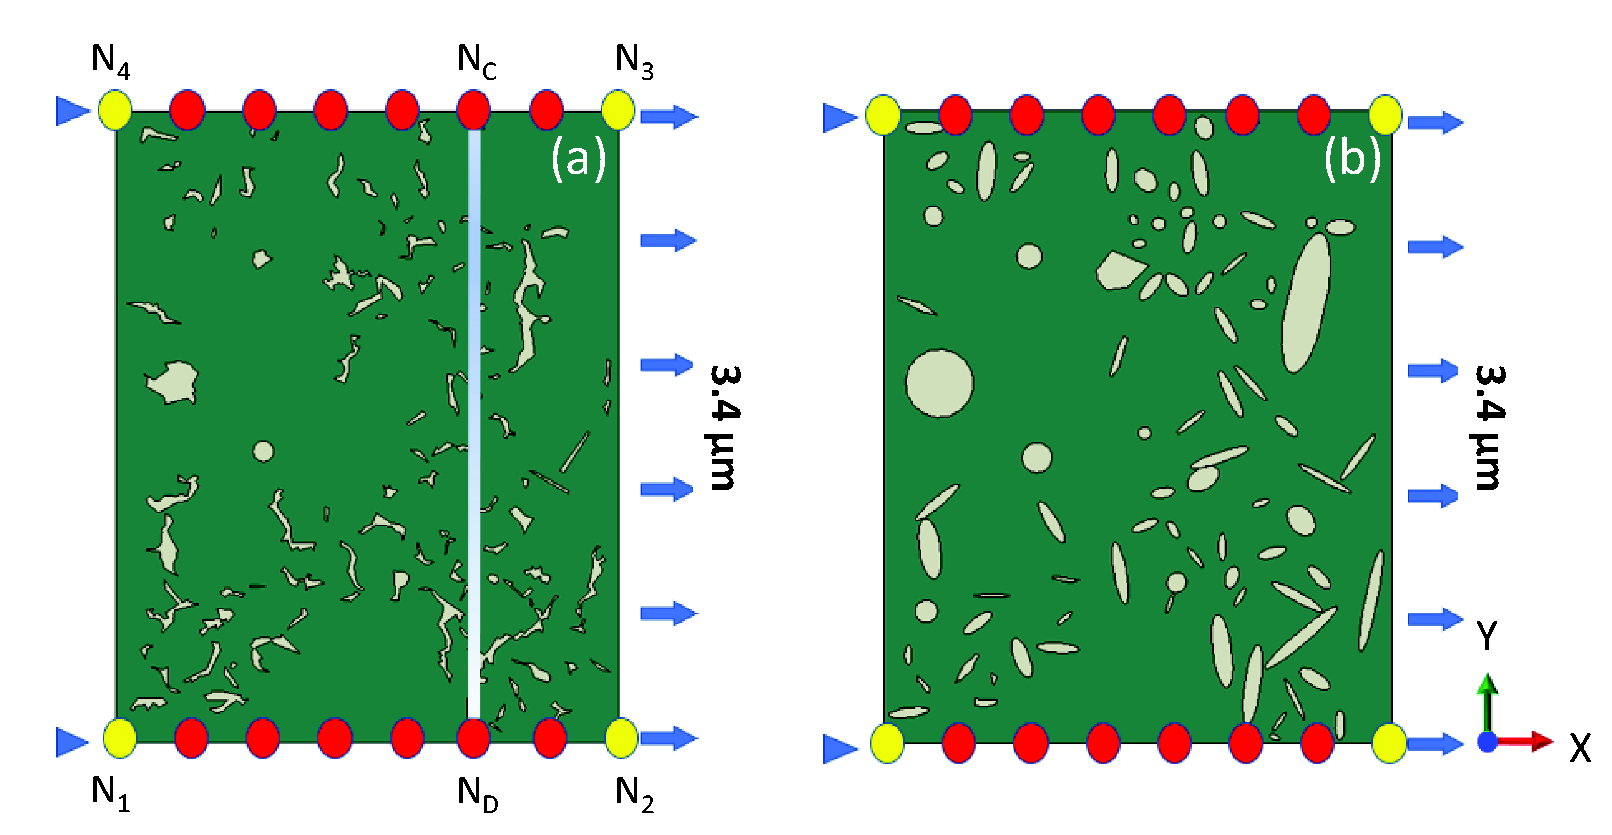
The differences between the four different models - Model I to Model IV - are illustrated in Figure 3: Model I had two sets of material properties for its two domains, with the ductile-damage approach considered only for graphite. In Model II, the JC damage model was used for the matrix and the ductile damage model in graphite, while in Model III the cohesive damage models were employed for the matrix, the graphite particles, and the interface. Besides, an upgraded version of Model II was used in Model IV, with a cohesive interface between the graphite inclusions and the matrix. In order to reduce the computational cost, the simplified microstructure was used in this study.
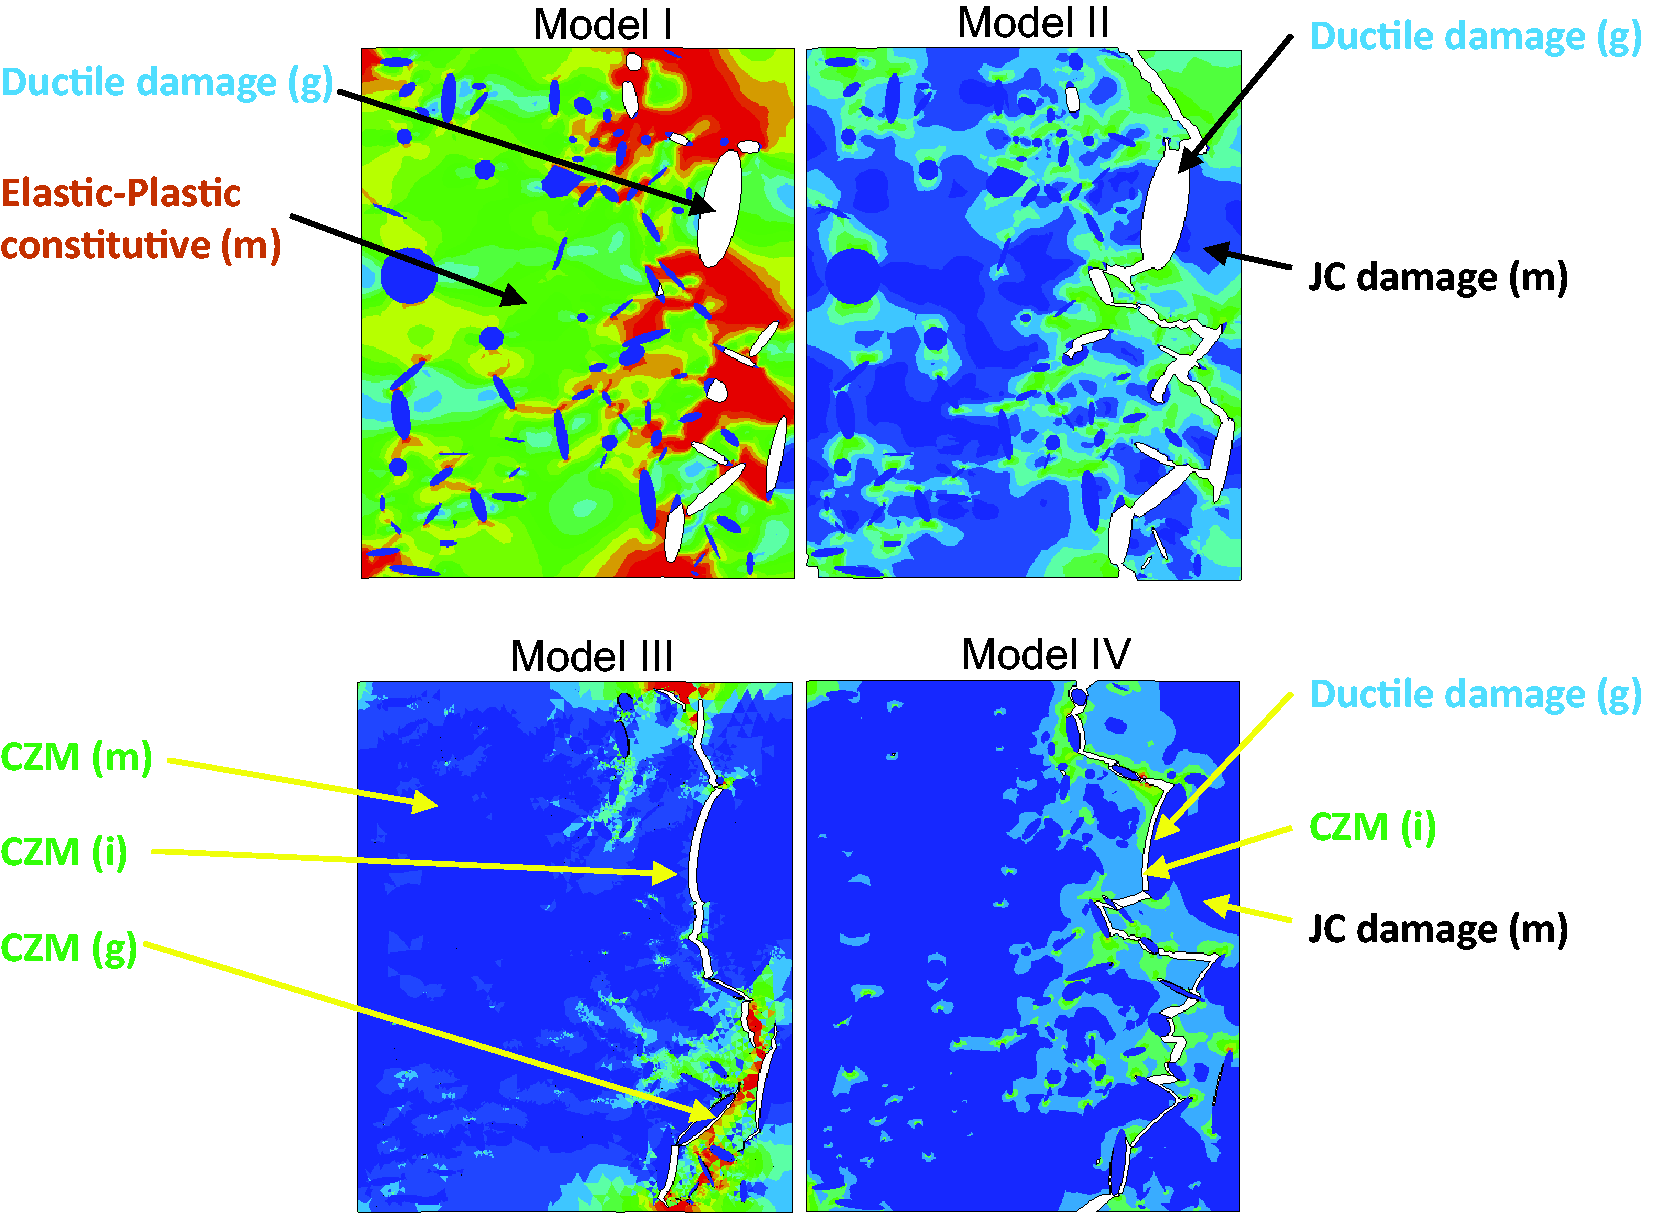
Illustration of four different models (g - graphite, i - interface, m - matrix).
Constitutive relations
Material properties
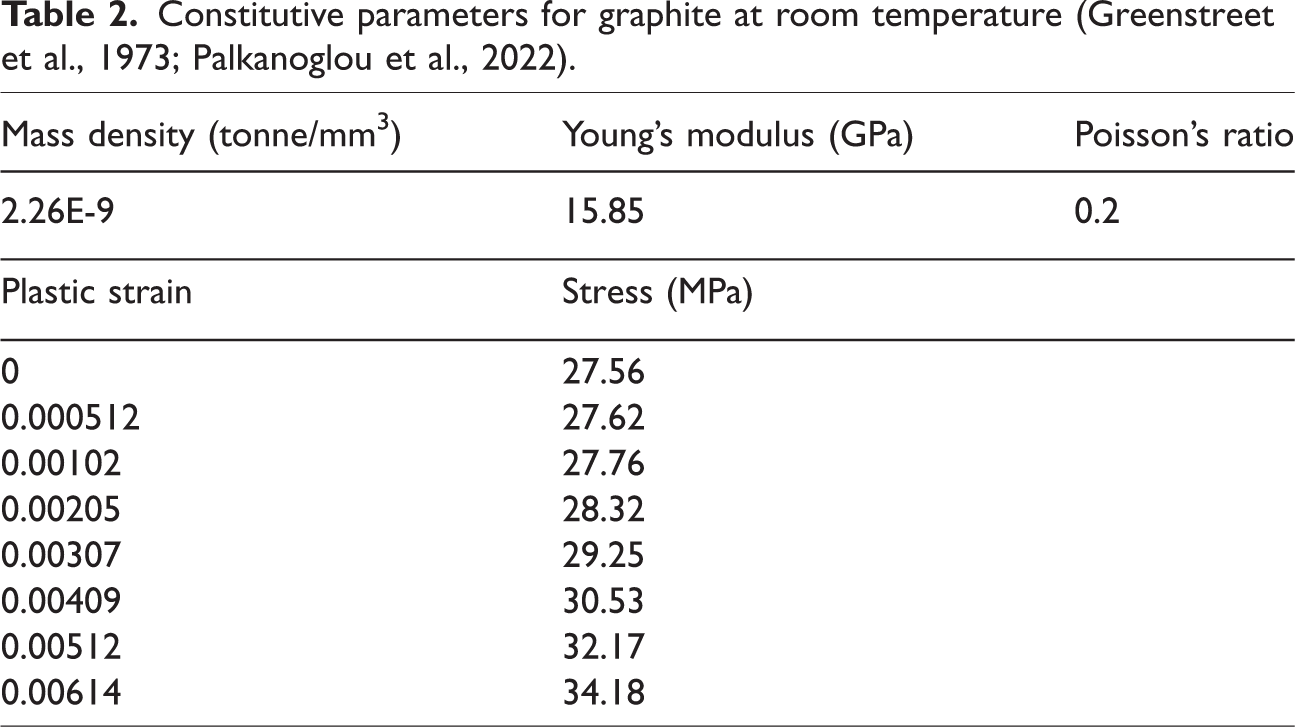
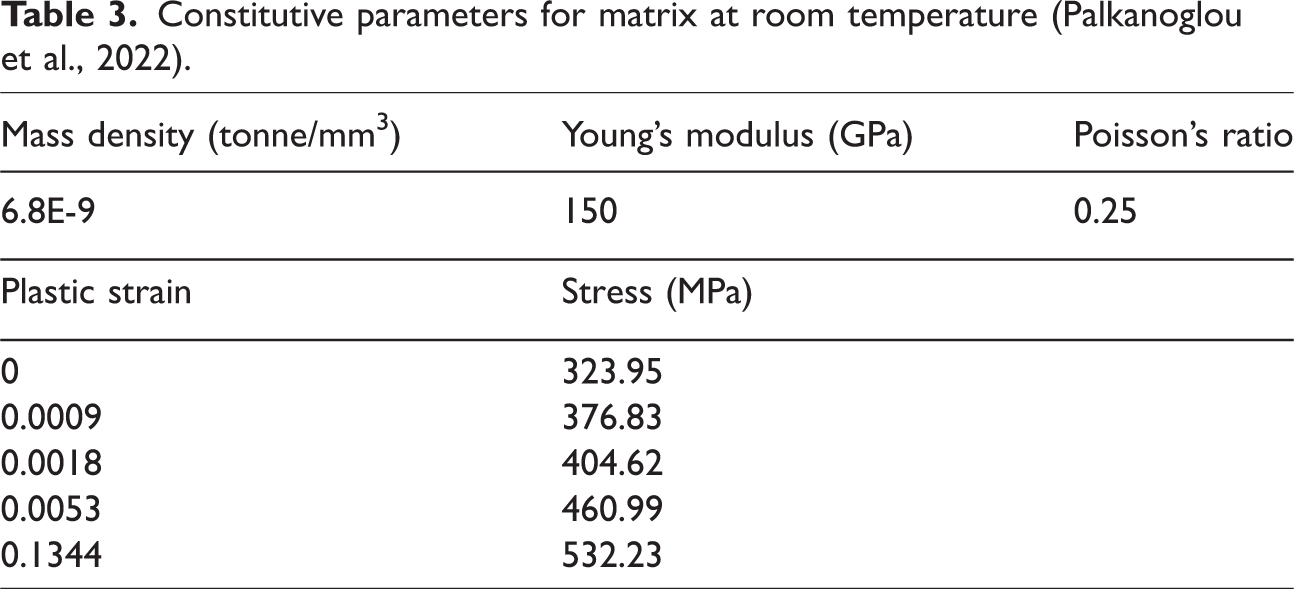
Tables 2 and 3 list the constitutive parameters of graphite and matrix, respectively, identified by mechanical tests (Palkanoglou et al., 2022). An elastoplastic constitutive law and isotropic behaviour were assumed for the metallic matrix and graphite particles. Generally, the damage and fracture behaviours of a material can be significantly influenced by its microstructural features. Dynamic analysis allows for a better investigation of the interaction of these microstructural elements with the applied loading and its effect on the overall response. The crack growth and energy dissipation within the RVE can be studied by considering the dynamic response (Beskou and Muho, 2022).
Constitutive parameters for graphite at room temperature (Greenstreet et al., 1973; Palkanoglou et al., 2022).
Constitutive parameters for matrix at room temperature (Palkanoglou et al., 2022).
Ductile damage model
The ductile criterion serves as a phenomenological framework to forecast the initiation of damage resulting from the formation, expansion, and merging of voids. An elastic constitutive law is described using tensorial notation as follows:

The decomposition of total strain 
Assuming an isotropic hardening response, the yield function can be introduced as

Cohesive damage model
The principle of cohesive-zone modelling employed in this study was to use traction-displacement relations to describe the onset and growth of damage along the inclusion-matrix interface (Ghosh, 2011), as shown in Figure 4.
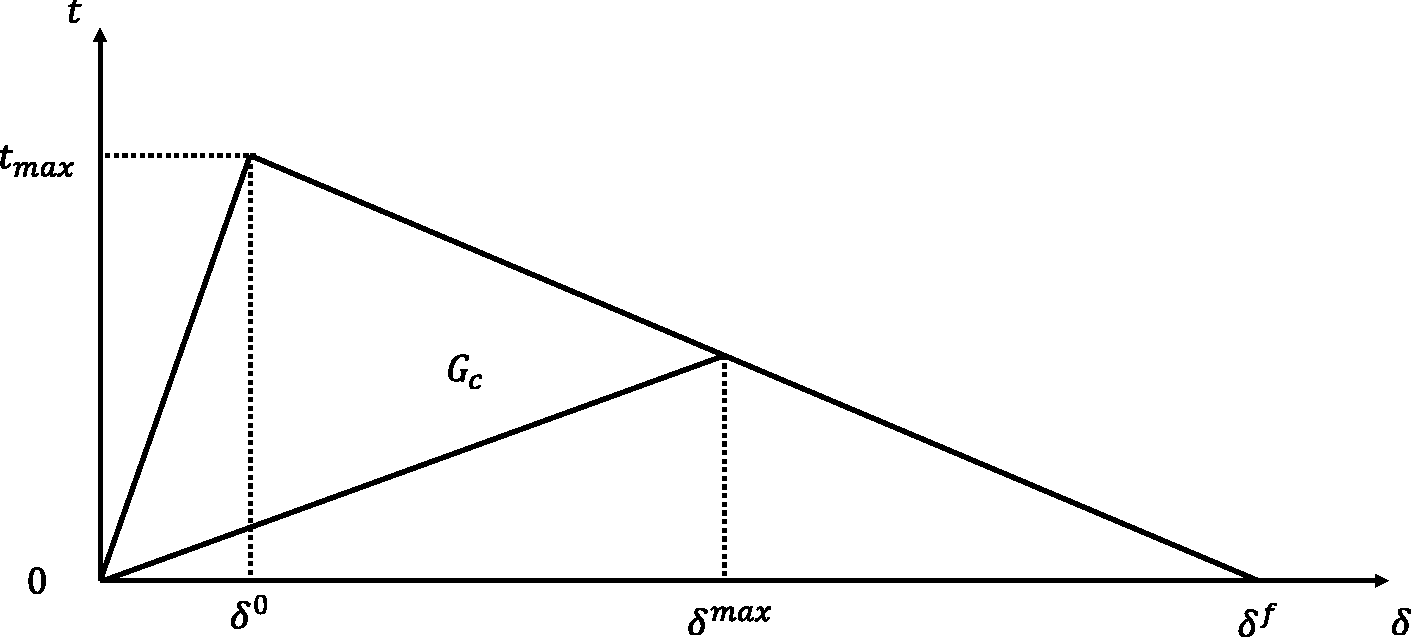
Traction-separation relationship.
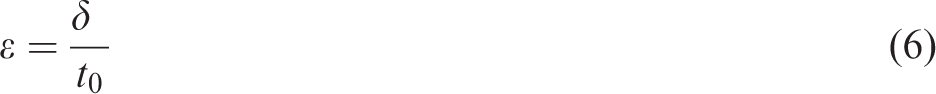
The nominal strain in the cohesive element is defined as (Pan and Chen, 2019)
The fracture energy 

Interfacial debonding and stress concentration in CGI can lead to crack initiation at the sharp edges of graphite particles. The crack then can propagate along the interface between graphite and the matrix (Qiu et al., 2016b) or within the matrix domain. The following damage criterion was applied to the cohesive zone element:
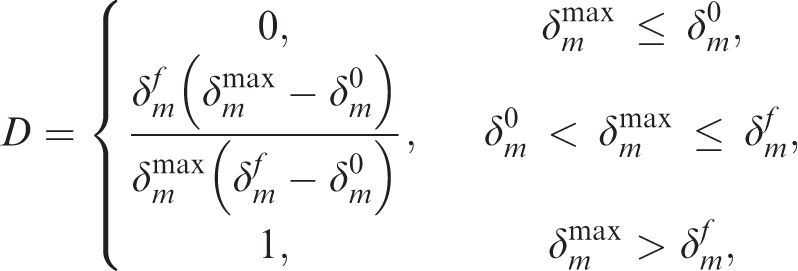


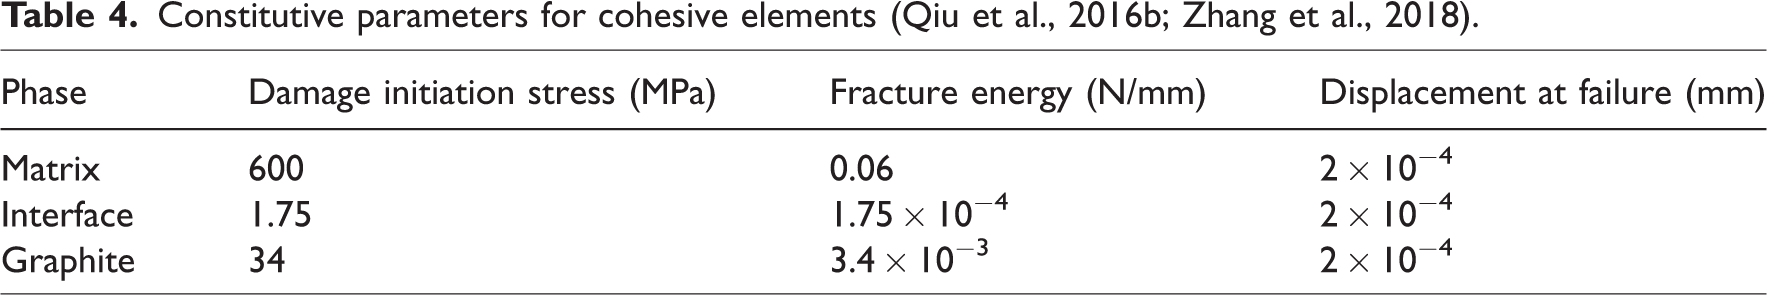
The cohesive-model constitutive parameters used in this study are shown in Table 4. They include damage-initiation stress
Constitutive parameters for cohesive elements (Qiu et al., 2016b; Zhang et al., 2018).
Zero-thickness cohesive elements were used in this simulation. When a cohesive element reaches the initial cracking criterion, it enters the damage-evolution stage and eventually undergoes a complete failure. In a 2D cohesive element model, the four nodes are numbered so that nodes 1 and 4 are located on the side of the crack, while nodes 2 and 3 are located on its other side. Therefore, the crack length can be represented by the distance between the midpoints of nodes 1 and 2 and nodes 3 and 4. The value of the damage-field variable is related to the failure of the element according to equation (9). If it fails, the length of the crack can be added to that of the existing crack, thus obtaining the overall crack length of the model.
Various types of softening behaviour and stiffness degradation in the damage evolution models can cause serious convergence issues in the solution process. To overcome this, a viscosity coefficient was applied to cohesive elements to regularise the traction-separation laws. The evolution equation defines a viscous stiffness degradation variable, 

A small value (10−6) of viscous regularisation was used to improve the rate of convergence in the softening regime.
Johnson-Cook damage model
The Johnson-Cook (JC) constitutive model was proposed in 1985 to model large plastic deformations and fracture behaviours of material (Johnson and Cook, 1983). Strain hardening, strain-rate effects, and thermal softening are three key material responses in the JC constitutive model. In the context of isotropic hardening, JC hardening is a specific type, with the static yield stress, 
The JC strain-rate dependence (Johnson and Cook, 1983) assumes that


However, for simplification, 
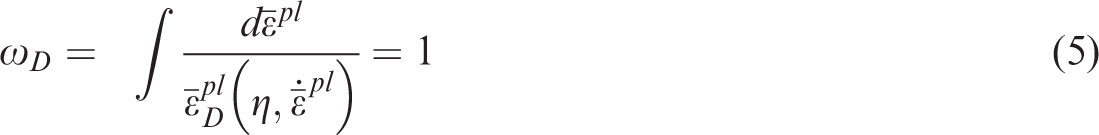
The JC dynamic failure model offers an approach designed specifically for the JC plasticity model, tailored for the high-strain-rate deformation of metallic materials in Abaqus/explicit. The JC dynamic failure model is based on the value of the equivalent plastic strain at the element’s integration points; failure is assumed to occur when the damage parameter exceeds 1. The damage parameter, 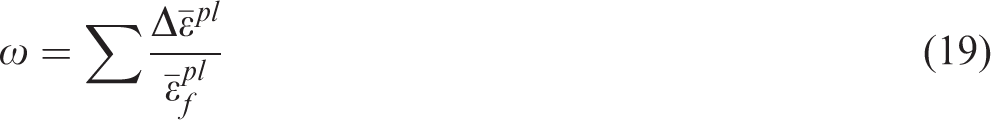

The strain at failure,
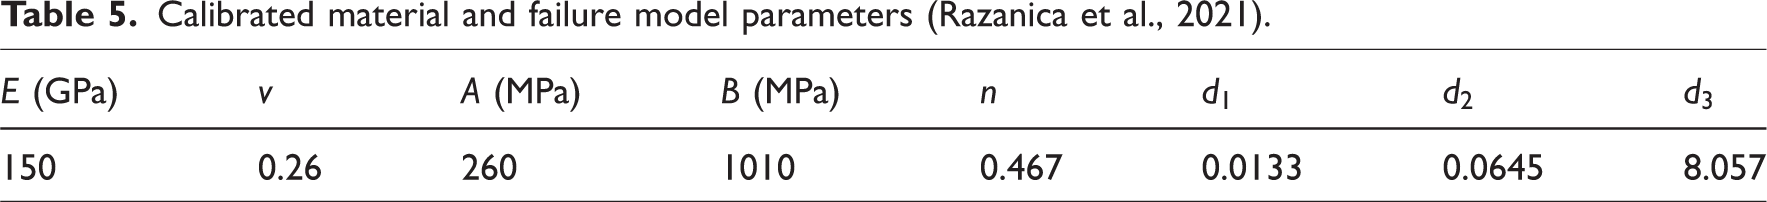
The material behaviour of CGI was assumed to be isotropic elastic-plastic, and modelled using the isotropic plasticity model available in Abaqus/explicit code. The material properties of CGI are summarised in Table 5.
Calibrated material and failure model parameters (Razanica et al., 2021).

Experiment-based validation
CGI specimens (EN-GJV-450) were subjected to tensile loading at room temperature. The geometry of the 0.5 mm-thick coupons is given in Figure 5(a); these were cut using an electric discharge machine (EDM). Following the machining process, the in situ specimens underwent mounting and grinding with abrasives of 75 µm, 35 µm, and 15 µm. Subsequently, a polishing turntable with varying abrasive sizes, ranging from 9 µm to less than 1 µm, was employed to polish the samples. Then, the microstructural analysis of CGI was conducted using a Zeiss Merlin FE-SEM equipped with a Deben MT5000 microtensile stage. After a 30-minute wait under a vacuum, in situ tensile strain was applied. The movement speed of the load head was set as 0.1 mm/min. An SEM image of the microstructure was obtained with the FESEM (Figure 5(b)).
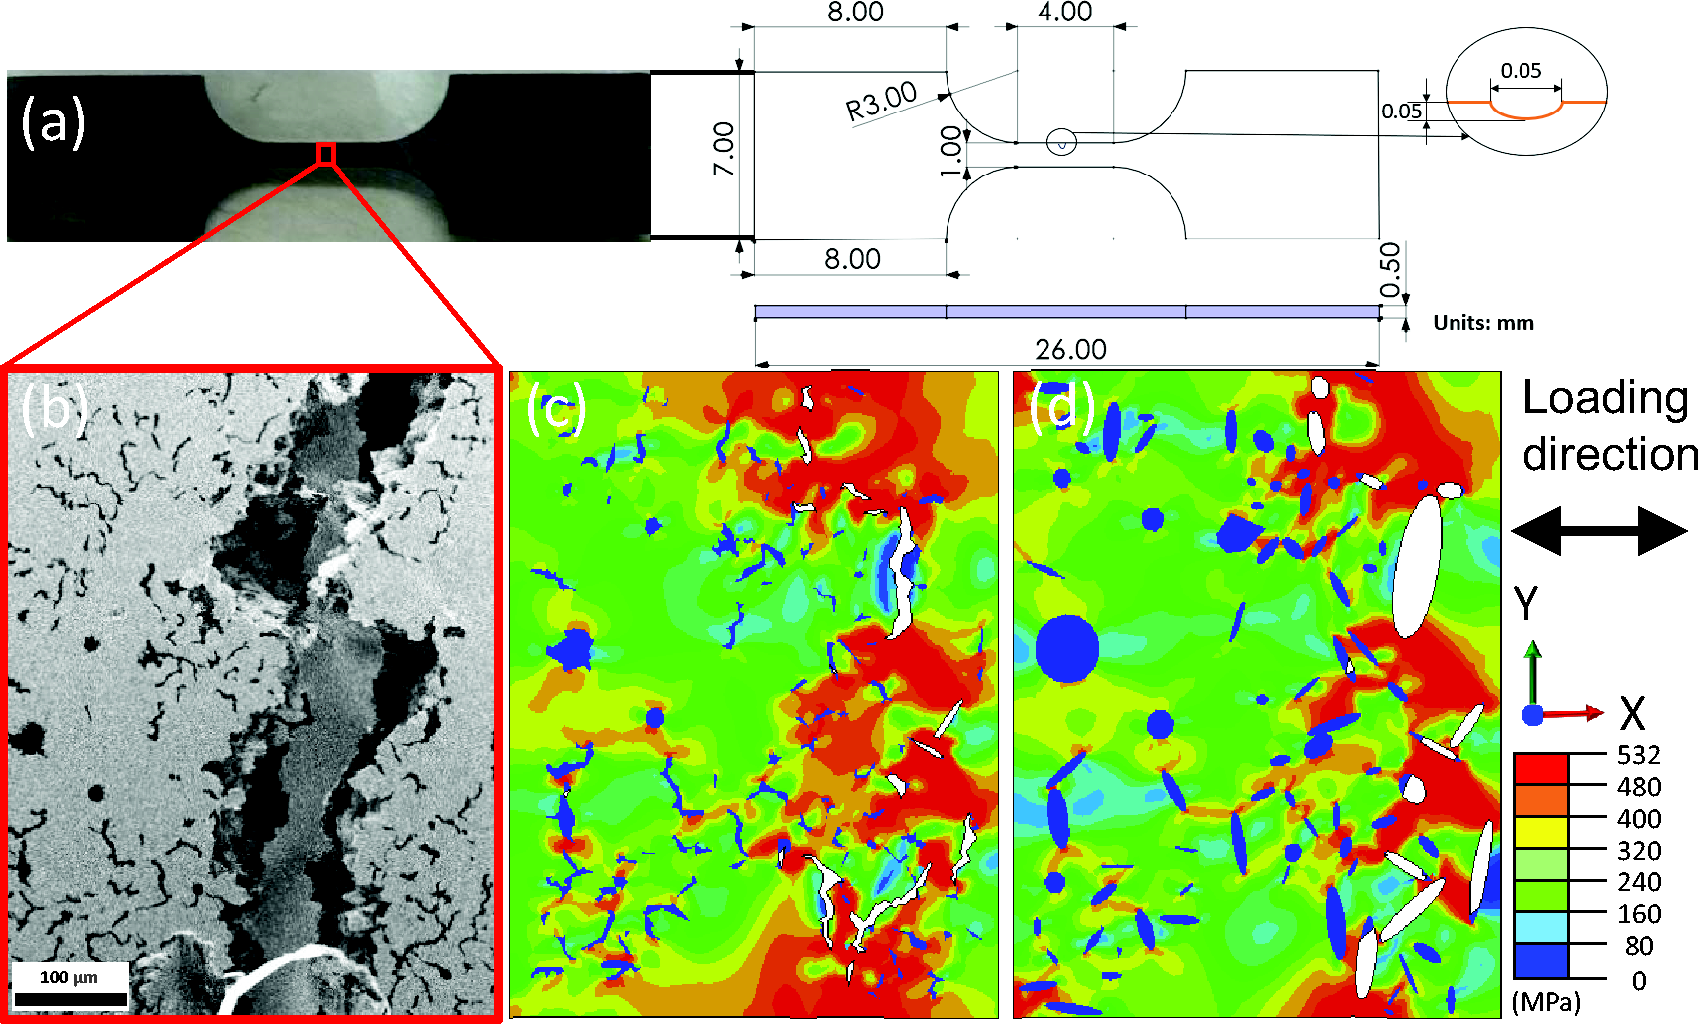
Geometry of tensile specimen (a). Microstructural morphology and corresponding numerical results for tensile loading: (b) microstructure after in situ experiment; numerical results for real (c) and simplified (d) microstructures. White parts represent graphite particles damaged under tensile loading.
One numerical model adopted the graphite-particle shapes similar to those in the experiment, as illustrated in Figure 5(c). A good agreement for the fracture path was obtained, demonstrating the effectiveness of the current model in simulating the fracture process of CGI. The complex shapes of graphite particles were simplified into ellipses using the ImageJ software. The introduction of the actual geometry of the particles could cause substantial changes in the local geometrical features of the inclusions, placing considerable demands on computational resources due to the need for a significantly finer mesh. This would obviously affect the local behaviour but complicate the analysis of various factors and their effects on the mesoscale deformation and fracture processes in CGI. At the scale of interest for crack initiation and propagation (10 µm), the character of stress distribution in both models was close (see also Figure 8 and respective discussion). Additionally, the simplified model is essential for parametric studies based on generation of the artificial structures with random microstructure, performed in another study by the authors on this material (Luo et al., 2024c). Stress concentrations were caused by the cracking of graphite particles. Generally, cracks often propagated perpendicular to the tensile direction. In order to quantitatively validate this model, the stress-strain curves obtained from the experiments and the numerical results were compared (Figure 6). The black curve denotes the experimental results on standard specimens by Joshi et al. (2023), while the red and green curves represent the numerical results. The plastic phase of the material was in good agreement with the experiment; however, engineering stresses for both models were higher than that in the experimental data after the engineering strain reached 0.2%. One possible explanation for this mismatch is that the 0.2% proof stress was applied to this model, commonly done for ductile metals when it is difficult to define and calculate the yield stress (Rasmussen, 2003). Another reason is that PBCs imposed additional kinematic constraints between elements, which increased the engineering stress in this model. Obviously, the volume of the tested material in the in situ experiments was much smaller than that in Joshi et al. (2023).
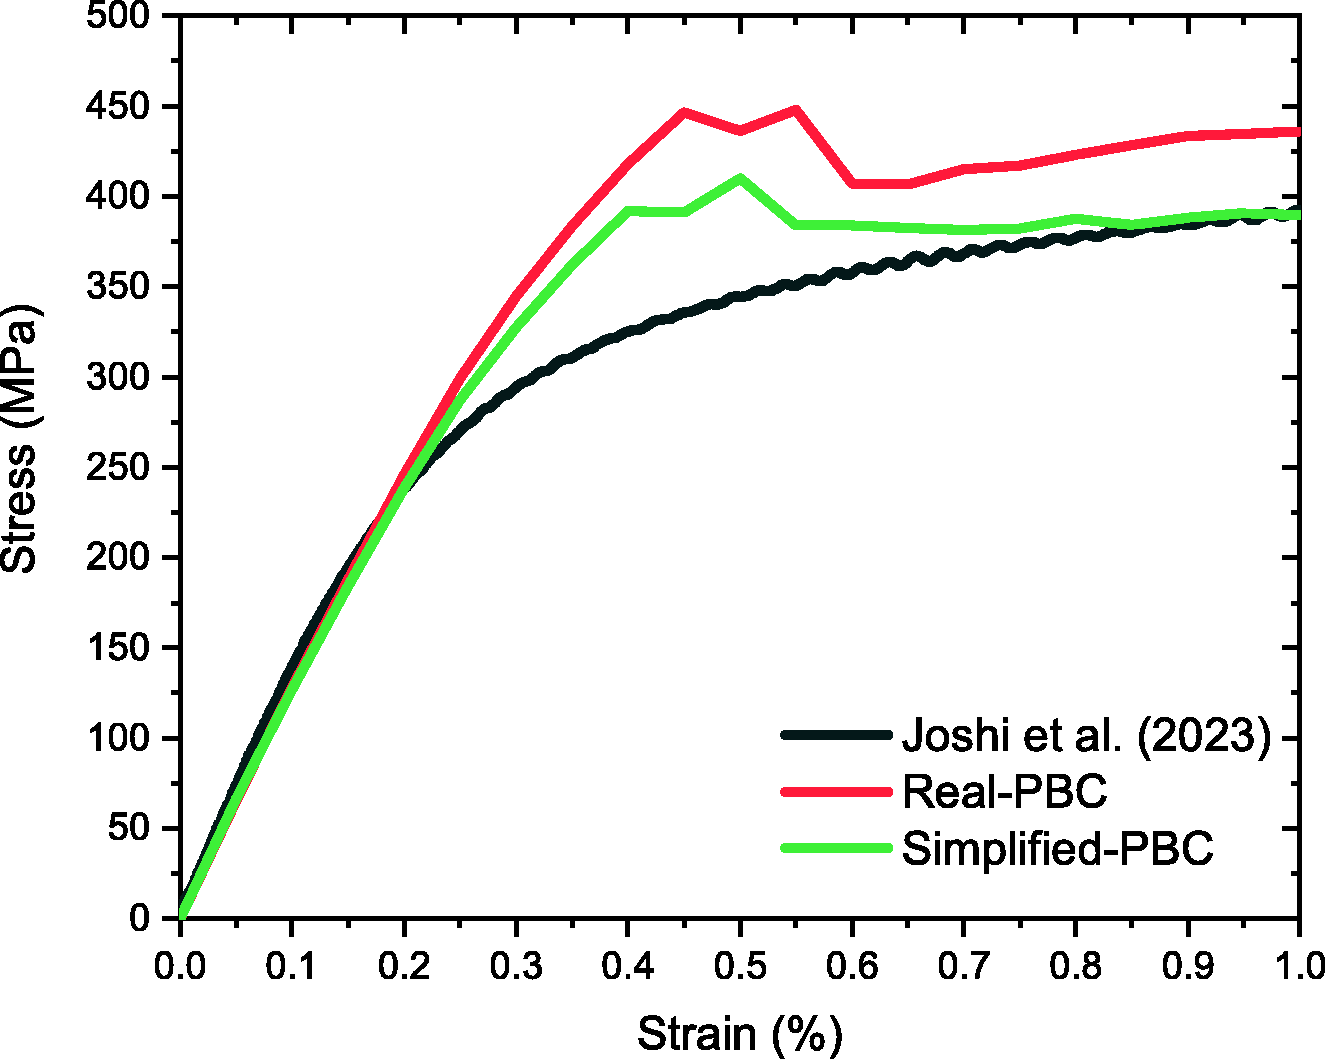
Stress-strain curves of macroscopic experiment (Joshi et al., 2023) and numerical results (this study).
Further, the in situ observation of the damage and fracture evolution in CGI was analysed (Figure 7). Figure 7(a) illustrates the stress-strain values during the in situ tensile test. The microstructure of CGI at a strain level of 0.5%, where graphite interface debonding was observed in other studies (Qiu et al., 2016b), is shown in Figure 7(b). A somewhat softer mechanical response observed in our experiments in comparison to other experimental data (Joshi et al., 2023) was due to the size effects as small-scale testing might not fully represent the macroscopic material’s stress-strain behaviour.
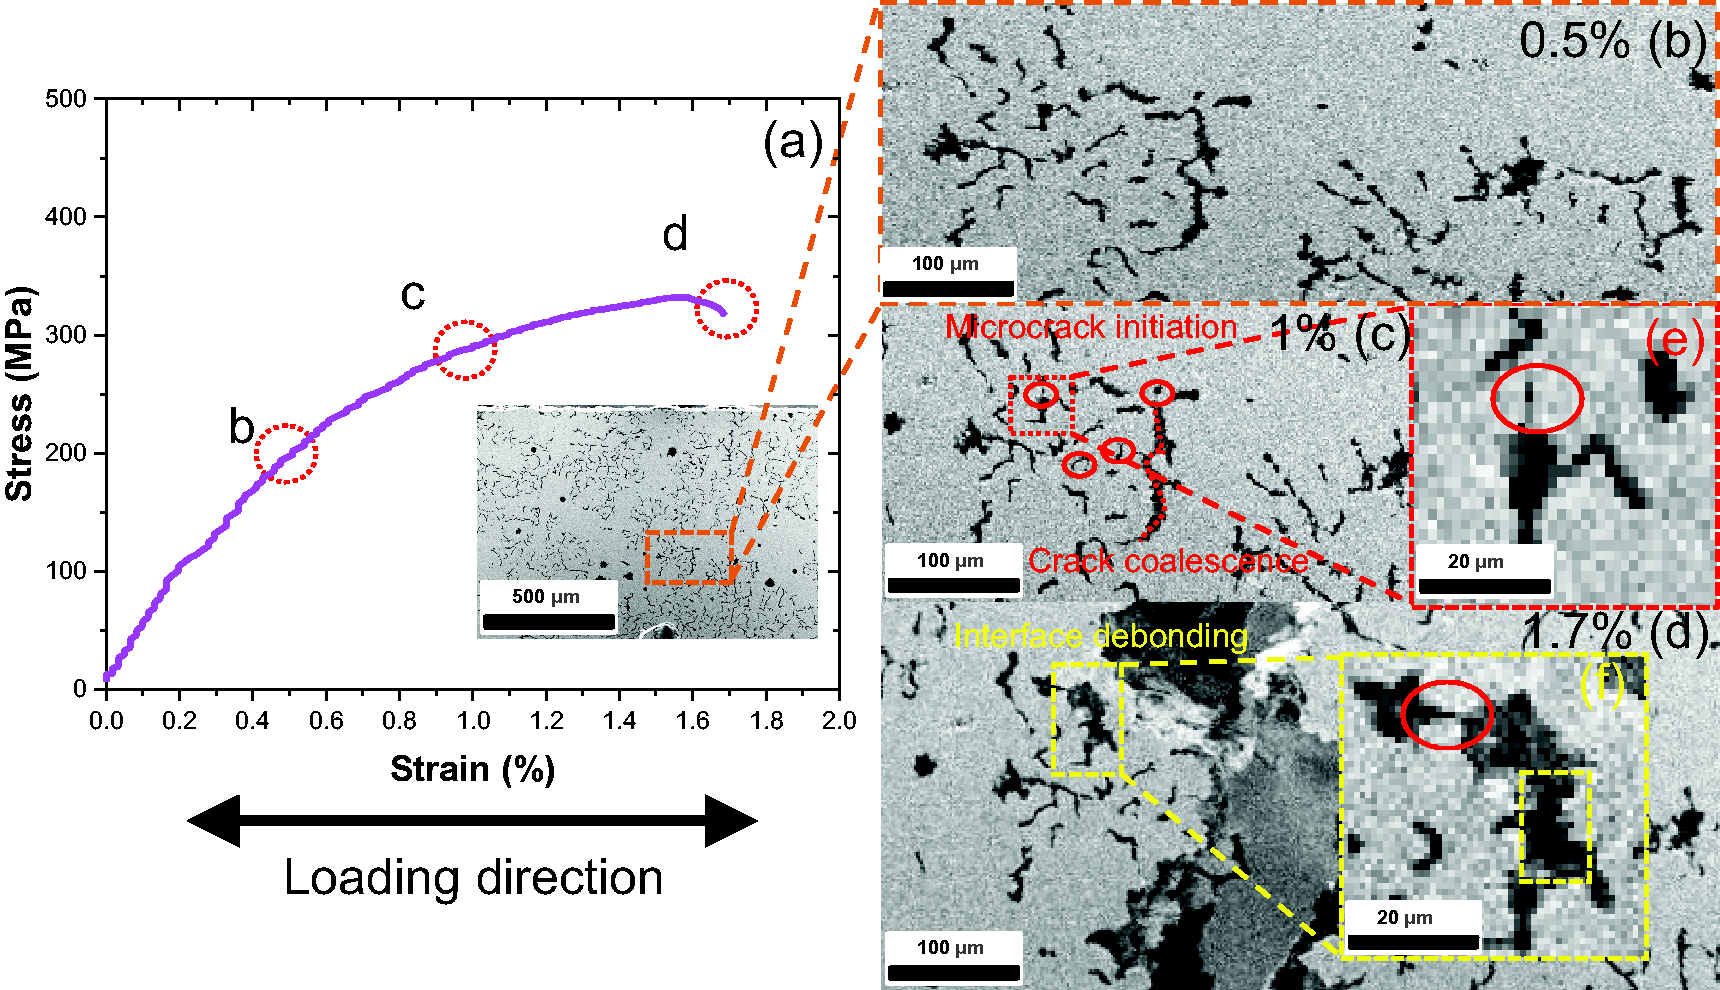
In situ observation of tensile fracture behaviour of CGI at room temperature: (a) stress-strain curve for CGI; microstructure of CGI at strain levels of 0.5% (b), 1% (c), and 1.7% (d); (e) zoom in of microcrack initiation (red) at position of Figure 6(c) and (f) zoom in of interface debonding (yellow) at position of Figure 6(d).
Contrary to these studies, there was no evident interface debonding observed in our experiments for this strain level. As the emphasis of this work was on studying the comprehensive crack propagation path and rate, the field of view was set to observe the entire specimen and, therefore, the resolution was not sufficient enough to resolve graphite debonding. With further tensile loading, when the strain reached 1%, microcrack initiation and crack coalescence were observed (microscopic cracks highlighted in red circles and crack coalescence highlighted with the red dotted line (in Figure 7(c)), which is in good agreement with Qiu et al. (2016b)). Finally, when the specimen was completely fractured (at 1.7% strain), distinct interface debonding (in yellow) and small cracks (b) could be identified (Figure 7(d)).
Results and discussion
Effect of boundary conditions
Periodic boundary conditions are widely used in RVE-based simulations and unit-cell models with random microstructures (Nguyen et al., 2012). Consequently, the effect of boundary conditions in both models with real and simplified microstructures is discussed in this section. Apart from the effect of PBCs on the stiffness of materials, the influence of boundary conditions on the onset of graphite degradation was also studied. In total, four different models were studied: model (a) based on the real microstructure but without PBCs, model (b) with a simplified microstructure and also without PBCs, while models (c) and (d) introduced PBCs, considering the real and the simplified microstructures, respectively. The Model I approach was used in this part of the study together with different approximations for the graphite morphology. Therefore, only the damage inside the graphite particles and the stress concentration in the matrix, which indicates the potential crack initiation area, can be observed (Figure 8). As discussed, the simplified RVE model required a significantly lower computational effort, but still captured the main features of the mesoscale stress distributions, especially for PBCs (see Figures 8(c) and (d)).
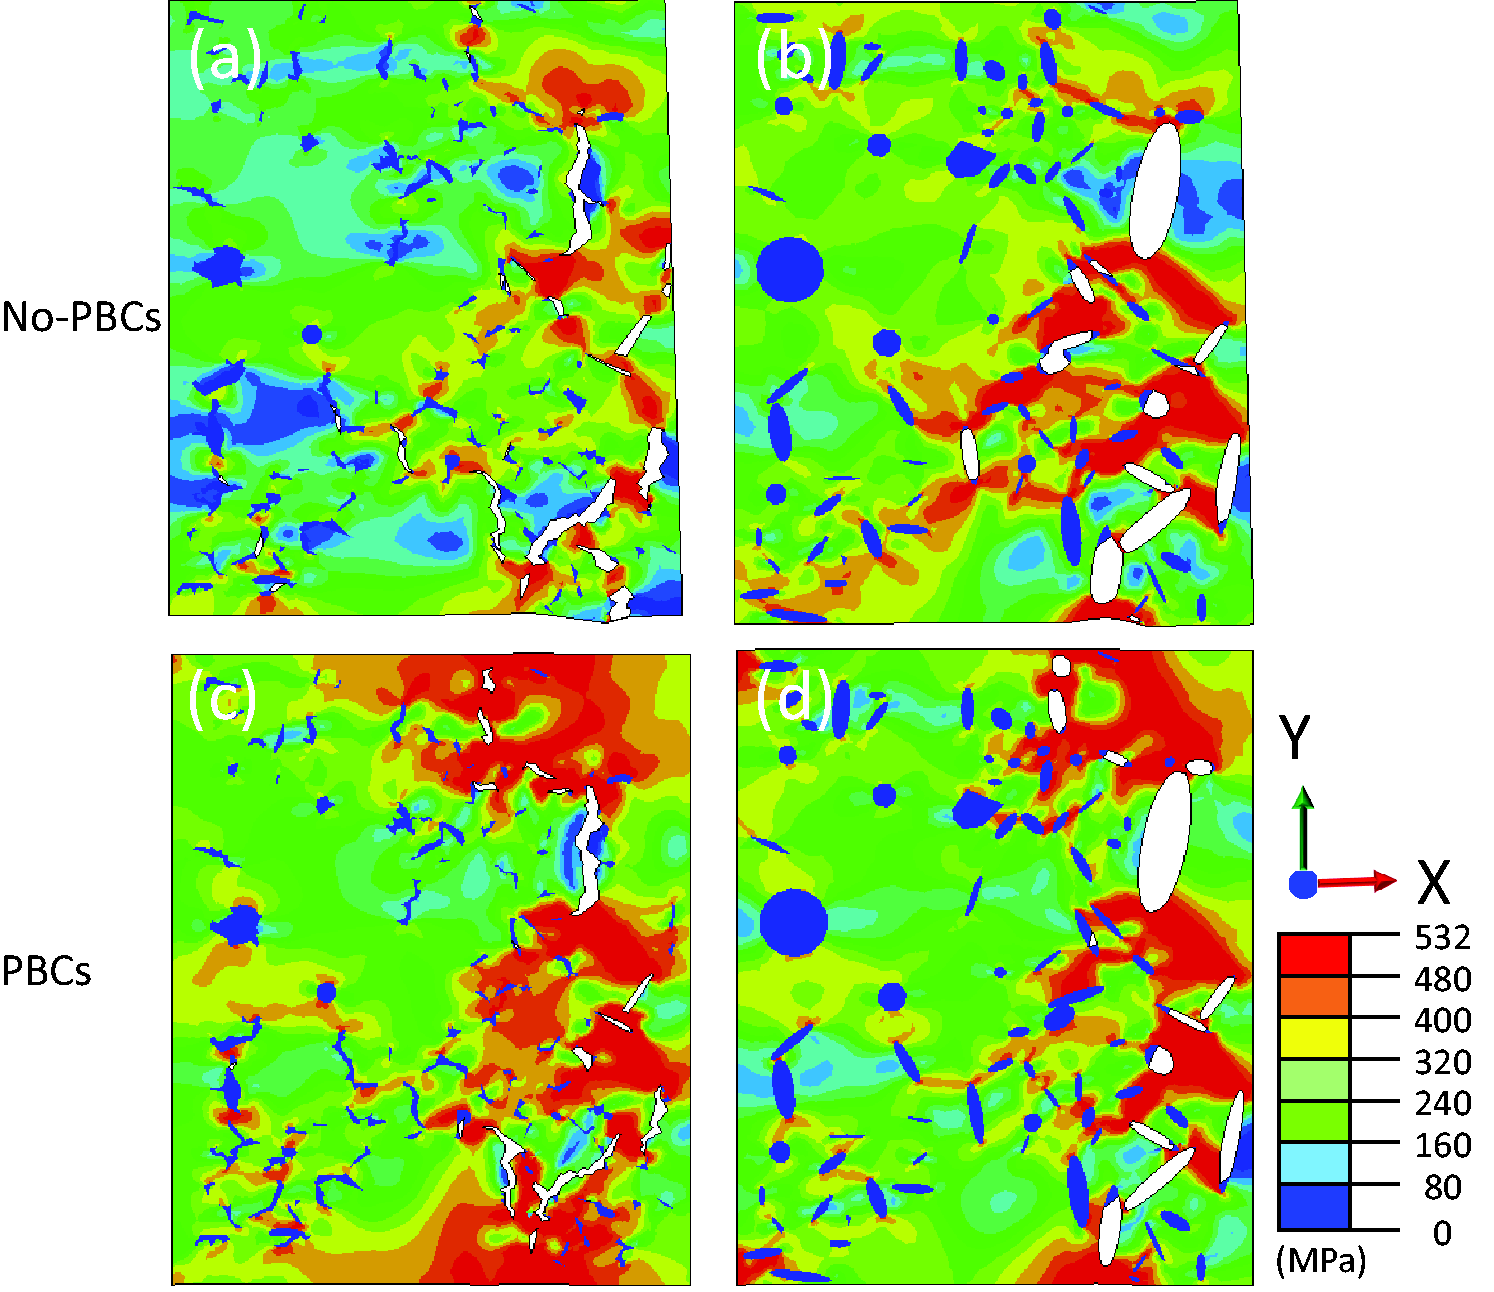
Contour plots of von Mises stress distribution under tensile loading at 1% strain for various models: (a) real microstructure without PBCs; (b) simplified microstructure without PBCs; (c) real microstructure with PBCs and (d) simplified microstructure with PBCs.
The von Mises stress distribution under tensile loading at 1% applied strain is shown in Figure 8. It is noted that the stress concentrations generated due to the matrix and graphite debonding are in good agreement with the experimental results in Norman and Calmunger (2019).
Further, the graphite degradation level (
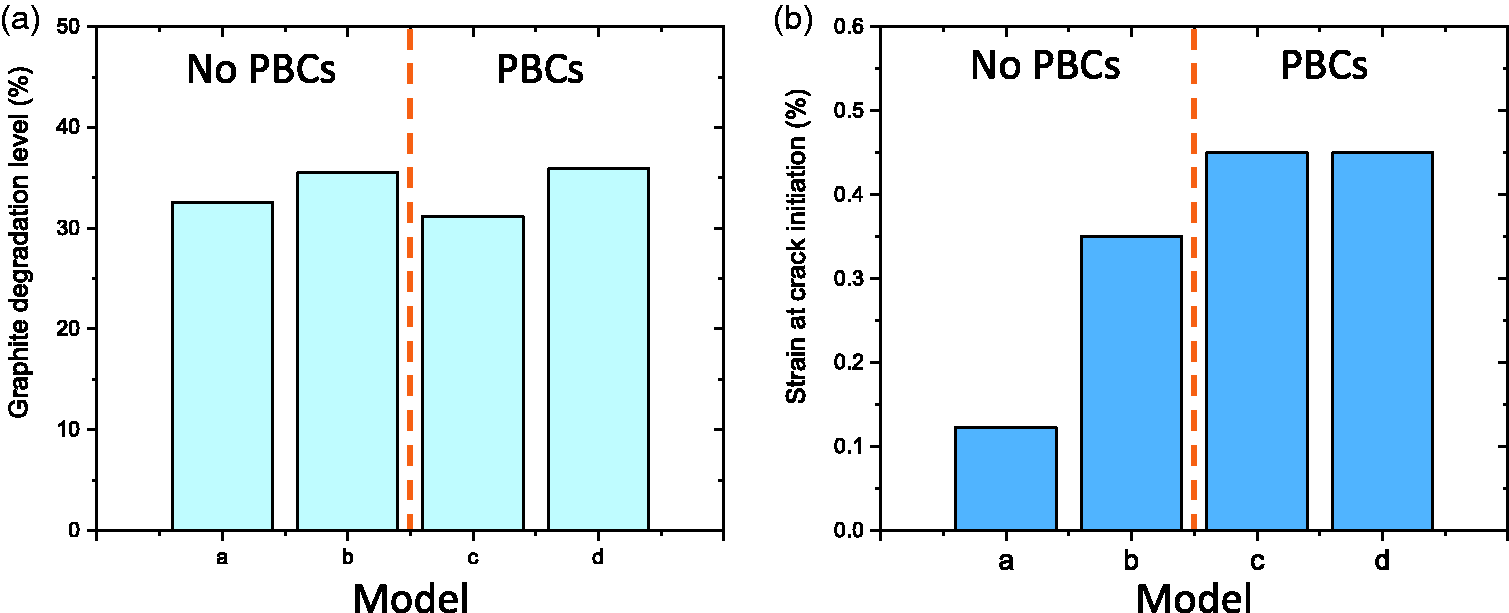
Effect of different boundary conditions for four models and two different approaches to boundary conditions (see model notation in Figure 8).
The stress-strain curve for different boundary conditions is presented in Figure 10, with the experimental response denoted in black (Joshi et al., 2023). The absence of a linear part was mainly caused by the successive loss in load-carrying capacity of the graphite phase due to debonding (Weng et al., 2019). Compared to the experimental data, both the Young’s modulus and stiffness were lower than the experimental values for the model that does not incorporate PBCs. PBCs yielded significantly higher values both for the material’s stiffness and Young’s modulus, as shown in Figure 10. The model with the real morphology and PBCs showed the highest peak stress at a strain of 0.4% and the Young’s modulus was approximately 133 MPa, which is similar to the results of model (d) (simplified microstructure with PBCs). Overall, PBCs can be used to simulate systems with periodic structures, which closely resemble real-world materials and systems.
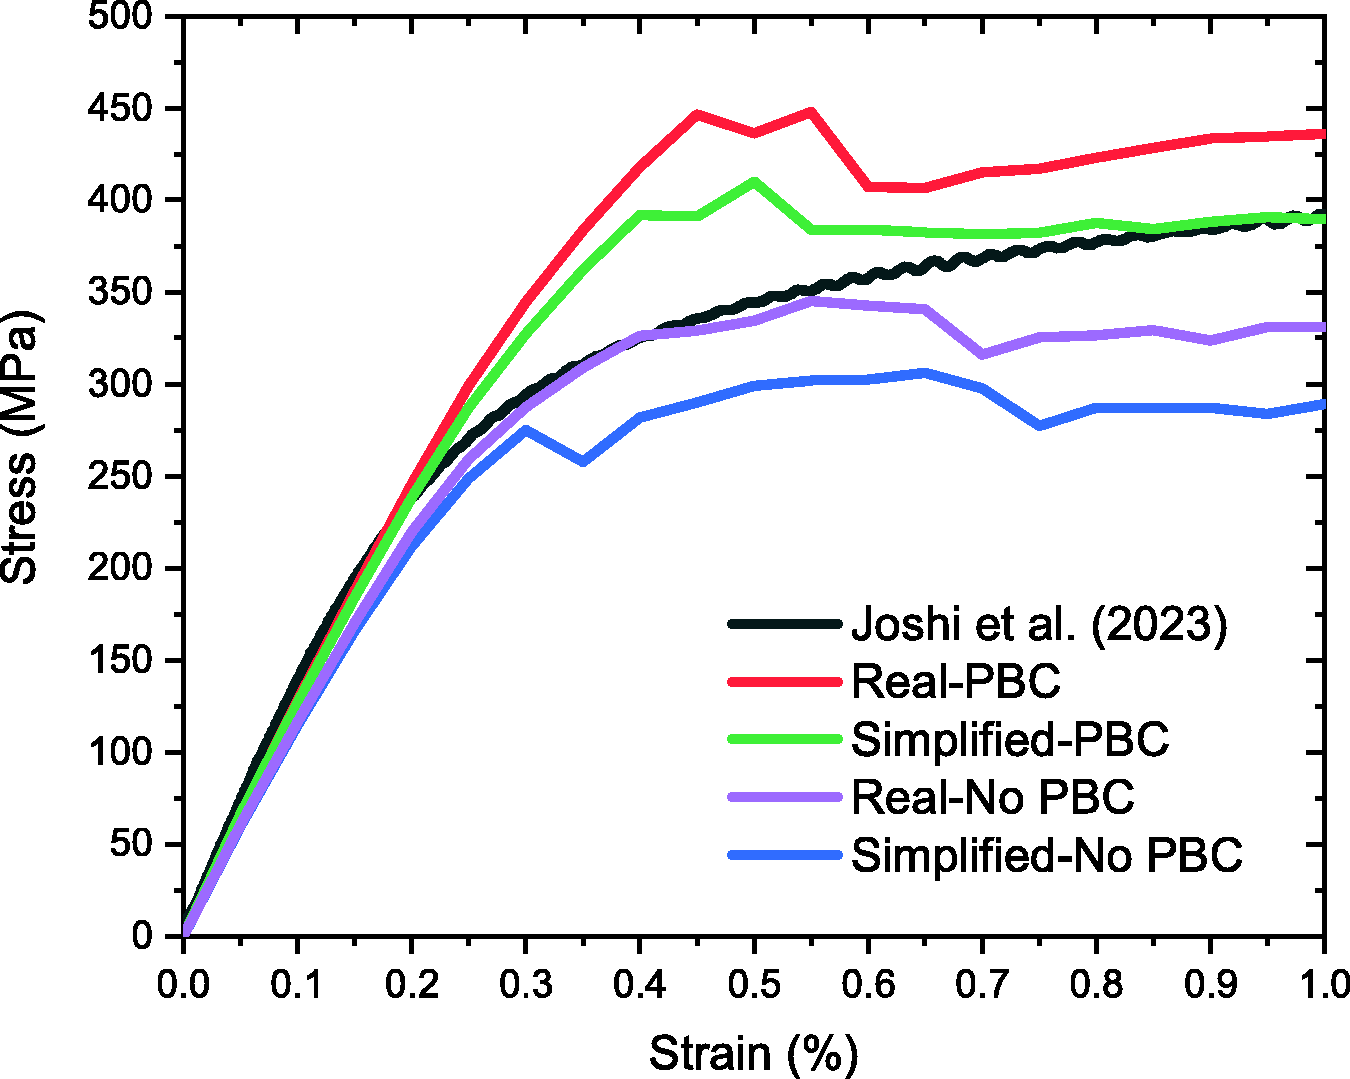
Stress-strain curves for different boundary conditions.
Comparison of damage models
Figure 11 depicts the crack initiation and propagation and mechanical responses for the four different damage methods used in Models I-IV. The crack propagation direction is indicated by yellow arrows in Figure 11. The yellow arrows with numbers 1 and 2 show the crack-initiation point and the crack propagation direction, respectively, while number 3 is the end of the crack propagation. As plastic deformation accumulated, damage was initiated within the graphite particles, adjacent to the graphite/matrix interfaces. Damage within the inclusions progressed along potential paths of higher plastic strain at various locations with distributed graphite particles and simultaneously in several graphite/matrix interface regions. The stress concentration in all the models was at both sides of the vermicular graphite, with the highest local stress in Models I and III equal to 532 MPa, whereas in Model II it was 380 MPa. In these four models, small matrix bridges between the neighbouring inclusions facilitated the concentration of high stress. The smaller these matrix bridges, the higher the stress concentration in that area (Mohammed et al., 2011). In general, no cracks occurred in the left-hand part of the models. The calculated crack paths in the top region of the model were in reasonable agreement with the in situ observations. Although the crack paths in the bottom region deviated from the experimental findings, it was likely due to the limitations of the 2D approach, not accounting for the microstructure of the layers underneath the studied domain. In this study, the crack propagation in the models followed rather the path of the secondary crack while its growth in the experiments was overtaken by that of the main crack (Figure 11(e)). In the in situ experiment, the potential presence of the large inclusion inside the specimen but without any trace on the observed (and modelled) surface could cause the change in the crack-propagation direction. Still, the obtained numerical results confirm that the 2D simplified model had a reasonable ability to predict the initiation and propagation of cracks.
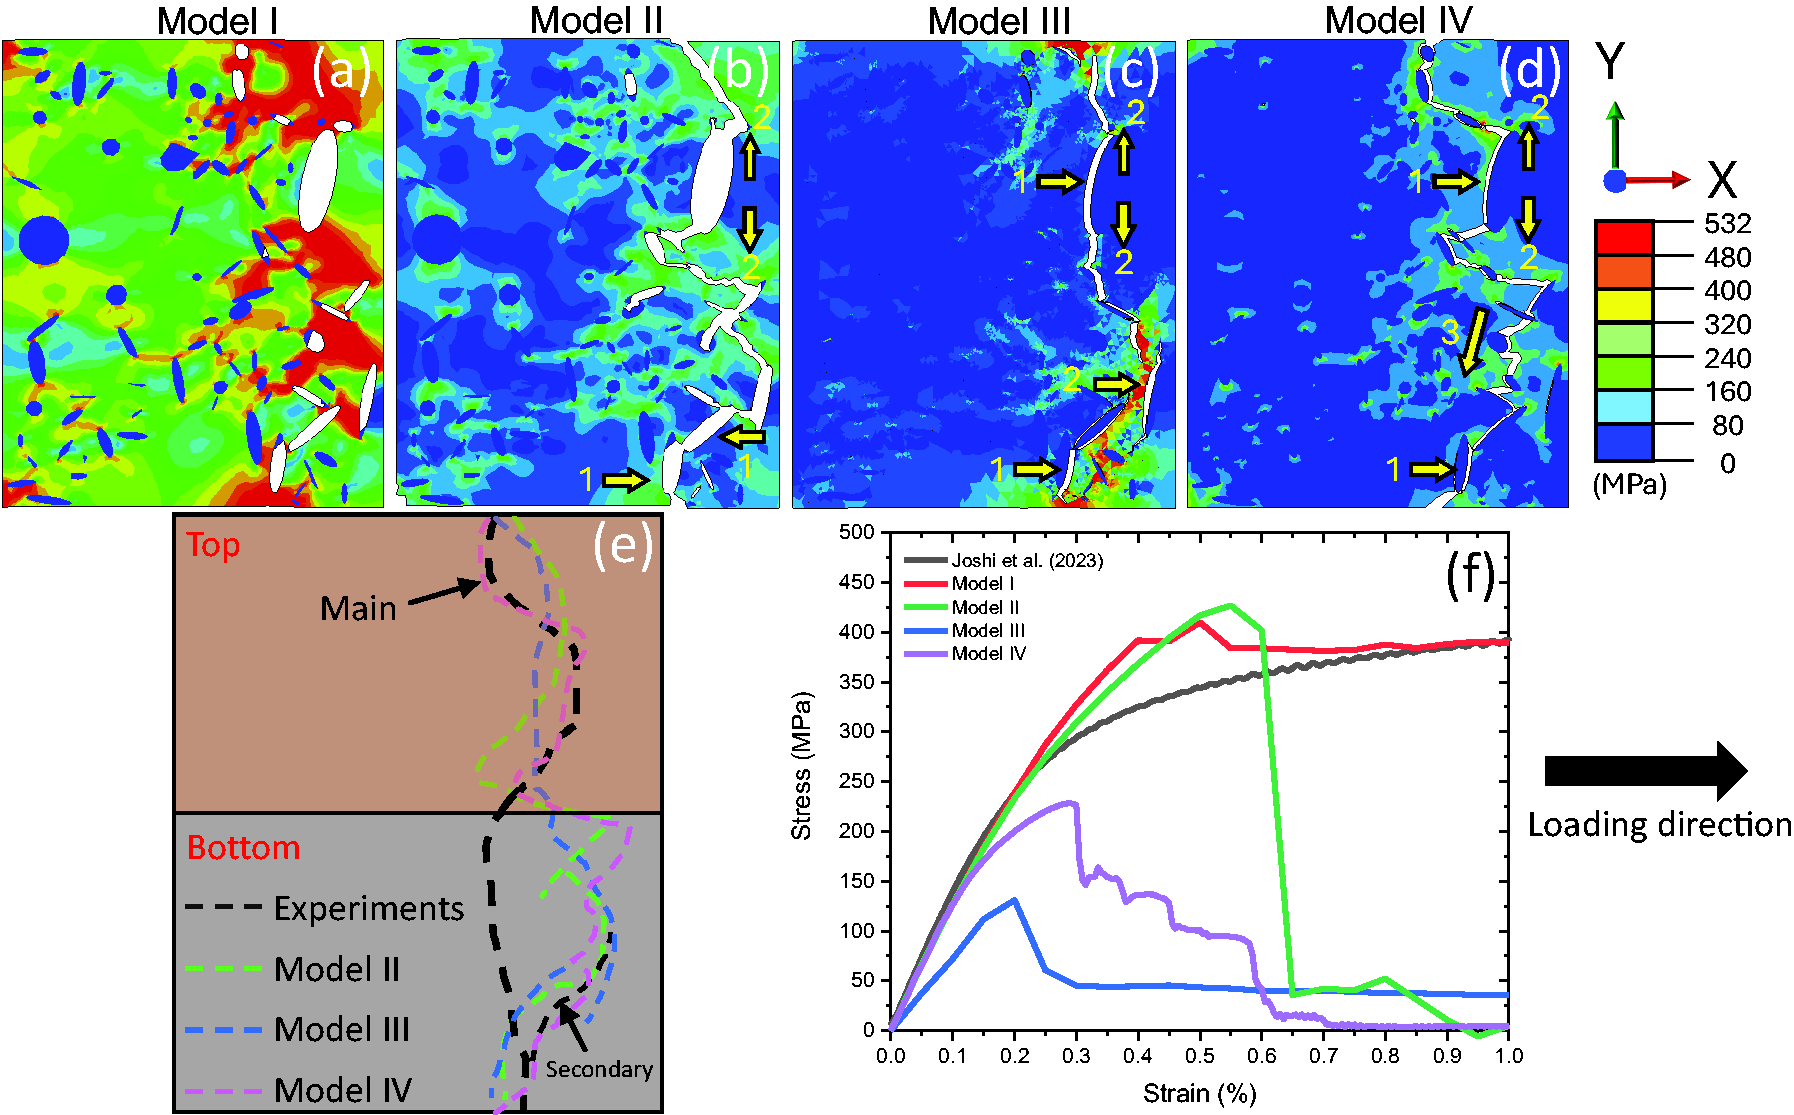
Evolution of von Mises stress distribution and crack path under tensile loading in different models of RVE: (a) Model I; (b) Model II; (c) Model III; (d) Model IV; (e) comparison of experimental and simulated crack paths and (f) stress-strain curves for different damage models. (1 – crack-initiation point; 2 – beginning of crack propagation; 3 – end of crack propagation).
As the damage advanced, the effective load-bearing area of the material decreased, and the potential crack path became more defined. Since Model I did not utilise the damage criteria in the matrix, it could not capture the crack propagation adequately. However, the regions of stress concentration reflected the direction of crack expansion. This provides a robust approach to achieving crack predictions in a model with lower computational demands, making it effectively applicable to machine-learning approaches. Model II was an upgraded version of Model I, incorporating the JC damage model in the matrix, and could be used to predict crack initiation and propagation. Models III and IV not only aimed to predict the crack paths but also intended to forecast the interface debonding. The stress-strain curves for the four different damage methods are shown in Figure 11(f). The best fit with the experiments was achieved by Model I (red curve), followed by Model II (green curve), and then by Model IV (purple curve). Model III (blue) deviated most from the experiment data. This can be explained by the fact that the connection of cohesive elements to solid-element edges could lead to a decrease in the overall stiffness. Models I and II exhibited a high degree of alignment with experimental data in the elastic phase of the material. Also, Model I required the lowest computational efforts and demonstrated the closest alignment with the experimental curve among the four models. However, it fell short in predicting the crack path. On the other hand, Model II offered a relatively modest computational demand and delivered a good fit to the experimental curve, along with an excellent capacity to predict the crack path. In contrast, the cohesive damage model demanded substantial computational efforts and yielded a poor fit to the experimental data yet excelled in accurately forecasting the crack path (especially, graphite interface debonding). Besides, Model IV was the best method to exactly predict the crack path; however, it required a significant amount of computational cost, and it did not properly reproduce the global deformational behaviour. A summary of the advantages and disadvantages of the four models is provided in Table 6.
Comparison of model advantages and disadvantages.
L – low; M – medium; H - high VH - very high.
Crack evolution using JC and cohesive damage model
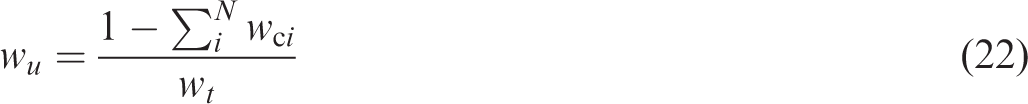
Crack evolution in each graphite inclusion was further analysed to evaluate the effect of different damage models on the characteristics of fracture propagation (Figure 12). The uncracked ligament of the CGI sample was calculated as
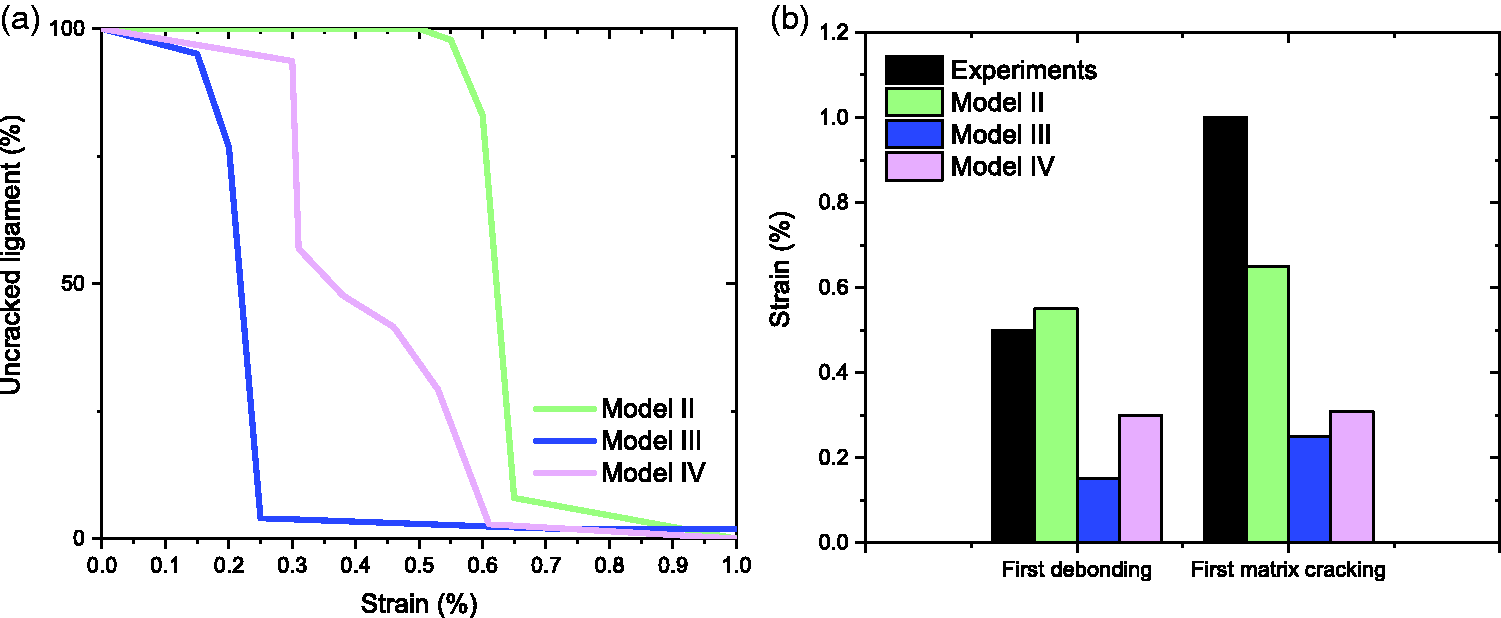
Analysis of crack growth with different damage models: (a) uncracked ligament and (b) crack-initiation and -propagation strains.
In general, the initiation of cracks began with graphite-interface debonding where the local strain energy was higher, and then the crack propagated into the matrix (Nguyen, 2014). This phenomenon was verified by other researchers (Qiu et al., 2016b; Zhang et al., 2018). The effect of different damage methods on the evolution of the uncracked ligaments is shown in Figure 12(a). Apparently, it was easier for the crack to initiate and propagate into the matrix in the cohesive damage model. The crack-propagation rate was similar compared to Models II and III. It is also noted that the cohesive model exhibited discontinuous cracks, which resulted in the uncracked ligament not reaching zero. The crack-propagation rate of Model IV was lower than in other models, exhibiting three distinct phases: an initial gradual decrease (interface debonding), followed by a rapid decline (matrix cracking), and ultimately transitioning to a swift descent (crack coalescence).
The detailed crack-propagation results are summarised in Figure 12(b). It indicates that the initial crack debonding in the JC damage model occurred at approximately 0.55% strain, followed by the first instance of matrix cracking at roughly 0.65% strain. However, in Model III, the maximum stress occurred at a strain of 0.2%. The first occurrence of interface debonding happened at a strain of 0.15%, while the initial crack propagation into the matrix was observed at a strain of 0.25%. Model IV is in between Models II and III. Previous studies (Qiu et al., 2016b) reported the strain at interface debonding to be around 0.5% and the strain at matrix cracking around 1%. Model II demonstrated a better agreement with the experimental results compared to the CZM. Hence, Model II would be a better option to predict the crack path.
Effect of graphite particle spacing
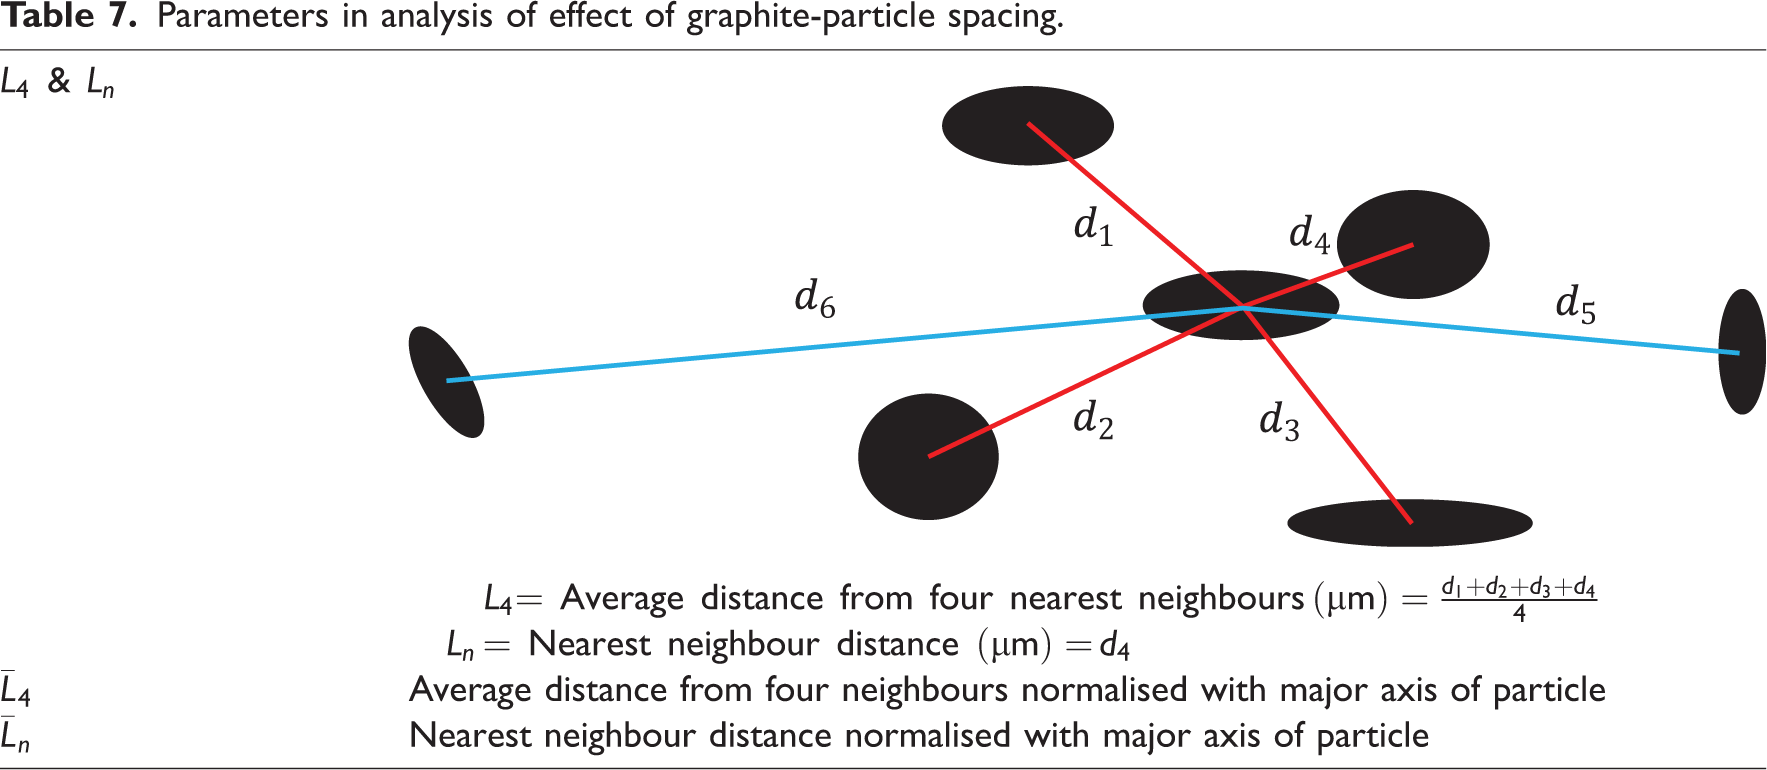
The effect of graphite-particle spacing is discussed in this section. To this aim, the average distance of each particle from its four neighbours (
Parameters in analysis of effect of graphite-particle spacing.
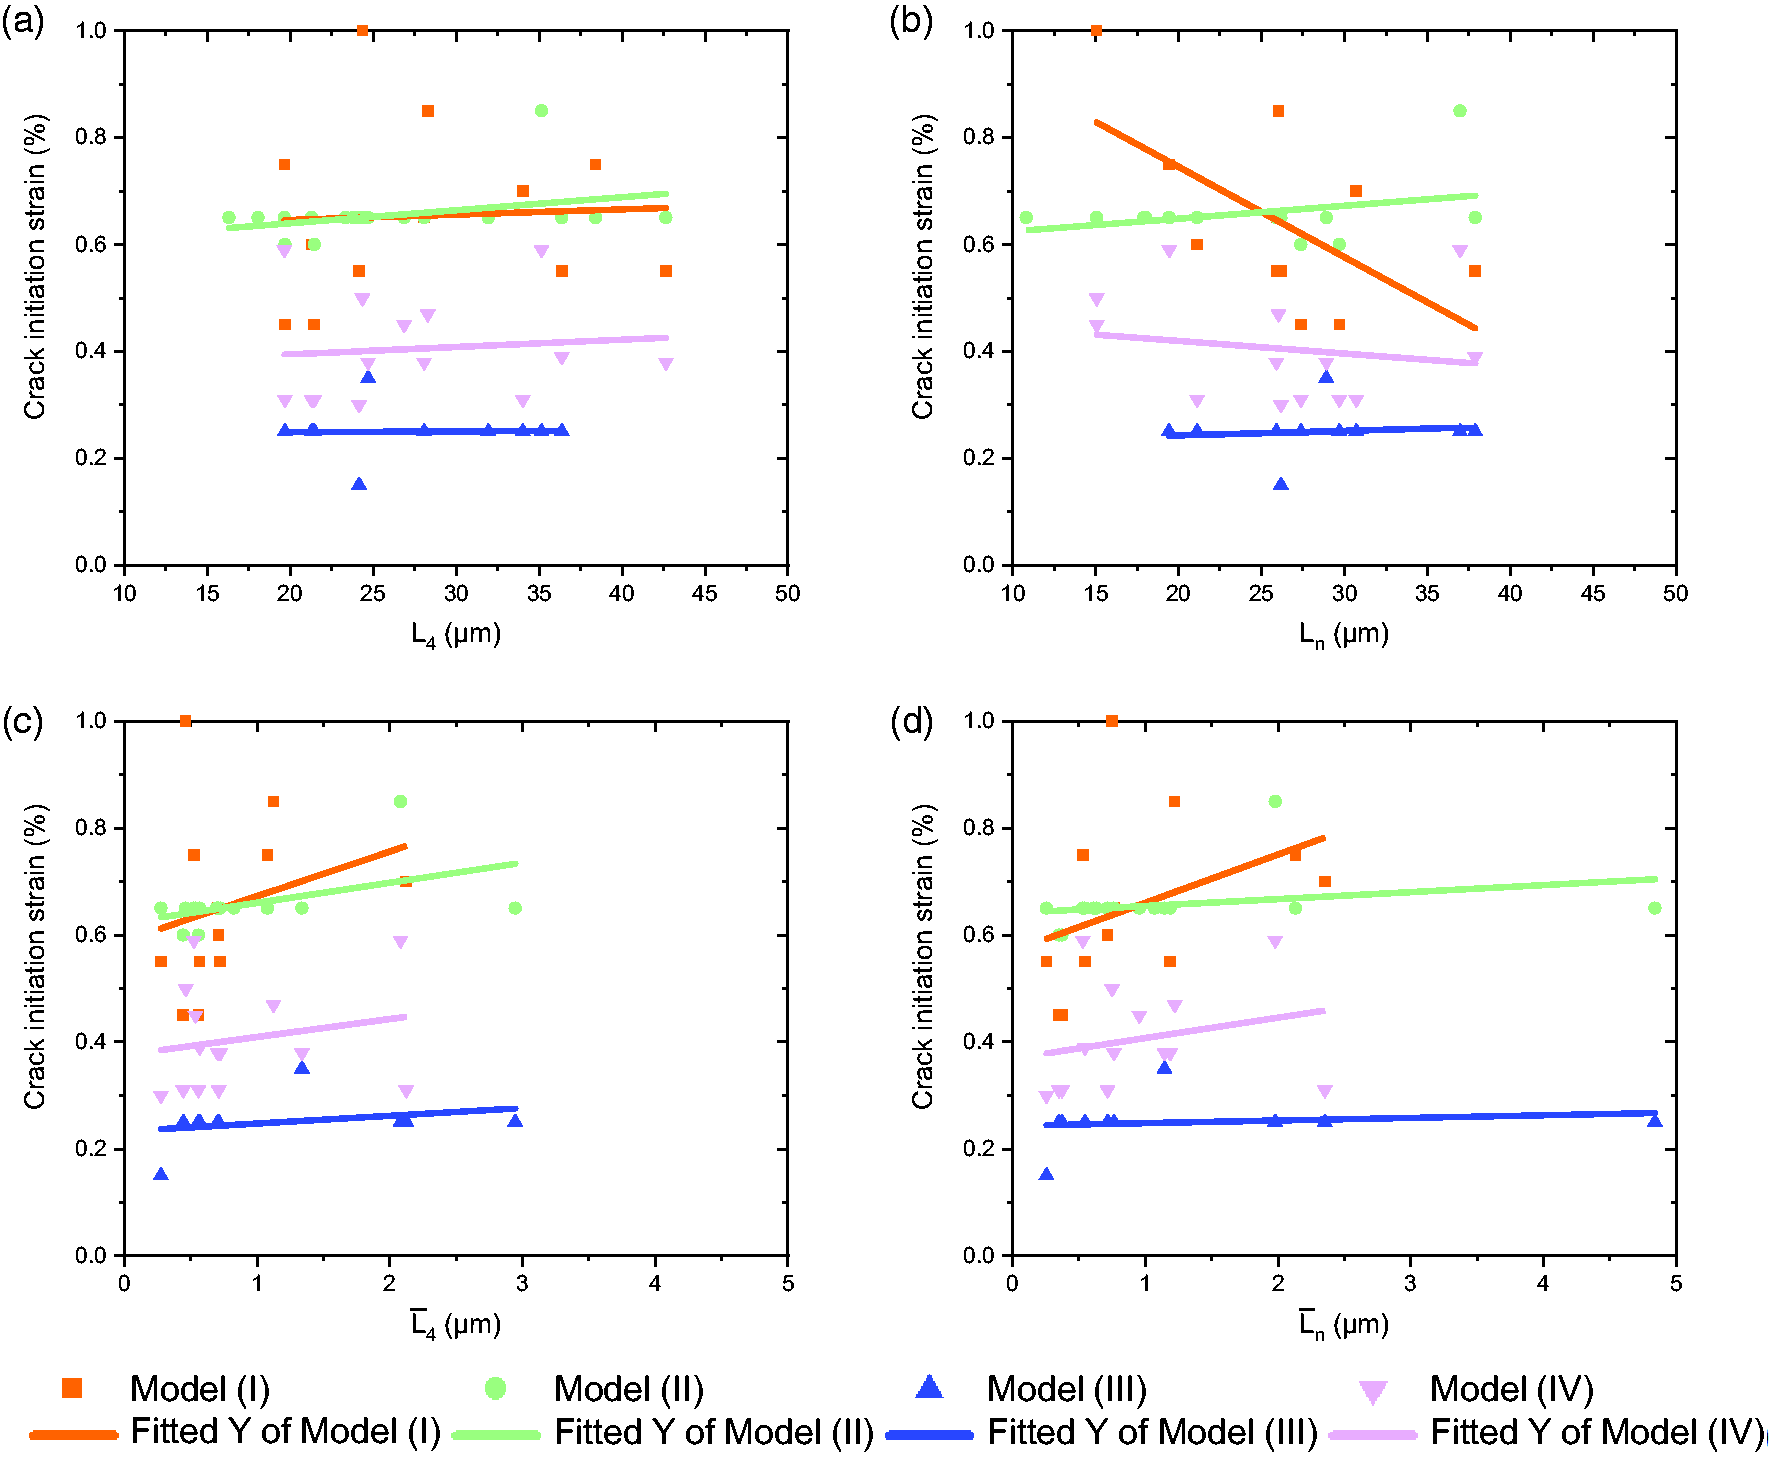
Crack-initiation strain for four different models for damaged graphite particles: (a, b) without considering size effect and (c, d) considering size effect.
The dependence of the crack-initiation strain on these quantities is plotted in Figure 13; data points represent the strain, at which cracks initiated in different graphite particles. It can be observed that cracks predominantly initiated at distances of 15–45 µm (Figures 13(a) and (b)). In general, the data from Models I and II closely align with experimental findings, as the experiments conducted by Qiu et al. (2016b) and our in situ experiments, revealed crack initiation at strains of 0.6%–1%. However, Models III and IV exhibited poor predictions in terms of crack-initiation strain, occurring at 0.2%–0.3% and 0.3–0.45%, respectively (see Figure 13(a)). It is noteworthy that Models I and IV showed an increase in the crack-initiation strain with an increase in distance between graphite particles (Figure 13(b)). Therefore, the size effect should be considered in terms of the normalised quantities
Conclusions
In this paper, four different damage models with realistic and simplified microstructural morphologies were compared in numerical simulations of CGI. Their crack-propagation prediction capabilities were benchmarked against in situ SEM tensile test of CGI specimens at room temperature. Based on the experimental results and model analysis, the tensile fracture mechanisms of CGI as well as crack initiation and propagation were investigated, and the following conclusions can be drawn:
The JC damage model required a relatively low computational cost while providing a strong fit to the experimental data, along with very good predictive capabilities for crack initiation and propagation. The cohesive model demonstrated accurate predictions of crack propagation (especially, graphite interface debonding) but exhibited a subpar fit with experimental engineering stress-strain curves and incurred high computational costs. Employing PBCs in the current modelling configuration, a better match with experimental data was achieved. Cracks consistently initiated at the tips of vermicular graphite particles; the closer the distance between these tips, the more pronounced the stress concentration became. Considering the size effect of graphite particles is important for an adequate analysis of the fracture behaviour of materials. These four methods can also be effectively used in simulations of other metal matrix composites.
Footnotes
Acknowledgements
The authors are grateful to Ms Dawn Spencer (Loughborough University, UK) for the specimen preparation.
Declaration of conflicting interests
The author(s) declared no potential conflicts of interest with respect to the research, authorship, and/or publication of this article.
Funding
The author(s) disclosed receipt of the following financial support for the research, authorship, and/or publication of this article: The authors gratefully acknowledge the financial support provided by the Henry Royce Institute in the UK. This research was funded by the China Scholarship Council (CSC) (Contract No. 202208060383).